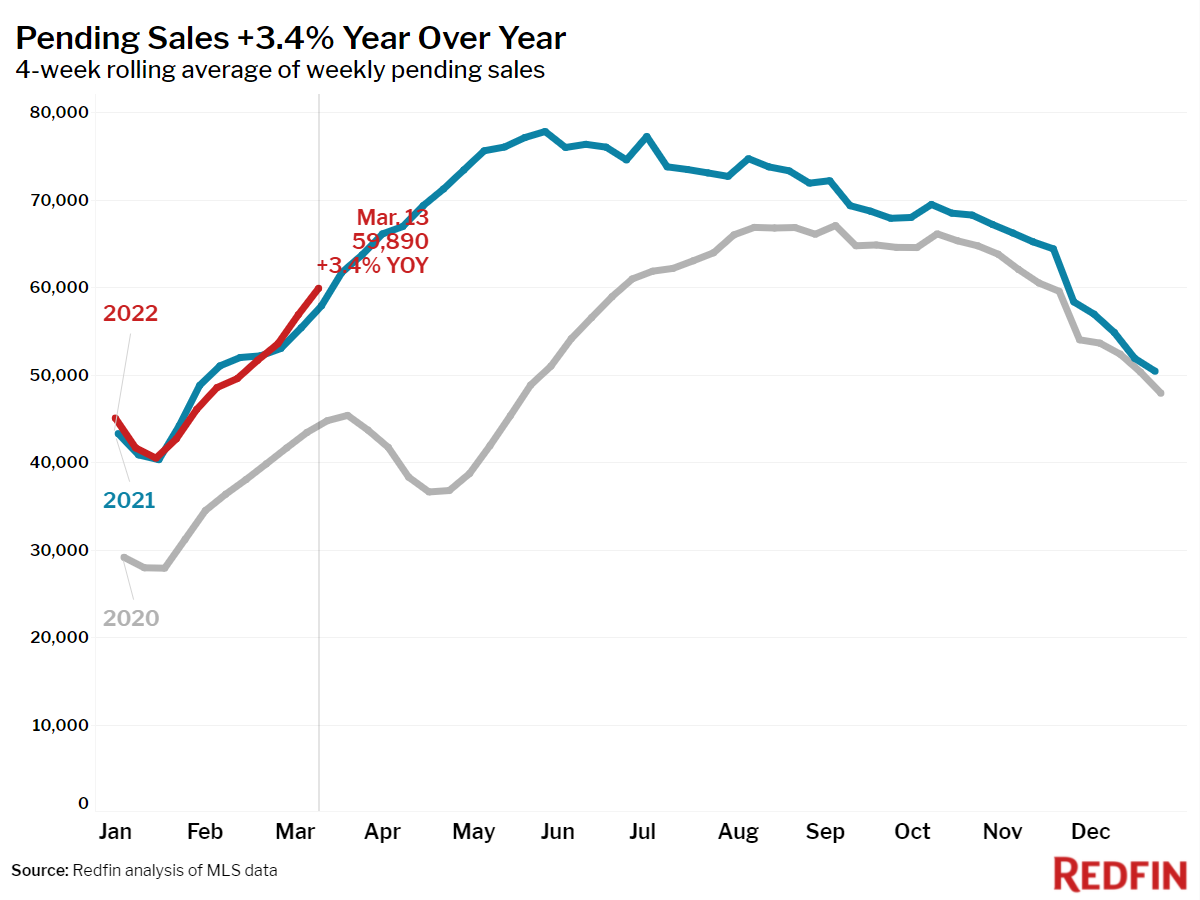
Pending home sales continued to outpace 2021 even as the listing shortage dragged on and mortgage rates shot up to above 4% for the first time since May 2019.
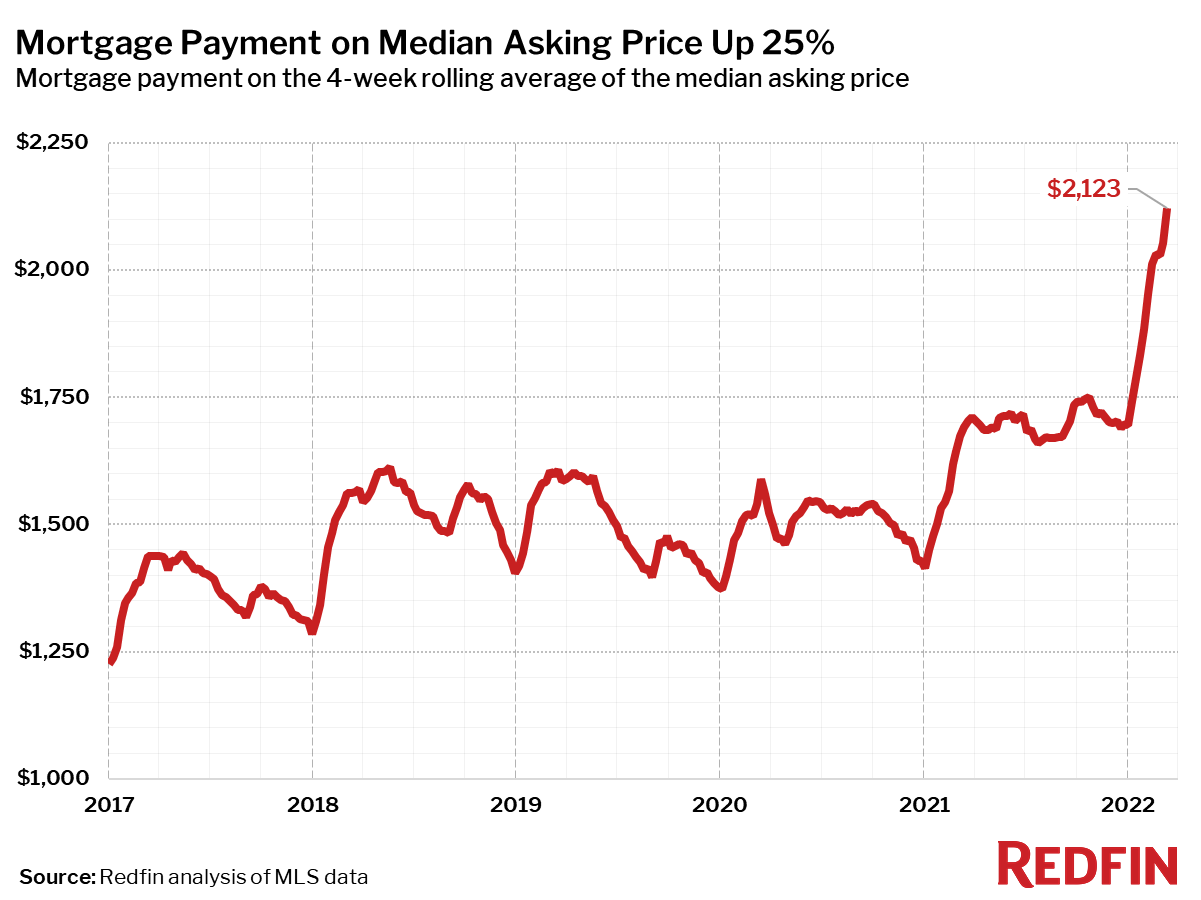
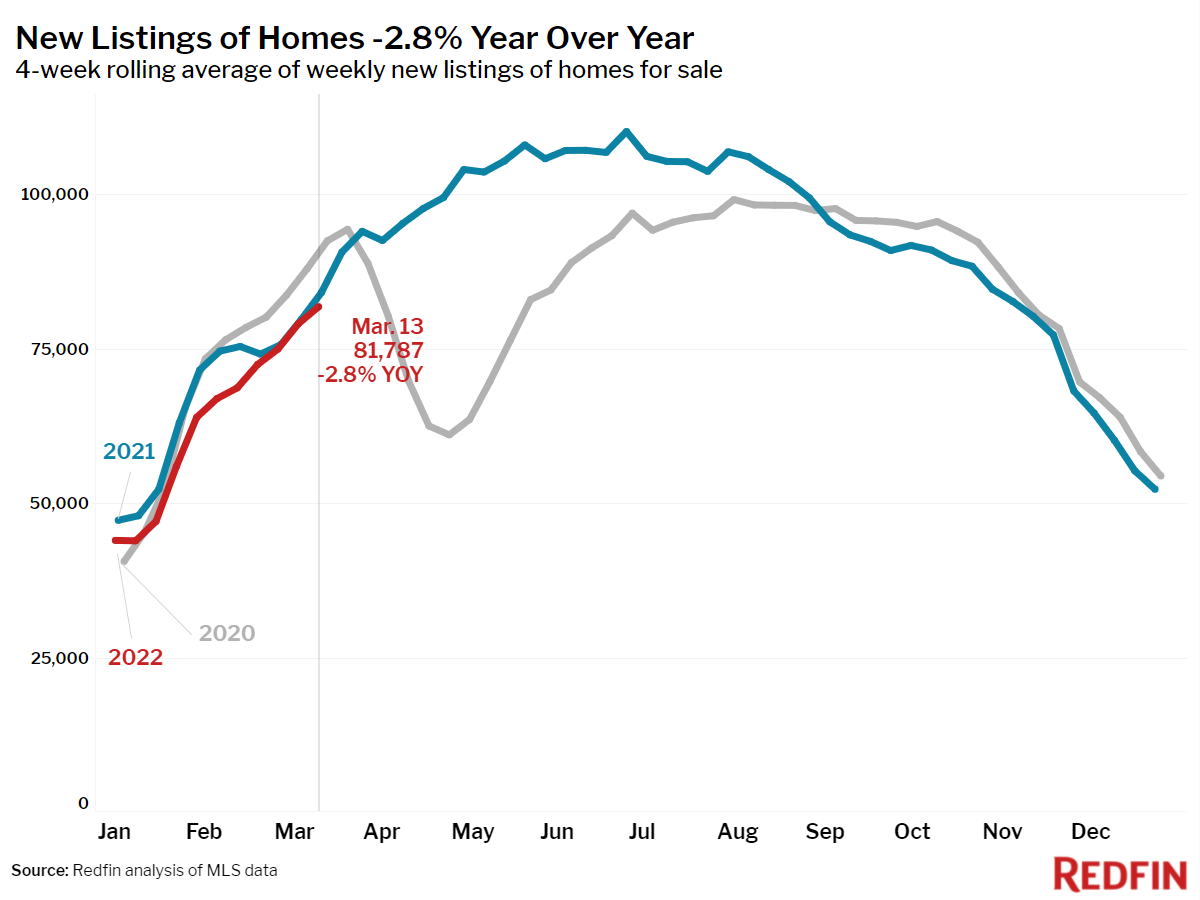
The U.S. median home sale price surged 7% during the four-week period ending March 13—the largest month-over-month increase on record in Redfin’s data, which goes back through 2017. With mortgage rates also soaring, the typical homebuyer’s monthly payment reached a new high of $2,123. That’s more than $530 more than the typical pre-pandemic homebuyer is paying. Pending sales climbed 3% year over year, despite new listings shrinking at the same rate.
“There are plenty of reasons to be worried about the economy, but demand for housing has so far remained strong,” said Redfin Chief Economist Daryl Fairweather. “Consumers continue to spend on housing even though gas prices are on the rise and supply-chain interruptions may lead to even more inflation. Homebuyers are betting that even as the economy twists and turns, owning a home will be a worthwhile investment. As mortgage rates continue to shoot up from historic lows at an unprecedented pace, they could prove to be the one force that can slow homebuying demand in the spring.”
Key housing market takeaways for 400+ U.S. metro areas:
Unless otherwise noted, the data in this report covers the four-week period ending March 13. Redfin’s housing market data goes back through 2012.
Data based on homes listed and/or sold during the period:
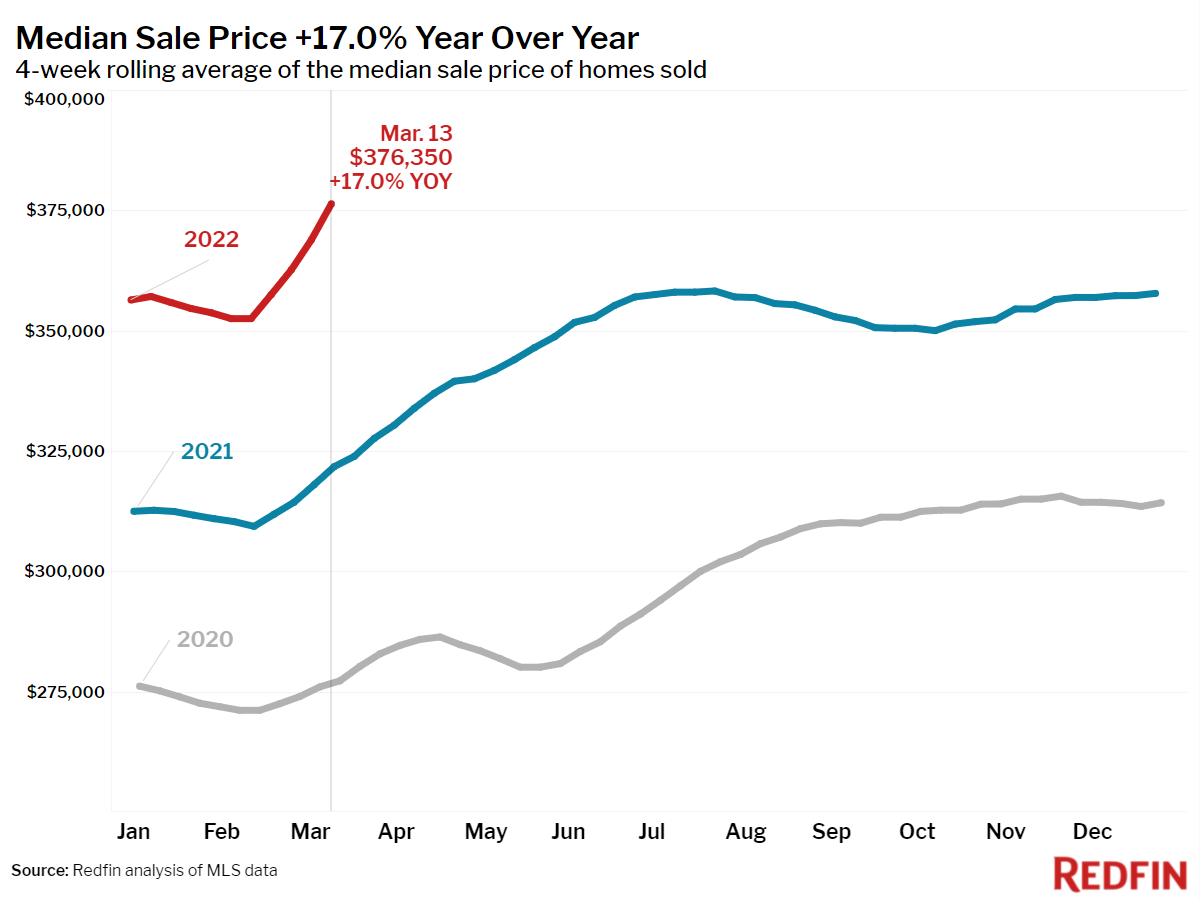
- The median home sale price was up 17% year over year to a record high of $376,350, and up 36% from the same time in 2020. Prices were up 7% from 4 weeks prior, the largest 4-week increase on record.
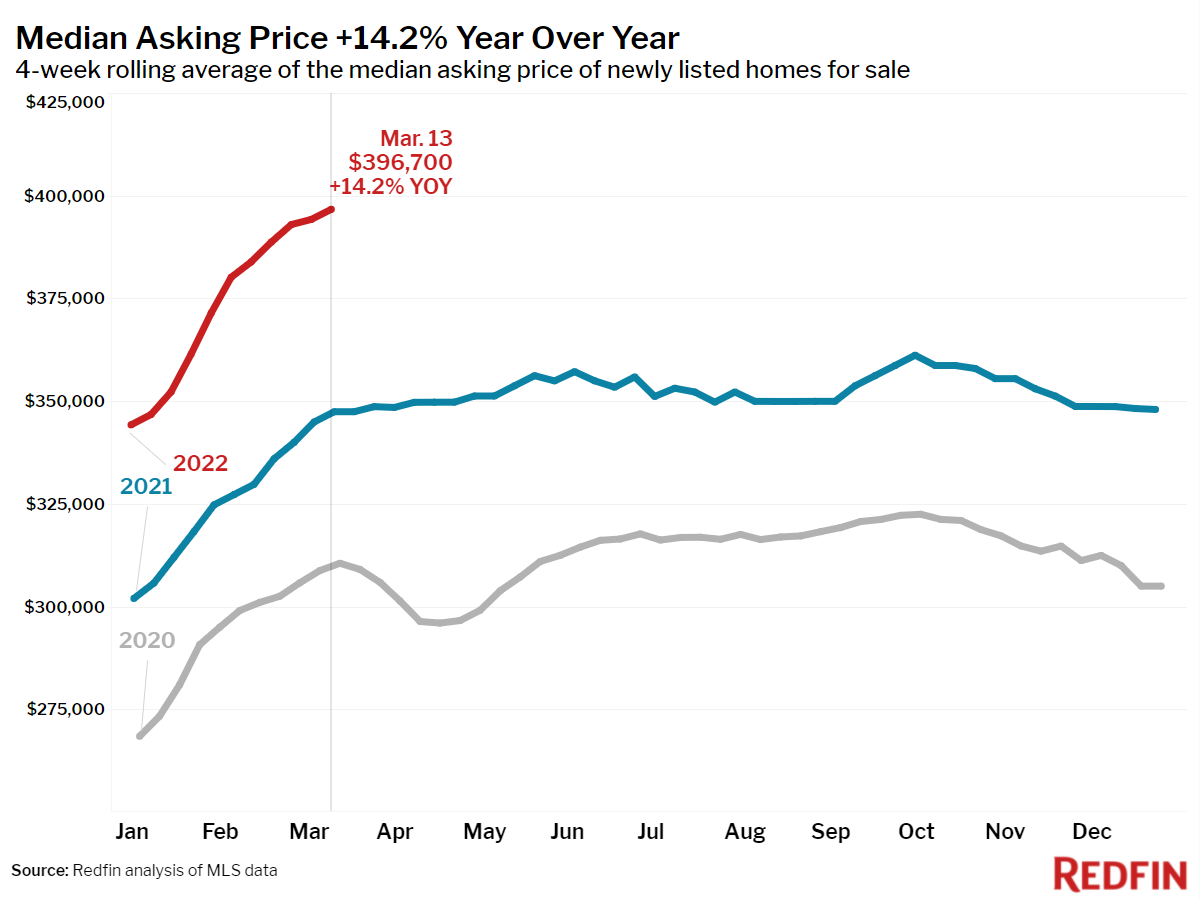
- The median asking price of newly listed homes increased 14% year over year to an all-time high of $396,700, and rose 28% from the same time in 2020.
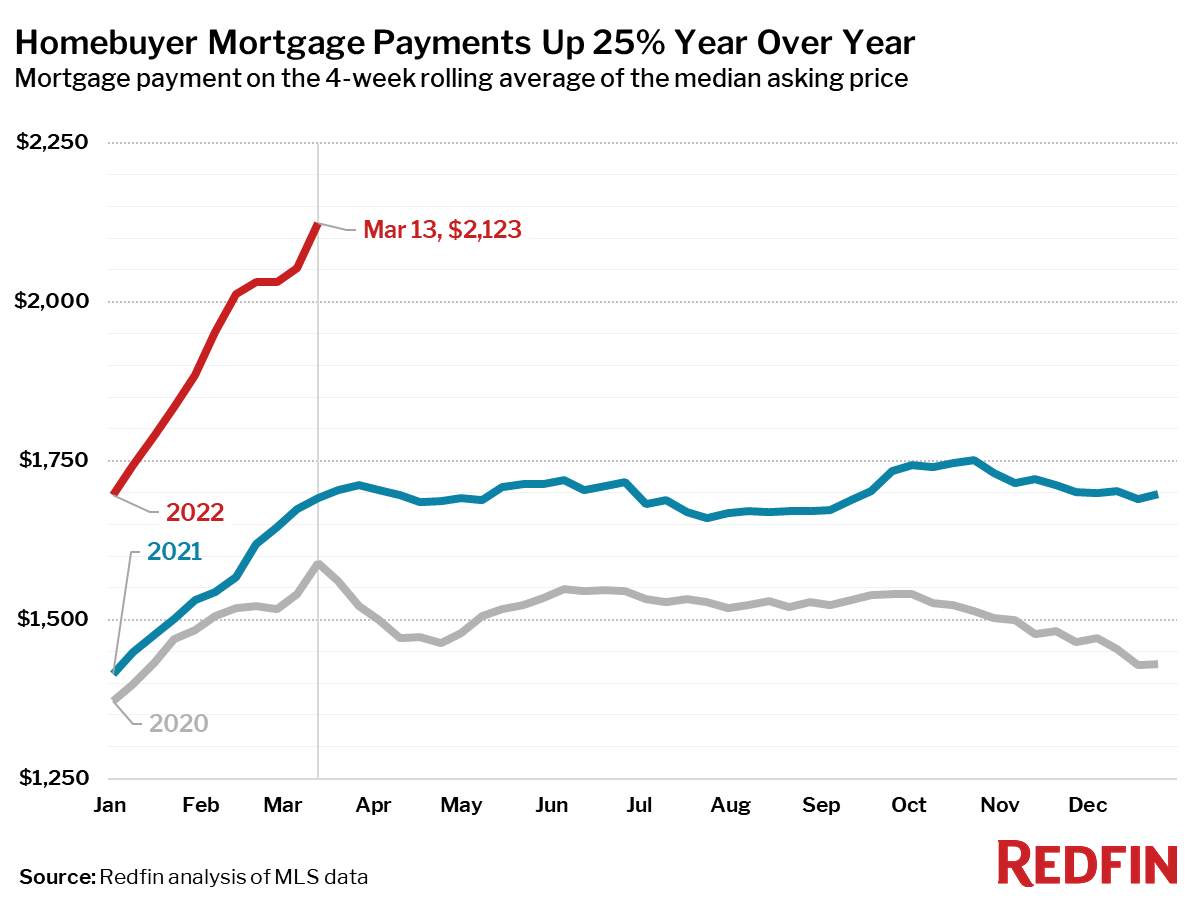
- The monthly mortgage payment on the median asking price home rose to a record high of $2,123 at the current 4.16% mortgage rate. This was up 25% from a year earlier, when mortgage rates were 3.09%, and up 34% from the same period in 2020, when rates were 3.65%.
- Pending home sales were up 3% year over year and up 33% from the same period in 2020, just prior to the start of the pandemic.
- New listings of homes for sale were down 3% from a year earlier. Compared to 2020, new listings were down 12%.
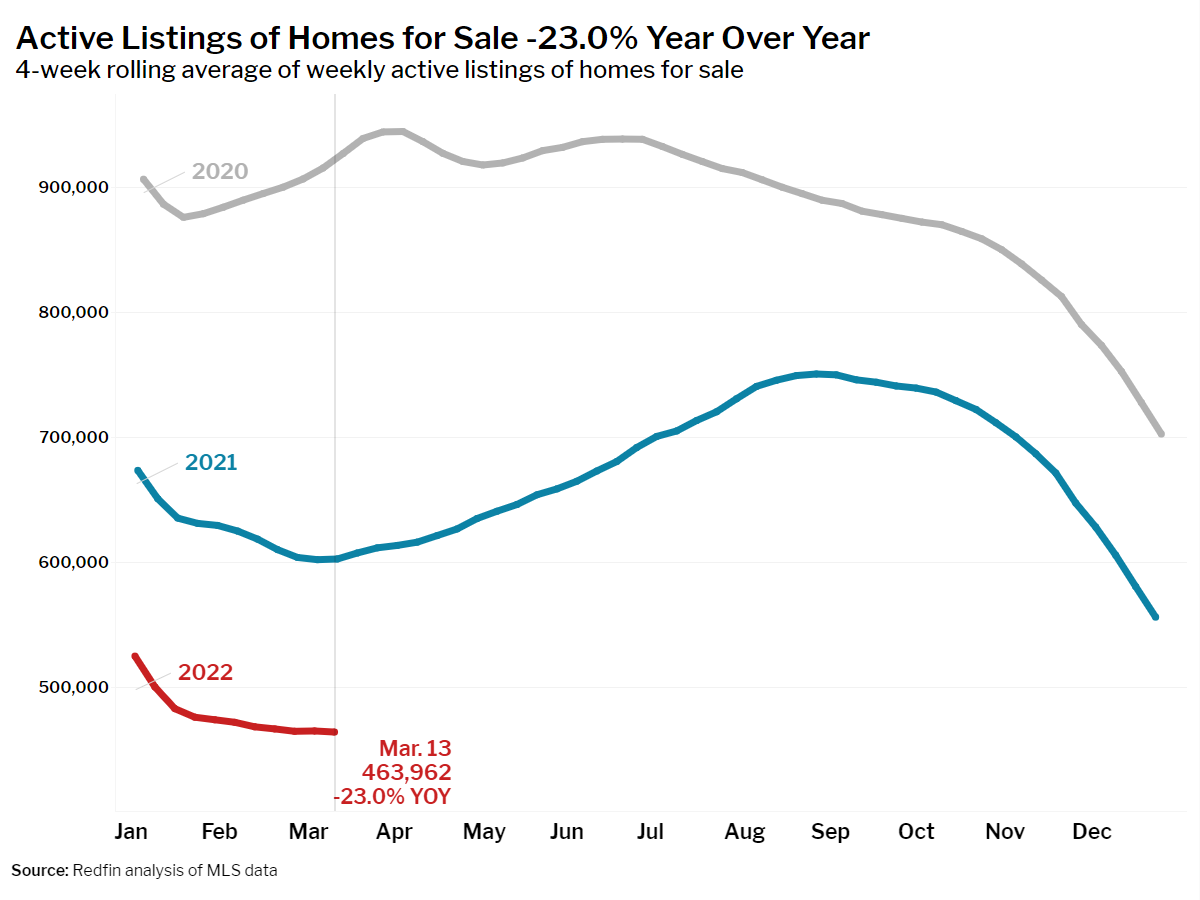
- Active listings (the number of homes listed for sale at any point during the period) fell 23% year over year, dropping to an all-time low of 464,000. Listings were down 50% from the same period in 2020.
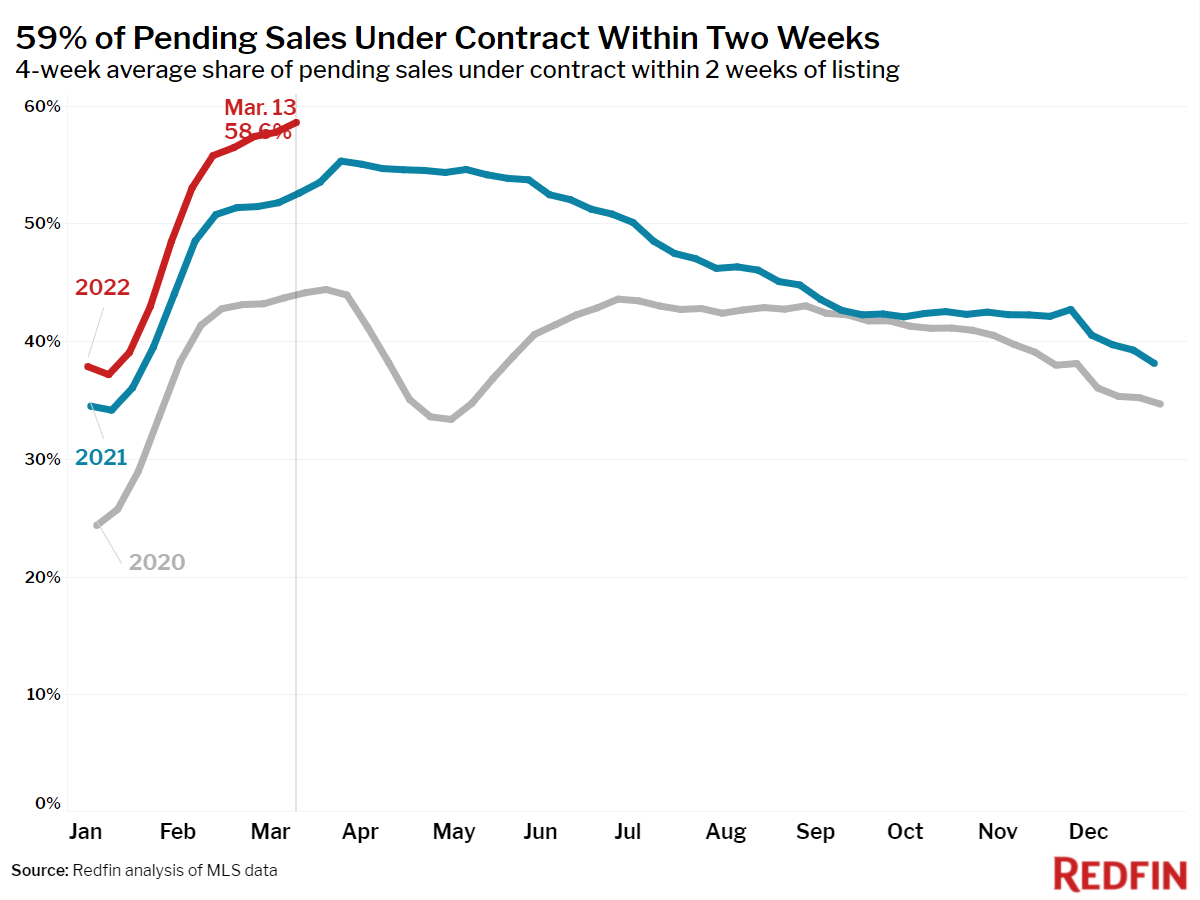
- 59% of homes that went under contract had an accepted offer within the first two weeks on the market, an all-time high. This was up from the 53% rate of a year earlier and 44% in 2020.
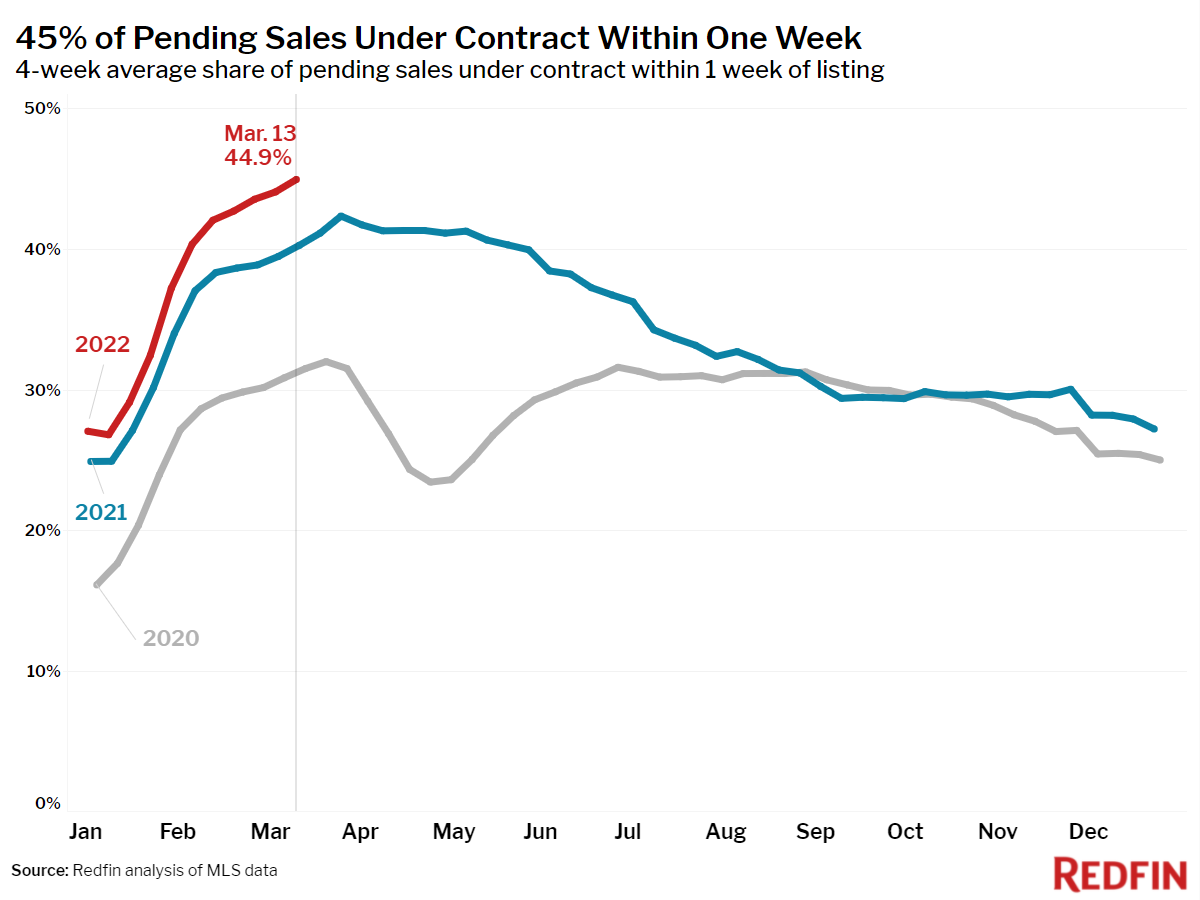
- 45% of homes that went under contract had an accepted offer within one week of hitting the market, an all-time high. This was up from 40% during the same period a year earlier and 32% in 2020.
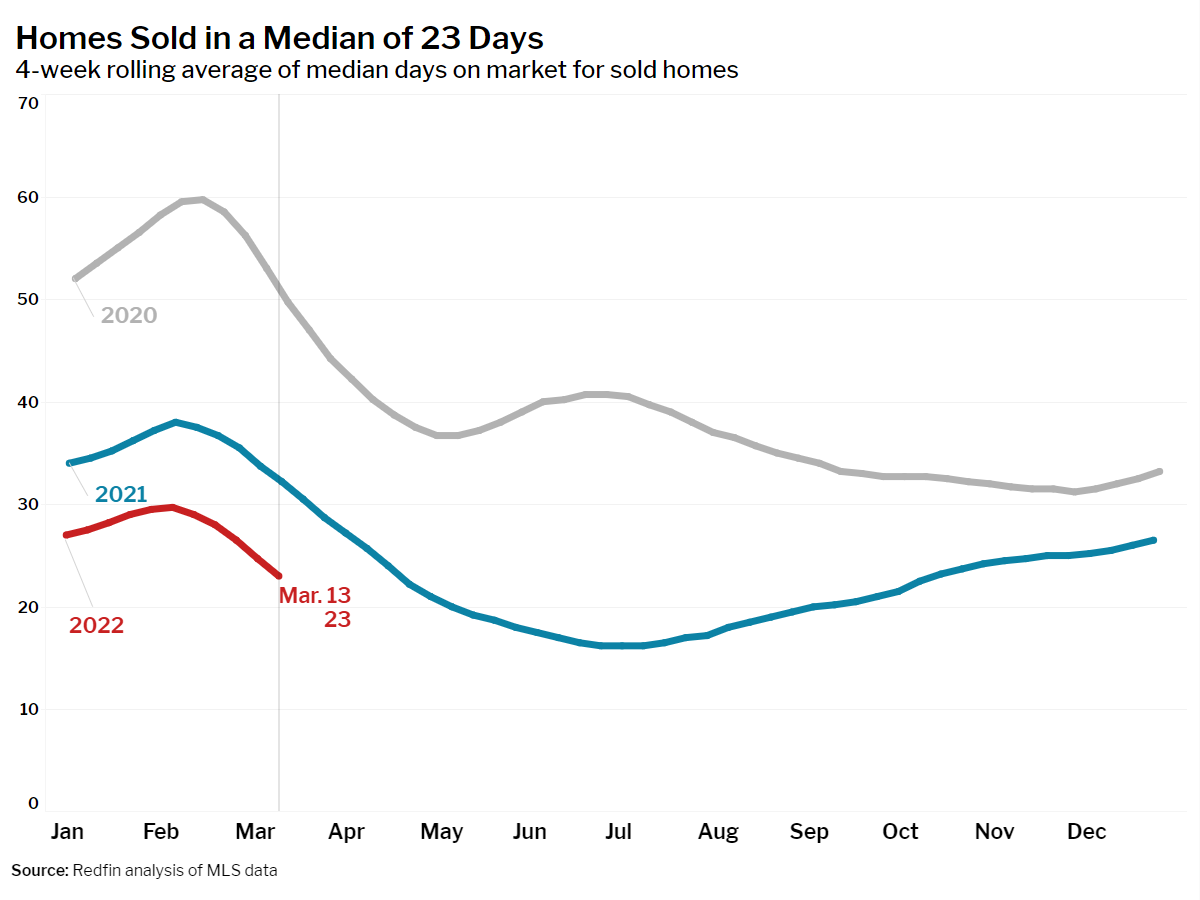
- Homes that sold were on the market for a median of 23 days, down from 32 days a year earlier and 50 days in 2020.
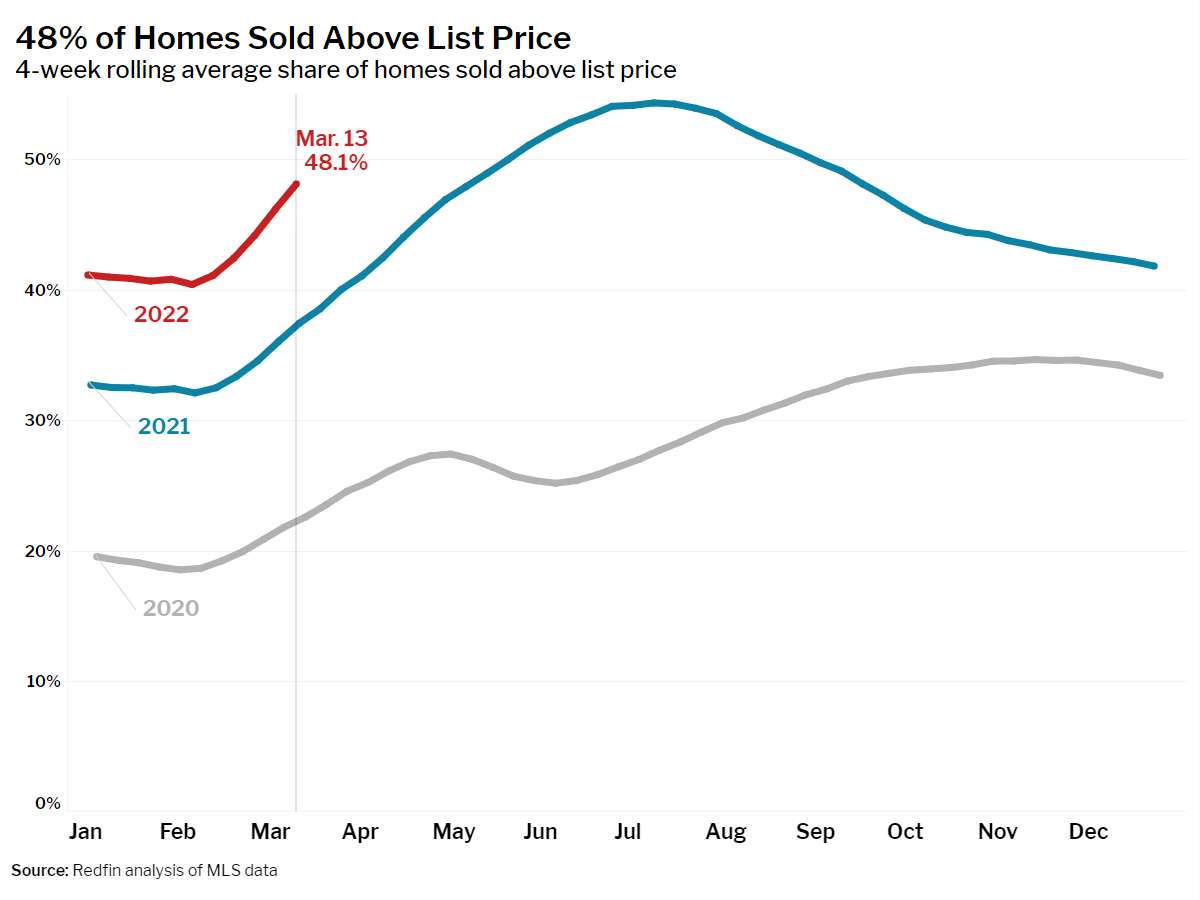
- 48% of homes sold above list price, up from 37% a year earlier and 23% in 2020.
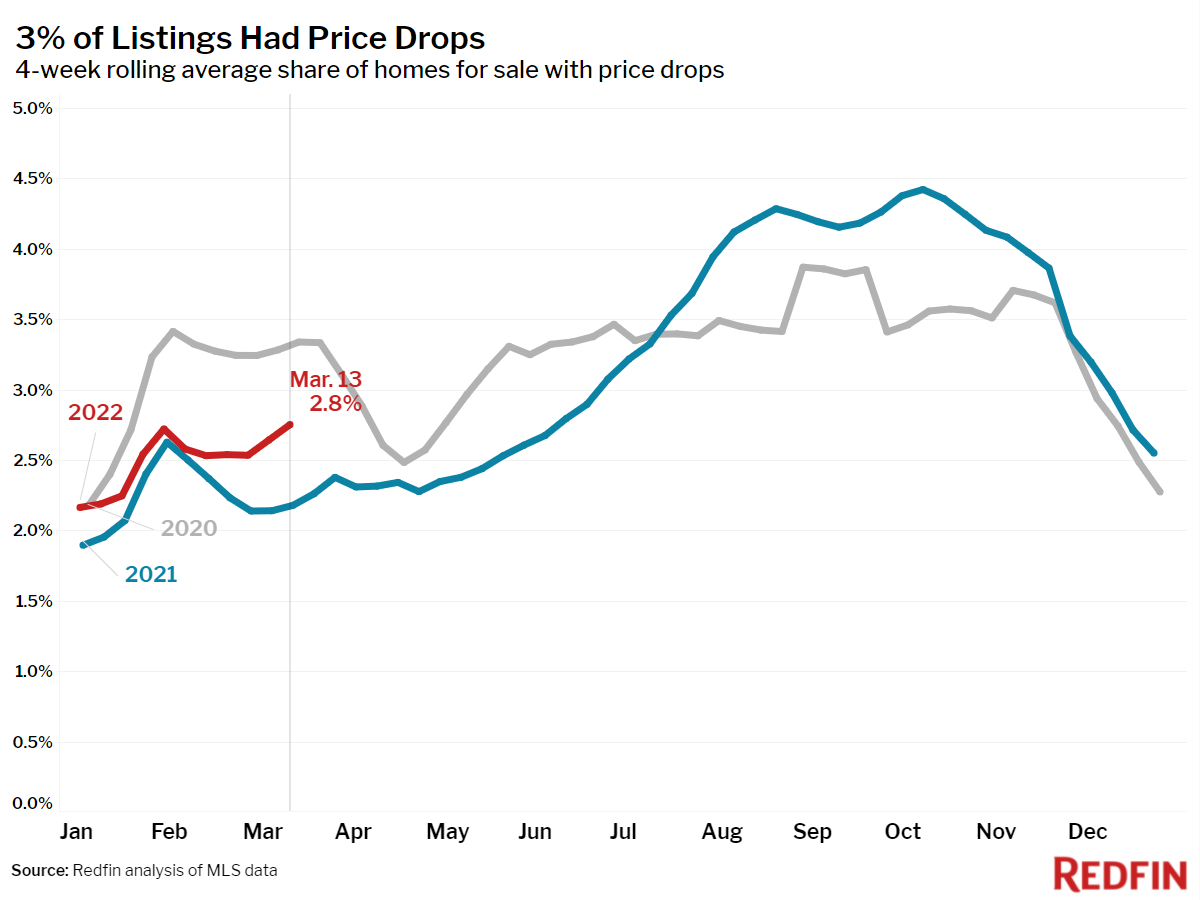
- On average, 2.8% of homes for sale each week had a price drop, up 0.6 percentage points from the same time in 2021, but down 0.6 percentage points from 2020.
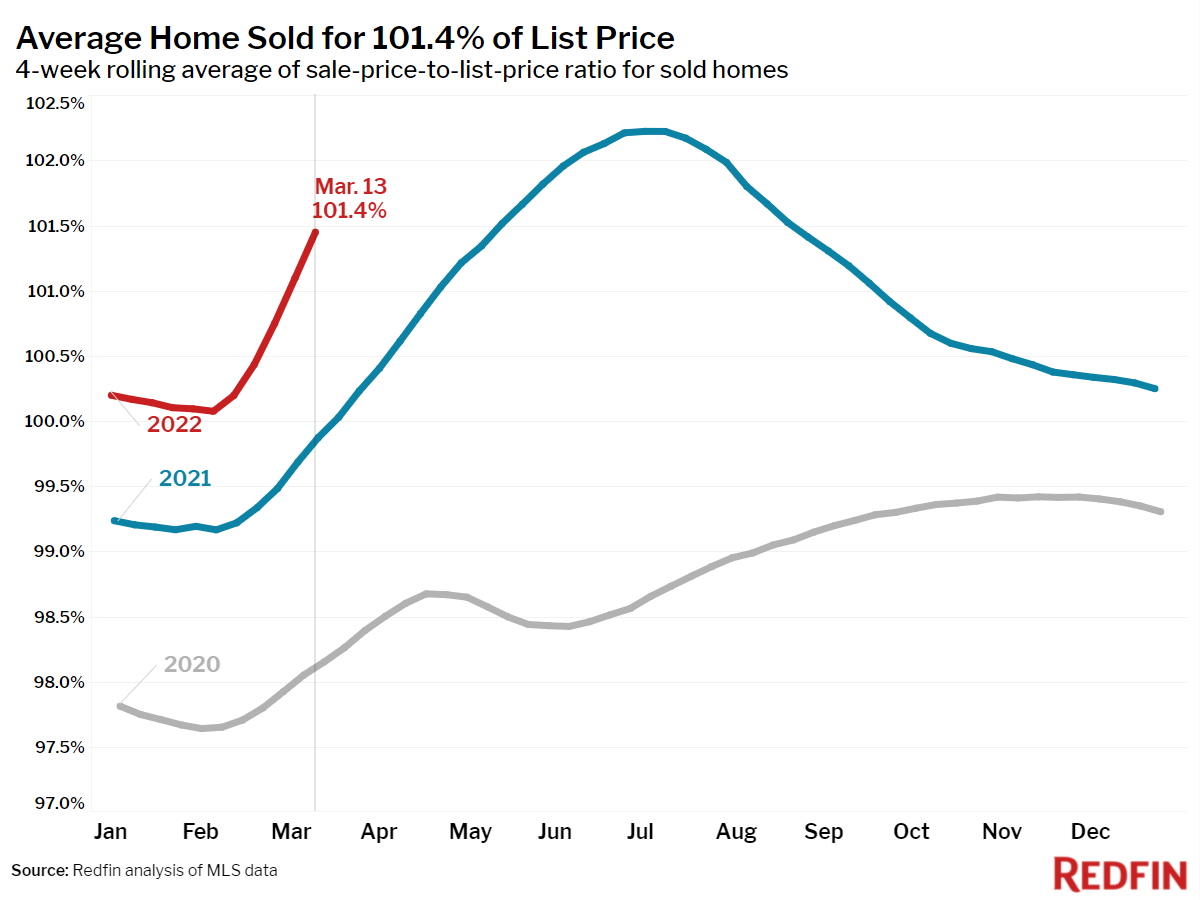
- The average sale-to-list price ratio, which measures how close homes are selling to their asking prices, rose to 101.4%. In other words, the average home sold for 1.4% above its asking price. This was up from 99.9% in 2021 and 98.2% in 2020.
Other leading indicators of homebuying activity:
- Mortgage purchase applications increased 1% week over week (seasonally adjusted) during the week ending March 11.
- For the week ending March 17, 30-year mortgage rates rose to 4.16%—the highest level since April 2019. This was up from 3.85% the prior week.
- Touring activity from the first week of January through March 13 was 13 percentage points behind the same period in 2021 and 4 points behind the same period in 2020, according to home tour technology company ShowingTime.
- The Redfin Homebuyer Demand Index rose 1.6% from the previous week during the seven-day period ending March 13 and was up 10% from a year earlier. The seasonally adjusted Redfin Homebuyer Demand Index is a measure of requests for home tours and other home-buying services from Redfin agents.
Refer to our metrics definition page for explanations of all the metrics used in this report.

 United States
 Canada