
Radial Oxygen Loss from Plant Roots—Methods


1
Laboratory of Plant Genetics and Breeding, Graduate School of Bioagricultural Sciences, Nagoya University, Furo-cho, Chikusa, Nagoya 464-8601, Japan
2
Department of Agricultural, Food, Environmental and Animal Sciences, University of Udine, Via delle Scienze 206, 33100 Udine, Italy
3
The Freshwater Biological Laboratory, Department of Biology, University of Copenhagen, Universitetsparken 4, DK2100 Copenhagen, Denmark
4
UWA School of Agriculture and Environment, Faculty of Science, The University of Western Australia, Perth, WA 6009, Australia
*
Author to whom correspondence should be addressed.
Plants 2021, 10(11), 2322; https://doi.org/10.3390/plants10112322
Submission received: 11 October 2021
/
Revised: 26 October 2021
/
Accepted: 26 October 2021
/
Published: 28 October 2021
(This article belongs to the Special Issue Plant–Soil Interactions in Wetlands and Flooded Environments)
Abstract
:In flooded soils, an efficient internal aeration system is essential for root growth and plant survival. Roots of many wetland species form barriers to restrict radial O2 loss (ROL) to the rhizosphere. The formation of such barriers greatly enhances longitudinal O2 diffusion from basal parts towards the root tip, and the barrier also impedes the entry of phytotoxic compounds produced in flooded soils into the root. Nevertheless, ROL from roots is an important source of O2 for rhizosphere oxygenation and the oxidation of toxic compounds. In this paper, we review the methodological aspects for the most widely used techniques for the qualitative visualization and quantitative determination of ROL from roots. Detailed methodological approaches, practical set-ups and examples of ROL from roots with or without barriers to ROL are included. This paper provides practical knowledge relevant to several disciplines, including plant–soil interactions, biogeochemistry and eco-physiological aspects of roots and soil biota.
1. Introduction
During flooding, the gas-filled pore spaces in the soil that normally facilitate O2 diffusion are filled with water and the diffusion of gases (e.g., O2) is highly impeded (diffusion coefficient of O2 in water is 10,000 lower than in air; [1]). The O2 dissolved in soil water or any entrapped air is rapidly consumed by aerobic microorganisms and roots, leading to soil anoxia or severe hypoxia [2,3]. Since O2 is unavailable for radial entry into the root system in flooded conditions, longitudinal O2 transport between shoot and root takes place and is essential for root respiration and plant growth [1,4]. The effectiveness of internal root aeration via longitudinal O2 diffusion depends upon the amount of pore space resistance, the O2 consumption by tissues along the diffusion path, the path length (root length) and the formation of tissue barriers to restrict ROL to the rhizosphere [5]. The formation of barriers to ROL in roots is paramount given its dual benefit of preventing ROL to the reduced rhizosphere (high soil O2 demand can result in high O2 loss from roots, [6]) and the entry into the root of phytotoxic concentrations of substances produced in flooded soils (e.g., Fe2+, [7]).
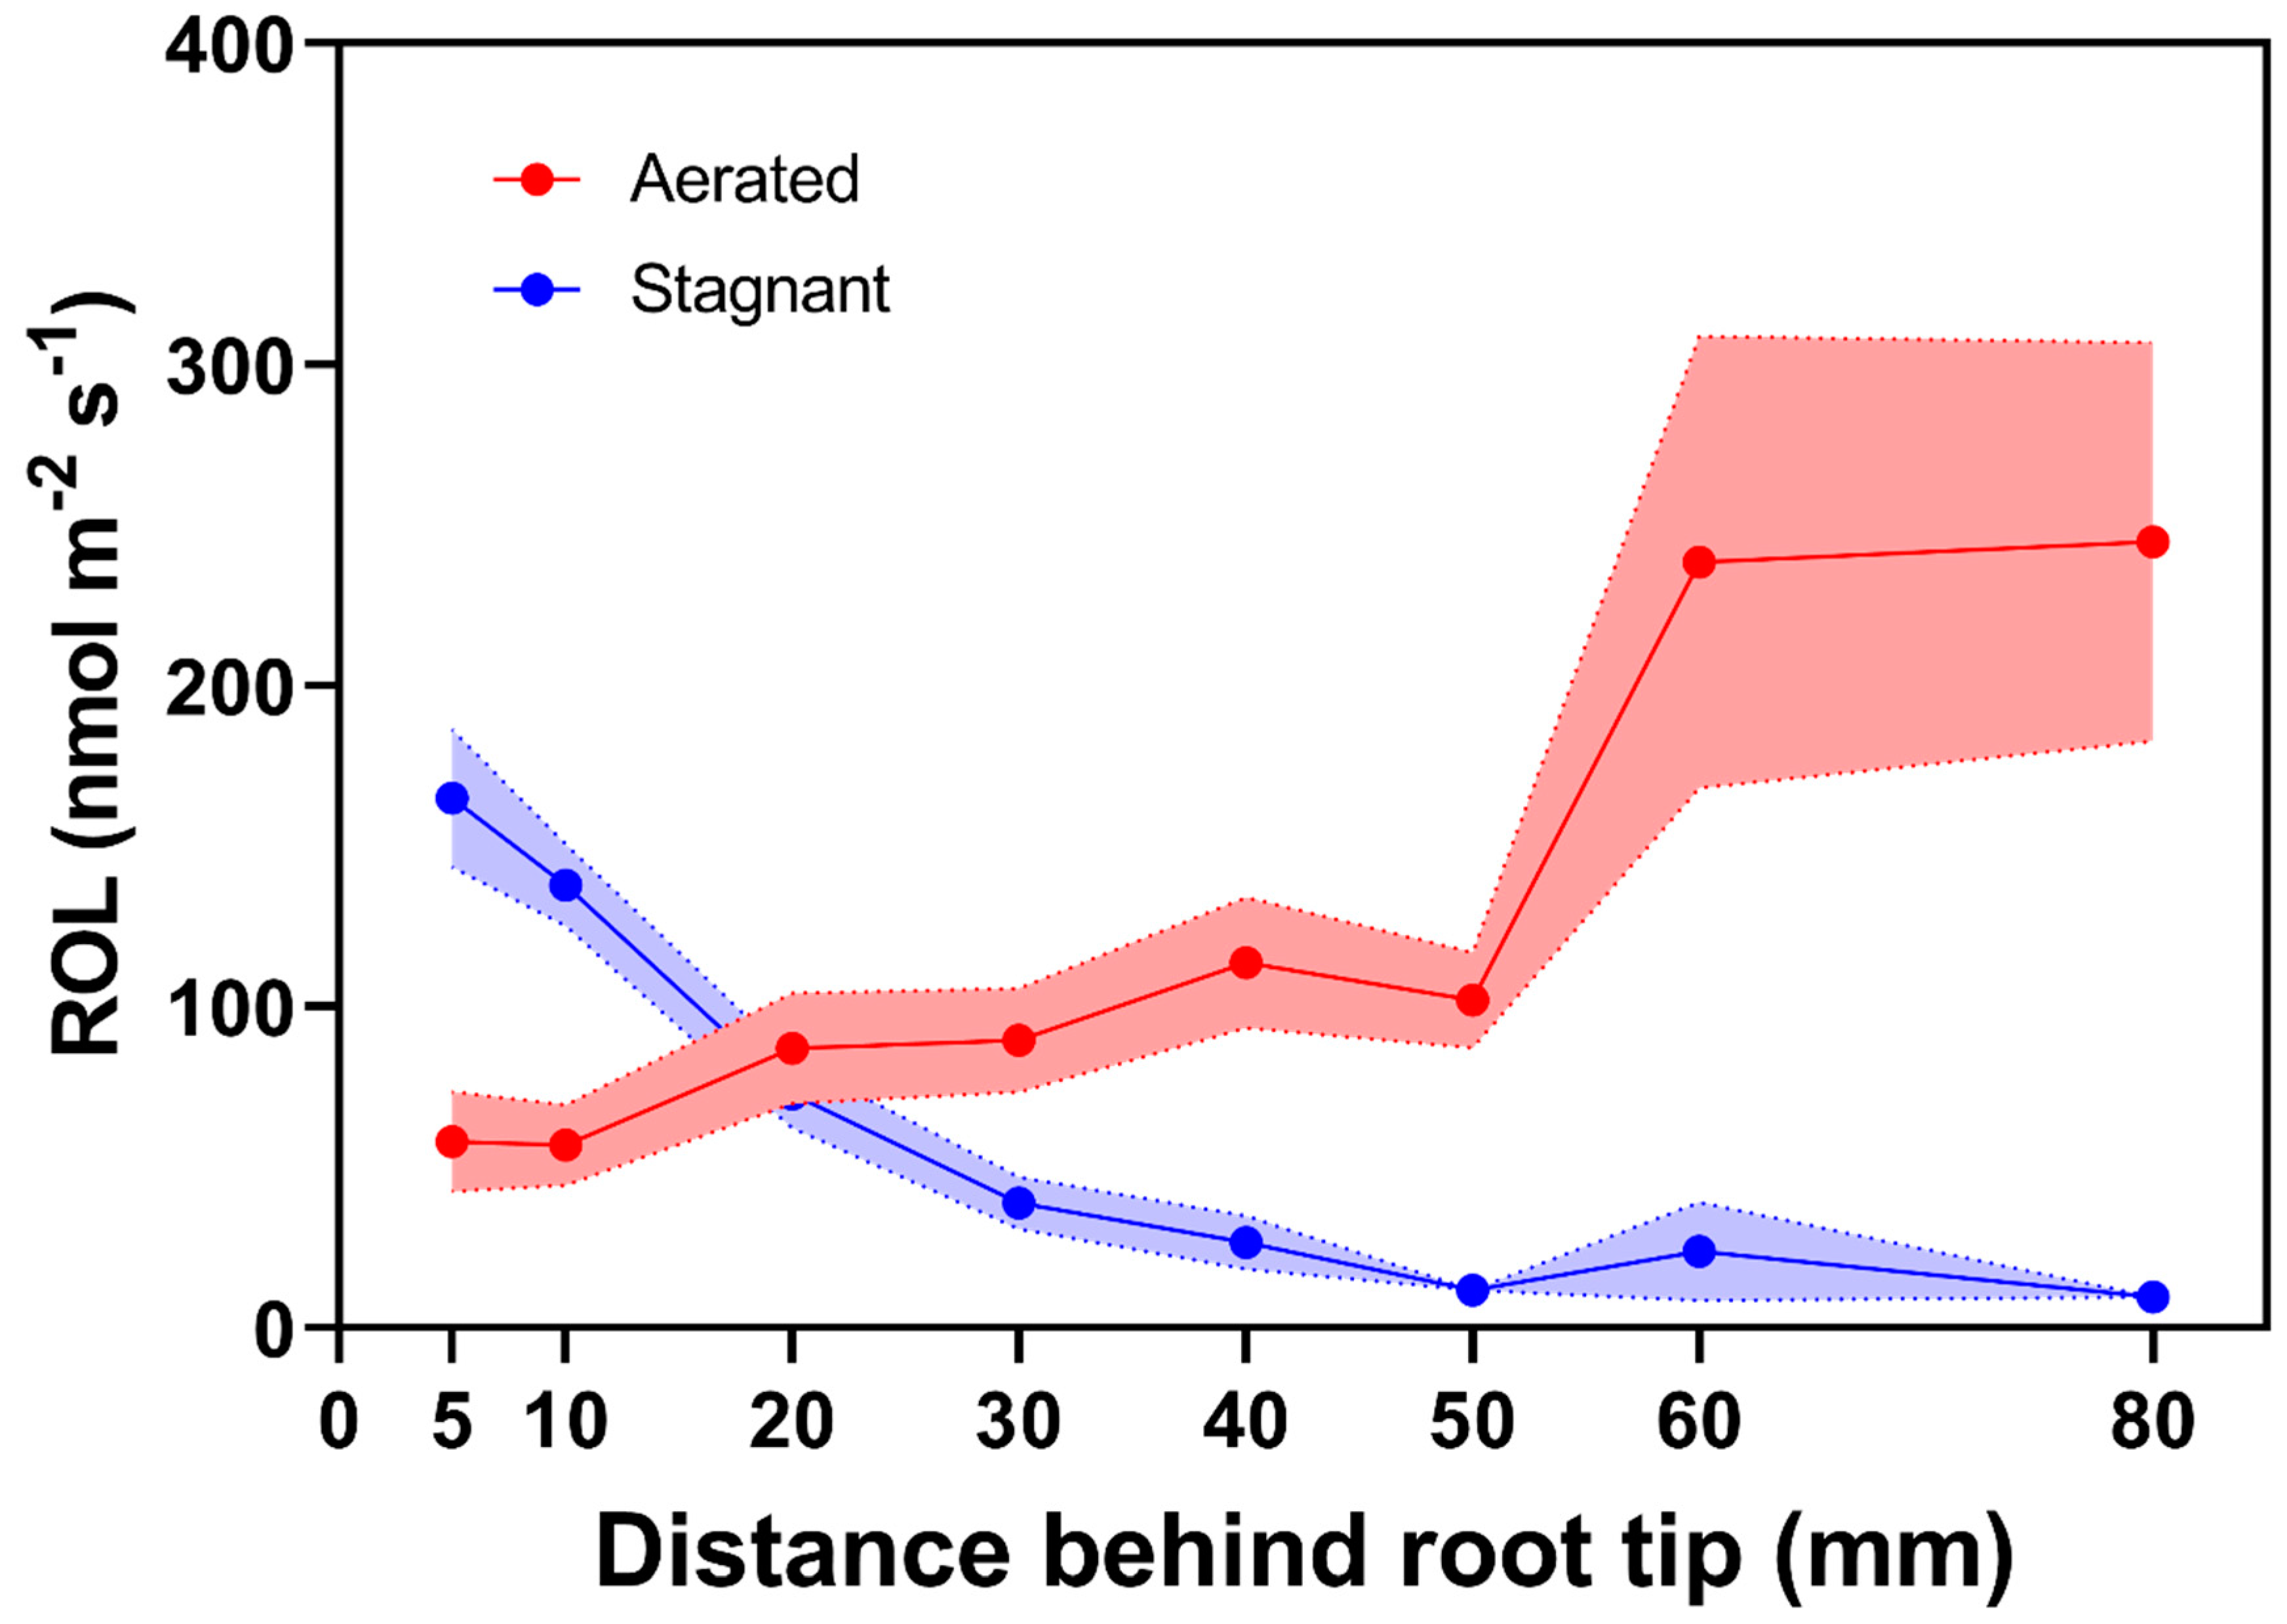
The presence of barriers to restrict ROL in roots was initially visualized in experiments indicating interspecific differences in root O2 flux and marked basipetal reductions in root O2 permeability in a number of wetland species [8,9]. Moreover, lower O2 radial flux rates were obtained in roots of plants grown in flooded conditions in comparison to aerated controls [10]. For rice roots grown in aerated conditions, higher basipetal ROL rates decreasing towards the root tip are characteristic patterns indicating roots with ‘weak’ or absent barriers to ROL. In contrast, for rice roots that can form barriers to ROL when grown in stagnant, deoxygenated conditions, lower ROL rates along basal zones and higher ROL rates toward the root tip indicate the presence of a tight barrier to ROL [11,12,13,14,15,16,17,18,19,20] Figure 1. The presence of tight barriers to ROL allows for O2 diffusion towards the root tip where molecular O2 enables root growth and nutrient uptake in these flooded conditions [21,22].
In wetland plants, ROL from roots to the flooded soil occurs especially around the highly O2-permeable root tips without barriers [4,23,24]. Moreover, considerable O2 loss can originate from developing young roots and basal laterals [25,26], although the lateral roots of rice have recently been shown to also form a barrier to ROL when plants are grown in stagnant, deoxygenated solutions [27]. Given that newly formed and short roots lack barriers to ROL [13,18,28], the sediment oxygenation increases proportionally as the numbers of roots produced by plants in anaerobic soils increase [6]. Sediment oxygenation is important for the oxidation of chemically reduced compounds such as Fe2+, Mn2+, H2S, and CH4 [1,29,30]. Moreover, O2 release from roots into the flooded soils can influence the redoximorphic biogeochemistry by establishing a spatiotemporal microoxic zone of potentially high microbial activity [31,32]. The amount of O2 taken up by plant shoots and released from roots to flooded soils depends upon many above and belowground factors, including the numbers, types (e.g., adventitious, laterals) and lengths of roots, the magnitude and distribution of their pore-space and tissue respiratory demand, the degree and distribution of barriers to impede ROL, the numbers of the aerial shoots in capacity for O2 uptake, the porosity and O2 demand within these shoots, their lengths and the degree of submergence of the aerial shoots, the submerged soil O2 demand, their microbial activity, their physical properties (i.e., O2 diffusivity being lower in clay than sandy soils) and temperature [2,6].
Within the past few decades, active research has been conducted on the ecological importance of ROL to the flooded soil as well as the anatomical location, chemical characterization, interspecific differences and external triggers for barriers to impede ROL from roots [7,11,12,15,16,17,33,34,35,36,37,38,39]. In this review, we summarize the main methodological techniques used for the visualization and quantification of root ROL. The different techniques described in here have been instrumental for our current knowledge of O2 dynamics in submerged substrates. Understanding the strengths and weaknesses of the different methods for ROL quantification as well as the potential uses of each method will provide the needed information for an appropriate method selection and accurate quantification of ROL from roots of plants grown in diverse conditions.
2. Methods for Root Radial O2 Loss Determination
Radial O2 loss from roots can be qualitatively visualized and/or quantitatively determined using several contrasting approaches (Table 1). Here, we describe the most widely used methods for ROL measurements reported in literature. We focus on the principles, main uses and limitations as well as practical set-ups for each method. Detailed protocols and materials needed for each method are provided as Supplementary Information (Supplementary S1–S4). Other methods and approaches for determination of related aspects to ROL including sediment redox potential, iron plaques on roots and mathematical models are summarized in [4].
2.1. Qualitative Colorimetric Methods
The colorimetric methods for ROL determination are based on the principle of the oxidation-reduction of an external molecule that reacts with molecular O2. Changes in coloration can be visualized and be indicative of ROL from roots. Colorimetric methods for ROL determination include the indigo-carmine [40], methylene blue [25,37], Ti3+-citrate [41,42], the anthraquinone radical anion [43] and crystal violet [44].
2.1.1. Principle of the Method
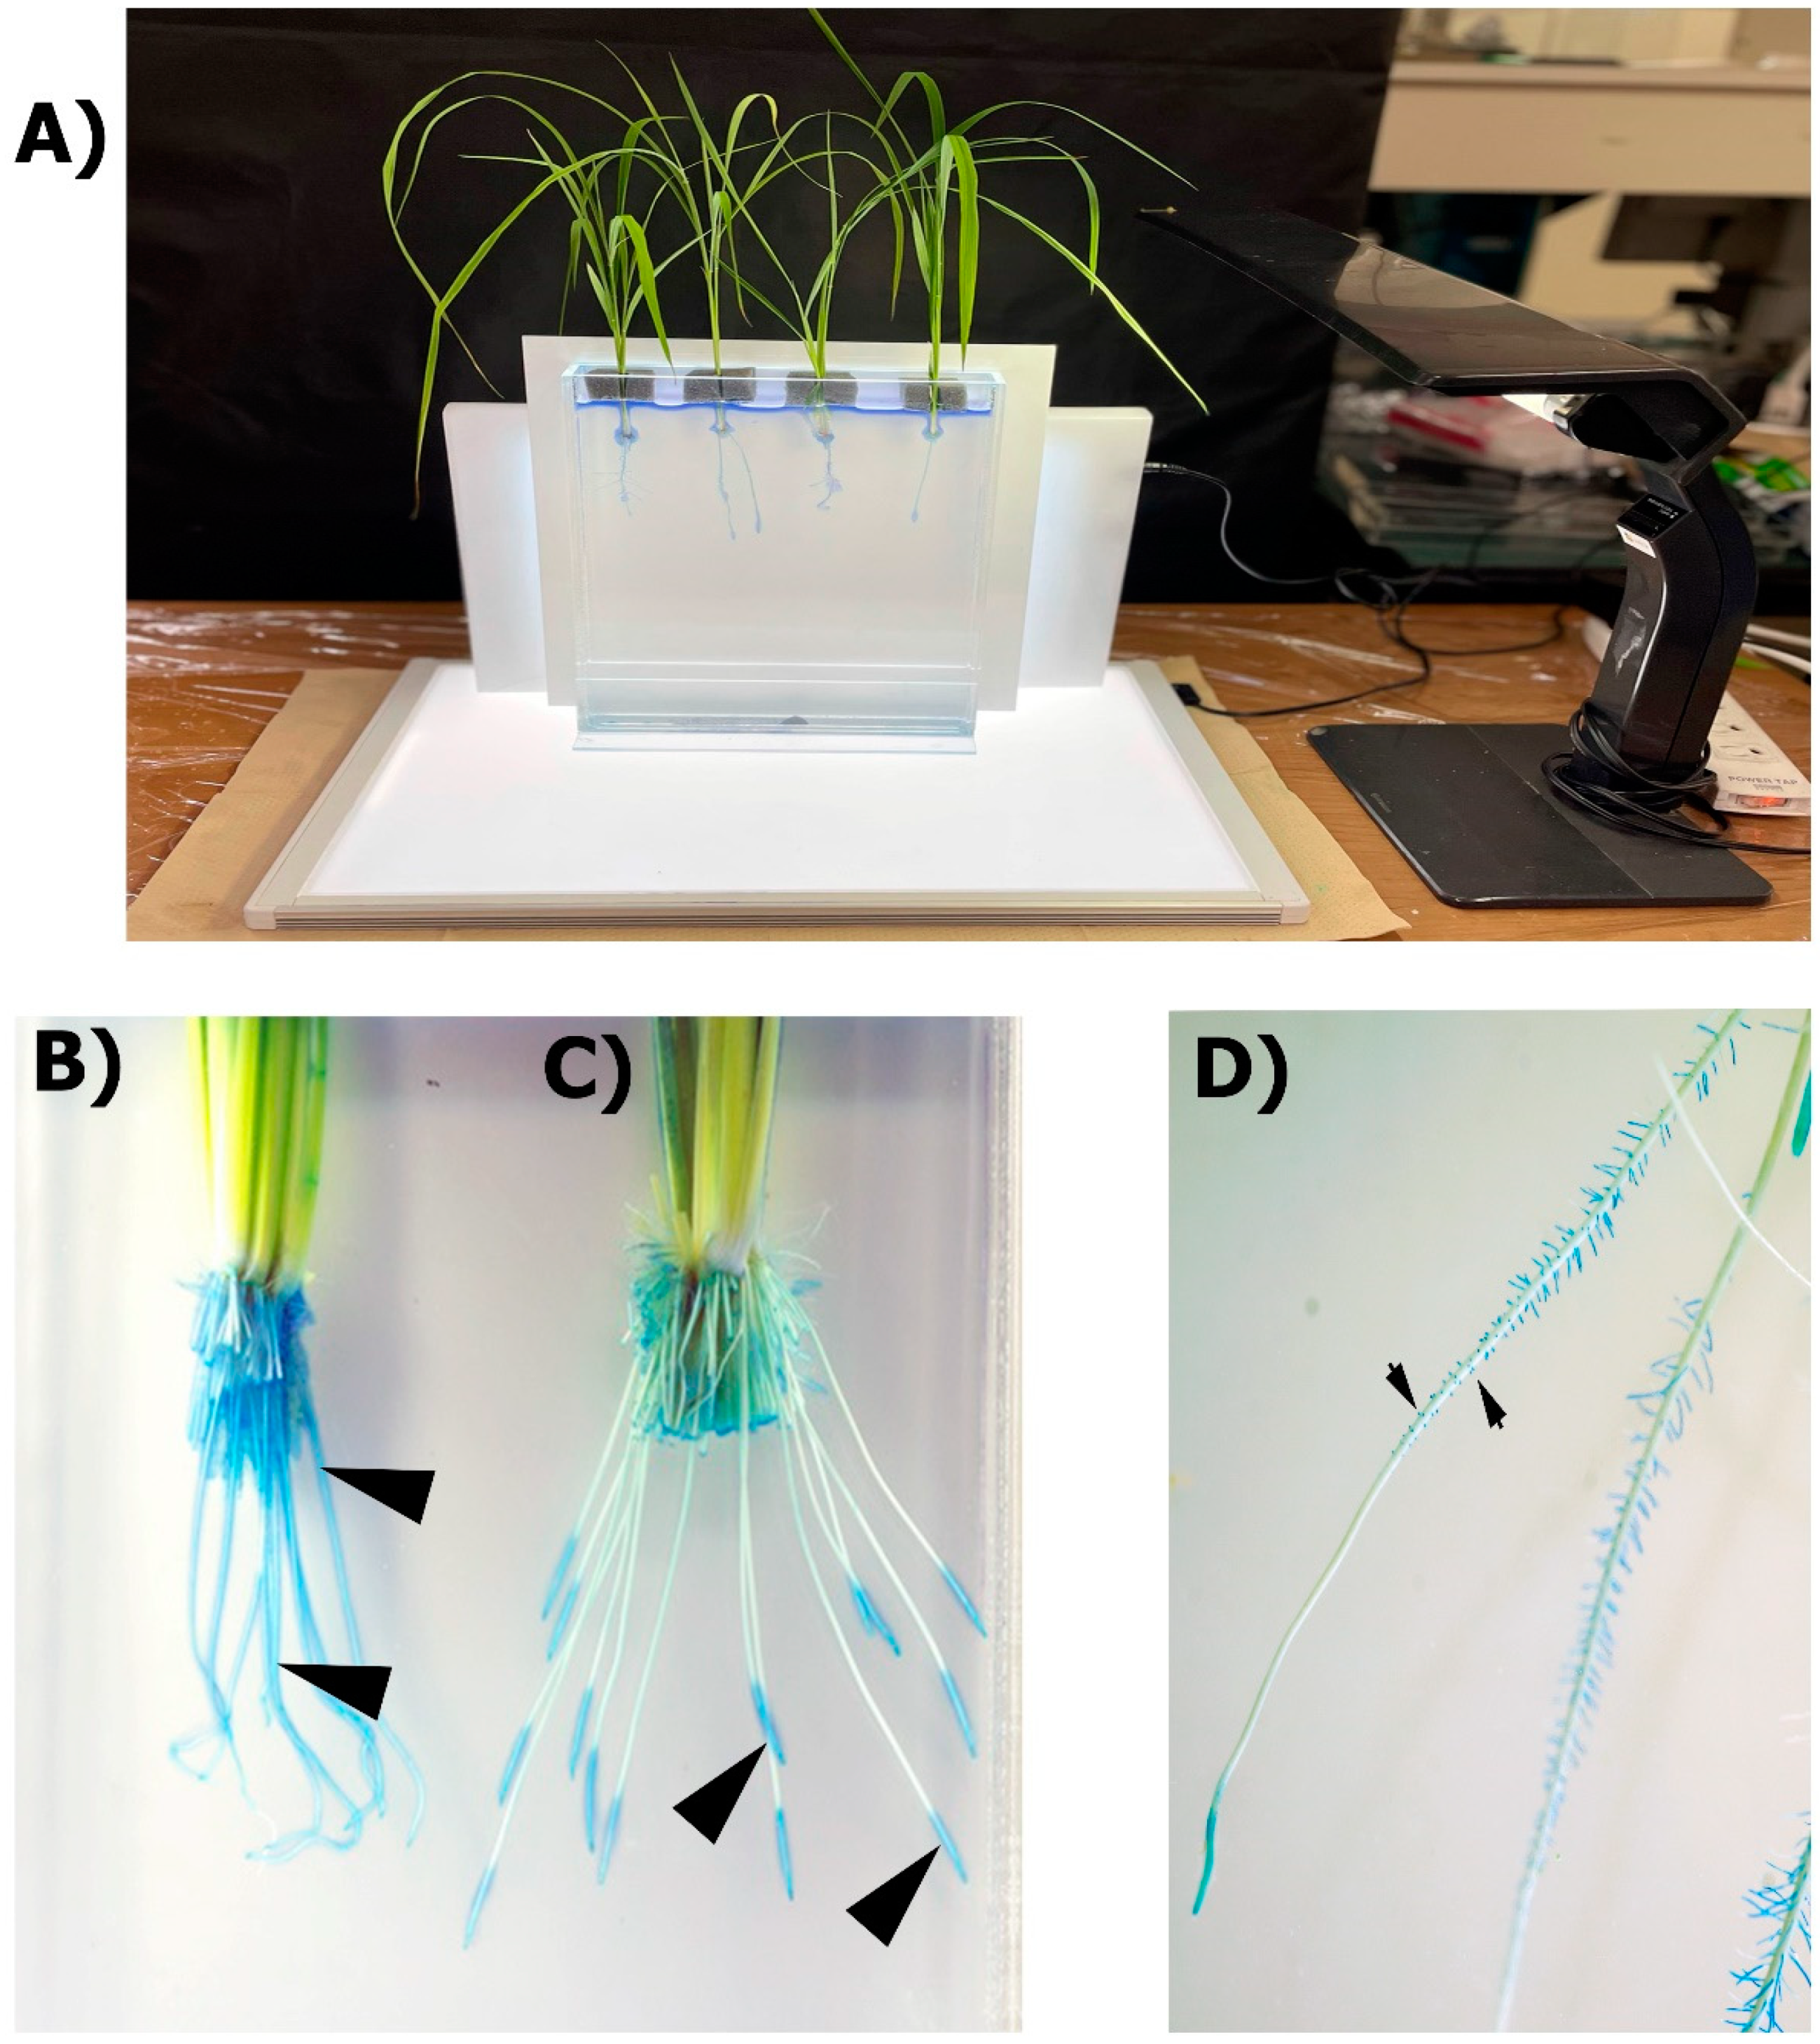
The methylene blue is the most widely used method for the colorimetric determination of ROL from roots. The methylene blue dye is bright blue in the oxidized state and colorless in the reduced state. This dye has been used to study the sites of ROL from roots of plats grown in different conditions including stagnant, deoxygenated solutions [25,37] and flooded soils [33]. Once the methylene blue dye is reduced in a deoxygenated medium, the sites of root ROL can be detected as an intense blue color along these regions of the roots where O2 loss occurs (Figure 2).
2.1.2. Practical Set-Up
Root systems of intact plants are completely submerged in a container filled with deoxygenated agar solution and the “colourless” reduced methylene blue (Figure 2A). The root–shoot junction is submerged a few centimeters (i.e., 2 cm) down into the reduced solution to avoid O2 leaks in that zone while the shoots remain in air. The plant is fixed and ROL is visualized after c. 30 min by blue coloration in the rhizosphere or on the root surfaces (see protocol in Supplementary Information S1). Roots with a weak barrier, or no barrier at all, will display blue coloration longitudinally across the entire root (Figure 2B). In contrast, roots with a strong barrier to ROL only show blue halos at the root tip where there is no barrier formation (Figure 2C). The resolution of the technique is sufficient to indicate the sites of ROL produced by root ‘windows’ of developing laterals (Figure 2D).
2.1.3. Generalities
The methylene blue method is appropriate for a rapid and initial screening of the main sites of root ROL or the visualization of a barrier to ROL in roots. This inexpensive method has been used to determine differences in ROL among genotypes from a large population (e.g., recombined inbred lines of maize, [37]) or for a rapid determination of ROL on different roots from the same genotype (e.g., rice, [18,44]). The main limitations of the methylene blue method are (1) its qualitative nature and (2) the unknown O2 detection limit (Table 1). This will restrict the method use to a simple characterization of the sites of ROL and/or the presence/absence of barriers to ROL instead of detailed physiological studies on root ROL barrier strength.
2.2. Polarographic Cylindrical Oxygen Electrode
2.2.1. Principle of the Method
The polarography is an analytical technique based on the electro-oxidation or electro-reduction of substances in solution under an applied electromotive force. This technique utilizes the characteristics of the current–voltage curve for O2 identification and the current output to quantify its amounts. The polarographic O2 determination in a deoxygenated medium requires an electrical circuit where a cathode, a cylindrical platinum electrode (syn. sleeving-electrode), is connected to an anode (e.g., reference electrode; usually Calomel or Ag/AgCl electrode) and these two to an amperometer (Figure 3A). The sleeving-electrode is polarized in the deoxygenated solution before measuring ROL from a root (see protocol in Supplementary Information S2). Polarization voltage is applied to the circuit and a current plateau placed somewhere between −0.2 and −0.8 V indicates that the rate of O2 reduction is independent of voltage and only depends on the rate of O2 diffusion to the cylindrical electrode surface ([9]; Figure 3B). The current plateau depends upon the amount of O2 present in the solution. Under the appropriate polarizing voltage, the sleeving-electrode acts as a sink for O2, (the O2 concentration at the electrode surface is effectively maintained at zero) and a diffusion gradient is maintained between root and electrode [1,45].
2.2.2. Practical Set-Up
The root-sleeving electrode and the root system of an intact plant are immersed in an acrylic chamber filled with stagnant, deoxygenated solution (Figure 3A). Once the sleeving-electrode is polarized, a root of an intact plant is inserted through the cylindrical Pt electrode (Figure 3C). The electrode can be positioned at different distances along the root and the diffusion current at a given position on the root is measured after the current has equilibrated (c. after 25 min, Figure 3D). After measuring the root, the residual current in the deoxygenated solution is obtained by placing the electrode away from the root and measuring the current at equilibrium. The rate of ROL from the root at equilibrium can be calculated using the equation proposed by Armstrong and Wright [45]:
where ROL is the radial O2 loss (O2, nmol m−2 root surface s−1), is the diffusion current (µA) with the root in the electrode minus the residual current (µA) in the deoxygenated solution without a root and is the surface area of the part of the root within the electrode (cm2). The aboveground parts of the plants remain above water and photosynthetically active radiation is provided to ensure stomatal opening and O2 transport from shoot to roots. The ROL is usually measured at different positions along the root. ROL decreasing towards the root–shoot junction (the source of the O2) indicates the presence of a barrier to ROL (Figure 1, cf. [12,24]). In contrast, higher basipetal ROL rates decreasing towards the root tip are characteristic patterns of roots with ‘weak’ or absent barriers to ROL (Figure 1).
2.2.3. Generalities
The polarographic determination of ROL is appropriate to accurately detect very small amounts of O2 leaking from roots. Moreover, this technique can be used to detect values of high ROL rates (i.e., c. 21 kPa pO2). However, incomplete reduction of O2 at the electrode surface can occur when artificially perfusing root sections with high pO2 (i.e., pO2 > 38.7 kPa, [46]). Therefore, care must be taken when evaluating ROL at different O2 concentrations surrounding the shoot. The main limitations for this method include the use of custom-built equipment and the long time required to obtain ROL rates (Table 1).
2.3. Clark-Type O2 Microelectrodes and O2 Micro-Optodes
2.3.1. Principle of the Method: O2 Microelectrode
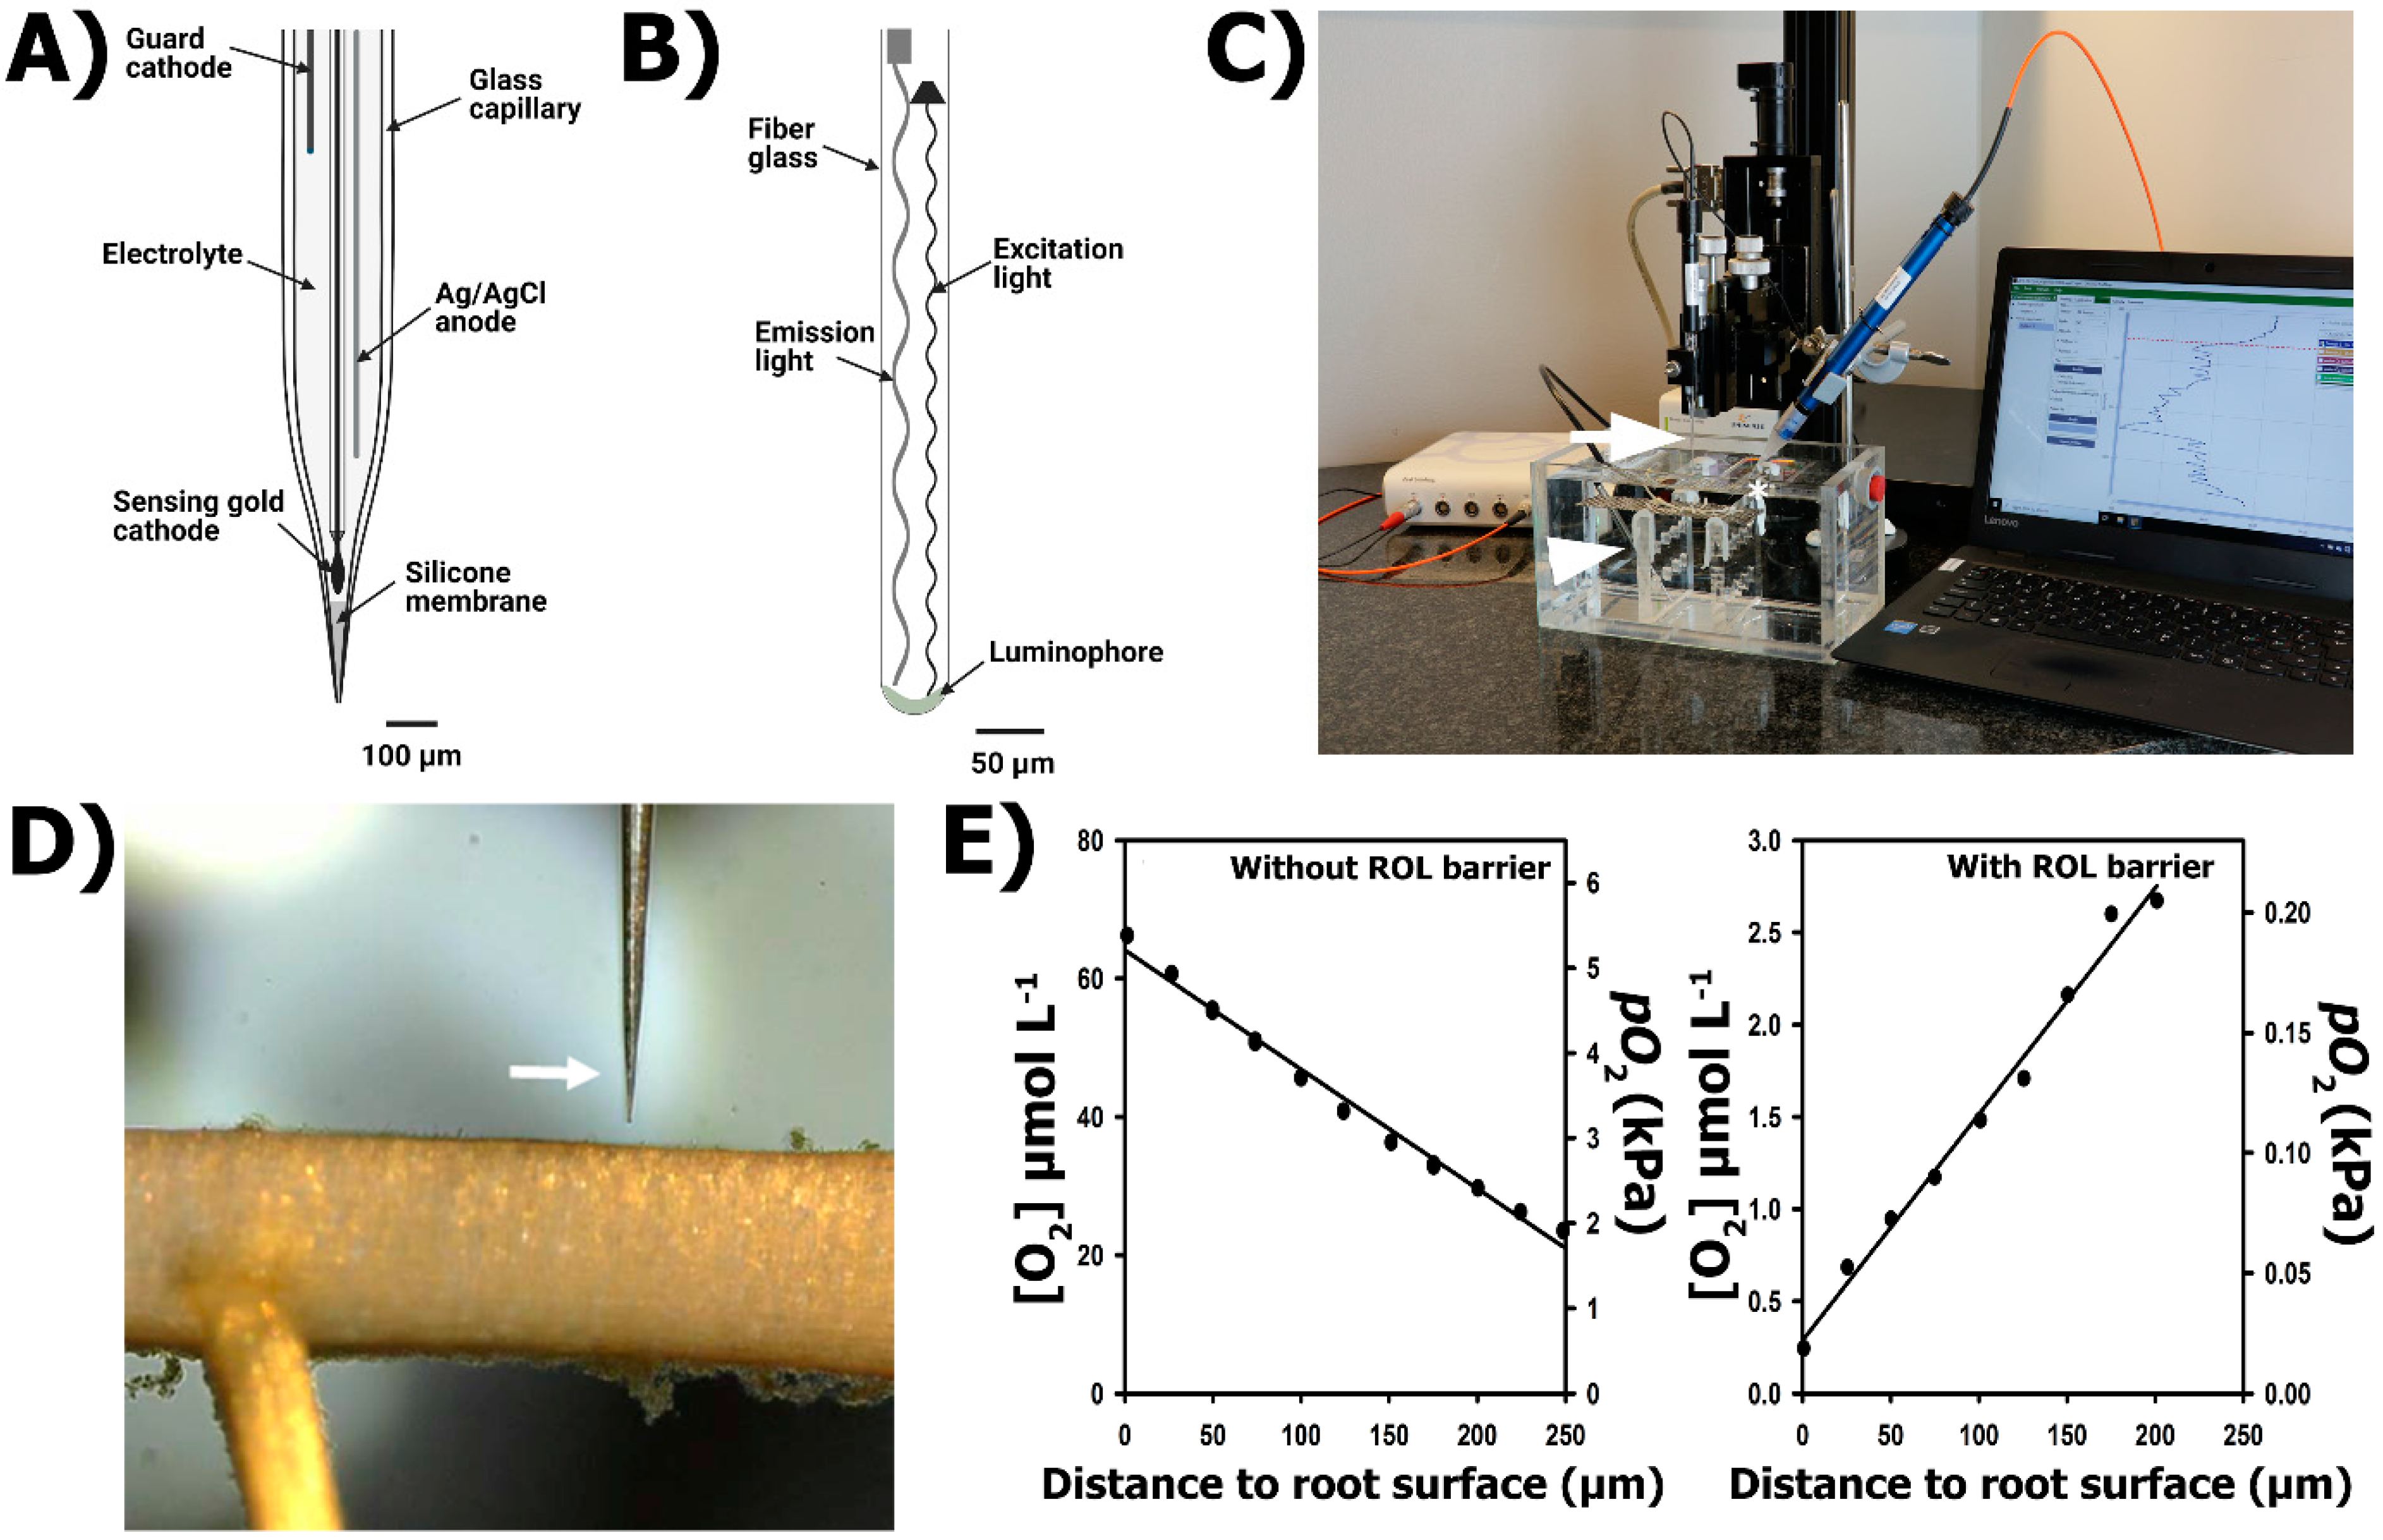
The O2 microelectrodes are amperometric sensors where an anode and a cathode are fused into one sensor [47], resembling a miniaturized version of the Clark-type sensors [48]. The O2 quantification at the microelectrode tip relies upon O2 diffusion from the medium to an O2-reducing cathode, which is polarized against an internal anode. An O2 microelectrode contains a gold-coated sensing cathode, a silver or gold wire guard cathode (reducing cathode) and an Ag/AgCl anode, all inserted into a glass capillary filled with an electrolyte solution and sealed at the tip with a gas-permeable silicone membrane ([47]; Figure 4A). The electrodes inside the glass capillary form a circuit where the resulting signal is in the pA (10–12 A) range. A picoammeter is used to polarize the circuit and to amplify the current output. The guard cathode removes O2 in the electrolyte, minimizing zero current, response time and polarization time. When the zero current has stabilized following a period of polarization, the current in the measuring circuit depends only on the diffusional supply of O2 from the medium to the surface of the microelectrode membrane [47]. The response to O2 is linear all the way up to pure O2, i.e., 101 kPa pO2.
2.3.2. Principle of the Method: O2 Micro-Optodes
The O2 micro-optodes are basically a fiber glass coated with an oxygen-quenchable luminophore (Figure 4B). The luminophore is excited when illuminated at a particular wavelength. Oxygen can act as a dynamic luminescence quencher, decreasing the luminescence quantum yield of the luminophore and therefore the O2 concentration can be determined by the difference resulting from the amount of emitted light by the luminophore in presence and absence of O2 [49,50]. The response to O2 is non-linear but modern meters handle the non-linear response based on a 2-point calibration, typically at zero O2 and with O2 at air equilibrium. Oxygen optodes lose resolution with increasing O2 partial pressure and most sensors should not be used for pO2 exceeding 40 kPa.
2.3.3. Practical Set-Up
Radial O2 loss from roots to the external medium can be quantified by inserting roots of intact plants (or detached root sections) into stagnant, deoxygenated solution. The O2 flux is measured at the root surface as well as a few µm (typically 200 µm) away from the root surface (deoxygenated medium) by either O2 microelectrodes or micro-optodes (see protocol in Supplementary Information S4). For this purpose, the microsensor (O2 microelectrode or micro-optode) needs to be fixed to a micro-manipulator fitted on a motorized stage to control micrometrical movement from the deoxygenated solution towards de root (Figure 4C). The root is mounted horizontally in a fine woven wire mesh and held by plastic bands attached to the mesh and mesh with the root mounted is submerged into the deoxygenated solution. The microsensor movement is controlled remotely and visualized by stereo microscope to guarantee that the microsensor tip reaches the root surface at the target point for ROL determination (Figure 4D). Stirring near the root must be uniform in order to reproduce accurate determinations of O2 fluxes from roots to medium (ROL) or from medium to roots (O2 consumption by roots). Radial O2 loss from roots can be calculated from the slope of the O2 gradient from the root surface into the deoxygenated medium using the equation proposed by Henriksen [51]:
where D is the O2 diffusion coefficient in the agar medium (approximates that in water at the experimental temperature), C1 is the O2 concentration at the root surface (mol m−3) calculated from the partial pressure, C2 is the O2 concentration at a given radial distance away from the root surface r2 (m) and r1 is the radius of the root (m). ROL measurements can be conducted along the root when the aboveground parts of the plant are above water (i.e., as explained before for ROL measurements using root-sleeving electrodes) or can be conducted on excised root segments sealed with lanoline in both cut ends [52]. Provided that the main source for O2 is O2 from root aerenchyma (deoxygenated solutions still have traceable amounts of O2), the slope of the O2 gradient from the deoxygenated medium into the root surface determine the presence of barriers to ROL. Oxygen gradients increasing towards the root surface indicate O2 release and thus that no barrier to ROL is present, or if present, the barrier is weak (Figure 4E). In contrast, a strong barrier to ROL is present when dissolved O2 decreases towards the root surface (Figure 4E) as no O2 is being released by roots. The patterns of ROL obtained with O2 microsensors might be similar to those obtained using the root-sleeving electrode (e.g., Figure 1; [28]), but in many cases the measured fluxes are lower when obtained by a microsensor. The root-sleeving electrodes reduce all O2 at the Pt surface and therefore the O2 gradient is steeper inside the ring, resulting in a higher flux.
2.3.4. Generalities
Oxygen microelectrodes and O2 micro-optodes are very sensitive to low O2 concentrations (nanomolar range), making them appropriate tools for ROL determinations. Moreover, the narrow tip diameters (3–10 μm for Clark-type microelectrodes and 50 μm for micro-optodes) allow for the spatial resolution of O2 gradients to tissue and cell levels. The microelectrodes have been instrumental to obtaining O2 profiles inside plant tissues, including the visualization of anoxic cores inside roots [53,54]. The higher spatial resolution of the O2 microelectrode and O2 micro-optodes, however, can also be a weakness for root ROL characterization as permeable cells (windows) and emerging laterals can cause O2 leaks to the rhizosphere (Figure 2D; [7,20,53,55]).
The O2 microelectrodes with guard cathodes have almost undetectable zero currents of <1 pA and 90% response times in less than 200 ms [47,56]. O2 microelectrodes have a faster response and smaller tip diameter than O2 micro-optodes, but O2 microelectrodes require calibration more often, especially when changes in temperature occur (Table 1). The development of micro-optodes with a smaller diameter than 40 μm is limited due to a dramatic decrease in luminescence signal reducing O2 sensitivity [49]. Due to its working principle, an O2 microelectrode consumes an extremely low amount of O2 (ca. 4 × 10⁻⁴ nmol O2 h−1, [57]), causing a ca. 1–2% signal difference between the signal in stagnant media compared to turbulent media or media with high diffusivity such as gasses. In contrast, the O2 micro-optode is insensitive to stirring of the media due to its non-oxygen consuming detecting principle. The stiffness of the glass capillary makes the microelectrode suitable to penetrate plant tissues, whereas the flexible nature of the optical fiber of the O2 micro-optode makes it unsuitable for such measurements [50]. The signal of both microsensors can be affected by some other chemical compounds and strong organic solvents (Table 1).
2.4. Planar Optodes
2.4.1. Principle of the Method
The planar optode is a relatively recent tool for the 2D visualization and quantification of O2. The planar optode uses the same principle of an O2 quenchable luminophore, as explained above for the O2 micro-optode, but the signal intensity (O2-dependent) is photographed and analyzed, allowing for both the visualization and quantification of O2 dynamics in 2D.
2.4.2. Practical Set-Up
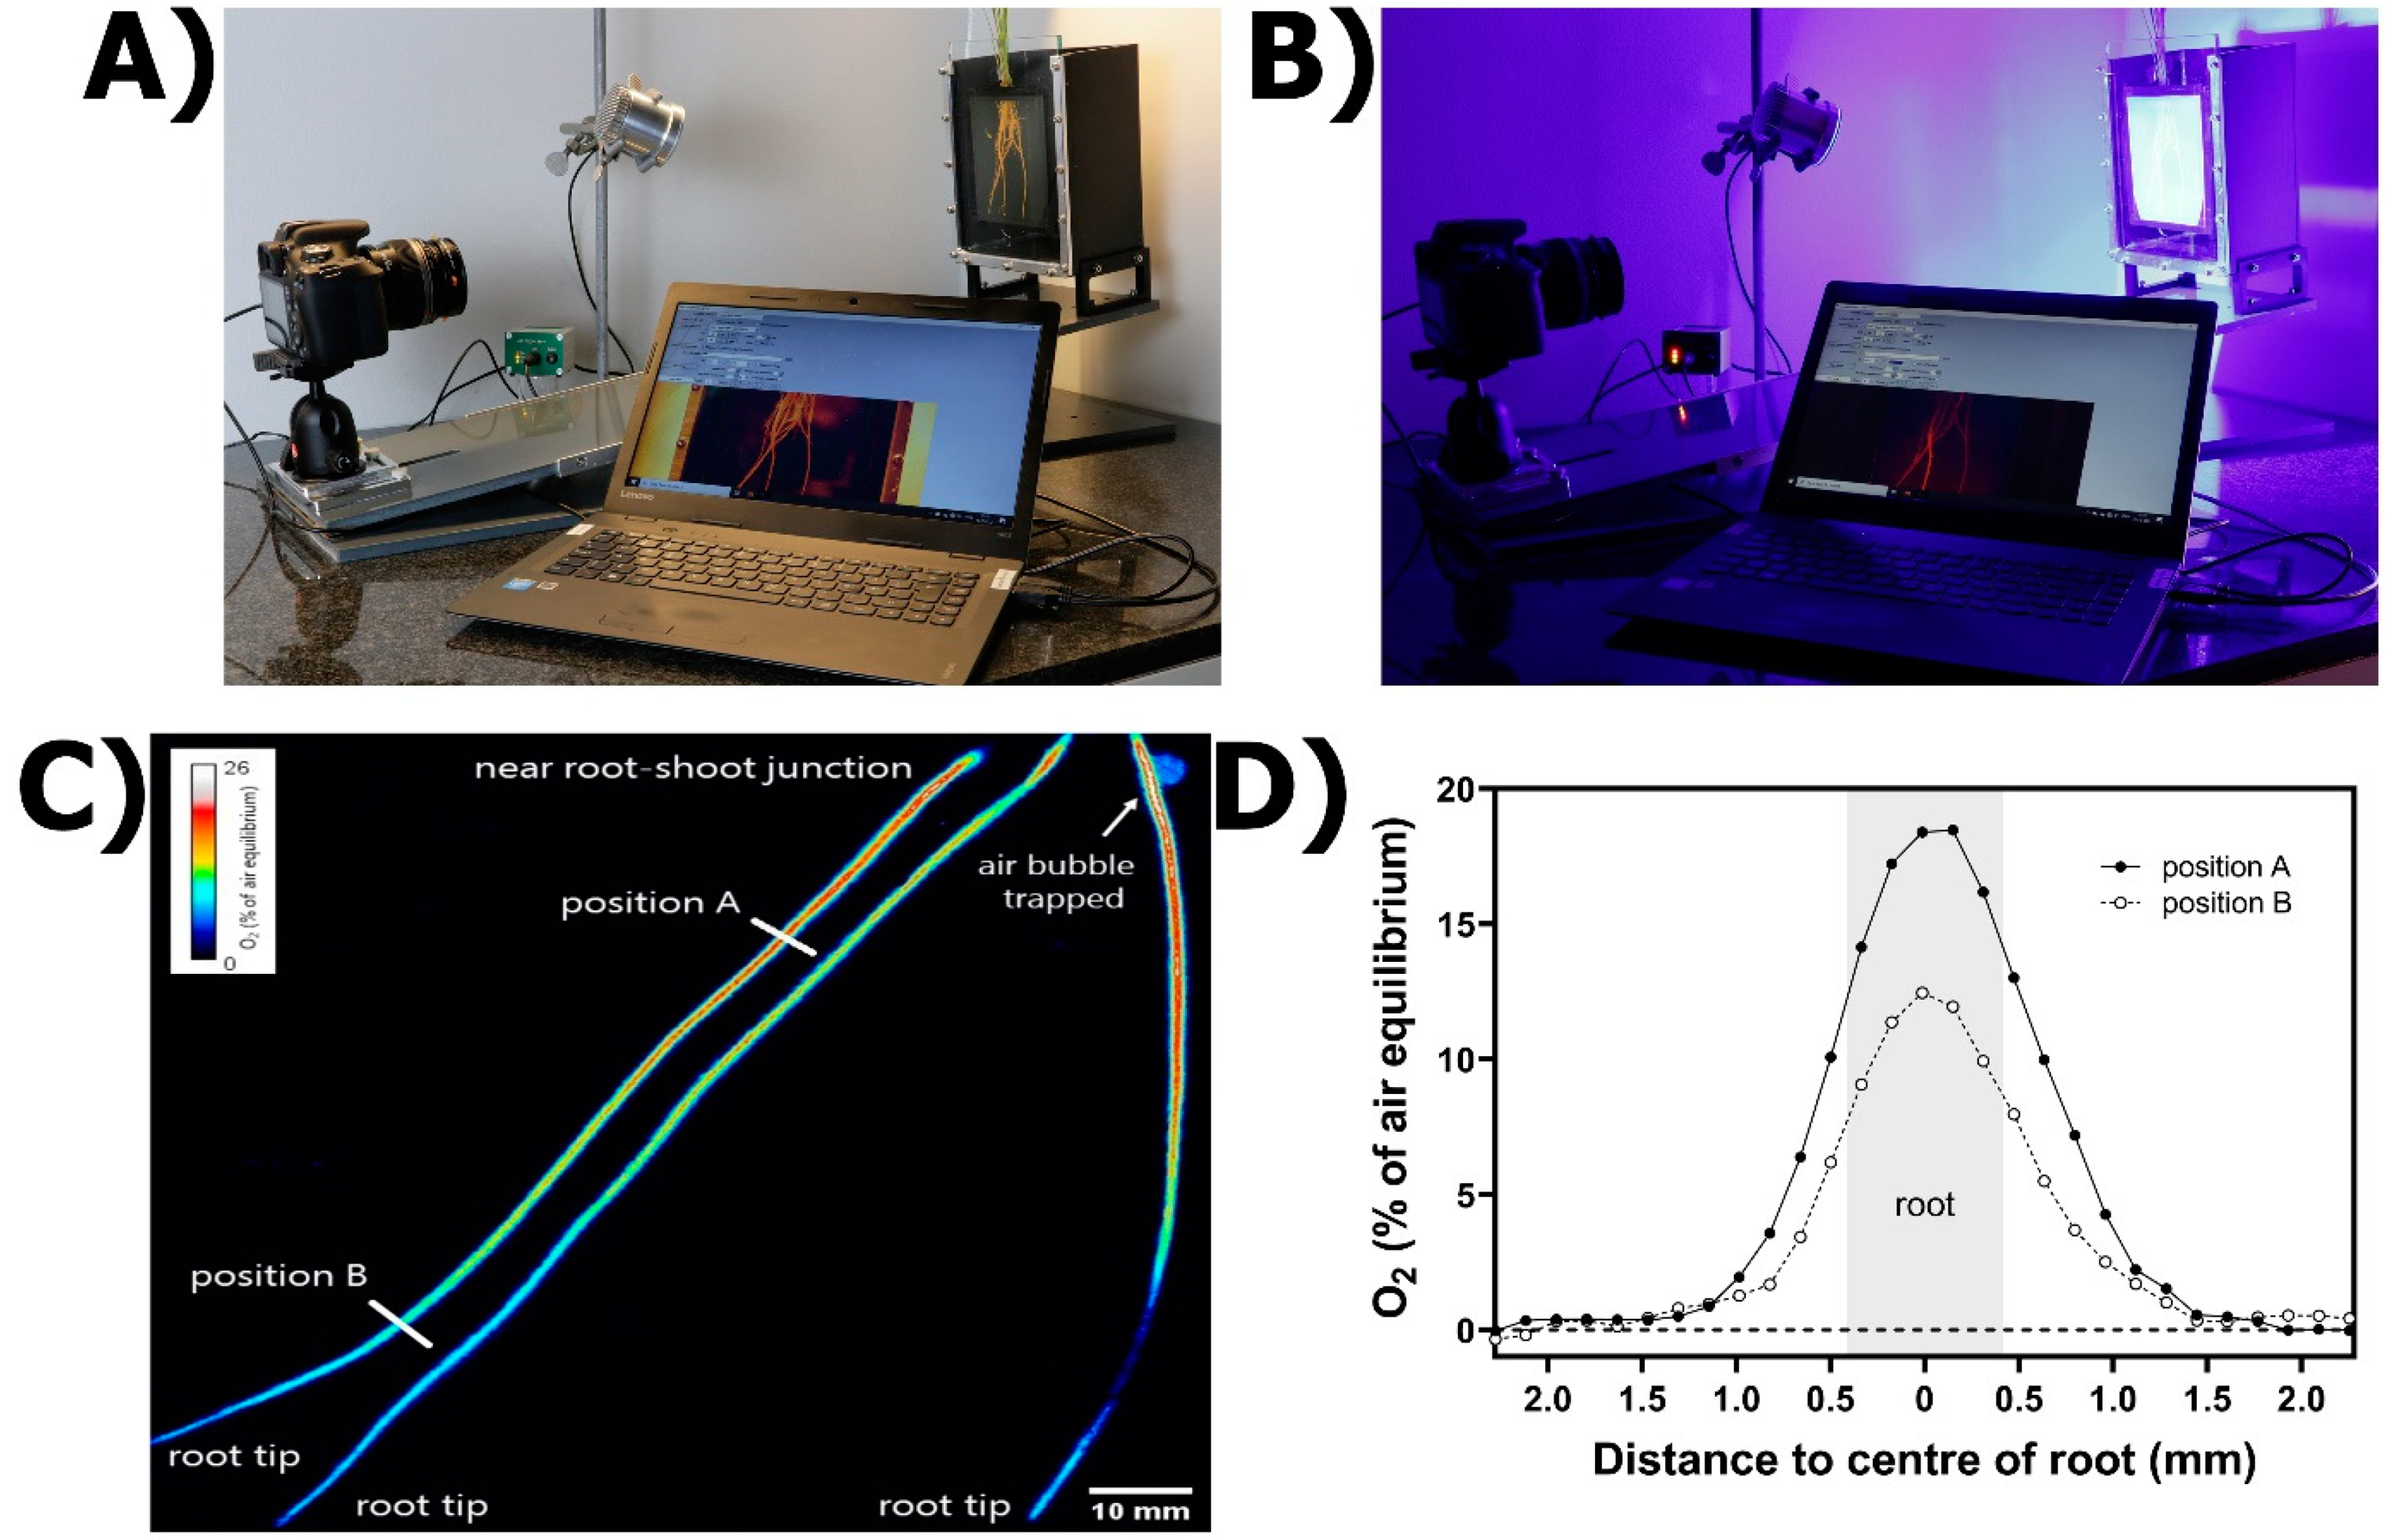
The practical set-up for the planar optode method consists of a commercial regular RBG camera with an emission filter (530 nm) attached, an O2-sensitive luminophore (indicator dye), a light-harvesting dye (antenna), and a high-power blue LED light with an excitation filter (435 nm; [58] Figure 5A). The indicator and antenna dyes are dissolved in a permeable matrix and coated into a dust-free, transparent polyester foil to form the O2-sensing planar optode (see details on methodological aspects in Supplementary Information S4). A black silicone layer is added to reduce light scattering and reflection from any background behind the planar optode [58]. In water-saturated systems, the planar optode is placed near the surface of the soil/sediment or next to roots inside a transparent-walled aquarium. The RGB camera is positioned perpendicular to the planar optode and LED lights are orientated at a 45° angle to the camera (Figure 5A; [58,59]).
Oxygen distribution within the planar optode is evaluated by illuminating the planar optode with the specific LED light, and the luminescence emitted is recorded in a photograph. Measurements are conducted in dark conditions to avoid light interference (Figure 5B). The main approaches for image analysis include luminescence intensity, ratiometric imaging and luminescence lifetime. Luminescence intensity measurements have some disadvantages as they are sensitive to variations in background reflection, inhomogeneous distribution of the luminophore and variations in the homogeneity of the excitation light [60]. Luminescence lifetime imaging offers some advantages, as this technique allows for excellent contrast enhancement and background suppression of unwanted luminescence in the image [61,62]. However, luminophores with relatively long lifetimes and complex hardware and software for triggering and synchronizing image acquisition and sensor excitation are required [60]. The ratiometric imaging approach is therefore a preferred technique, as this method is simple, inexpensive and reduces the noise of the image using differences in luminescence intensity between the antenna dye (does not react with O2; therefore, luminescence intensity is unaffected) and the indicator dye (emission quenched in the presence of O2) as an internal reference for the O2 sensor [58]. Color patterns in the planar optode image indicate differences in O2 concentrations at the interface between roots and anoxic sediment, highlighting longitudinal gradients of ROL (Figure 5C). Radial O2 loss can be quantified in selected regions of interest in the picture, based on O2 extinction/depletion between root surface and the anoxic sediment using open-source software (Figure 5D; see details in Supplementary Information S4).
2.4.3. Generalities
The majority of studies using planar optodes have a focus on benthic interactions in marine sediments [30,58,59,63,64]. This technique is also used for evaluating spatio-temporal variability in O2 dynamics in waterlogged crops (e.g., rice; [65]). Spatial resolution in planar optodes is largely determined by image format, pixel size, optical lenses and the camera’s field of view [60]; using an appropriate set-up, maximum spatial resolutions can be comparable to that obtained with the smaller O2 microelctrode (e.g., <10 µm2). Nonetheless, planar optodes can resolve O2 dynamics in larger areas of the root and soil interfaces as compared to O2 microsensors [66,67]. Response time of the planar optodes depends upon the thickness of the layers and the silicone coating [59]. Moreover, the optode response is nonlinear, with maximum sensitivity at low O2 concentrations for most of the indicators, but still sufficient accuracy from 50% to 100% of air equilibrium (up to 20.6 kPa pO2) [58]. The main constraint for using planar optodes is that O2 quantification and imaging are being conducted throughout and along a glass wall that interferes with the root radial O2 diffusion. Placing an O2-impermeable barrier along a root will enlarge the oxygenated area as compared to a situation without such a wall cf. [68]. Moreover, light scattering properties can be affected by several factors including the wall material, the planar optode itself, background light, a thin water film or air bubbles trapped between optode and wall and the silicone coating; potentially generating a skewed and smeared image of the O2 distribution around the root [68,69]. These issues can be minimized or even eliminated by an appropriate selection of materials and calibration procedures [69]. A comprehensive list of existing O2 indicators, including critical photophysical and sensing properties and the criteria for indicator selection, is summarized in Quaranta et al. [70]. Another important aspect for planar optode use is that good contact between the sensor foil and the root is needed to ensure optimal luminescence and O2 quantification. Imaging in focal planes is ideal, as the further away from the actual roots the picture is taken, the lower the obtained O2 concentration [71], but obtaining full contact of roots with the optode wall is often challenging as the root architecture and geometry varies. However, recent developments in optical O2 sensor nanoparticles have allowed for a full visualization and quantification of O2 at different focal planes of the whole rizhosphere level when using artificial transparent sediment [71].
3. Conclusions and Further Perspectives
Much remains to be learnt regarding radial O2 loss from roots and the associated redox processes occurring in submerged substrates. The contribution of radial O2 loss to important bio-geochemical processes, including methane production/consumption, the oxidation of metals, the solubilization of metals, pH dynamics, and the development of microoxic zones for microbial activity, as well as possible drawbacks of the presence of barriers to radial O2 loss in agricultural crops, remains unclear. Different methods for qualitative and/or quantitative determinations of ROL from roots have been fundamental to our current understanding of this important biological process. Technical and practical knowledge, as well as the production of custom-made equipment, has been the main limitation for a broader use of these techniques for ROL determination in ecological studies. However, recent research progress, method development and the commercially available equipment needed for ROL determinations have opened the possibility to increase our current understanding of this topic. The integration of different techniques and analyses appears to be an excellent option to unravel complex chemical processes in submerged substrates. For example, the combined use of O2 planar optodes with diffusive gradients in thin films has been successfully used to demonstrate higher metal mobilization in a geochemical niche of higher O2 concentration and low pH adjacent to root tips of rice [72]. Moreover, the recent development of hyperspectral luminescence imaging, together with signal deconvolution analysis, enabled the development of a multi-indicator, high-resolution approach with simultaneous imaging of multiple analytes [73]. The techniques described here have been proved to be instrumental for a wide range of uses, from large population screening studies to single cell O2 determination. The combined use of the techniques described here would be key for understanding internal O2 dynamics and oxidation processes in wetland ecosystems. Moreover, the integration of the techniques for ROL determination with other cutting-edge technologies for plant phenotyping would be essential to study how plants develop and respond to adverse environmental conditions.
Supplementary Materials
The following are available online at https://www.mdpi.com/article/10.3390/plants10112322/s1: Supplementary information S1: methylene blue protocol, Supplementary information S2: root-sleeving electrodes protocol, Supplementary information S3: O2 microsensors protocol, Supplementary information S4: planar optodes protocol.
Author Contributions
J.d.l.C.J., E.P., O.P. and M.N. conceived and designed this paper. J.d.l.C.J. wrote the original draft. E.P., O.P. and M.N. revised the manuscript. All authors have read and agreed to the published version of the manuscript.
Funding
J.d.l.C.J. is grateful to the Japan Society for the Promotion of Science for a Postdoctoral Fellowship. E.P. received funding from the European Union’s Horizon 2020 research and innovation programme under the Marie Sklodowska-Curie grant agreement No 839542. O.P. was funded by The Danish International Development Agency, DANIDA (grant no. 19-03-KU), and Research Fund Denmark (grant no. 8021-00120B). M.N. was supported by Grant-in-Aid for Transformative Research Areas (A) JP20H05912.
Institutional Review Board Statement
Not applicable.
Informed Consent Statement
Not applicable.
Data Availability Statement
Not applicable.
Conflicts of Interest
The authors declare no conflict of interest.
References
- Armstrong, W. Aeration in Higher Plants. Adv. Bot. Res. 1980, 7, 225–332. [Google Scholar] [CrossRef]
- Ponnamperuma, F. The Chemistry of Submerged Soils. Adv. Agron. 1972, 24, 29–96. [Google Scholar] [CrossRef]
- Setter, T.; Belford, B. Waterlogging: How it reduces plant growth and how plant overcome its effects. J. Agric. West. Aust. 1990, 31, 51–55. [Google Scholar]
- Colmer, T.D. Long-distance transport of gases in plants: A perspective on internal aeration and radial oxygen loss from roots. Plant Cell Environ. 2003, 26, 17–36. [Google Scholar] [CrossRef] [Green Version]
- Armstrong, W.; Healy, M.T.; Lythe, S. Oxygen diffusion in pea II. Oxygen concentrations in the primary pea root apex as affected by growth, the production of laterals and radial oxygen loss. New Phytol. 1983, 94, 549–559. [Google Scholar] [CrossRef]
- Armstrong, W.; Beckett, P. Measurement and modelling of oxygen release from roots of Phragmites australis. In Constructed Wetlands in Water Pollution Control; Elsevier: Amsterdam, The Netherlands, 1990; pp. 41–51. [Google Scholar]
- Jiménez, J.d.l.C.; Clode, P.L.; Signorelli, S.; Veneklaas, E.J.; Colmer, T.D.; Kotula, L. The barrier to radial oxygen loss impedes the apoplastic entry of Fe into the roots of Urochloa humidicola. J. Exp. Bot. 2021, 72, 3279–3293. [Google Scholar] [CrossRef] [PubMed]
- Armstrong, W. Oxygen Diffusion from the Roots of Some British Bog Plants. Nat. Cell Biol. 1964, 204, 801–802. [Google Scholar] [CrossRef]
- Armstrong, W. The relationship between oxidation-reduction potentials and oxygen-diffusion levels in some waterlogged organic soils. J. Soil Sci. 1967, 18, 27–34. [Google Scholar] [CrossRef]
- Armstrong, W. Radial Oxygen Losses from Intact Rice Roots as Affected by Distance from the Apex, Respiration and Waterlogging. Physiol. Plant. 1971, 25, 192–197. [Google Scholar] [CrossRef]
- Colmer, T.D.; Gibberd, M.R.; Wiengweera, A.; Tinh, T.K. The barrier to radial oxygen loss from roots of rice (Oryza sativa L.) is induced by growth in stagnant solution. J. Exp. Bot. 1998, 49, 1431–1436. [Google Scholar] [CrossRef]
- Colmer, T.D. Aerenchyma and an Inducible Barrier to Radial Oxygen Loss Facilitate Root Aeration in Upland, Paddy and Deep-water Rice (Oryza sativa L.). Ann. Bot. 2003, 91, 301–309. [Google Scholar] [CrossRef] [PubMed] [Green Version]
- Colmer, T.D.; Cox, M.C.H.; Voesenek, L. Root aeration in rice (Oryza sativa): Evaluation of oxygen, carbon dioxide, and ethylene as possible regulators of root acclimatizations. New Phytol. 2006, 170, 767–778. [Google Scholar] [CrossRef] [PubMed]
- Rubinigg, M.; Stulen, I.; Elzenga, J.T.M.; Colmer, T.D. Spatial patterns of radial oxygen loss and nitrate net flux along adventitious roots of rice raised in aerated or stagnant solution. Funct. Plant Biol. 2002, 29, 1475–1481. [Google Scholar] [CrossRef]
- Kotula, L.; Ranathunge, K.; Schreiber, L.; Steudle, E. Functional and chemical comparison of apoplastic barriers to radial oxygen loss in roots of rice (Oryza sativa L.) grown in aerated or deoxygenated solution. J. Exp. Bot. 2009, 60, 2155–2167. [Google Scholar] [CrossRef] [PubMed]
- Kulichikhin, K.; Yamauchi, T.; Watanabe, K.; Nakazono, M. Biochemical and molecular characterization of rice (oryza satival.) roots forming a barrier to radial oxygen loss. Plant Cell Environ. 2014, 37, 2406–2420. [Google Scholar]
- Mongon, J.; Konnerup, D.; Colmer, T.D.; Rerkasem, B. Responses of rice to Fe2+ in aerated and stagnant conditions: Growth, root porosity and radial oxygen loss barrier. Funct. Plant Biol. 2014, 41, 922–929. [Google Scholar] [CrossRef]
- Shiono, K.; Ogawa, S.; Yamazaki, S.; Isoda, H.; Fujimura, T.; Nakazono, M.; Colmer, T. Contrasting dynamics of radial O2-loss barrier induction and aerenchyma formation in rice roots of two lengths. Ann. Bot. 2010, 107, 89–99. [Google Scholar] [CrossRef]
- Wu, C.; Ye, Z.; Li, H.; Wu, S.; Deng, D.; Zhu, Y.; Wong, M. Do radial oxygen loss and external aeration affect iron plaque formation and arsenic accumulation and speciation in rice? J. Exp. Bot. 2012, 63, 2961–2970. [Google Scholar] [CrossRef] [Green Version]
- Ejiri, M.; Sawazaki, Y.; Shiono, K. Some Accessions of Amazonian Wild Rice (Oryza glumaepatula) Constitutively Form a Barrier to Radial Oxygen Loss along Adventitious Roots under Aerated Conditions. Plants 2020, 9, 880. [Google Scholar] [CrossRef]
- Gibbs, J.; Turner, D.; Armstrong, W.; Darwent, M.; Greenway, H. Response to oxygen deficiency in primary maize roots. I. Development of oxygen deficiency in the stele reduces radial solute transport to the xylem. Funct. Plant Biol. 1998, 25, 745–758. [Google Scholar] [CrossRef]
- Colmer, T.D.; Greenway, H. Ion transport in seminal and adventitious roots of cereals during O2 deficiency. J. Exp. Bot. 2011, 62, 39–57. [Google Scholar] [CrossRef] [PubMed] [Green Version]
- Armstrong, W. Rhizosphere Oxidation in Rice and other Species: A Mathematical Model Based on the Oxygen Flux Component. Physiol. Plant. 1970, 23, 623–630. [Google Scholar] [CrossRef]
- Jiménez, J.d.l.C.; Kotula, L.; Veneklaas, E.J.; Colmer, T.D. Root-zone hypoxia reduces growth of the tropical forage grass Urochloa humidicola in high-nutrient but not low-nutrient conditions. Ann. Bot. 2019, 124, 1019–1032. [Google Scholar] [CrossRef]
- Armstrong, J.; Armstrong, W. Phragmites australis—A preliminary study of soil-oxidizing sites and internal gas transport pathways. New Phytol. 1988, 108, 373–382. [Google Scholar] [CrossRef]
- Kirk, G.J.D. Rice root properties for internal aeration and efficient nutrient acquisition in submerged soil. New Phytol. 2003, 159, 185–194. [Google Scholar] [CrossRef]
- Noorrohmah, S.; Takahashi, H.; Nakazono, M. Formation of a barrier to radial oxygen loss in L-type lateral roots of rice. Plant Root 2020, 14, 33–41. [Google Scholar] [CrossRef]
- Manzur, M.E.; Grimoldi, A.A.; Insausti, P.; Striker, G.G. Radial oxygen loss and physical barriers in relation to root tissue age in species with different types of aerenchyma. Funct. Plant Biol. 2015, 42, 9–17. [Google Scholar] [CrossRef]
- Kirk, G.J.; Boghi, A.; Affholder, M.; Keyes, S.D.; Heppell, J.; Roose, T. Soil carbon dioxide venting through rice roots. Plant Cell Environ. 2019, 42, 3197–3207. [Google Scholar] [CrossRef] [Green Version]
- Martin, B.C.; Bougoure, J.; Ryan, M.; Bennett, W.; Colmer, T.; Joyce, N.K.; Olsen, Y.; Kendrick, G. Oxygen loss from seagrass roots coincides with colonisation of sulphide-oxidising cable bacteria and reduces sulphide stress. ISME J. 2019, 13, 707–719. [Google Scholar] [CrossRef] [PubMed] [Green Version]
- Schmidt, H.; Eickhorst, T.; Tippkötter, R. Monitoring of root growth and redox conditions in paddy soil rhizotrons by redox electrodes and image analysis. Plant Soil 2011, 341, 221–232. [Google Scholar] [CrossRef]
- Maisch, M.; Lueder, U.; Kappler, A.; Schmidt, C. Iron Lung: How Rice Roots Induce Iron Redox Changes in the Rhizosphere and Create Niches for Microaerophilic Fe(II)-Oxidizing Bacteria. Environ. Sci. Technol. Lett. 2019, 6, 600–605. [Google Scholar] [CrossRef] [Green Version]
- Armstrong, J.; Armstrong, W. Rice: Sulfide-induced Barriers to Root Radial Oxygen Loss, Fe2+ and Water Uptake, and Lateral Root Emergence. Ann. Bot. 2005, 96, 625–638. [Google Scholar] [CrossRef] [PubMed] [Green Version]
- Abiko, T.; Kotula, L.; Shiono, K.; Malik, A.I.; Colmer, T.D.; Nakazono, M. Enhanced formation of aerenchyma and induction of a barrier to radial oxygen loss in adventitious roots of Zea nicaraguensis contribute to its waterlogging tolerance as compared with maize (Zea mays ssp. mays). Plant Cell Environ. 2012, 35, 1618–1630. [Google Scholar] [CrossRef] [PubMed]
- Kotula, L.; Schreiber, L.; Colmer, T.; Nakazono, M. Anatomical and biochemical characterisation of a barrier to radial O2 loss in adventitious roots of two contrasting Hordeum marinum accessions. Funct. Plant Biol. 2017, 44, 845–857. [Google Scholar] [CrossRef]
- Shiono, K.; Yamauchi, T.; Yamazaki, S.; Mohanty, B.; Malik, A.I.; Nagamura, Y.; Nishizawa, N.K.; Tsutsumi, N.; Colmer, T.D.; Nakazono, M. Microarray analysis of laser-microdissected tissues indicates the biosynthesis of suberin in the outer part of roots during formation of a barrier to radial oxygen loss in rice (Oryza sativa). J. Exp. Bot. 2014, 65, 4795–4806. [Google Scholar] [CrossRef] [PubMed] [Green Version]
- Watanabe, K.; Takahashi, H.; Sato, S.; Nishiuchi, S.; Omori, F.; Malik, A.I.; Colmer, T.D.; Mano, Y.; Nakazono, M. A major locus involved in the formation of the radial oxygen loss barrier in adventitious roots of teosinte Zea nicaraguensis is located on the short-arm of chromosome. Plant Cell Environ. 2017, 40, 304–316. [Google Scholar] [CrossRef] [Green Version]
- Colmer, T.D.; Kotula, L.; Malik, A.I.; Takahashi, H.; Konnerup, D.; Nakazono, M.; Pedersen, O. Rice acclimation to soil flooding: Low concentrations of organic acids can trigger a barrier to radial oxygen loss in roots. Plant Cell Environ. 2019, 42, 2183–2197. [Google Scholar] [CrossRef]
- Pedersen, O.; Nakayama, Y.; Yasue, H.; Kurokawa, Y.; Takahashi, H.; Floytrup, A.H.; Omori, F.; Mano, Y.; Colmer, T.D.; Nakazono, M. Lateral roots, in addition to adventitious roots, form a barrier to radial oxygen loss in Zea nicaraguensis and a chromosome segment introgression line in maize. New Phytol. 2021, 229, 94–105. [Google Scholar] [CrossRef] [PubMed]
- Armstrong, W. The Oxidising Activity of Roots in Waterlogged Soils. Physiol. Plant. 1967, 20, 920–926. [Google Scholar] [CrossRef]
- Kludze, H.K.; DeLaune, R.D.; Patrick, W.H. A Colorimetric Method for Assaying Dissolved Oxygen Loss from Container-Grown Rice Roots. Agron. J. 1994, 86, 483–487. [Google Scholar] [CrossRef]
- Sorrell, B.K. Effect of external oxygen demand on radial oxygen loss by Juncus roots in titanium citrate solutions. Plant Cell Environ. 1999, 22, 1587–1593. [Google Scholar] [CrossRef]
- Matsui, T.; Tsuchiya, T. A Method to Estimate Practical Radial Oxygen Loss of Wetland Plant Roots. Plant Soil 2006, 279, 119–128. [Google Scholar] [CrossRef]
- Yamauchi, T.; Abe, F.; Tsutsumi, N.; Nakazono, M. Root Cortex Provides a Venue for Gas-Space Formation and Is Essential for Plant Adaptation to Waterlogging. Front. Plant Sci. 2019, 10, 259. [Google Scholar] [CrossRef]
- Armstrong, W.; Wright, E.J. Radial Oxygen Loss from Roots: The Theoretical Basis for the Manipulation of Flux Data Obtained by the Cylindrical Platinum Electrode Technique. Physiol. Plant. 1975, 35, 21–26. [Google Scholar] [CrossRef]
- Kotula, L.; Steudle, E. Measurements of oxygen permeability coefficients of rice (Oryza sativa L.) roots using a new perfusion technique. J. Exp. Bot. 2008, 60, 567–580. [Google Scholar] [CrossRef] [Green Version]
- Revsbech, N.P. An oxygen microelectrode with a guard cathode. Limnol. Oceanogr. 1989, 34, 474–478. [Google Scholar] [CrossRef]
- Clark, L.C., Jr. Monitor and control of blood and tissue oxygen tensions. Trans. Am. Soc. Artif. Intern. Organs 1956, 2, 41–48. [Google Scholar]
- Klimant, I.; Meyer, V.; Kühl, M. Fiber-optic oxygen microsensors, a new tool in aquatic biology. Limnol. Oceanogr. 1995, 40, 1159–1165. [Google Scholar] [CrossRef] [Green Version]
- Pedersen, O.; Revsbech, N.P.; Shabala, S. Microsensors in plant biology: In vivo visualization of inorganic analytes with high spatial and/or temporal resolution. J. Exp. Bot. 2020, 71, 3941–3954. [Google Scholar] [CrossRef] [PubMed]
- Henriksen, G.H.; Raman, D.R.; Walker, L.P.; Spanswick, R.M. Measurement of Net Fluxes of Ammonium and Nitrate at the Surface of Barley Roots Using Ion-Selective Microelectrodes. Plant Physiol. 1992, 99, 734–747. [Google Scholar] [CrossRef] [PubMed] [Green Version]
- Peralta Ogorek, L.L.; Pellegrini, E.; Pedersen, O. Novel functions of the root barrier to radial oxygen loss—Radial diffusion resistance to H2 and water vapour. New Phytol. 2021, 231, 1365–1376. [Google Scholar] [CrossRef]
- Armstrong, W.; Cousins, D.; Turner, D.; Beckett, P.M. Oxygen Distribution in Wetland Plant Roots and Permeability Barriers to Gas-exchange with the Rhizosphere: A Microelectrode and Modelling Study with Phragmites australis. Ann. Bot. 2000, 86, 687–703. [Google Scholar] [CrossRef] [Green Version]
- Armstrong, W.; Beckett, P.M.; Colmer, T.; Setter, T.L.; Greenway, H. Tolerance of roots to low oxygen: ‘Anoxic’ cores, the phytoglobin-nitric oxide cycle, and energy or oxygen sensing. J. Plant Physiol. 2019, 239, 92–108. [Google Scholar] [CrossRef]
- Soukup, A.; Votrubová, O.; Čížková, H. Development of anatomical structure of roots of Phragmites australis. New Phytol. 2002, 153, 277–287. [Google Scholar] [CrossRef]
- Lassen, C.; Revsbech, N.P.; Pedersen, O. Macrophyte development and resuspension regulate the photosynthesis and production of benthic microalgae. Hydrobiologia 1997, 350, 1–11. [Google Scholar] [CrossRef]
- Gundersen, J.K.; Ramsing, N.B.; Glud, R.N. Predicting the signal of O2 microsensors from physical dimensions, temperature, salinity, and O2 concentration. Limnol. Oceanogr. 1998, 43, 1932–1937. [Google Scholar] [CrossRef]
- Larsen, M.; Borisov, S.M.; Grunwald, B.; Klimant, I.; Glud, R.N. A simple and inexpensive high resolution color ratiometric planar optode imaging approach: Application to oxygen and pH sensing. Limnol. Oceanogr. Methods 2011, 9, 348–360. [Google Scholar] [CrossRef]
- Glud, R.; Ramsing, N.; Gundersen, J.; Klimant, I. Planar optrodes:a new tool for fine scale measurements of two-dimensional O2 distribution in benthic communities. Mar. Ecol. Prog. Ser. 1996, 140, 217–226. [Google Scholar] [CrossRef]
- Santner, J.; Larsen, M.; Kreuzeder, A.; Glud, R.N. Two decades of chemical imaging of solutes in sediments and soils—A review. Anal. Chim. Acta 2015, 878, 9–42. [Google Scholar] [CrossRef] [Green Version]
- Holst, G.; Kohls, O.; Klimant, I.; König, B.; Kühl, M.; Richter, T. A modular luminescence lifetime imaging system for mapping oxygen distribution in biological samples. Sens. Actuators B Chem. 1998, 51, 163–170. [Google Scholar] [CrossRef]
- Liebsch, G.; Klimant, I.; Frank, B.; Holst, G.; Wolfbeis, O.S. Luminescence Lifetime Imaging of Oxygen, pH, and Carbon Dioxide Distribution Using Optical Sensors. Appl. Spectrosc. 2000, 54, 548–559. [Google Scholar] [CrossRef]
- Glud, R.N.; Tengberg, A.; Kühl, M.; Hall, P.O.J.; Klimant, I. An in situ instrument for planar O2 optode measurements at benthic interfaces. Limnol. Oceanogr. 2001, 46, 2073–2080. [Google Scholar] [CrossRef] [Green Version]
- Fischer, J.P.; Wenzhöfer, F. A novel planar optode setup for concurrent oxygen and light field imaging: Application to a benthic phototrophic community. Limnol. Oceanogr. Methods 2010, 8, 254–268. [Google Scholar] [CrossRef] [Green Version]
- Larsen, M.; Santner, J.; Oburger, E.; Wenzel, W.W.; Glud, R.N. O2 dynamics in the rhizosphere of young rice plants (Oryza sativa L.) as studied by planar optodes. Plant Soil 2015, 390, 279–292. [Google Scholar] [CrossRef] [Green Version]
- Frederiksen, M.S.; Glud, R.N. Oxygen dynamics in the rhizosphere of Zostera marina: A two-dimensional planar optode study. Limnol. Oceanogr. 2006, 51, 1072–1083. [Google Scholar] [CrossRef] [Green Version]
- Jovanovic, Z.; Larsen, M.; Kristensen, E.; Glud, R.; Pedersen, M. Rhizosphere O2 dynamics in young Zostera marina and Ruppia maritima. Mar. Ecol. Prog. Ser. 2015, 518, 95–105. [Google Scholar] [CrossRef] [Green Version]
- Jensen, S.I.; Kühl, M.; Glud, R.N.; Jørgensen, L.B.; Priemé, A. Oxic microzones and radial oxygen loss from roots of Zostera marina. Mar. Ecol. Prog. Ser. 2005, 293, 49–58. [Google Scholar] [CrossRef]
- Glud, R.N. Oxygen dynamics of marine sediments. Mar. Biol. Res. 2008, 4, 243–289. [Google Scholar] [CrossRef]
- Quaranta, M.; Borisov, S.; Klimant, I. Indicators for optical oxygen sensors. Bioanal. Rev. 2012, 4, 115–157. [Google Scholar] [CrossRef] [Green Version]
- Koren, K.; Brodersen, K.E.; Jakobsen, S.L.; Kühl, M. Optical Sensor Nanoparticles in Artificial Sediments–A New Tool To Visualize O2 Dynamics around the Rhizome and Roots of Seagrasses. Environ. Sci. Technol. 2015, 49, 2286–2292. [Google Scholar] [CrossRef]
- Williams, P.N.; Santner, J.; Larsen, M.; Lehto, N.J.; Oburger, E.; Wenzel, W.; Glud, R.N.; Davison, W.; Zhang, H. Localized Flux Maxima of Arsenic, Lead, and Iron around Root Apices in Flooded Lowland Rice. Environ. Sci. Technol. 2014, 48, 8498–8506. [Google Scholar] [CrossRef] [PubMed]
- Zieger, S.E.; Mosshammer, M.; Kühl, M.; Koren, K. Hyperspectral Luminescence Imaging in Combination with Signal Deconvolution Enables Reliable Multi-Indicator-Based Chemical Sensing. ACS Sens. 2021, 6, 183–191. [Google Scholar] [CrossRef] [PubMed]
Figure 1.
Radial O2 loss from individual adventitious roots of rice grown in aerated or stagnant, deoxygenated conditions. In aerated nutrient solution, rice does not form an ROL barrier (with the exception of some wild accessions [20]), whereas the barrier is formed in stagnant, deoxygenated nutrient solution. Points indicate mean radial O2 loss at different distances behind the root tip and bands represent standard error (figure was constructed compiling published information on ROL from rice roots [11,12,13,14,15,16,17,18,19,20], n = 28). Plants were grown in aerated or stagnant, deoxygenated conditions for 5 to 31 days. Lengths of the roots were 93 to 159 mm.

Figure 2.
Colorimetric methylene blue method for root radial O2 loss determination. (A) General set-up including photo chamber filled with deoxygenated solution and reduced methylene blue dye. Intact rice plants are inserted and fixed to the photo chamber. Light panels in A are provided to ensure photosynthesis and internal O2 transport and for enhanced photo collection. (B) Rice roots with no barriers to ROL. (C) Rice roots with barriers to ROL. (D) Sites of O2 loss through root ‘windows’ of developing laterals (arrows). Rice plants in A and B were grown for 28 days in aerated or stagnant, deoxygenated solutions, respectively. Rice plants in D were grown for one week in aerated solutions with high concentration of Fe (300 µM). Arrowheads in B and C point to blue halos where O2 loss is occurring.

Figure 3.
Polarographic method for radial O2 loss determination in roots. (A) General set-up including a transparent acrylic chamber filled with deoxygenated solution and the roots of an intact rice plant submerged. Different electrodes (see text for details) are inserted into the deoxygenated solution and connected to a polarograph. (B) Current–voltage curve for O2 determination in solutions. (C) Close-up of a root inserted into a Pt-sleeving electrode. (D) Diffusion current from the Pt-sleeving electrode. Arrowhead in B points to current plateau where the rate of O2 reduction is independent of voltage and only depends on the rate of O2 diffusion to the cylindrical electrode surface. Arrows in D indicate the points when Pt-sleeving electrode was moved in 10 mm steps from basal parts toward the tip of a root of Hordeum marinum grown in aerated solutions. Note the time taken for current stabilization before a new measurement.

Figure 4.
O2 microelectrodes and O2 micro-optodes for ROL determination from roots. (A) Clark-type O2 microelectrode with guard cathode. (B) O2 micro-optode. (C) General set-up including a transparent acrylic chamber filled with deoxygenated solution and the submerged roots (detached) of a rice plant. The O2 microelectrode (to obtain spatial concentration profiles) and the O2 micro-optode (to follow the O2 in the bulk) are mounted in a motorized stage and connected to a picoammeter and an optode meter, respectively. (D) Close-up of an O2 microelectrode near the root surface of Zea nicaraguensis. (E) Characteristic O2 gradients from roots without a barrier (roots from Zea nicaraguensis plants grown in aerated nutrient solutions for 25 days, left) and a tight barrier to ROL (roots from Zea nicaraguensis plants grown in staganant, deoxygenated nutrient solutions for 25 days, right). Arrow in C points to O2 microelectrode, arrowhead to temperature sensor and asterisk key to O2 micro-optode. Arrow in D shows the tip of an O2 microelectrode.

Figure 5.
Planar optodes for ROL determination from roots. (A) General set-up, including a chamber filled with anoxic medium and the roots of an intact rice plant submerged, a digital camera, blue LED lights and software for image analysis (see text and Supplementary Information S4 for details). (B) Image collection process in darkness. (C) O2 planar optode image indicating differences in ROL in roots of Puccinellia festuciformis grown in aerated conditions for 5 weeks. (D) ROL quantification in the regions of interest. Oxygen concentrations in (D) refer to specific positions of the root, as shown in (C).


Table 1.
Qualitative and quantitative methods for determination of radial O2 loss from roots.
| Technique | Indication | Advantages | Disadvantages |
|---|---|---|---|
| Methylene blue staining | Qualitative | Cheapest and quickest method; rapid screening approach for a large number of plants | Qualitative nature; unknown detection limit |
| Polarographic cylindrical O2 electrodes | Quantitative | Accurate quantification of very small amounts of radial fluxes of O2 | Use of custom-built equipment is necessary; frequent calibration is needed; time-consuming method |
| Clark-type O2 microelectrodes | Quantitative | Commercially available; rapid and accurate O2 quantification; linear response to O2; resolution to tissue and cell level; appropriate for penetration into tissues | Relatively short lifetime (especially in <10 µm sensors); expensive equipment and frequent calibration needed; signal can be affected by chemical compounds and electrical noise |
| O2 micro-optodes | Quantitative | Commercially available; rapid and precise O2 quantification; resolution to tissue level; long lifetime | Possible interferences with inorganic substances; low signal to noise ratio at high O2 concentrations; not suitable for penetration into tissue |
| Planar optodes | Qualitative and Quantitative | Quantitative and qualitative 2D determination of O2 | Custom-built equipment and technical knowledge needed; non-linear response to O2 |
Publisher’s Note: MDPI stays neutral with regard to jurisdictional claims in published maps and institutional affiliations. |
© 2021 by the authors. Licensee MDPI, Basel, Switzerland. This article is an open access article distributed under the terms and conditions of the Creative Commons Attribution (CC BY) license (https://creativecommons.org/licenses/by/4.0/).
Share and Cite
MDPI and ACS Style
Jiménez, J.d.l.C.; Pellegrini, E.; Pedersen, O.; Nakazono, M. Radial Oxygen Loss from Plant Roots—Methods. Plants 2021, 10, 2322. https://doi.org/10.3390/plants10112322
AMA Style
Jiménez JdlC, Pellegrini E, Pedersen O, Nakazono M. Radial Oxygen Loss from Plant Roots—Methods. Plants. 2021; 10(11):2322. https://doi.org/10.3390/plants10112322
Chicago/Turabian StyleJiménez, Juan de la Cruz, Elisa Pellegrini, Ole Pedersen, and Mikio Nakazono. 2021. "Radial Oxygen Loss from Plant Roots—Methods" Plants 10, no. 11: 2322. https://doi.org/10.3390/plants10112322
Note that from the first issue of 2016, this journal uses article numbers instead of page numbers. See further details here.