
Image-Based Automatic Individual Identification of Fish without Obvious Patterns on the Body (Scale Pattern)


Laboratory of Signal and Image Processing, Institute of Complex Systems, Faculty of Fisheries and Protection of Waters, CENAKVA, University of South Bohemia in Ceske Budejovice, Zámek 136, 373 33 Nové Hrady, Czech Republic
*
Author to whom correspondence should be addressed.
Appl. Sci. 2022, 12(11), 5401; https://doi.org/10.3390/app12115401
Submission received: 4 May 2022
/
Revised: 19 May 2022
/
Accepted: 24 May 2022
/
Published: 26 May 2022
(This article belongs to the Topic Computer Vision and Image Processing)
Abstract
:The precision fish farming concept has been widely investigated in research and is highly desirable in aquaculture as it creates opportunities for precisely controlling and monitoring fish cultivation processes and increasing fish welfare. The automatic identification of individual fish could be one of the keys to enabling individual fish treatment. In a previous study, we already demonstrated that the visible patterns on a fish’s body can be used for the non-invasive individual identification of fishes from the same species (with obvious skin patterns, such as salmonids) over long-term periods. The aim of this study was to verify the possibility of using fully-automatic non-invasive photo-identification of individual fish based on natural marks on the fish’s body without any obvious skin patterns. This approach is an alternative to stressful invasive tagging and marking techniques. Scale patterns on the body and operculum, as well as lateral line shapes, were used as discriminative features for the identification of individuals in a closed group of fish. We used two fish species: the European seabass Dicentrarchus labrax and the common carp Cyprinus carpio. The identification method was tested on four experimental data sets for each fish species: two separate short-term data sets (pattern variability test) and two long-term data sets (pattern stability test) for European seabass (300 individual fish) and common carp (32 individual fish). The accuracy of classification was 100% for both fish species in both the short-term and long-term experiments. According to these results, the methods used for automatic non-invasive image-based individual-fish identification can also be used for fish species without obvious skin patterns.
1. Introduction
The use of automatization systems in aquaculture is not novel but is becoming increasingly necessary to reduce human maintenance. The precision fish farming concept [1] is based on automation processes, in which controlled-engineering principles are applied to fish-production processes, which increases fish farmers’ abilities to control and monitor all stages of fish cultivation. This process enables farmers to make data-based decisions. The applications of automation in fish cultivation are very broad and include feeding control, fish welfare and disease monitoring, fish sampling, and fish sorting.
Automatization has also been used in many biological research studies. For example, new technologies (camera based system and automatized image processing) were successfully applied to fish behavior and welfare monitoring [2,3,4]. One main advantage of using such novel technologies is fully automated data processing. For example, Zhou et al. [5] developed an automatic monitoring system for feed consumption to maintain high-quality water parameters for fish welfare. In such studies, it would be beneficial to obtain information on individual fish, to monitor and maintain individual fish instead of fish groups. Individual identification is a broad research area that is related to humans and other animals (e.g., cows and whales) [6,7]. Individual identification has also been applied to fish with significant differences to other species due to challenging aquaculture conditions. Identification is a standard research approach as it allows one to individualize the fish. Currently, there are very limited options for the real-time identification of individuals under real conditions (in tanks and cages). Solving the issue of real-time individual identification under real-world conditions would open a new area of research for individual fish treatment. Our study was focused on testing if the non-invasive (photo) identification of individual fish without obvious pattern could work, and moreover, on testing the stability of chosen features on a fish body during the cultivation period.
The most widely used method for individual-fish identification is invasive tagging [8]. There are many negative impacts of tagging, such as being traumatic for the fish (as it is an invasive method), increasing mortality and injury, being a time consuming procedure, applicability to limited fish sizes, and the need to catch fish for tagging and identification [9,10]. Modern methods of individual-fish identification based on non-invasive principles, such as photo identification, can minimize all the negative consequences of tagging. Photo-recognition is often used not only as a tool to track morphological changes and behavioral monitoring but also for individual identification [11]. The principle of photo recognition has already been successfully used for fish species identification. Fish species identification methods are very broad, but the main criteria for classification are morphological and meristic features [12,13].
Several species identification systems were developed for use under real conditions and in real time [14,15,16]. At present, the most popular method for species identification is the deep learning approach [17,18]. This approach has been very successful, but the limitations of this approach include the need for a large number (hundreds/thousands) of training examples.
The identification of individuals of the same species is a more challenging task than the identification of species. Typically, few images of an individual are available, and the similarities within one species are much higher than the similarities between species. Several studies demonstrated that non-invasive photo-based identification of individual fish is possible for different fish species, such as catshark (Scyliorhinus canicular) [19], zebrafish (Danio rerio) [20], Eurasian perch (Perca fluviatilis) [21], common carp (Cypinus carpio) [22], Atlantic salmon (Salmo salar) [23], brown trout (Salmo trutta) [24], whale shark, white shark, and spotted-edge ray [25]. The stability of the chromatophore and melanophore patterns of individuals has also been studied [23,26]. Identification approaches are based on visible patterns on the fish’s body (stripes, dots, iris of the eye). Previous studies were performed with relatively low numbers of individual (maximum 30) but demonstrated that skin and eye patterns are unique and can be used for identification. It was also confirmed that these patterns are stable for reasonable time periods (several months) of fish cultivation. The common factor of these studies is the use of manual or semi-automatic image processing. This means that identification must be performed by human experts, which is time consuming and not practical for automation in commercial aquaculture.
The objective of this research was to test the method of non-invasive individual identification of the fish without a pattern on their body from the images and see if this approach is stable within a certain time.
Therefore, in this study, we developed a fully automatic approach for the machine-vison photo-identification of individual fish and demonstrated this method on the ornamental fish Sumatra Barb [27]. This automatic approach uses the unique position of stripes on a fish’s body for identification. This work studied 43 ornamental fish only; therefore, we updated the approach for the commercial species of Atlantic salmon. We [28] developed an automated system for individual-fish identification using a fisheye pattern. The identification accuracy was over 95% for 330 individuals over a short-term period. The long-term stability of the iris pattern was also studied for two, four, and six months of fish cultivation. The identification accuracy for 30 fish varied from 31% to 80%, decreasing with cultivation time. Ultimately, we focused on automatic identification based on the skin dots of Atlantic Salmon within the same fish collection. We [29] developed an approach combining convolutional neural networks for the detection of skin dots and dot distances, which were used for the identification. The identification accuracy was 100% for 328 fish under short-term cultivation and 100% for 30 fish under long-term cultivation (six months). We demonstrated that the skin patterns should be stable and unique for automatic long-term (six months) individual-fish identification and that this technique can be used as substitute for fish tagging. There are also other commercially important species such as the common carp Cyprinus carpio and European seabass Dicentrarchus labrax that do not have any obvious skin patterns and do not need individual identification. Some studies showed that the pattern of the scale position can be used for individual-fish identification. In a previous study [30], a rhombic squamation pattern was used to identify two genera of fish. The best results of the MANCOVA test (p = 0.079) were effective in detecting differences in the rhombic lamination patterns of scale between species, and cross-validated quadratic discriminant analyses (DAs) provided values of 75.8% (p = 0.001) based on the shape and 75.8% based on the form. Huntingford et al. [22] demonstrated the possibility of identifying individual common carp using the scale position. Both studies were conducted manually by humans. The aim of this paper is to show that automatic photo-based identification is possible based on the patterns of the scale position without any other distinctive features.
Organization of the paper follows the chapters: Introduction; materials and methods (which consists of the information about experimental animals, design of experiments, used methods and setups); results; discussion; and conclusions, limitations, and future research.
2. Materials and Methods
2.1. Experimental Animal
Two important and economically beneficial commercial fish species were used in this study: European seabass, as representative of marine aquaculture; and common carp, representing freshwater aquaculture.
2.1.1. European Seabass
Data were collected at the Institute of Marine Biology, Biotechnology and Aquaculture (IMBBC), Hellenic Centre for Marine Research (HCMR) in Heraklion, Greece. In total, 300 sea bass were used during the experiment. The initial fish size was 70–90 g for approximately one-year old fish. Three-hundred fish were used for testing short-term identification (short-term experiment (ST)). Thirty-two individual fish were selected from among the 300 fish and tagged with PIT tags (Trovan, 2 × 11.5 mm, ISO 11784/85 FDX-B) for the long-term experiment (LT) to test the stability of the chosen patterns for individual identification during the cultivation period. The 32 fish were moved to a separate tank (500 l) for two months and kept under standard cultivation conditions.
2.1.2. Common Carp
Fish for the experiment were cultivated in our laboratory at the Institute of Complex systems in Nove Hrady, Czech Republic, in a recirculation aquaculture system (RAS). Thirty-two individual fish of common carp were used during our study. The initial fish size was 347 ± 126 g. The age of the carp was approximately two years. All 32 fish were tagged by the same PIT tags used for sea bass. The fish were cultivated under standard cultivation conditions for four months in the RAS system.
2.2. Experimental Setup and Data Sets
Two rounds of data collection were performed during the two months of the seabass identification experiment. Images were taken of the whole fish out of water (lateral view of the left fish side, Figure 1). Each fish was caught in the cultivation tank, anesthetized in a bucket using Phenoxyethanol, and moved to a green background (Figure 1) for imaging. Natural light conditions were used during data collection. Ten images of each individual were taken using a Nikon D90 digital camera for each round of data collection. Each fish was moved and rotated on the green background to simulate different object–camera positions and angles. The fish head was oriented to the left for all images. There was no obvious pattern on the fish (both sea bass and carp). The main pattern was a lateral line for seabass. For some fish, this line was interrupted (Figure 1, top). Some fish were also scratched on the body. These scratches were visible as lines on the body (Figure 1, middle). Parts of the tail and fins were sometimes missing due to fish cannibalism (Figure 1, bottom). Pictures were saved in the RAW format. The manual camera mode was used to control the focus, shutter, and ISO. The resolution of each picture was 4288 × 2848 pixels, with 12 bits/pixel and 3 color channels.
In the first round of data collection, all 300 fish were photographed, and this set was labelled as the short-term seabass (STS) database. The 32 randomly-selected fish were PIT-tagged and separated into RAS. The rest of the fish were returned to the tanks. All fish recovered after the experiment.
After two months, the second round of data collection was performed with 32 fish. The procedure was the same as that for the short-term experiment (STS).
Common Carp
Four rounds of data collection were performed over the four-month experiment for carp identification. Images were taken of the whole fish out of water (lateral view of the left fish side, Figure 1). Each fish was caught in the cultivation tank, anesthetized in a bucket using clave oil, and moved to the green background (Figure 2) for imaging. A single-layer white-fabric photographic tent with controlled illumination was used for photography. The fish heads were oriented to the left for all images.
2.3. Data Processing: Identification Procedure
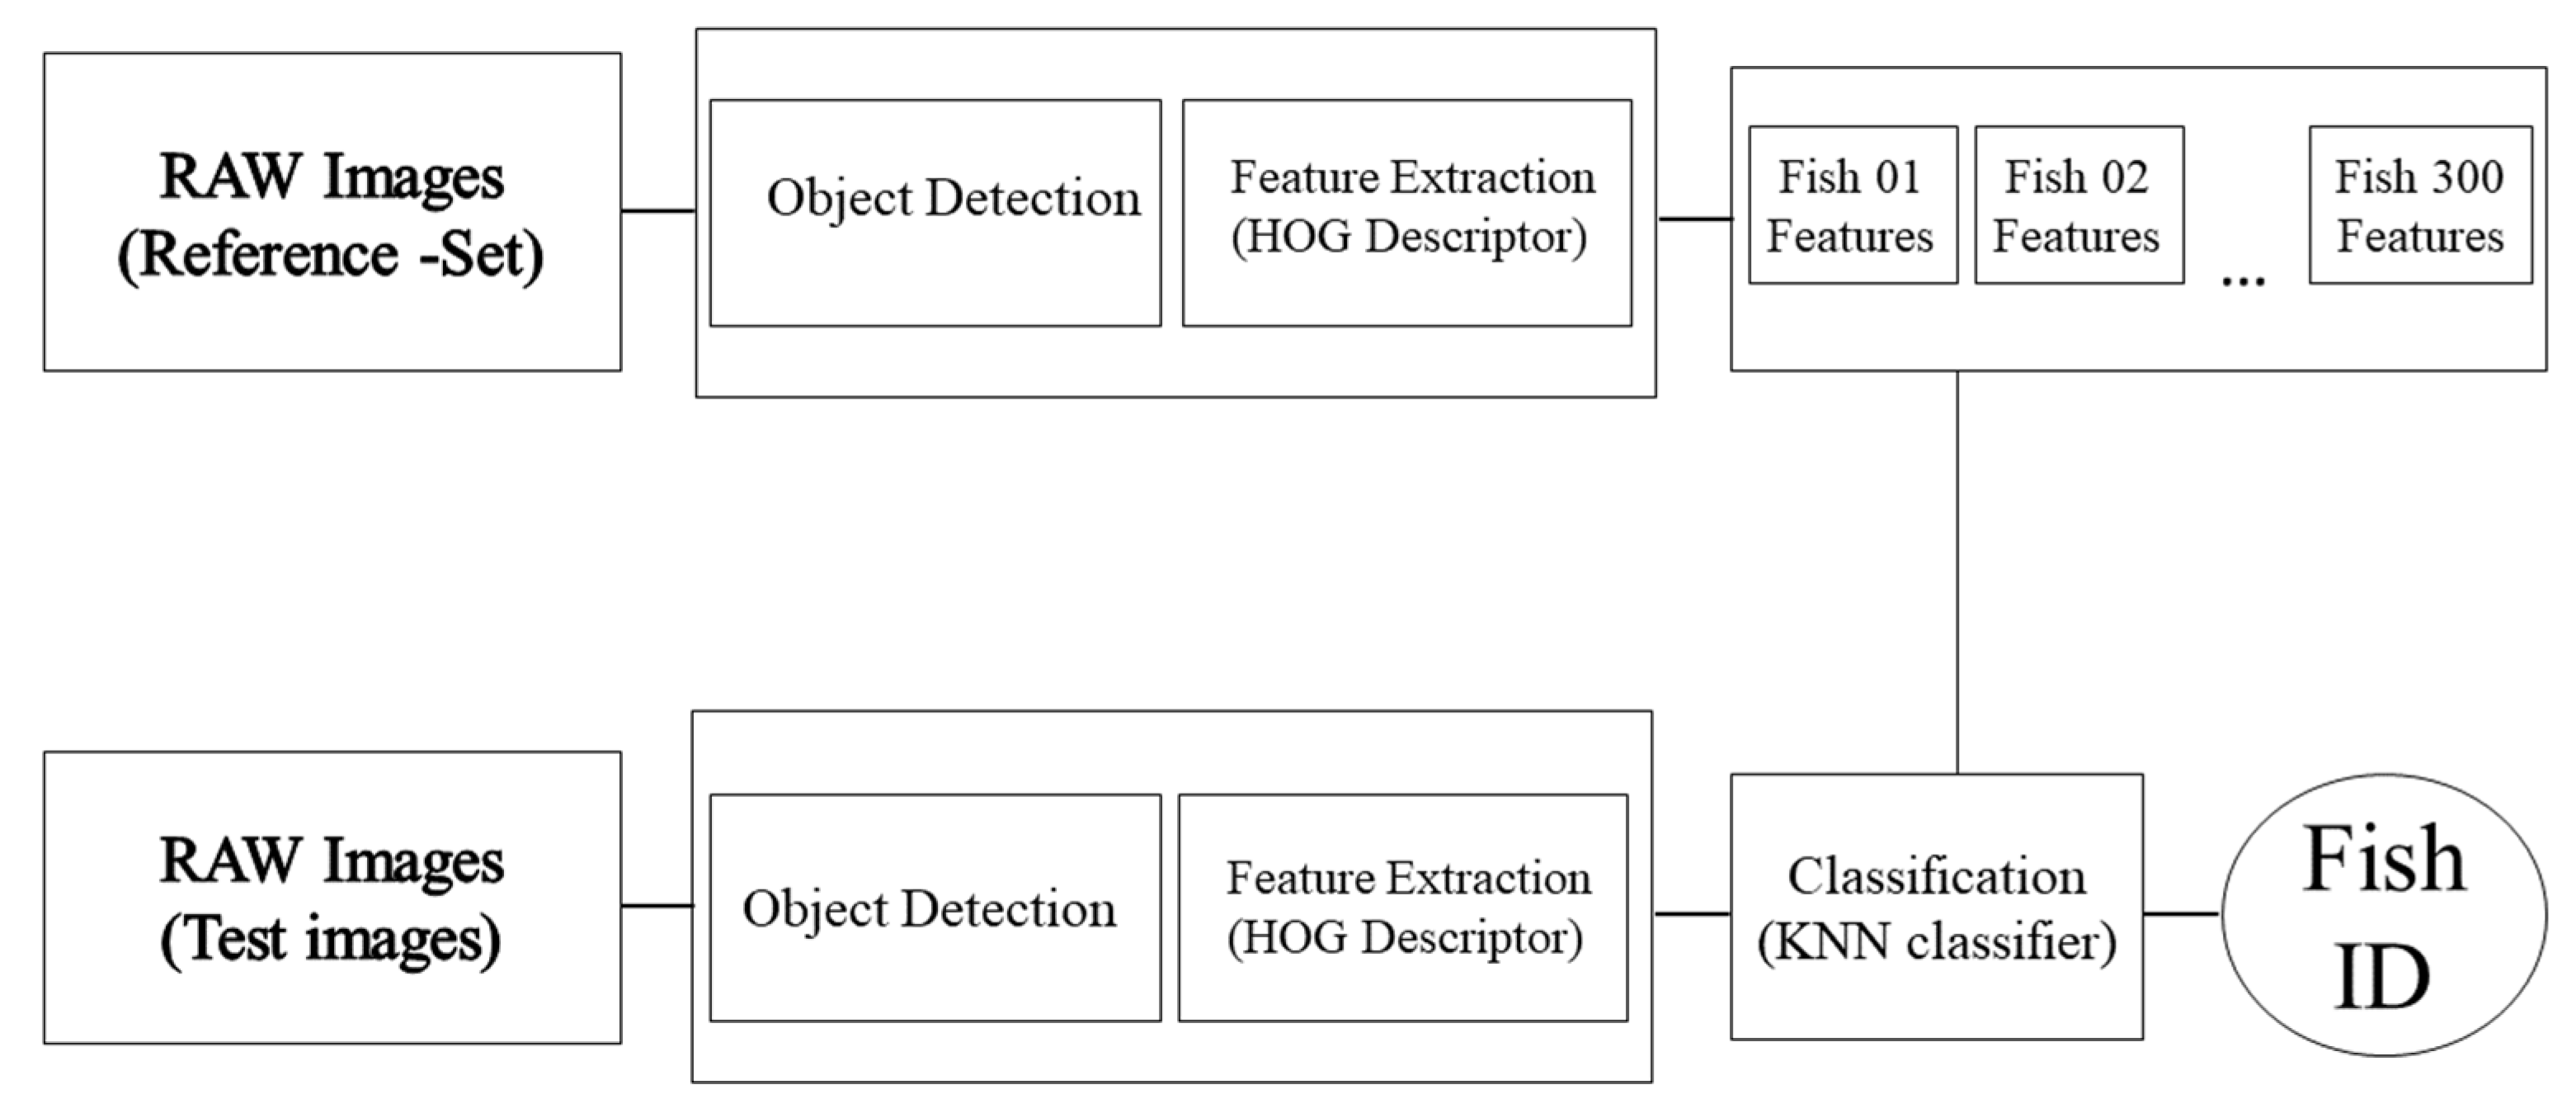
Automatic data processing consisted of three steps: fish detection, region of interest (ROI) selection, and feature extraction to describe the skin patterns of the ROI (Figure 3). The image-processing methods implemented in MATLAB R2020b were used for data processing. First, the images were converted from the RAW format to the PNG format.
2.3.1. Fish Detection and Feature Extraction
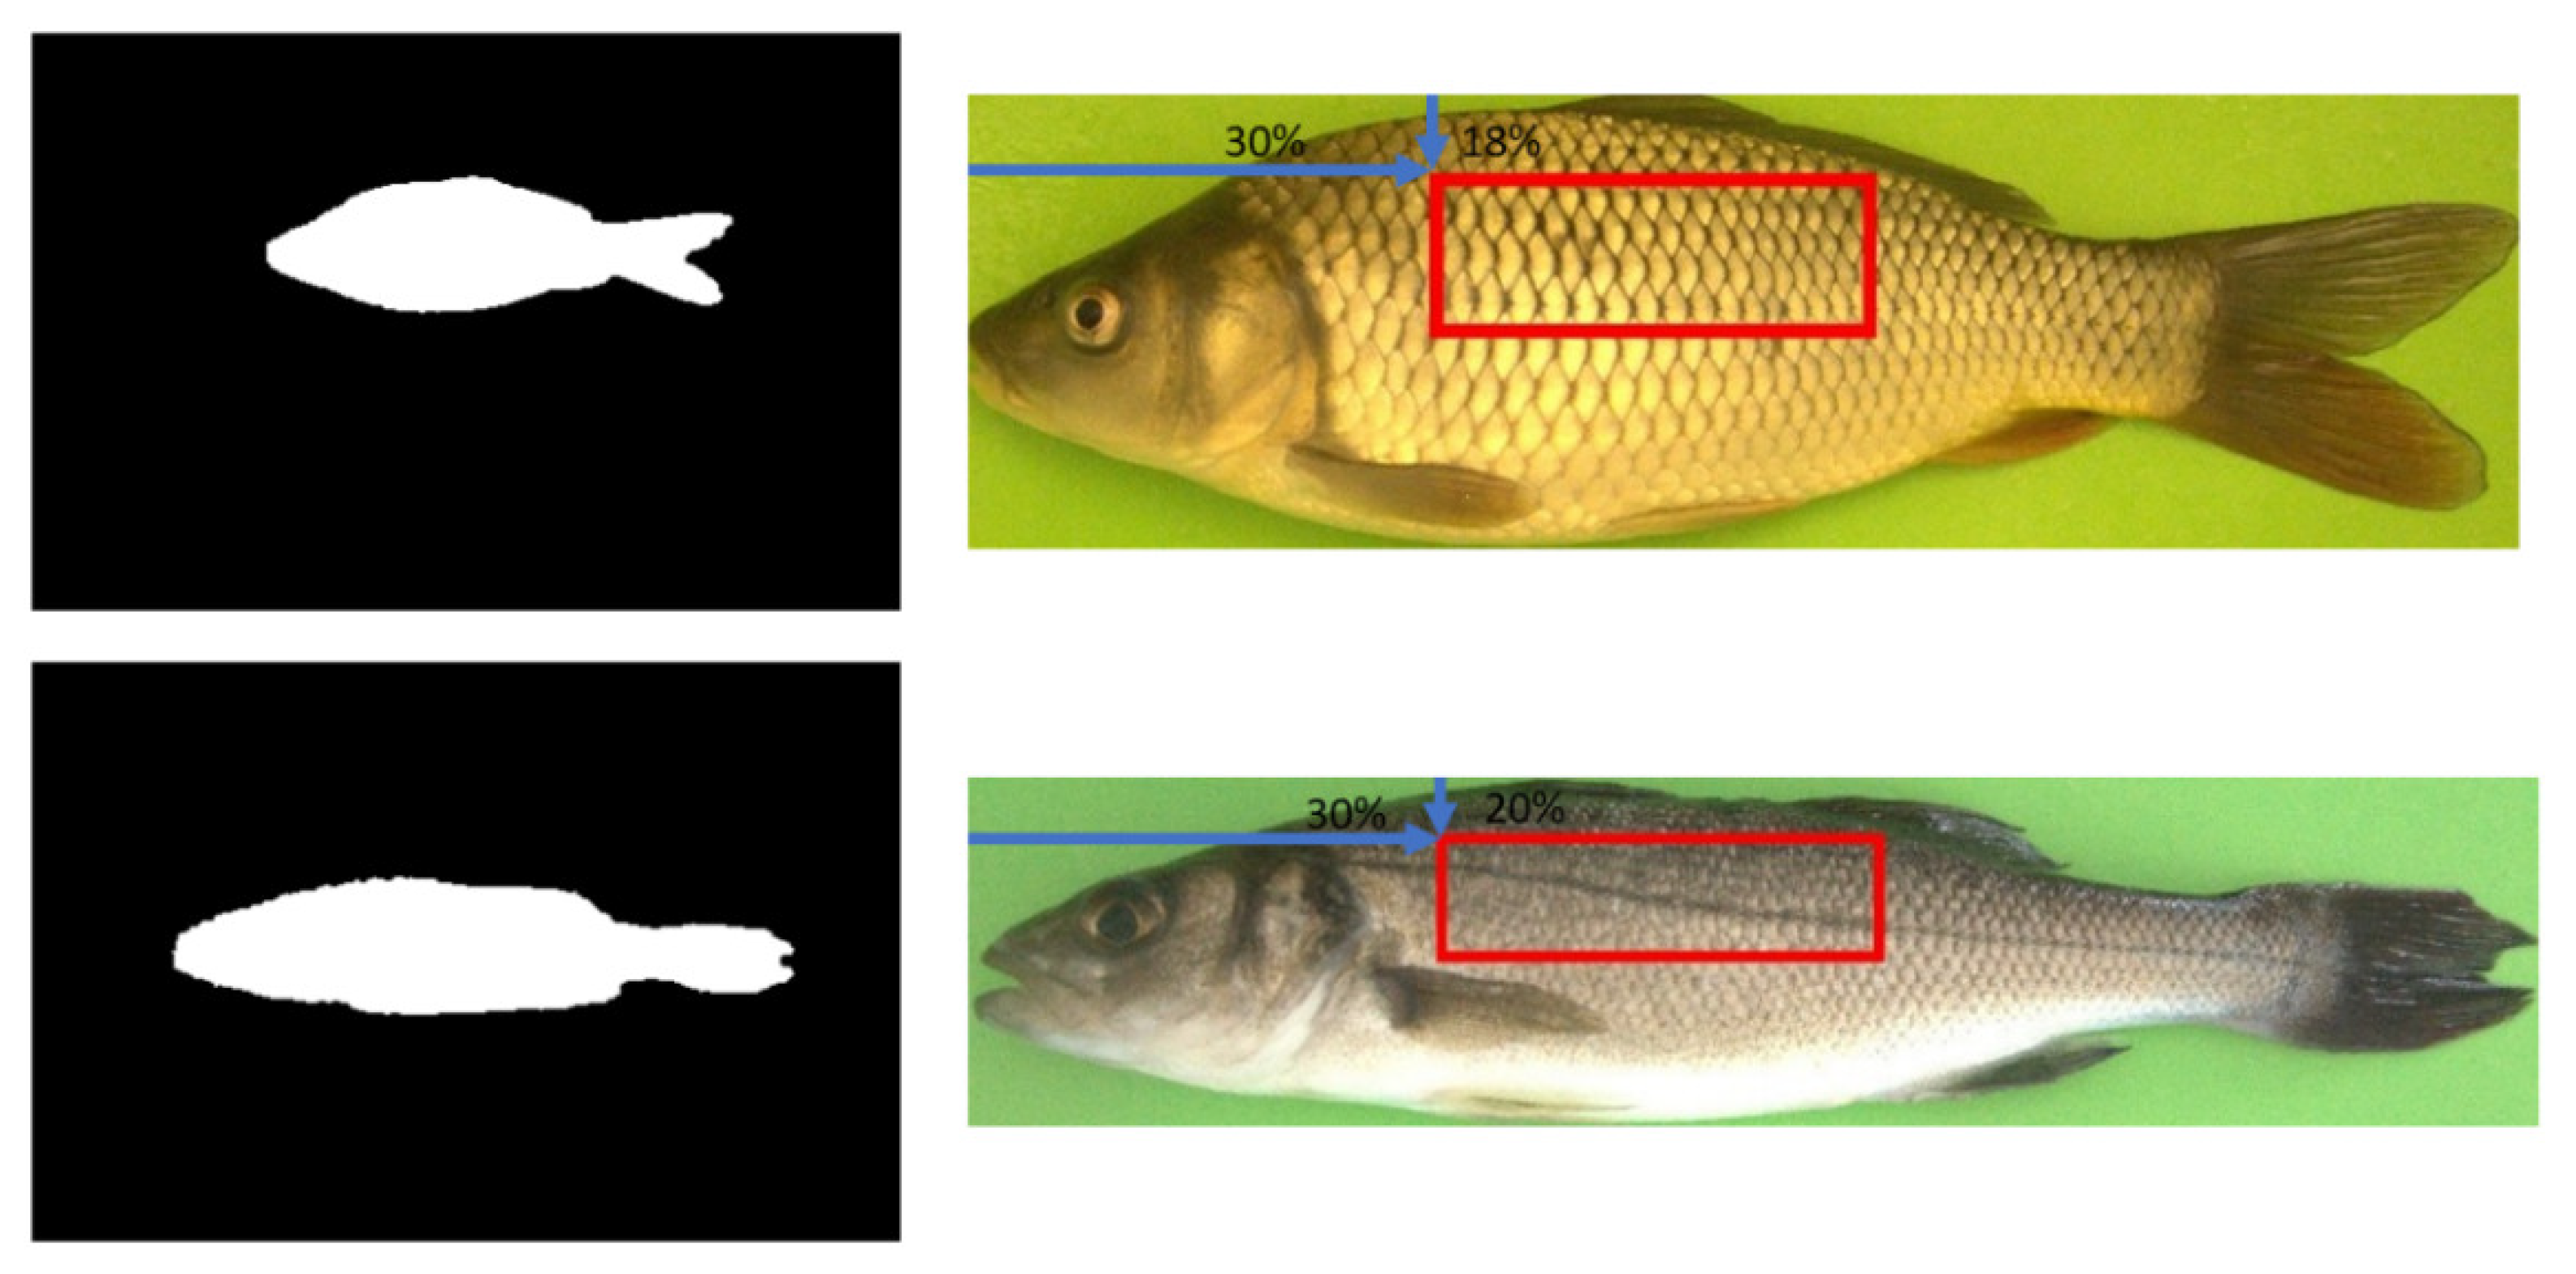
The detection of the fish body was based on subtracting the background (green) followed by detecting the object (the largest) inside the area of the background. The area of the background was detected as an object with a known color based on the hue, saturation, value (HSV) representation of the image [31]. The hue and saturation channels were used for segmentation. The rest of the pixels belonged to the fish. Then, size-based noise filtration was used to remove the pixels that did not represent the fish. The morphological close operation (the MATLAB R2020b function imclose) was applied to the filtered image to connect the fish body parts that could be divided during the segmentation procedure. The output image was represented as a binary mask of the fish object. Fish body rotation was estimated via the MATLAB R2020b function regionprops (‘Orientation’) to align the fish horizontally. The final fish mask contained the full fish body (Figure 4, left images). The mask was used for localization of the fish in the original color image.
The height and width of the fish object bounding box was then used for specific ROI localization. Each ROI was defined as a rectangle with a relative location to the fish bounding box to eliminate scaling and fish growth. Examples of ROI localization are shown in Figure 4.
2.3.2. European Seabass ROIs
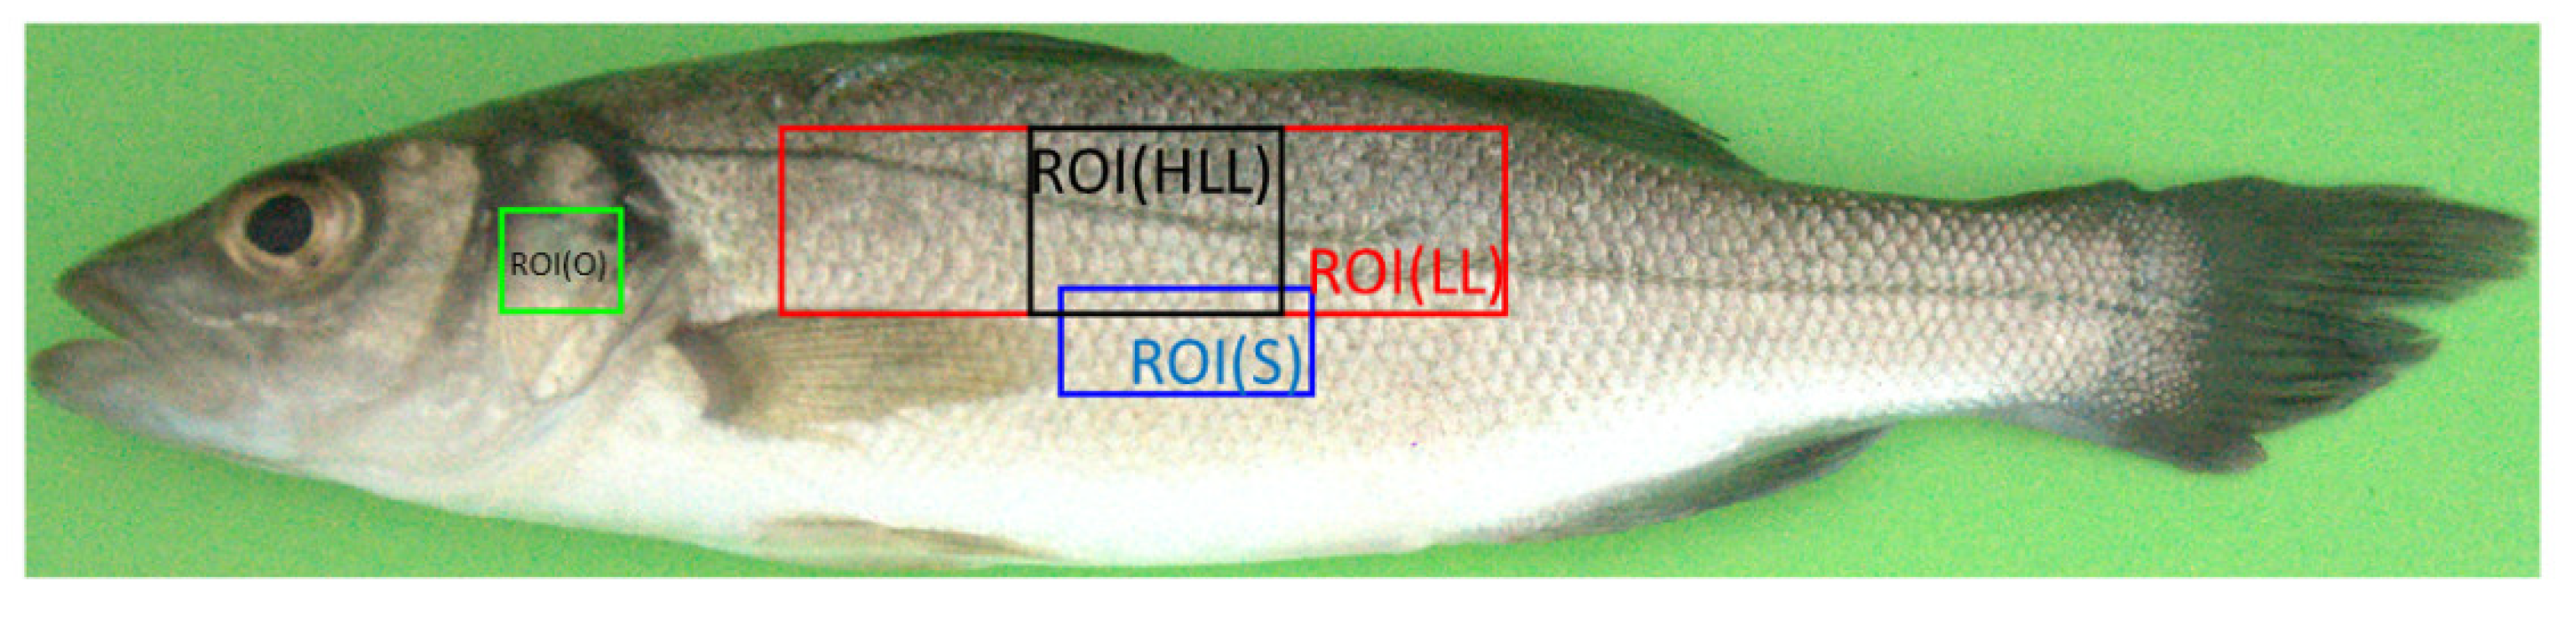
Four different ROIs (different parts of the body) were used to identify seabass individuals (Figure 5). ROI(LL) refers to the part of the fish body covering the lateral line and some parts of the body with scales in the top-left corner, encompassing 30% of the fish’s length (FL) from the left border and 20% of the fish’s height (FH) from the top border (see Figure 4). The right bottom corner was 59% of the FL from the left border and 53% of the FH from the top border. ROI(O) refers to the region of the body that covers the operculum. The top-left corner was 19% of the FL from the left border and 24% of the FH from the top border. The right bottom corner was 34% of the FL from the left border and 52% of the FH from the top border. ROI(HLL) was half of the ROI(LL)). The top-left corner was 40% of the FL from the left border and 20% of the FH from the top border. The right bottom corner was 50% of the FL from the left border and 53% of the FH from the top border. ROI(S) covers only scales under the lateral line. The top-left corner was 41% of the FL from the left border and 48% of the FH from the top border. The right bottom corner was 51% of the FL from the left border and 67% of the FH from the top border.
2.3.3. Common Carp ROIs
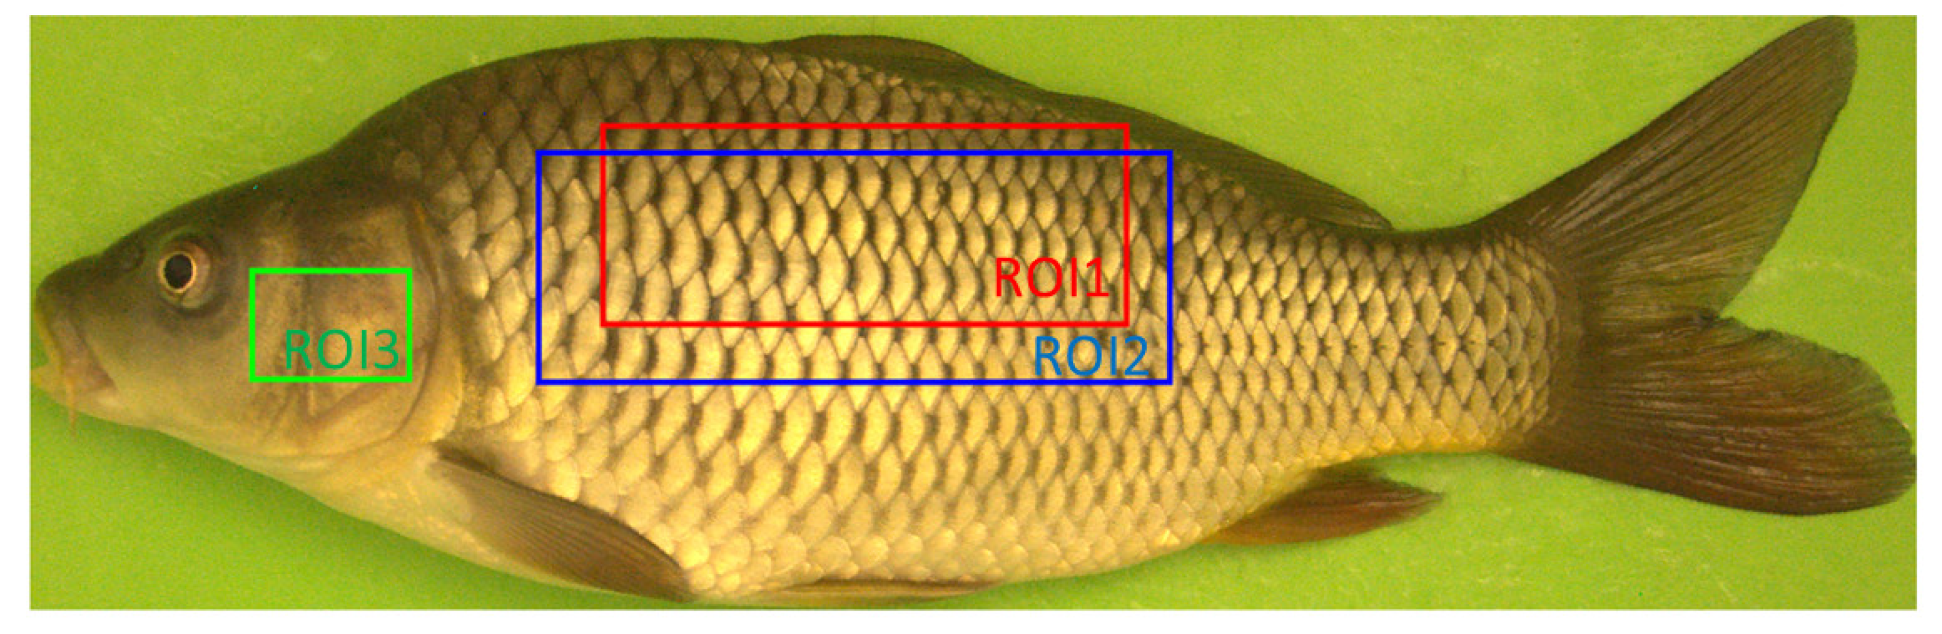
For carp identification, we used three different ROIs (Figure 6). ROI1 covers the body of the fish from the side (only the scales). The top-left corner is 30% of the fish’s length (FL) from the left border and 18% of the fish’s height (FH) from the top border (see Figure 4). The right-bottom corner is 58% of the FL from the left border and 52% of the FH from the top border. ROI2 refers to the same part of the body but longer and wider. The top-left corner is 27% of the fish’s length (FL) from the left border and 23% of the fish’s height (FH) from the top border. The right-bottom corner is 60% of the FL from the left border and 62% of the FH from the top border. ROI3 is the operculum part of the carp. The top-left corner is 12% of the fish’s length (FL) from the left border and 43% of the fish’s height (FH) from the top border. The right-bottom corner is 20% of the FL from the left border and 61% of the FH from the top border.
All the ROIs were converted to feature vectors using the histogram of oriented gradients (HOG) descriptor [32], which offered the best accuracy in our previous experiments (Bekkozhayeva, 2021). In general, the descriptor codes the edges in the image. All ROIs were transformed into rectangles of different sizes (64 × 64, 128 × 128, 64 × 128, and 128 × 64) to facilitate efficient calculation of the HOG and achieve image-scale compensation. The best results were achieved with a size of 64 × 64 pixels for all combinations, except ROI2 for carp when using the 01 * 02 combination, where the size was 64 × 128. Two different settings of HOG were tested (cell sizes of two and four). The best results were achieved with a cell size of two for the majority of combinations, but some of them provided better accuracy with a cell size of four. The ROIs for carp data were as follows: ROI1, combinations 01 * 03 and 01 * 04; and ROI2, combinations 01 * 04, 03 * 04. Due to possible errors in localizing the ROIs on the fish body, the scanning approach was used to find the best match for the two ROI subsets. Only the subset of ROI without a border area was used for similarity measurements. Different sizes of borders (10, 16, 20, and 30 pixels) were tested. The best results were achieved with a border size of 10 pixels. The similarity between the two ROIs was measured using the similarity of the HOG features. HOG1 was calculated from the subset of the first ROI1 (reference fish). The subset was ROI1 without the borders of size, Offx and Offy (see Figure 7).
HOG2 was calculated from a subset of ROI2 (unknown fish). This subset is defined by window scanning over ROI2. The similarity between HOG1 and all HOG2 feature vectors was calculated as the Euclidean length of the difference between the two HOG vectors. The minimal value of the similarity was then used along with the similarity between ROI1 and ROI2.
2.3.4. Identification Procedure
The fish identification task was performed for classification in the closed group (with a known number of individuals), where the number of classes corresponded to the number of individual fish in each experiment (300 sea bass and 32 carp in the short-term scenario and 32 sea bass and 32 carp fish in the long-term scenario). Classification was performed separately for both the short-term and long-term data sets. The nearest-neighbor classifier was used to classify the fish, while the similarity between ROIs was used as the measure.
Short-term experiment: Each fish was represented by 6 to 11 ROIs of the images from one data set. One randomly selected ROI was used as the unknown fish, and the rest were used as representative ROIs (database) of the fish. The unknown ROI of each fish was compared with all representative images of all fish in the database. The unknown fish was classified as the most similar fish in the database. The same process was applied to each data set separately. In total, 300 seabass and 32 carp (classes) were used.
Long-term experiment: Each fish was represented by 6 to 11 ROIs of the images from one data set. Images of one fish from the first data set were compared with images of all fish from the second data set. This process was repeated for all fish from the first data set. For carp, this procedure was repeated for all combinations of the four data sets. Three images of the fish from one data set were used as the reference set, and three images of the fish from the other data set were used as the test images. The process used the same similarity measure used for the short-term data set. A test of pattern uniqueness was conducted for the first and second data sets separately for the seabass, as well as for the first, second, third, and fourth data sets, using the same approach described for the short-term classification of 32 fish (32 seabass and 32 carp classes, separately). The results of the classification were confusion matrixes describing the similarity between all combinations of individual fish.
Manual (human-based) identification for the long-term experiment involved exploring the skin patterns via human observation. Five randomly selected fish were chosen for identification. One image of each fish from the first data set and one image of each fish from the last data set were introduced to two people. Both individuals performed the identification independently.
3. Results
3.1. Seabass Identification Results
Short-term (ST) (300 fish) and long-term (LT) (32 fish in two data sets) experiments were performed to identify seabass individuals. The results of the identification are presented in Table 1.
According to the results in Table 1, the best accuracy was observed for ROI (LL), which presented 100% accuracy for both experiments (short-term and long-term). ROI (HLL) and the ROI (S) had the same accuracy (98.66%) for the short-term experiment, but ROI (HLL) had higher accuracy in the long-term experiment (96.87% compared to 93.75% for ROI (S)). The lowest accuracy was obtained for ROI (O). In the short-term experiment, the accuracy for the operculum part was 91.66% (ROI (O)) and in the long-term experiment results, the accuracy was 40.62%.
The results of manual identification (human-based) were 100% accurate for both experiments (long- and short-term).
3.2. Common Carp Identification Results
Results of individual carp identification are presented in Table 2.
For the one-day data set (short-term experiment), the accuracy was 100% for all data sets and all three ROIs, which means that each fish featured unique scale formations and could be identified as an individual between at least 32 individual fish.
For the long-term experiment, identification between the first and second data sets resulted in 80.64% accuracy for ROI1 and ROI2 and 77.41% accuracy for ROI3. Combined, the first and the third data sets presented 100% accuracy for ROI1, 96.77% accuracy for ROI2, and 64.51% for ROI3. Identification with the first and fourth data sets provided 90.32%, 83.87%, and 32.25% accuracy for ROI1, ROI2, and ROI3, respectively. Identification using the second and third data sets provided 80.64% accuracy for ROI1 and ROI2 and 67.74% accuracy for ROI3. The second data and fourth data sets presented 70.41% accuracy for ROI1, 80.64% for ROI2, and 29.03% for ROI3 (the lowest accuracy was observed for ROI3 (and all ROIs) among all tested combinations). The identification accuracy for the third and fourth data sets was 100% for ROI1 and ROI2 and 87.09% for ROI3.
The best accuracy among the defined ROIs was observed for ROI1 and ROI2, which covered the largest part of the body containing the scales. ROI3 (operculum) provided lower accuracy for all combination between the four data sets. A comparison of the results for ROI1 and ROI2 showed that ROIs with scale patterns offered the best accuracy. Moreover, based on the results, no large difference was observed based on the part of the selected region, as ROI1 and ROI2 offered almost the same accuracy (90.32% vs. 83.87, 70.41% vs. 80.64%) for all corresponding combinations among the four data sets.
The method was implemented in Matlab and tested on HP Pro book laptop (Intel (R) Core (TM) i5-6300U CPU @ 2.40 GHz, 8 GB RAM). The processing time of identification of one fish is 1.5 s on the dataset of 300 fish individuals. The HOG features for each fish in the database were precomputed to speed up the process of identification.
4. Discussion
The aim of this study was to test if the image-based individual-fish-identification approach could also be used for fish without obvious patterns on the body. Obvious body patterns include dot patterns on salmonids and stripe patterns on Sumatra Barb [27,29]. For this study, we selected common carp and sea bass as representative fish without obvious patterns. We tested different parts of the fish body to identify individual fish within close groups of fish, to explore which patterns (part of the body) offer the best classification power and sufficient stability over time for use in long-term identification.
4.1. Seabass
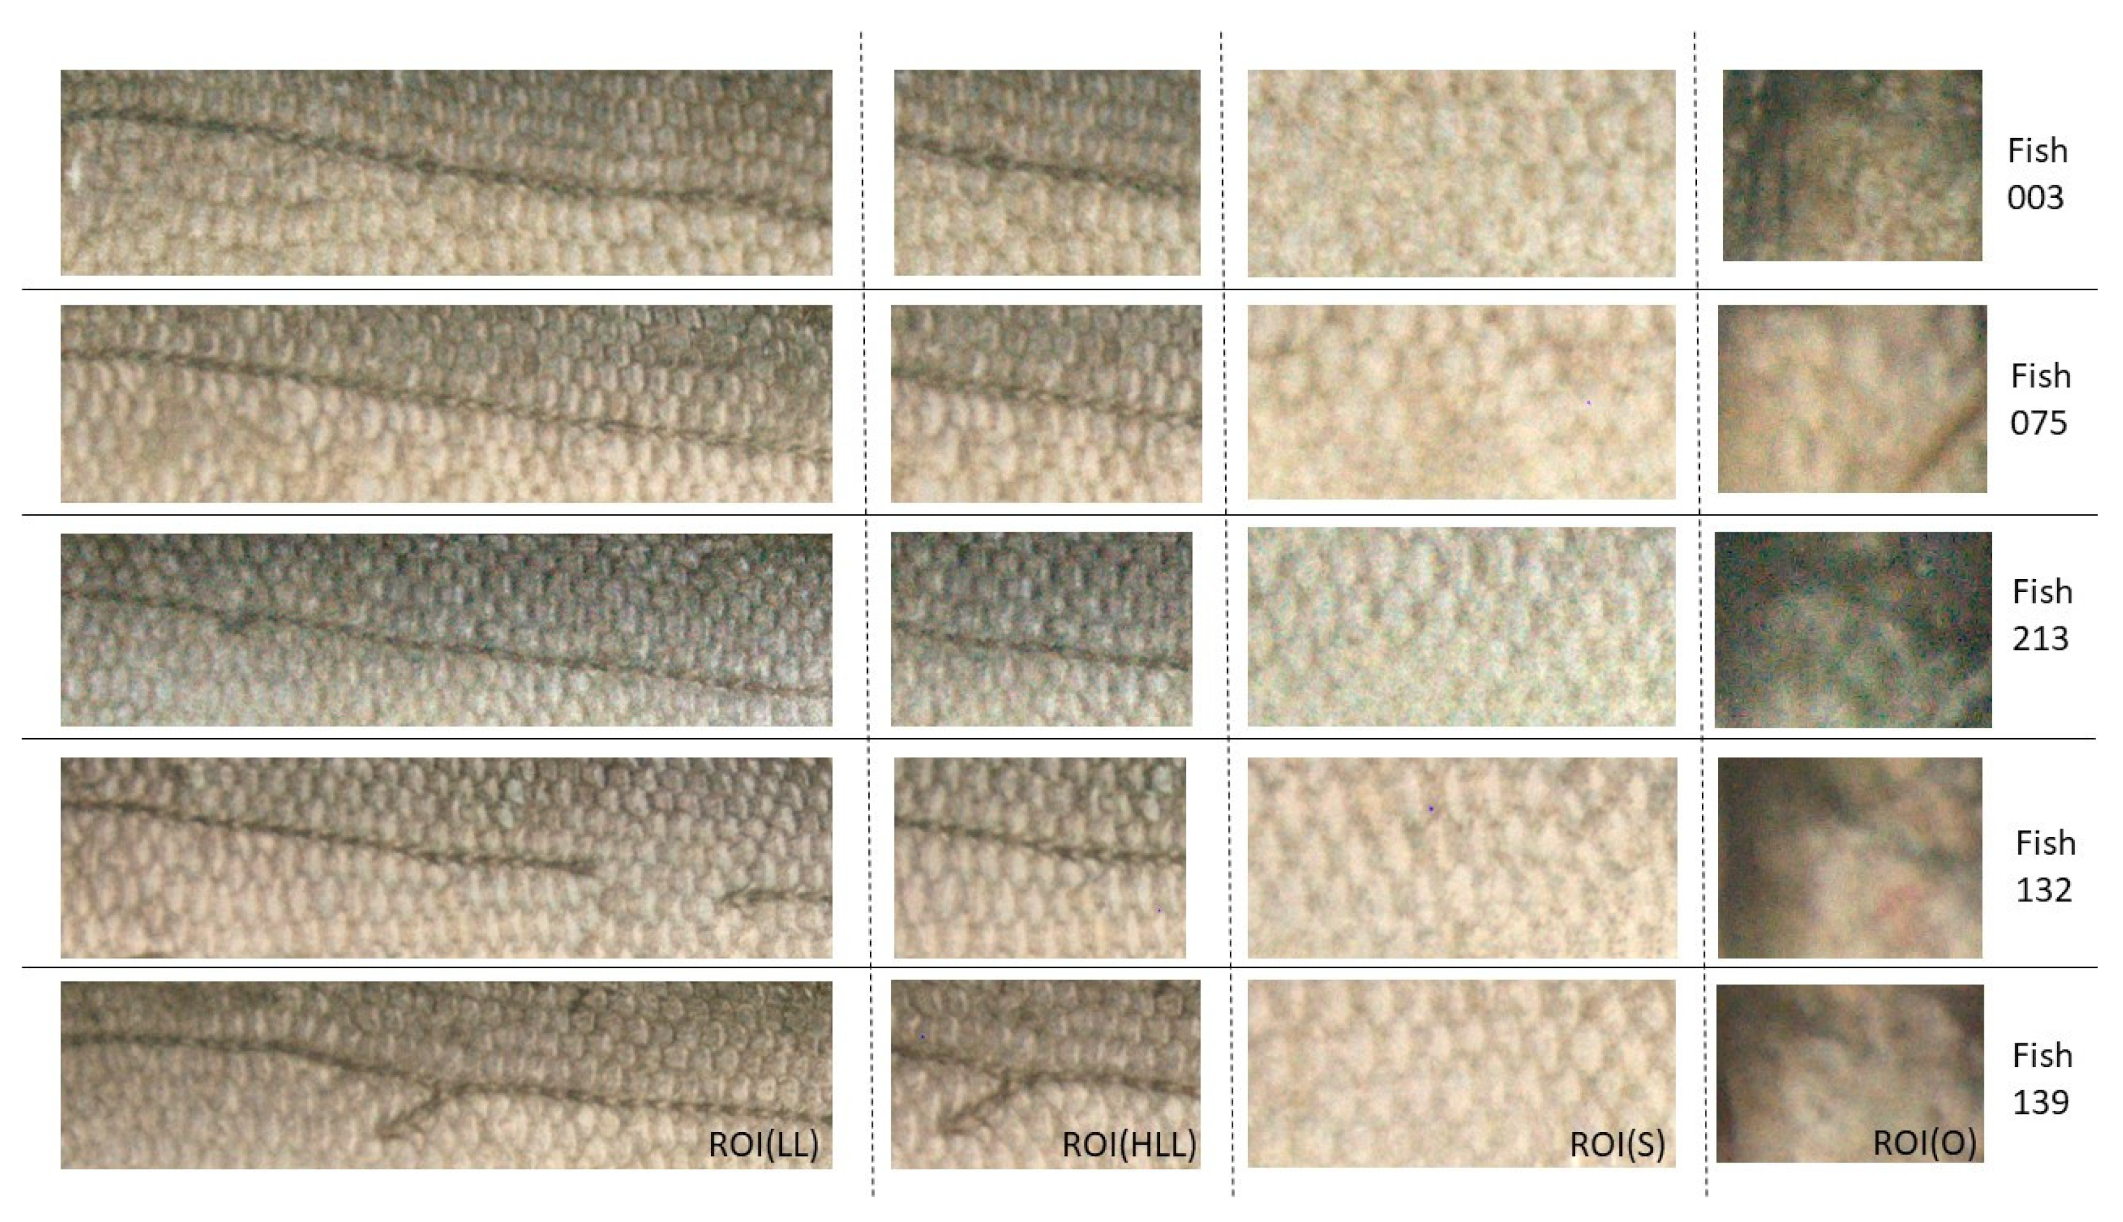
Seabass identification obtained 100% accuracy for both short-term identification and long-term identification, which means that the patterns on the body enabled individual identification of this species. In the event that there is no obvious pattern on a seabass’s body, the shape of the lateral line on the fish together with the texture of the fish’s scales should be sufficiently unique. ROI (LL) provided the best classification accuracy. Here, the lateral line itself had strong classification power, and the size of the region was the largest among all chosen regions (Figure 8).
The best results were obtained using ROI(LL), where the region of the fish body covered the lateral line and offered high classification power. ROI (HLL) also had high accuracy (98.66%). This region covered the middle part (1/3) of the lateral line of ROI (LL). The accuracy, however, decreased for both the short- and long-term experiments. The most probable reason for this decrease is a lack of detail. The lateral line’s unique shape was confirmed by the human-based identification, where the two observers were able to correctly identify five fish using the shape of the lateral line. We obtained lower accuracy of 98.66% for short-term identification and 93.75% for long-term identification under ROI (S). This region covered only the part of fish body (with scales and without the lateral line). The accuracy was still high enough to use this method for identification. We thus proved that seabass scale formation is unique and stable over at least a two-month period. ROI (O) covered the operculum part and provided the lowest identification accuracy (91.66% for the short-term and 40.62% for the long-term experiments). The operculum patterns also differed among the fish, but the long-term stability was very low. A manual assessment of operculum patterns confirmed this observation. The operculum pattern thus has smaller classification power than the lateral line and scales. The best accuracy was offered by ROI (LL), which covered the largest part of the lateral line and scales among all the ROIs. ROI (LL) was the maximum possible size that could be effectively used for identification. The ROI could not be extended to the tail part as the tail is too flexible and changes shape during swimming. Furthermore, the part of the fish close to the head could not be used as it is often covered by the pectoral fin. The size of the operculum (ROI (O)) is likely too small to provide sufficient detail for correct identification and not stable enough for the long-term identification of individuals. The identification results reveal that the chosen region of interest clearly influences the accuracy of identification. The size of the chosen region was also found to be important.
Using the shape of the lateral line for identification is not novel. Sfakianakis et al. [33] used the shape of the lateral line and scale shape to identify two different species (among wild and farmed sea bass and gilthead sea bream). The scale patterns were also previously used to identify species [34]. We likewise demonstrated that the shape of the lateral line and formation of scales are useful for identifying individuals in close groups of fish (sea cage, tank) of the same species.
As shown by the experimental data (Figure 8), the scales on the lateral line regenerate differently to the original scales. Some scales grow, while other scales attempt to compensate for the hole lacking scales by distributing themselves around the nearest area. Scales of the lateral line generally do not regenerate and are different to those on other parts of the body [35].
4.2. Carp
The short-term identification for carp was 100% accurate under all three ROIs. The accuracy of long-term identification varied from 100% to 29% depending on the ROI and combination of data sets. The best long-term identification accuracy was higher than 80% for all combinations of data sets and ROI2.
The accuracy of the combinations of data sets 01 and 02 was lower (80.64%) than that for the combination of 01 and 03 (100%), and the accuracy for the combination of 01 and 04 was higher (90%) than that for 02 and 04 (70%) (for ROI1). We expected that the identification accuracy would decrease with an increase in time between data collections, corresponding to the changes in the scale patterns influencing identification accuracy. The results, however, corresponded more strongly to issues with the data collection itself and localization of the ROI on the fish’s body. This method was able to 100% correctly identify fish between sessions with a delay of two months, but only 80% accurately for one-month delays.
The identification accuracy of ROI3 (operculum) clearly decreased from approximately 80% for one-month-delayed data sets to approximately 30% for three-month-delayed data sets. These results correspond to the changes in the operculum area from the perspective of texture-feature extraction. The contrast in the edges of ROI3 was much lower than the contrast in the edges for the scales of ROI1 and ROI 2, which is likely the reason for the decrease in accuracy.
Based on the results of the experiments with both seabass and carp, the accuracy of the method is strongly dependent on many factors, such as the type of the scale (ctenoid or cycloid), the scale from which the ROI is extracted, the localization of the ROI, the extracted and chosen features, the sizes of the ROIs, and the conditions of the experiment, which all impact the quality of the data.
There are three main aspects influencing individual-fish identification: the scale pattern itself, the proper localization of the ROI, and the image quality.
The scale pattern is affected by the geographic location of the fish [36], which means that the conditions of fish cultivation (abiotic factors such as temperature, light conditions, etc.) also affect scale appearance and skin development. The recovery of lost scales influences identification as the growth of a scale begins not in the scale’s center, but closer to its edge [37].
The individual identification of fish based on scales has not been well studied. Scales of fish have been used to identify species since the 1900s [38]. In subsequent years, scale-based identification of fish has become popular not only for species identification but also for population identification [12,39]. Furthermore, descriptors for the shape of the scale have been developed [40,41]. Based on this concept, Ibañez et al. [39] developed geometric morphometric methods (GMMs) to identify two Mugilidae species using their scales. Another study [42] tested the identification of larvae from two species based on melanophore patterns. The authors examined the distribution patterns of melanophores in various larvae of bullet tuna (Auxis rochei) and frigate tuna (Auxis thazard). Bräger [43] tested the landmark-based geometric morphometric method to identify two species from mixed samples. Only one study [22] explored the identification of individuals of one species without obvious patterns. The authors used five common carps for individual identification by human experts and obtained 100% accuracy for the identification of five individuals. Our approach shows that fully automated identification is possible for a high number of fish (300 seabass and 32 carp). For seabass, long-term image-based identification was found to be possible with 100% accuracy and could thus serve as a substitute for invasive fish tagging. For common carp, short-term identification is possible (100% accuracy), but long-term identification (approximately 80%) cannot provide accurate identification. In a future study, we intend to improve this approach for carp as it is obvious from the data set that carp scales have unique patterns.
Another approach used to identify fish species is deep learning. There is a first attempt for this task by Pedersen [24]. Brown trout (a commercially important fish species) was used in this study. Their method was able to identify individual fish with 94.6% precision and 7.6% recall. However, the limitation of the study is the low number of individuals (39 individuals). Brown trout is the species with a clearly visible dot pattern on the body. Furthermore, the identification was conducted only for short term data. No experiments with the long-term data were performed. The deep learning based methods are promising, especially in the task of fish detection combined with identification. Villon et al. [18] explored the fish identification of coral reef fish species using HOG features combined with support vector machine (SVM) and deep learning. The results for deep learning (T = 98%) were more robust than those for the HOG and SVM approaches (below 49%). In 2018, Villon et al. [17] used the deep learning method to achieve accurate and fast identification of coral reef fish (20 fish sp.) in underwater images. The rate of correct identification was 94.9%, which was greater than the rate of correct human-based identification (89.3%). Yusup et al. [44] used the deep learning method for real-time reef-fish identification (24 species of reef fish), with the highest percentage of detection accuracy observed for Holacanthis tricolor (90.70%).
However, all present studies focused on species identification did not include long-term identification. No study which deals with the identification of fish without an obvious pattern on the fish body was published and there is no study presenting real-time identification of the fish without an obvious pattern on the body.
Our study used 300 individual fish for identification in the short-term experiment. The number of fish in the cultivation tank varied from tens to thousands of individuals. The accuracy of 100%, which was achieved for both species, shows that the studied patterns are unique and could be used for a larger number of individual fish. However, the exact limits of the patterns among seabass and carp must be studied in a larger sample to confirm this observation. The long-term experiment covered a four-month cultivation period for carp and a two-month period for seabass. The standard cultivation periods for both species, however, are longer. No significant distortions in the lateral lines or scale patterns were observed for seabass; we expect that only scale loss or bodily injury would affect long-term identification accuracy. For the long-term identification of carp, the main issue was the data collection procedure and the localization of the ROI. Carp have larger scales, meaning that scale loss can more strongly affect identification accuracy for carp. Larger (mature) fish were used in our experiment when a stable scale pattern was expected. Continuous identification from larva to maturity could be problematic due to development of the fish and changes in the scale patterns. To solve this problem, the identification process could be divided into the periods of fish cultivation with stable short-term patterns. The main limitation of the present approach is that each fish was photographed out of water under anesthesia. As we demonstrated in a previous paper [27], underwater imaging of non-anaesthetized fish is also possible for image-based identification. Studying the application of this method to identification under real conditions is our future research goal.
In the future, individual identification based on fish scale patterns could be used for individualized fish treatment. Such a system could continuously identify individuals in the tank/sea cage swimming around the camera and provide information for other systems to ensure fish welfare, growth, and disease analysis. In this way, we could continuously monitor changes in the states of individual fish. Continuously monitoring and updating the images of the fish would eliminate the problems of changes in each fish’s appearance. Individual identification is currently used mainly for research purposes, where the number of individual fish is low. The future potential of individual identification lies in the automation of intensive commercial fish production. Such an application is presently impossible, but the market continues to seek solutions for precision fish farming.
The computational time (1.5 s per fish) of the approach is sufficient for real-time processing in the sea cages or fish tank as the detection rate of the fish will be low (one fish per 10–30 s in the case of high fish density). The identification procedure needs to work with the image of the fish almost perpendicular to the camera plane and therefore the time between fish detection will be longer than the identification itself.
Our future plan is to use this approach and apply to the real time condition. The next step is to conduct the fish detection and identification under real time conditions for the tank monitoring.
This method could be immediately used for research purposes as a substitute for invasive fish tagging. Standard fish sampling includes implantation of the tag into the fish and reading this tag each time a fish is sampled to identify the fish. The present non-invasive approach is instead performed out of the water under controlled conditions.
5. Conclusions, Limitations, and Future Research
The present study demonstrated that the identification of fish individuals without obvious patterns on the body from the same species and within a close group (i.e., a tank, cage, or aquarium—in our case, in a tank with a limited number of fish) can be done fully automatically based on images of the fish using image processing methods. We tested our approach on the commercially important fish species of seabass and common carp. Accuracy of 100% was obtained for the short-term identification of both species, and 100% and 80% accuracy were obtained for the long-term identification of seabass and carp, respectively. Different parts of the body, mainly parts featuring scales and the patterns on the operculum of the fish, were tested for identification. The study showed that the chosen patterns can be used for long-term identification, except for patterns on the operculum. The uniqueness of scale patterns was proven, together with their stability during the cultivation period (in our case, the longest period was four months). Our approach reveals that even a fish without obvious patterns on its body (only scale body) could be used for the automatic non-invasive identification of individual fish. Photo identification is thus a possible substitute for commonly used invasive fish tagging identification methods.
The approach we have used has several limitations that need to be solved in future studies. Such limitations include the position of the ROI, and to cut the ROI precisely enough so as to get the best identification accuracy is still challenging. We tested a maximum of 300 fish individuals, whereas in the tank, the number of fish is much higher. The present approach was tested on two different fish species to demonstrate the generalizability of the method. This approach could be used for the real-time identification of individuals under real conditions in a tank/sea cage, which could be helpful in precision fish farming for controlling and documenting the fish-growth process. Studying this application will be the next step in our complex research. A future study is to test this approach to the real time monitoring of the individual fish in tank, and increase the number of the fish individuals to a thousand.
Author Contributions
D.B. is responsible for the data collection, data processing and manuscript writing. P.C. is responsible for data collection and manuscript writing. All authors have read and agreed to the published version of the manuscript.
Funding
This study was financially supported by the Ministry of Education, Youth and Sports of the Czech Republic—project “CENAKVA“ (LM2018099), the CENAKVA Centre Development [No. CZ.1.05/2.1.00/19.0380], AQUAEXCEL2020 project (652831) and GAJU 013/2019/Z.
Institutional Review Board Statement
The animal study protocol was approved by the ethical advisor of the TNA projects under AQUAEXCEL2020 project.
Informed Consent Statement
Not applicable.
Data Availability Statement
Data available by the request.
Acknowledgments
We are thankful to HCMR infrastructure and especially to Stavros Chatzifotis and Lidya Katsika for their help during seabass data collection. We also thank Ana Laura Ibáñez for consultations on the pattern formation of fish scales.
Conflicts of Interest
The authors declare no conflict of interest.
References
- Føre, M.; Frank, K.; Norton, T.; Svendsen, E.; Alfredsen, J.A.; Dempster, T.; Eguiraun, H.; Watson, W.; Stahl, A.; Sunde, L.M.; et al. Precision fish farming: A new framework to improve production in aquaculture. Biosyst. Eng. 2018, 173, 176–193. [Google Scholar] [CrossRef]
- Bae, M.J.; Park, Y.S. Biological early warning system based on the responses of aquatic organisms to disturbances: A review. Sci. Total Environ. 2014, 466, 635–649. [Google Scholar] [CrossRef] [PubMed]
- Papadakis, V.M.; Papadakis, I.E.; Lamprianidou, F.; Glaropoulos, A.; Kentouri, M. A computer-vision system and methodology for the analysis of fish behavior. Aquac. Eng. 2012, 46, 53–59. [Google Scholar] [CrossRef]
- Khiem, N.M.; Takahashi, Y.; Oanh, D.T.H.; Hai, T.N.; Yasuma, H.; Kimura, N. The use of machine learning to predict acute hepatopancreatic necrosis disease (AHPND) in shrimp farmed on the east coast of the Mekong Delta of Vietnam. Fish. Sci. 2020, 86, 673–683. [Google Scholar] [CrossRef]
- Zhou, C.; Xu, D.; Lin, K.; Sun, C.; Yang, X. Intelligent feeding control methods in aquaculture with an emphasis on fish: A review. Rev. Aquac. 2018, 10, 975–993. [Google Scholar] [CrossRef]
- Li, W.; Ji, Z.; Wang, L.; Sun, C.; Yang, X. Automatic individual identification of Holstein dairy cows using tailhead images. Comput. Electron. Agric. 2017, 142, 622–631. [Google Scholar] [CrossRef]
- Whooley, P.; Berrow, S.; Barnes, C. Photo-identification of fin whales (Balaenoptera physalus L.) off the south coast of Ireland. Mar. Biodivers. Rec. 2011, 4, 1–7. [Google Scholar] [CrossRef]
- Pine, W.E.; Pollock, K.H.; Hightower, J.E.; Kwak, T.J.; Rice, J.A. Management Quantitative Decision Analysis for Sport Fisheries Management. Fisheries 2003, 28, 10–21. [Google Scholar] [CrossRef] [Green Version]
- Cailliet, G.; Mollet, H.; Pittenger, G.; Bedford, D.; Natanson, L. Growth and demography of the Pacific angle shark (Squatina californica), based upon tag returns off California. Mar. Freshw. Res. 1992, 43, 1313. [Google Scholar] [CrossRef]
- Ombredane, D.; Baglinière, J.L.; Marchand, F. The effects of Passive Integrated Transponder tags on survival and growth of juvenile brown trout (Salmo trutta L.) and their use for studying movement in a small river. Hydrobiologia 1998, 371, 99–106. [Google Scholar] [CrossRef]
- Xia, C.; Chon, T.S.; Liu, Y.; Chi, J.; Lee, J.M. Posture tracking of multiple individual fish for behavioral monitoring with visual sensors. Ecol. Inform. 2016, 36, 190–198. [Google Scholar] [CrossRef]
- Casselman, J.M.; Collins, J.J.; Grossman, E.J.; Ihssen, P.E.; Spangler, G.R. Lake Whitefish (Coregonus clupeaformis) stocks of the Ontario waters of Lake Huron. Can. J. Fish. Aquat. Sci. 1981, 38, 1772–1789. [Google Scholar] [CrossRef]
- Cadrin, S.X. Advances in morphometric identification of fishery stocks. Rev. Fish Biol. Fish. 2000, 10, 91–112. [Google Scholar] [CrossRef]
- Saitoh, T.; Shibata, T.; Miyazono, T. Image-based fish recognition. In Proceedings of the 2015 7th International Conference of Soft Computing and Pattern Recognition, SoCPaR 2015, Fukuoka, Japan, 13–15 November 2015; pp. 260–263. [Google Scholar]
- Shafait, F.; Mian, A.; Shortis, M.; Ghanem, B.; Culverhouse, P.F.; Edgington, D.; Cline, D.; Ravanbakhsh, M.; Seager, J.; Harvey, E.S. Fish identification from videos captured in uncontrolled underwater environments. ICES J. Mar. Sci. J. Cons. 2016, 73, 2737–2746. [Google Scholar] [CrossRef]
- Hsiao, Y.H.; Chen, C.C.; Lin, S.I.; Lin, F.P. Real-world underwater fish recognition and identification, using sparse representation. Ecol. Inform. 2014, 23, 13–21. [Google Scholar] [CrossRef]
- Villon, S.; Mouillot, D.; Chaumont, M.; Darling, E.S.; Subsol, G.; Claverie, T.; Villéger, S. A Deep learning method for accurate and fast identification of coral reef fishes in underwater images. Ecol. Inform. 2018, 48, 238–244. [Google Scholar] [CrossRef] [Green Version]
- Villon, S.; Chaumont, M.; Subsol, G.; Villéger, S.; Claverie, T.; Mouillot, D. Coral reef fish detection and recognition in underwater videos by supervised machine learning: Comparison between deep learning and HOG+SVM methods. Lect. Notes Comput. Sci. 2016, 10016, 160–171. [Google Scholar] [CrossRef] [Green Version]
- Navarro, J.; Perezgrueso, A.; Barría, C.; Coll, M. Photo-identification as a tool to study small-spotted catshark Scyliorhinus canicula. J. Fish Biol. 2018, 92, 1657–1662. [Google Scholar] [CrossRef]
- Al-Jubouri, Q.; Al-Azawi, R.J.; Al-Taee, M.; Young, I. Efficient individual identification of zebrafish using Hue/Saturation/Value color model. Egypt. J. Aquat. Res. 2018, 44, 271–277. [Google Scholar] [CrossRef]
- Hirsch, P.E.; Eckmann, R. Individual identification of Eurasian perch Perca fluviatilis by means of their stripe patterns. Limnologica 2015, 54, 1–4. [Google Scholar] [CrossRef] [Green Version]
- Huntingford, F.A.; Borçato, F.L.; Mesquita, F.O. Identifying individual common carp Cyprinus carpio using scale pattern. J. Fish Biol. 2013, 83, 1453–1458. [Google Scholar] [CrossRef] [PubMed]
- Stien, L.H.; Nilsson, J.; Bui, S.; Fosseidengen, J.E.; Kristiansen, T.S.; Øverli; Folkedal, O. Consistent melanophore spot patterns allow long-term individual recognition of Atlantic salmon Salmo salar. J. Fish Biol. 2017, 91, 1699–1712. [Google Scholar] [CrossRef] [Green Version]
- Pedersen, M.; Mohammed, A. Photo identification of individual salmo trutta based on deep learning. Appl. Sci. 2021, 11, 9039. [Google Scholar] [CrossRef]
- Hook, S.A.; McMurray, C.; Ripley, D.M.; Allen, N.; Moritz, T.; Grunow, B.; Shiels, H.A. Recognition software successfully aids the identification of individual small-spotted catsharks Scyliorhinus canicula during their first year of life. J. Fish Biol. 2019, 95, 1465–1470. [Google Scholar] [CrossRef] [PubMed] [Green Version]
- Castillo, G.C.; Sandford, M.E.; Hung, T.C.; Yang, W.R.; Tigan, G.; Ellison, L.; Lindberg, J.C.; Van Nieuwenhuyse, E.E. Evaluation of chromatophores as natural marks for delta smelt: The effects of life-stage and light intensity. Environ. Biol. Fishes 2019, 102, 1137–1147. [Google Scholar] [CrossRef] [Green Version]
- Bekkozhayeva, D.; Saberioon, M.; Cisar, P. Automatic individual non-invasive photo-identification of fish (Sumatra barb Puntigrus tetrazona) using visible patterns on a body. Aquac. Int. 2021, 29, 1481–1493. [Google Scholar] [CrossRef]
- Schraml, R.; Hofbauer, H.; Jalilian, E.; Bekkozhayeva, D.; Mohammadmehdi, S.; Cisar, P.; Uhl, A. Towards fish individuality-based aquaculture. IEEE Trans. Ind. Inform. 2020, 17, 4356–4366. [Google Scholar] [CrossRef]
- Cisar, P.; Bekkozhayeva, D.; Movchan, O.; Saberioon, M.; Schraml, R. Computer vision based individual fish identification using skin dot pattern. Sci. Rep. 2021, 11, 16904. [Google Scholar] [CrossRef] [PubMed]
- Ibáñez, A.L.; Guerra, E.; Pacheco-Almanzar, E. Fish Species Identification Using the Rhombic Squamation Pattern. Front. Mar. Sci. 2020, 7, 211. [Google Scholar] [CrossRef]
- Šonka, M.; Hlavac, V.; Boyle, R. Image Processing, Analysis, and Machine Vision; Springer: Berlin/Heidelberg, Germany, 2008; ISBN 978-0-495-08252-1. [Google Scholar]
- Dalal, N.; Triggs, B. Histograms of oriented gradients for human detection. In Proceedings of the 2005 IEEE computer society conference on computer vision and pattern recognition (CVPR’05), San Diego, CA, USA, 20–26 June 2005; Volume I, pp. 886–893. [Google Scholar] [CrossRef] [Green Version]
- Sfakianakis, D.G.; Katharios, P.; Tsirigotakis, N.; Doxa, C.K.; Kentouri, M. Lateral line deformities in wild and farmed sea bass (Dicentrarchuslabrax L.) and sea bream (Sparus aurata L.). J. Appl. Ichthyol. 2013, 29, 1015–1021. [Google Scholar] [CrossRef]
- Arechavala-Lopez, P.; Sanchez-Jerez, P.; Bayle-Sempere, J.T.; Sfakianakis, D.G.; Somarakis, S. Discriminating farmed gilthead sea bream Sparus aurataand European sea bass Dicentrarchus labrax from wild stocks through scales andotoliths. J. Fish Biol. 2012, 80, 2159–2175. [Google Scholar] [CrossRef]
- Ibáñez, A.L.; Gallardo-Cabello, M. Identification of two Mugilidae species, Mugil cephalus and M. curema (Pisces: Mugilidae), using the ctenii of their scales. Bull. Mar. Sci. 2005, 77, 305–307. [Google Scholar]
- Ibáñez, A.L. Fish scale shape variation by year and by geographic location, could scales be useful to trace fish? A case study on the Gulf of Mexico. Fish. Res. 2014, 156, 34–38. [Google Scholar] [CrossRef]
- Eldar, G.; Abbasali, A.; Sharafkxanim, A.; David, C. The Surface Fractal Structure of Fish Scales. Open J. Inorg. Non-metallic Mater. 2014, 4, 7–11. [Google Scholar] [CrossRef] [Green Version]
- Goodrich, E.S. The vertebrata craniata (cyclostomes and fishes). Ray E 1909, IX, 518. [Google Scholar]
- Ibañez, A.L.; Cowx, I.G.; O’Higgins, P. Geometric morphometric analysis of fish scales for identifying genera, species, and local populations within the Mugilidae. Can. J. Fish. Aquat. Sci. 2007, 64, 1091–1100. [Google Scholar] [CrossRef] [Green Version]
- Chervinski, J. Using scales for identification of four mugilidae species. Aquaculture 1984, 38, 79–81. [Google Scholar] [CrossRef]
- Chervinski, J. Identification of four tilapia species from Lake Kinneret, Israel, by the form of their scales. Aquaculture 1986, 52, 235–236. [Google Scholar] [CrossRef]
- Sato, T.; Tawa, A.; Sakuma, K.; Sakurai, M. Larval identification based on melanophore patterns in two Auxis species, bullet tuna Auxis rochei and frigate tuna Auxis thazard, from the northwest Pacific Ocean. Fish. Sci. 2020, 86, 625–631. [Google Scholar] [CrossRef]
- Bräger, Z.; Staszny, Á.; Mertzen, M.; Moritz, T.; Horváth, G. Fish scale identification: From individual to species-specific shape variability. Acta Ichthyol. Piscat. 2017, 47, 331–338. [Google Scholar] [CrossRef] [Green Version]
- Yusup, I.M.; Iqbal, M.; Jaya, I. Real-time reef fishes identification using deep learning. IOP Conf. Ser. Earth Environ. Sci. 2020, 429, 012046. [Google Scholar] [CrossRef]
Figure 1.
Examples of seabass images. (Top) example of the interrupted lateral line. (Middle) example of a fish with scratches visible on its body. (Bottom) example of a missing upper-tail part.
Figure 1.
Examples of seabass images. (Top) example of the interrupted lateral line. (Middle) example of a fish with scratches visible on its body. (Bottom) example of a missing upper-tail part.

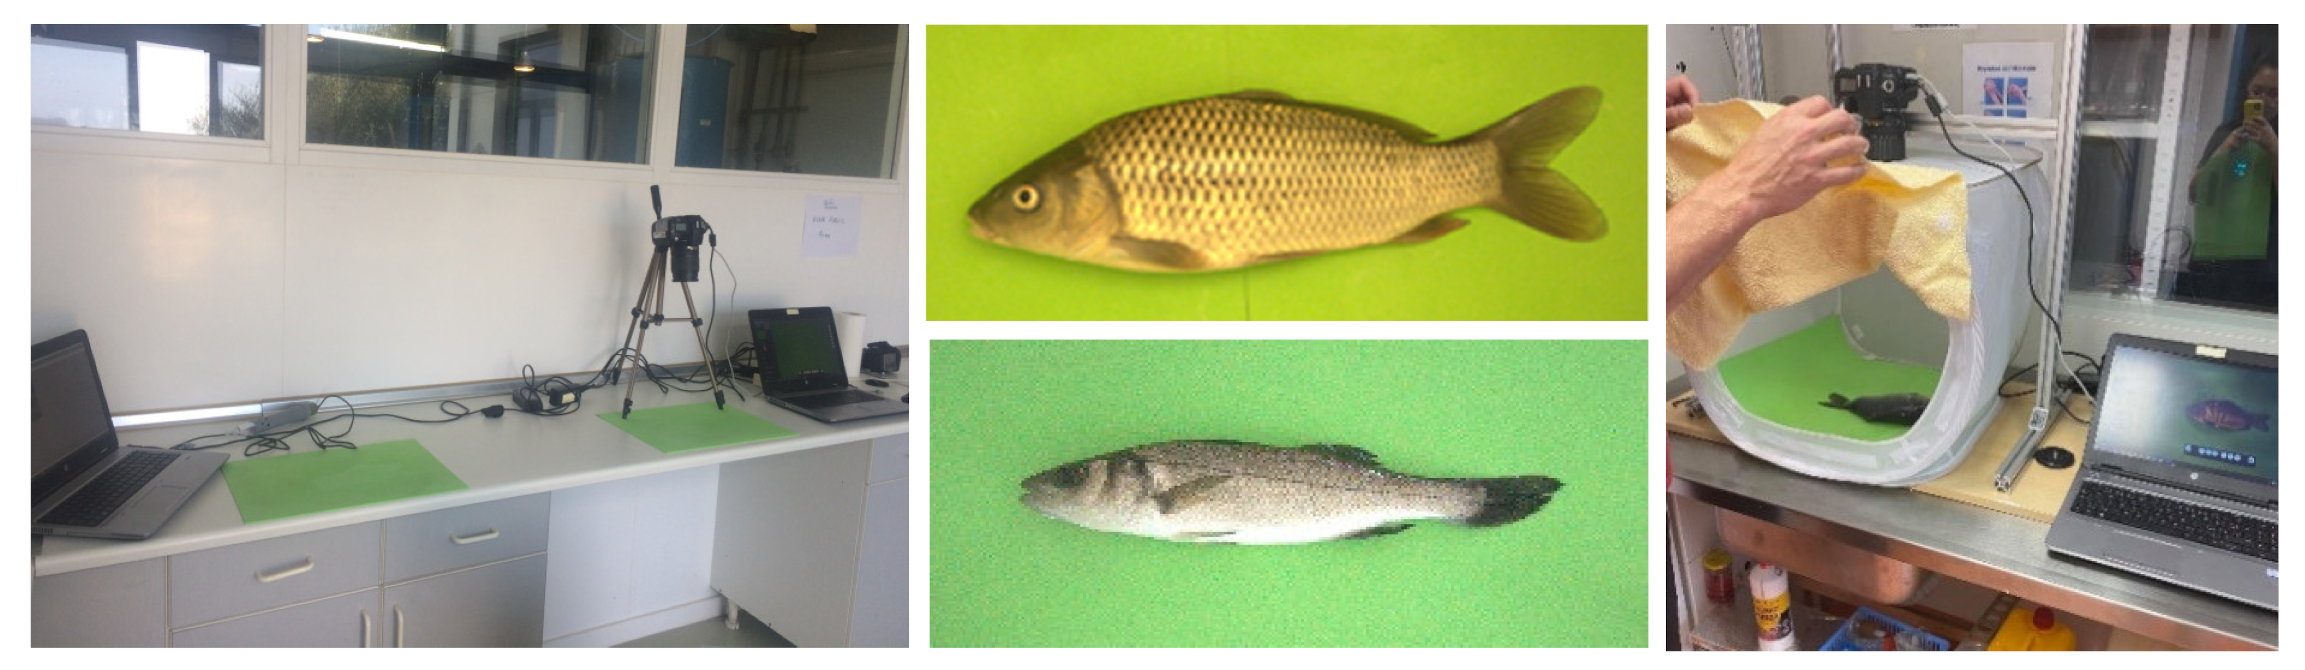
Figure 2.
(Left image) seabass data collection design. Digital camera photographing the lateral view of the fish. Image of the seabass (middle, bottom) and carp (middle, top) on the uniform green background. This image was used for automatic fish localization. (Right image) experimental design for carp imaging using a tent with controlled lighting conditions.

Figure 3.
Identification scheme.

Figure 4.
Identification scheme. (Left images), fish detected in the original image (black and white mask) what is the output of the of fish detection procedure; (Right images), ROI (ROI(LL) for seabass (bottom image) and ROI1 for carp (upper image) localized in the fish bounding box by the defined percentage of fish width and height.

Figure 5.
Different seabass ROIs that were used for identification.

Figure 6.
Position of ROIs for carp identification.

Figure 7.
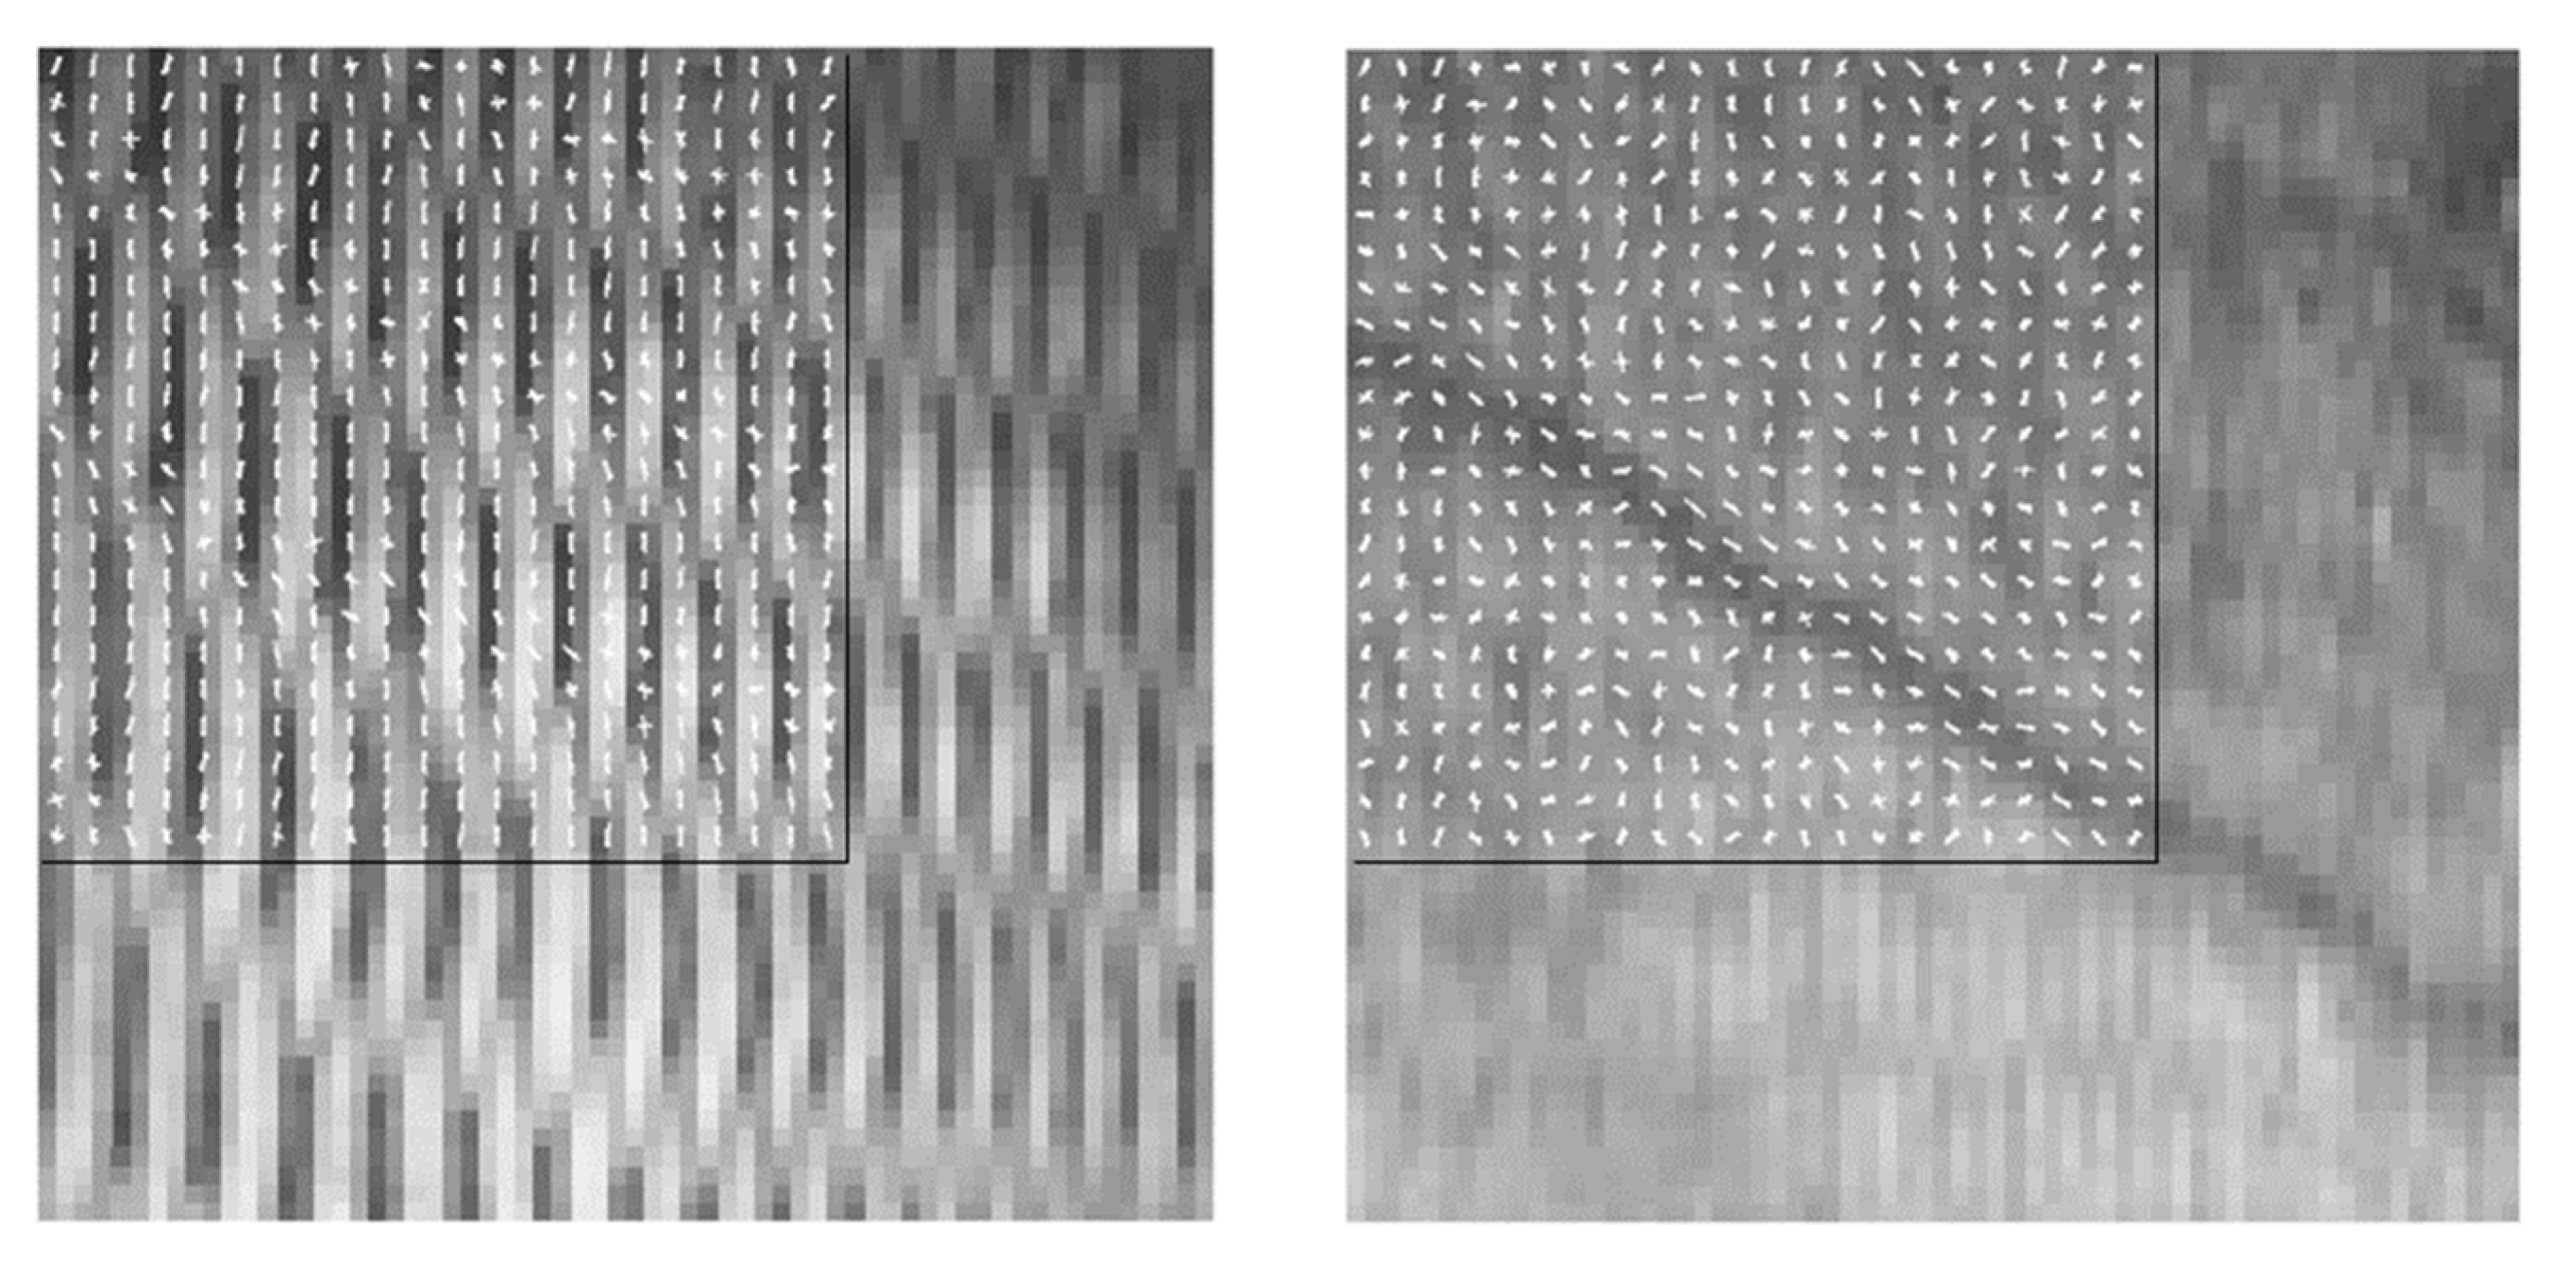
HOG visualization for ROIs. The left image is the ROI1 for carp resized to 64 by 64 pixels, where the white holes are the scales of the fish, and black lines are the connecting parts of the scales. The right image represents the ROI(LL) for seabass resized to 64 by 64 pixels, where the black line is the lateral line. The rectangle in the left-top corner of both images visualizes the HOG gradients used for pattern parametrization. The gradience are tiny white lines, which correspond to the orientation of the edges in the image. For common carp it follows the shape of the scale and for the seabass it follows the lateral line.
Figure 7.
HOG visualization for ROIs. The left image is the ROI1 for carp resized to 64 by 64 pixels, where the white holes are the scales of the fish, and black lines are the connecting parts of the scales. The right image represents the ROI(LL) for seabass resized to 64 by 64 pixels, where the black line is the lateral line. The rectangle in the left-top corner of both images visualizes the HOG gradients used for pattern parametrization. The gradience are tiny white lines, which correspond to the orientation of the edges in the image. For common carp it follows the shape of the scale and for the seabass it follows the lateral line.

Figure 8.
Differences in ROIs for different fish (seabass).


Table 1.
Short- and long-term experiment results for seabass identification.
| Region of Interest | Accuracy for ST (300 Fish) | Accuracy for LT (32 Fish) |
|---|---|---|
| ROI (LL) | 100% | 100% |
| ROI (O) | 91.66% | 40.62% |
| ROI (HLL) | 98.66% | 96.87% |
| ROI (S) | 98.66% | 93.75% |
Table 2.
Results of identification for the short- and long-term experiments.
| Data Collection | 01 | 02 | 03 | 04 | ||||||||
|---|---|---|---|---|---|---|---|---|---|---|---|---|
| ROI1 | ROI2 | ROI3 | ROI1 | ROI2 | ROI3 | ROI1 | ROI2 | ROI3 | ROI1 | ROI2 | ROI3 | |
| 01 | 100 | 100 | 100 | 80.64 | 80.64 | 77.41 | 100 | 96.77 | 64.51 | 90.32 | 83.87 | 32.25 |
| 02 | 100 | 100 | 100 | 80.64 | 80.64 | 67.74 | 70.41 | 80.64 | 29.03 | |||
| 03 | 100 | 100 | 100 | 100 | 100 | 87.09 | ||||||
| 04 | 100 | 100 | 100 | |||||||||
Publisher’s Note: MDPI stays neutral with regard to jurisdictional claims in published maps and institutional affiliations. |
© 2022 by the authors. Licensee MDPI, Basel, Switzerland. This article is an open access article distributed under the terms and conditions of the Creative Commons Attribution (CC BY) license (https://creativecommons.org/licenses/by/4.0/).
Share and Cite
MDPI and ACS Style
Bekkozhayeva, D.; Cisar, P. Image-Based Automatic Individual Identification of Fish without Obvious Patterns on the Body (Scale Pattern). Appl. Sci. 2022, 12, 5401. https://doi.org/10.3390/app12115401
AMA Style
Bekkozhayeva D, Cisar P. Image-Based Automatic Individual Identification of Fish without Obvious Patterns on the Body (Scale Pattern). Applied Sciences. 2022; 12(11):5401. https://doi.org/10.3390/app12115401
Chicago/Turabian StyleBekkozhayeva, Dinara, and Petr Cisar. 2022. "Image-Based Automatic Individual Identification of Fish without Obvious Patterns on the Body (Scale Pattern)" Applied Sciences 12, no. 11: 5401. https://doi.org/10.3390/app12115401
Note that from the first issue of 2016, this journal uses article numbers instead of page numbers. See further details here.