
Thermal Effects at Continent-Ocean Transform Margins: A 3D Perspective


1
GeoModelling Solutions, GmbH, 8005 Zurich, Switzerland
2
Njord, University of Oslo, 0316 Oslo, Norway
3
Aker BP, 1366 Lysaker, Norway
4
CEED, University of Oslo, 0316 Oslo, Norway
*
Author to whom correspondence should be addressed.
Geosciences 2021, 11(5), 193; https://doi.org/10.3390/geosciences11050193
Submission received: 5 March 2021
/
Revised: 19 April 2021
/
Accepted: 27 April 2021
/
Published: 29 April 2021
(This article belongs to the Special Issue Marine Heat Flow Measurements)
Abstract
:Continental breakup along transform margins produces a sequence of (1) continent-continent, (2) continent-oceanic, (3) continent-ridge, and (4) continent-oceanic juxtapositions. Spreading ridges are the main sources of heat, which is then distributed by diffusion and advection. Previous work focused on the thermal evolution of transform margins built on 2D numerical models. Here we use a 3D FEM model to obtain the first order evolution of temperature, uplift/subsidence, and thermal maturity of potential source rocks. Snapshots for all four transform phases are provided by 2D sections across the margin. Our 3D approach yields thermal values that lie in between the previously established 2D end-member models. Additionally, the 3D model shows heat transfer into the continental lithosphere across the transform margin during the continental-continental transform stage ignored in previous studies. The largest values for all investigated quantities in the continental area are found along the transform segment between the two ridges, with the maximum values occurring near the transform-ridge corner of the trailing continental edge. This boundary segment records the maximum thermal effect up to 100 km distance from the transform. We also compare the impact of spreading rates on the thermal distribution within the lithosphere. The extent of the perturbation into the continental areas is reduced in the faster models due to the reduced exposure times. The overall pattern is similar and the maximum values next to the transform margin is essentially unchanged. Varying material properties in the upper crust of the continental areas has only a minor influence.
1. Introduction
Transform margins, along which plates and plate segments slide past each other, are a fundamental part of the seafloor spreading process and the formation of new oceanic lithosphere. A particularly interesting type of transform fault are those that juxtapose the oceanic and continental lithosphere. Famous active examples include the Alpine fault of New Zealand, whereas the south facing coast of Central West Africa, northern South America, the western Barents and Northeast Greenland Shelf, and the Jan Mayen microcontinent and Mid-Norway (Møre and Vøring) represent relict examples. There have been a number of studies conducted on the initiation, development, and effects of transform faults but most of them focus on the initiation and perseverance of these structures that are largely orthogonal to the spreading axis, e.g., [1,2,3,4,5,6,7]. Thermal conduction across transforms from hot oceanic lithosphere and into cold continental lithosphere may potentially result in several kilometers of uplift on the continental side of the margin. Furthermore, temperature is one of the key parameters in the study of hydrocarbon systems. Standard basin models can deal with a number of settings, e.g., rift, foreland, delta, but the thermal effect of lateral heat flow during the formation of oceanic crust is usually ignored. This simplification is acceptable if the analyzed hydrocarbon systems are far away from the continent-ocean transition. However, with exploration moving towards frontiers, areas that lie near the oceanic crust are being investigated and the question arises if the heat input from the oceanic crust formation can be ignored.
The thermal effects of transform margins on adjacent continental lithosphere have only been investigated in a limited number of two-dimensional models to date [8,9,10,11,12,13]. The first quantitative model was developed by Todd and Keen [12] where they presented a 2D thermal model that studied the evolution of a continent-ocean transform at slow and moderate spreading ridges. The model included the thermal effect of lateral heat conduction across the transform fault from hot oceanic to colder continental lithosphere and the effect of shear heating across the transform fault during the continent-continent transform phase. The thermal contribution was translated to uplift on the continental side of the margin assuming local isostasy. Lorenzo and Vera [9] modeled the evolution of a single margin segment using a simple half-plate model and the analytical solution of the heat conduction equation [14]. The thermal results of the model were used to calculate continental uplift due to local and regional isostasy. However, the authors modeled only the final passive stage of the transform margin as they assumed that heat supplied by the ridge flanks in advance of the ridge crest was insignificant. Vågnes [13] built on the two-dimensional (2D) model of Todd and Keen [12] by incorporating both thermal and viscous coupling across continent-ocean transform margins. He stated that viscous coupling in the lower ductile part of the lithospheric plates across transform faults will not only result in heat advection into the continental lithosphere thereby adding to the conductive effect but may also thin the lower crust causing tectonic subsidence and counteracting any induced uplift. The 2D thermal model presented by Gadd and Scrutton [8] builds on the previous thermal models and calculates thermally-driven uplift and subsidence profiles across the margin assuming both local and regional isostasy. This model attempts to recreate the inherent three-dimensional (3D) nature of the problem by using different initial and boundary conditions for the modeled section for every phase of evolution of the margin. Rüpke et al. [11] studied the opening of the South Atlantic and how the Ghana-Ivory Coast petroleum system, formed in a transform setting, was influenced by the hot Mid Atlantic Ridge sliding by the continental crust. Their conclusion was that the Mid Atlantic Ridge did influence the thermal state of the outermost continental crust but the thermal maturity of potential source rocks was affected only to a lesser degree. Recent studies [15,16] explore geodynamic processes including the thermal budget using 3D models but are limited to the oceanic region near the transform fault and ridge-transform intersections.
In spite of previous efforts, there have been no true 3D models that have studied the complete evolution of continent-ocean transform margins. Therefore, in order to further refine the important, first-order temperature effects of oceanic crust formation on uplift and hydrocarbon maturation in the continental crust, we have developed a 3D numerical model that allows us to track the temperature evolution in a system where continental crust is broken apart and new oceanic crust is formed. The model investigates the thermal coupling of the oceanic and continental lithosphere on either side of the transform margin for different spreading velocities and lithological properties. We track the evolution of temperature, source rock maturity (vitrinite), and the uplift of the continental areas and compare the results of our 3D model to previous work.
2. Numerical Model
The 3D model includes two ridge segments separated by a transform fault. The thermal evolution of the continental lithosphere between and around these ridges is investigated for varying spreading rates and material properties.
2.1. Method
The finite element method (FEM) numerical model used is developed specifically for this study and builds on the MILAMIN framework using optimized routines from MUTILS [17,18]. Given the massive computational cost of full 3D computations, such as required for the complex geometry evolution at hand, the problem is simplified to a thermal one with the mechanics approximated by the kinematic description of the movement. Operator splitting allows for separate treatment of advection, by the method of characteristics, and diffusion, through an iterative FEM solver. The latter solves the diffusion of temperature, T, which is governed by
Here, ρ is the density, cp is the heat capacity, k is the thermal conductivity, and Q is a source term, in this case radioactive heat production that is implemented within the continental crust and decreases exponentially with depth (e-fold length equal to crustal thickness, Zc). Material properties and corresponding notations are listed in Table 1.
2.2. Geometry
The model setup consists of a box that is 910 km long (in X), 200 km wide (in Y), and 125 km deep (in Z) (Figure 1). The entire domain is initialized to the continental lithosphere with the Moho depth at 35 km. The upper 20 km of the continental crust is made up of sediments. The spreading centers, once formed, are aligned north-south (Y-Z plane) and the opening direction is, therefore, east-west. The computational grid assumes an Eulerian position, i.e., it is fixed and the materials and temperature field advected through it. The reference frame is fixed on the two ridges. The western ridge is emplaced with its center at the left boundary and is restricted to the northern side of the transform margin. The ridge crests are 5 km wide. The eastern ridge has its center 102.5 km along the X-axis such that the distance between the two inner ridge edges is 200 km. The eastern ridge is restricted to the southern side of the transform margin. The upper 2.5 km above the ridges is ocean. The oceanic lithosphere moves away from the ridge with the spreading velocity displacing the existing continental lithosphere and is always topped by a 2.5 km thick ocean. The Moho in the oceanic lithosphere is 8 km deep, away from the ridge crest. The transform fault runs perpendicular to the ridges along the X-axis for the entire model. The 3D thermal evolution of the continental lithosphere around the spreading ridges is tracked through time with the aid of a horizontal L-shaped marker domain (Figure 1). Three vertical marker planes perpendicular to the transform margin track temperature and uplift/subsidence of the lithosphere and are used to compare the results of the 3D model to previous studies. Note that the marker planes are frozen with respect to the 3D marker domain and therefore move towards the east with the spreading velocity. The evolution of the lithosphere around the transform margin is separated into four distinct stages with respect to the marker planes; Phase 1: continent-continent transform (Figure 1B); Phase 2: ocean-continent transform (Figure 1C); Phase 3: ridge pass (Figure 1D); and Phase 4: passive margin formation (Figure 1E).
2.3. Initialization and Boundary Conditions
The lateral boundary conditions for temperature are no flux. Dirichlet boundary conditions are applied at the top and the bottom with values of 0 °C and 1333 °C, respectively. Exponentially decaying radiogenic heat production with depth is incorporated in the continental crust. The model is initialized to its corresponding steady state, i.e., continental lithosphere without ridges and oceanic parts. The ridges are then introduced into the model with their temperature set to 1333 °C. The spreading velocities are mirror-symmetric around ridge axis/wall, i.e., the Y and Z components are zero and the X component is constant with a different sign on the two adjacent sides of the ridge. Note that the spreading velocities stated are always half-spreading rates, i.e., the velocities of an individual oceanic segment and not the total (full) spreading rate of the entire system. The models are run for 50, 16.67, and 10 Myr with spreading velocities of 1, 3, and 5 cm/yr such that any given point in the continental lithosphere will have migrated 500 km at the end of the simulation.
2.4. Resolution
The resolution in Z is 50 elements. The element size is linearly decreasing towards the surface to guarantee that the resolution is highest where required. The difference in element size between top and bottom is tenfold (0.46 km ≤ dz ≤ 4.64 km). The resolution in Y is 101 elements with a tenfold grid refinement towards the center of the model (0.36 km ≤ dy ≤ 3.64 km) to better resolve the effect of the transform system. The grid spacing in X is 401 elements with a constant element size (dx = 2.5 km). The time step is adjusted so that the movement due to the spreading of the system is exactly one grid cell in X per time step.
2.5. Vitrinite Reflectance
Vitrinite reflectance is a widely used indicator of thermal maturity and can be readily measured in field samples. One of the most common methods used to calculate the thermal maturity of the source rock is the EASY%Ro method put forward by Sweeney and Burnham [19]. This time-dependent model uses 20 parallel first order reactions with kinetics governed by an Arrhenius-type dependence to describe the complex process of kerogen breakdown.
3. Results
Oceanic lithosphere is formed at the ridge crests and moves symmetrically away from the ridges with the spreading velocity. Continental lithosphere is pushed away and out of the domain on either side of the ridge axes. Continental lithosphere is heated by the ridges and their flanks due to lateral heat conduction while the oceanic lithosphere simultaneously cools as it loses heat to the ocean at the top and the continental lithosphere on the sides. The first model (Section 3.1) investigates thermal evolution and uplift or subsidence for a spreading rate of 1 cm/yr. Uplift/subsidence in the model is calculated on the principle of local isostasy with respect to the initial thermal configuration of the continental lithosphere. A 3D perspective of temperature evolution is obtained from the 3D L-shaped marker domain describing the continental lithosphere on either side of the spreading centers and 2D sections along the three marker sections described in Figure 1. The set of models in Section 3.2 studies the effect of varying spreading rates on the aforementioned variables in the continental lithosphere. The last set of models (Section 3.3) uses the same parameters as the first while introducing a sedimentary layer with different material properties in the upper 20 km of the continental lithosphere. Thermal maturity of these sediments in response to ridge heating is also explored.
3.1. Reference Case
The reference model investigates the thermal effects within the lithosphere when the ridge spreading rate is 1 cm/yr analogous to a slow-spreading system. Note that the sediments in this case have the same material properties as the continental crust. We discuss the thermal evolution of the continental lithosphere with respect to the three 2D sections and the continental region surrounding the spreading ridges. The sections 50 (A), 100 (B), and 150 km (C) away from the eastern ridge are frozen with respect to the continental lithosphere in the 3D marker domain of the model. They, therefore, move en bloc with the spreading velocity towards the east. These sections record four distinct phases: Phase (1) continent-continent transform for 2.5, 5, and 7.5 Myr, respectively, Phase (2) continent-ocean transform for 2.5, 5, and 7.5 Myr, respectively, Phase (3) eastern ridge-pass for 500,000 years, and Phase (4) passive margin formation for the remaining simulation time.
3.1.1. 2D Sections—Phase 1
Phase 1 is characterized by continent-continent transform and ends when the individual sections reach the newly created oceanic lithosphere (Figure 2). Continental lithosphere adjacent to the ridge flank and on the ridge side of the transform is heated by the oceanic lithosphere. This results in significant amount of uplift (up to ~800 m for Section A) within this part of the continent. Subsequently, this excess heat is also transferred across the continent-continent transform margin to the continental lithosphere across the margin. This results in a small but not insignificant perturbation in the thermal structure of the continental lithosphere across the margin at the end of the continent-continent transform phase. The thermal perturbation (henceforth denoted by 50 °C excess temperature contour) extends 4.5 km into the continental lithosphere across the margin from the ridge for Section A. The corresponding maximum continental uplift at the margin is 260 m. The extent of the thermal perturbation and the maximum uplift at the end of Phase 1 decrease as the distance of the section under consideration from the ridge axis increases. The thermal perturbation extends 3 km into the continental lithosphere resulting in a maximum uplift of 185 m for Section B that was initially 100 km away from the eastern ridge. The extent further decreases to 2 km and maximum uplift at the margin decreases to 150 m for Section C that was initially 150 km away from the eastern ridge.
3.1.2. 2D Sections—Phase 2
Phase 2 is the first part of the ocean-continent transform that ends when the individual sections reach the spreading ridge (Figure 3). The continental lithosphere in the sections across the margin encounters increasingly hotter and younger oceanic lithosphere as the sections move towards the eastern spreading center. The continental lithosphere is, thereby, increasingly heated through the margin during the ocean-continent transform phase that occurs for the next 2.5, 5, and 7.5 Myr for sections A, B, and C. The thermal anomaly extends ~19 km into the continental lithosphere at the end of this phase for Section A resulting in a maximum uplift of 1600 m on the continental side of the margin. The seafloor across the margin subsides uniformly to slightly deeper than 2000 m due to its vertically regular thermal structure. The thermal anomaly extends further into the continental lithosphere for sections that were initially further away from the spreading center as there is more time for heat to be transferred across the margin from the hot oceanic lithosphere, i.e., ~24 and ~33 km into the continental lithosphere for sections B and C, respectively. Maximum uplift of the continent and subsidence of the ocean is similar to Section A as the vertical thermal structure at the margin is similar for all three sections.
3.1.3. 2D Sections—Phase 3
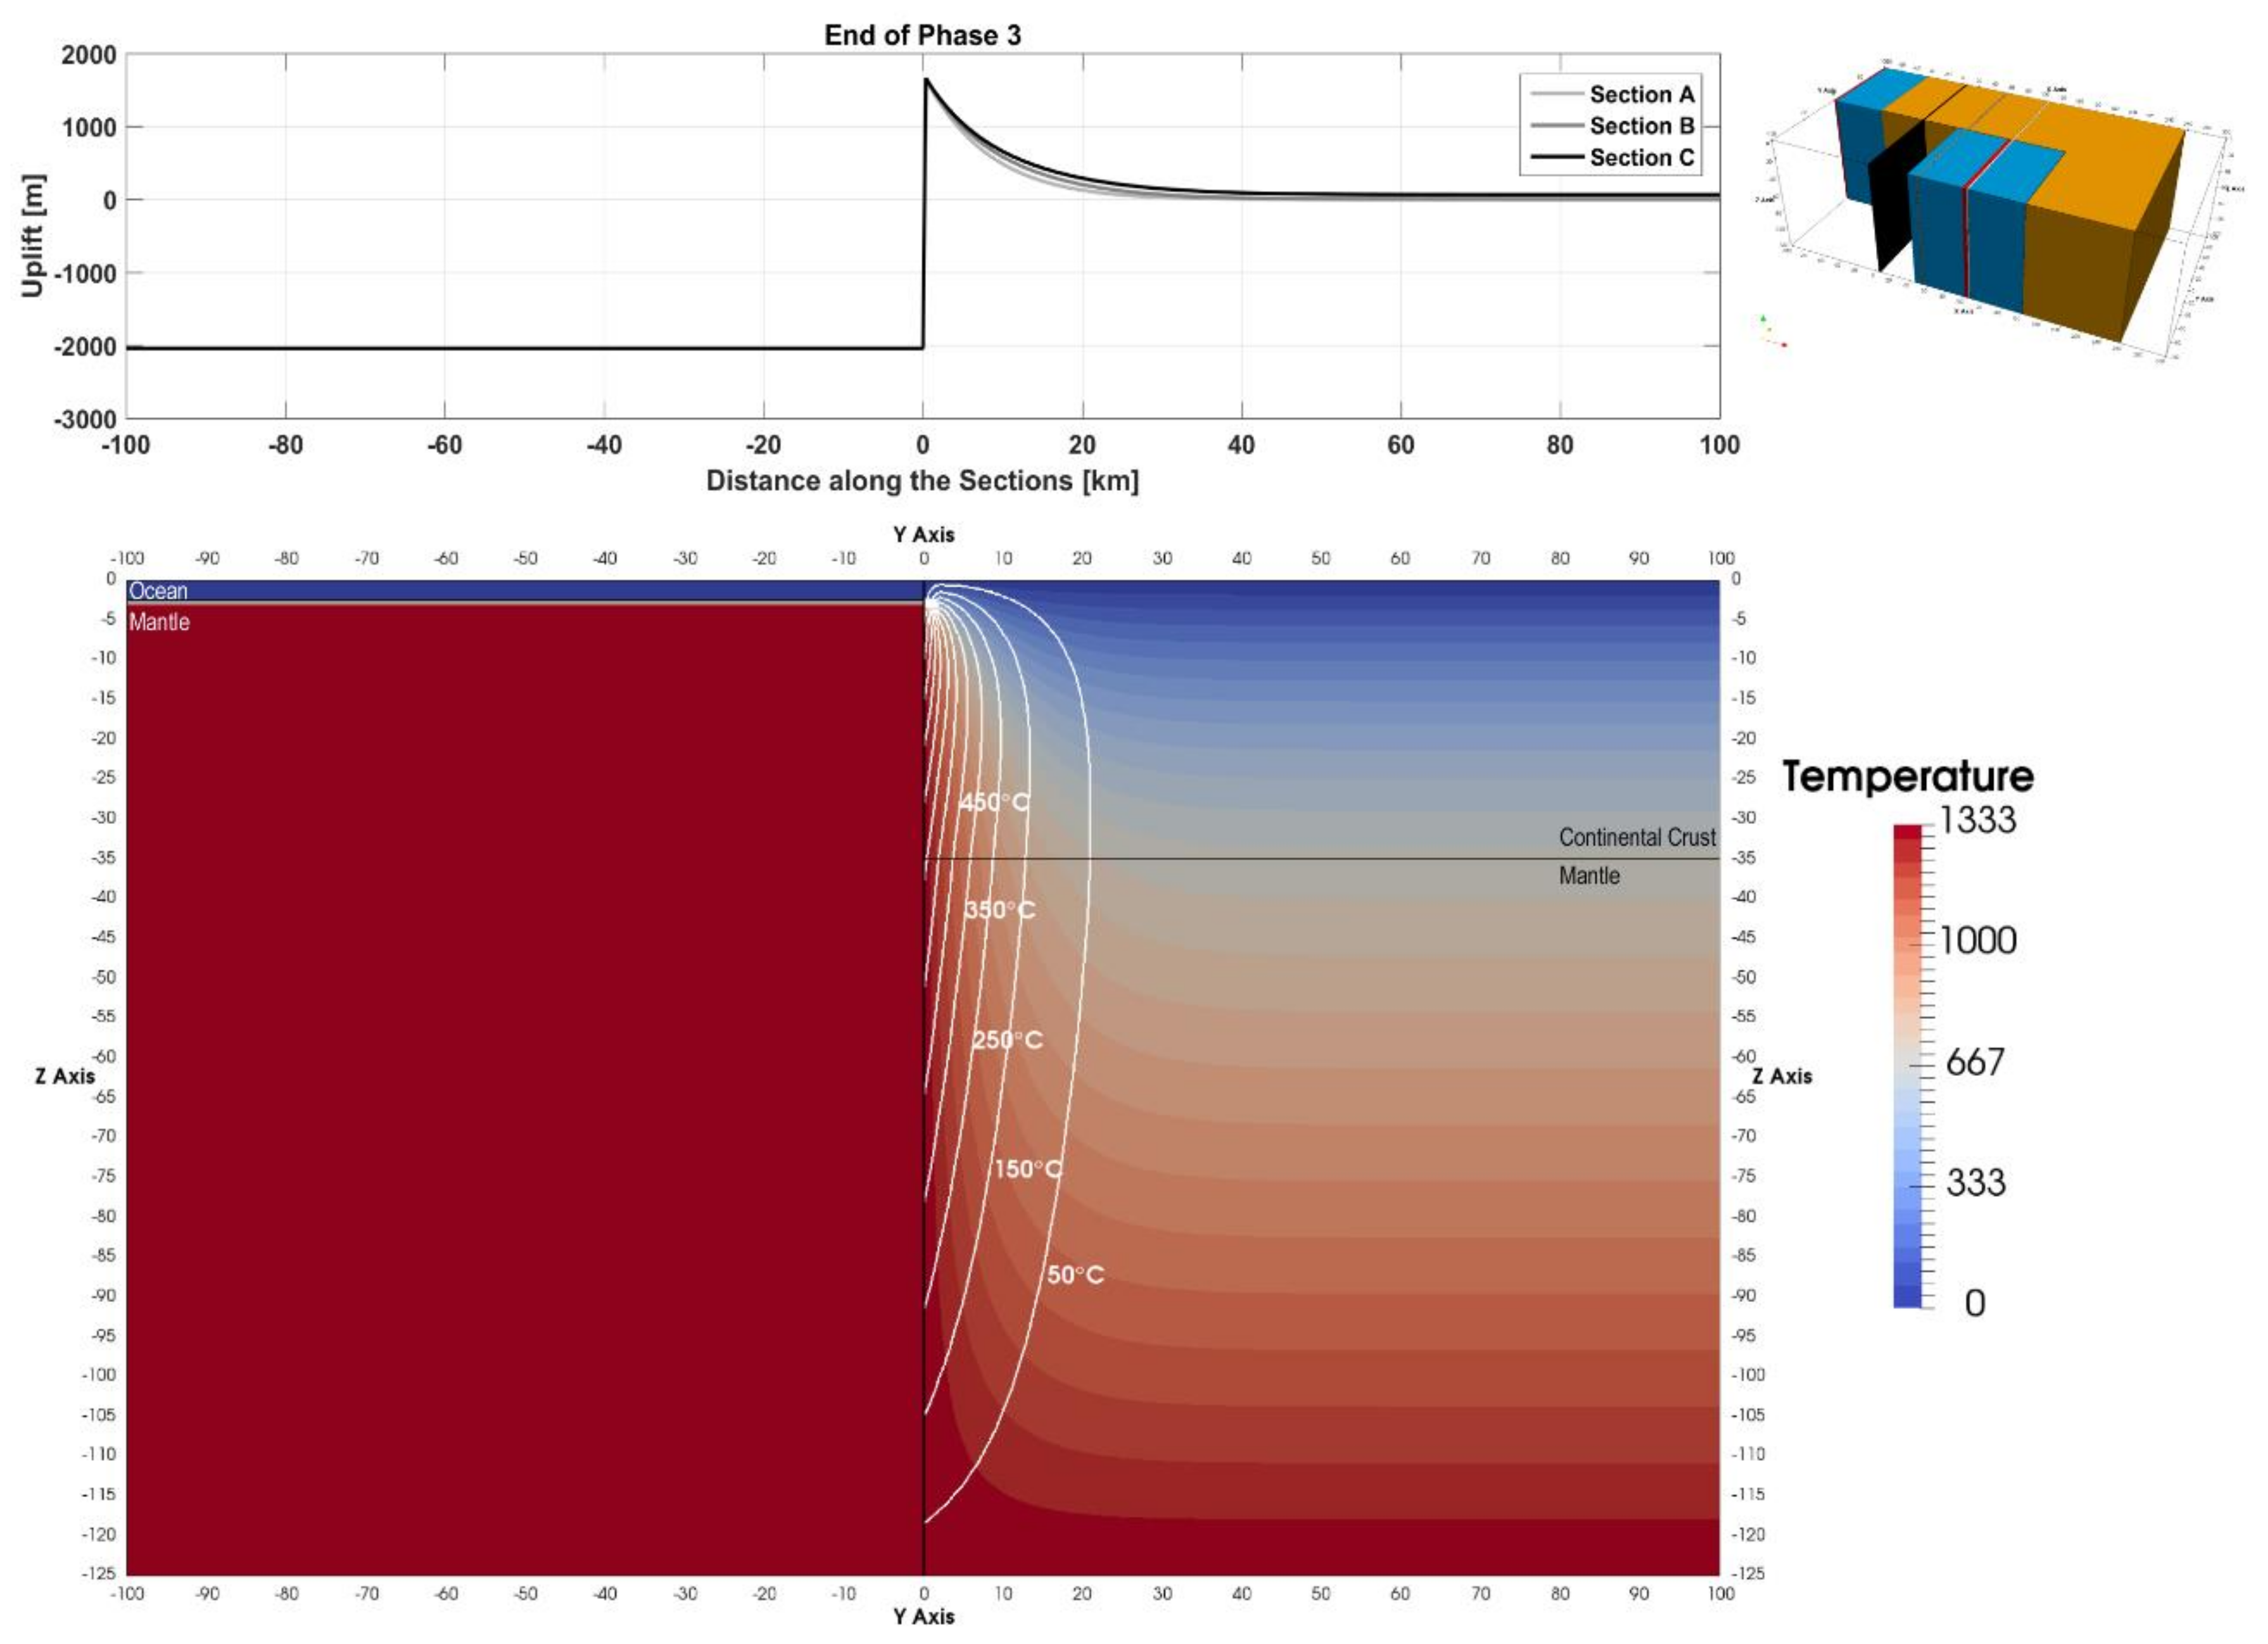
Phase 3 is when the sections pass the actual ridge (Figure 4). All sections experience ridge-pass for 500,000 years during which the continental lithosphere directly borders the ridge crest. The short timeframe of this phase results in an additional ~2 km extension of the thermal anomaly into the continental lithosphere for all sections. The maximum uplift at the margin increases marginally to 1650 m for all sections due to this thermal peak.
3.1.4. 2D Sections—Phase 4
Once the sections have passed the ridge due to their eastward movement, they no longer record a differential movement between the oceanic and continental parts and the transform is no longer active in this region (Figure 5). The thermal evolution of all the sections is investigated after they have experienced 30 Myr in the passive margin phase, i.e., the sections are 300 km east of the eastern ridge. The thermal anomaly has a distinctly different shape compared to the previous phases and extends 48 km into the continental lithosphere for Section A. Cooling of the lithosphere decreases maximum uplift of the continent to 260 m and increases oceanic lithosphere subsidence to 3.7 km. The lateral extent of the thermal anomaly into the continental lithosphere increases with increasing initial distance of the section to the eastern ridge, i.e., it extends to 57 and more than 100 km for sections B and C, respectively (Figure 5). The maximum uplift recorded at sections B and C are 300 and 350 m, respectively. The oceanic lithosphere at the margin cools significantly faster than that away from the margin due to the high thermal gradient present across the transform. This results in increased subsidence of the seafloor at the margin relative to hotter ocean lithosphere farther away.
3.1.5. 3D Continental Block
The thermal effect of the transform margin is explored in three dimensions across an L-shaped block of continental lithosphere initially adjacent to the spreading centers (Figure 1). The evolution of this block is investigated at the end of two stages: (a) after 20.5 Myr when the entire block has completed the active transform phase including ridge pass and (b) after an additional 20 Myr during which the block experiences the passive margin phase.
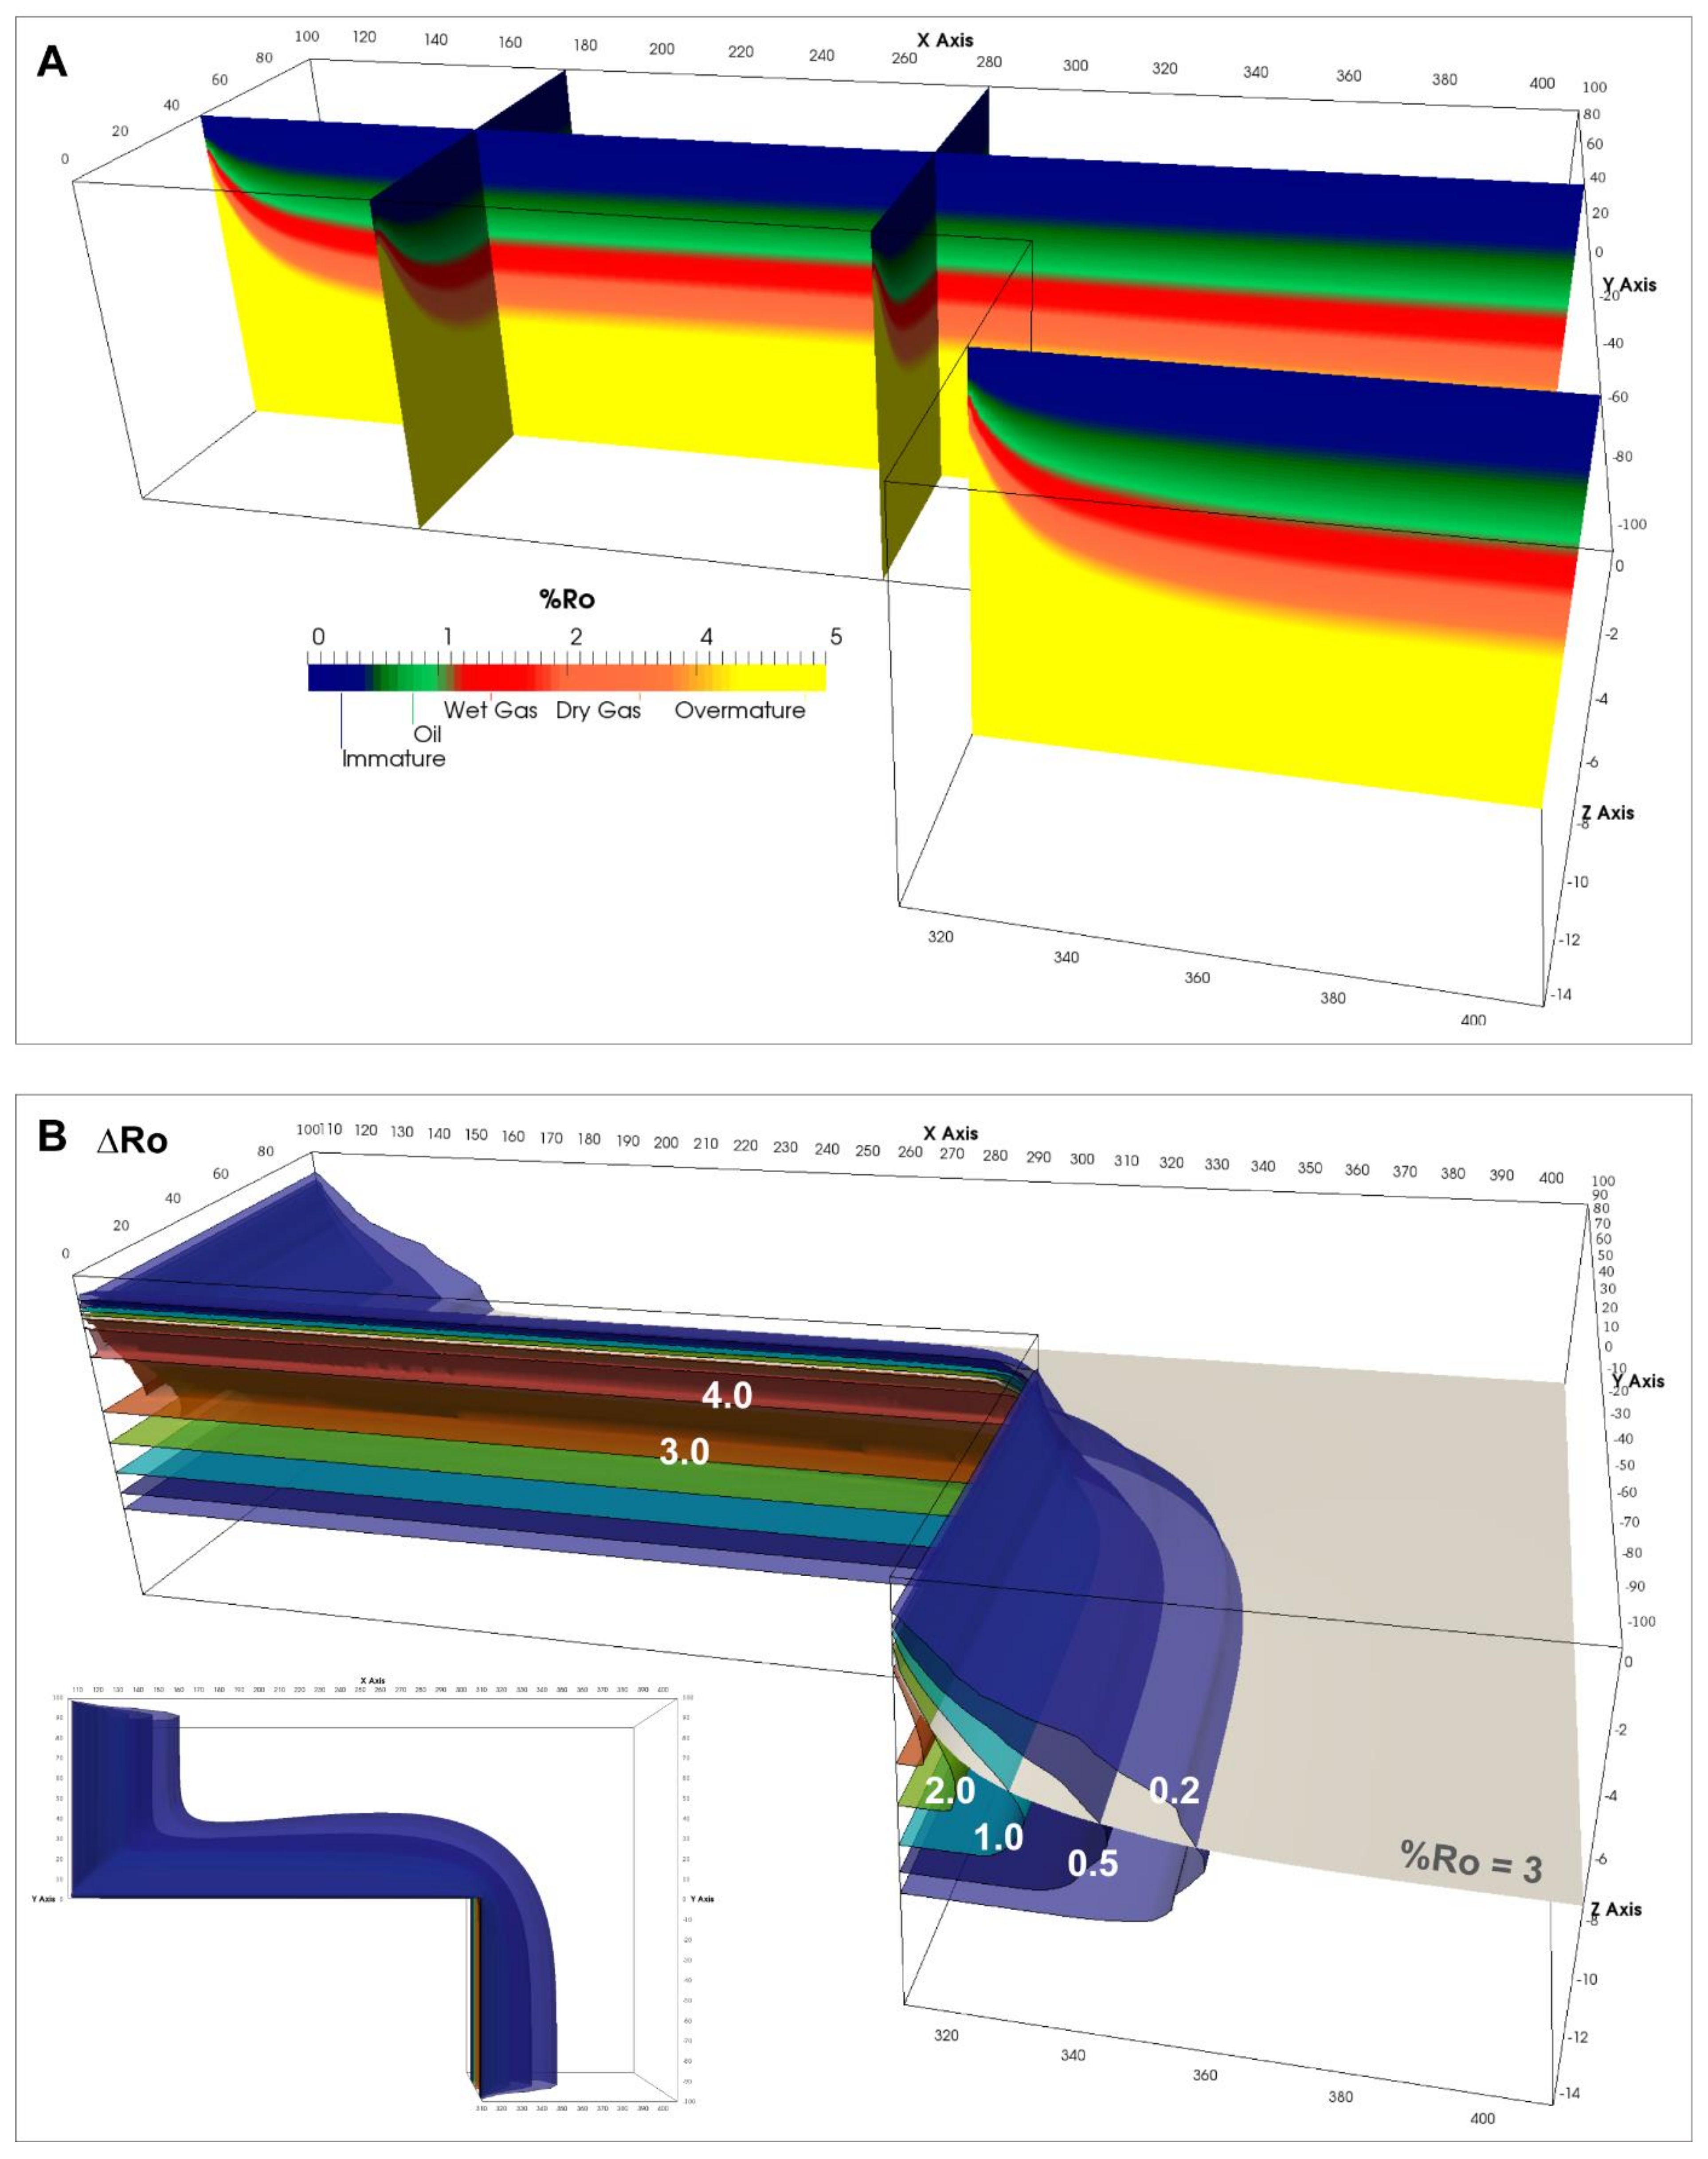
In “Stage A” a major part of the northern part of the block undergoes active transform during this stage. The thermal state is shown in Figure 6A. The northern part of the block is heated along its western edge via the western ridge and its flanks. Additional heat also enters this part of the block via the transform margin edge from the eastern ridge and its flanks. The southern part of the continental block is heated only through the abutting eastern ridge and its flanks. The southern part of block does not undergo active transform. The westernmost tip of the entire block in contact with the transform margin experiences the largest amount of heat transfer that results in an excess temperature anomaly of ~900 °C. The excess temperature anomaly decreases asymmetrically towards the east where the continental lithosphere is only heated by the ridge flank of the eastern ridge. The thermal anomaly (50 °C excess temperature contour) extends approximately 45 km into the continental lithosphere normal from all the edges in contact with either the ridge or the transform margin (Figure 6B). The observed thermal perturbation is largest diagonally across from the westernmost point of the transform margin where it extends ~70 km into the continent. The maximum uplift experienced by the continent is approximately 1700 m at the westernmost edge adjacent to the transform margin (Figure 6C). The uplift experienced by the continental lithosphere is asymmetric. It extends around 75 km inwards from the edges abutting the ridge flanks and 73 km inwards from the transform margin. Uplift experienced by the continental block near the ridge flanks and away from the transform margin is ~400 m. Thermal maturity of sediments (upper 20 km of the continental crust) present within the continental crust depends on their thermal history through time which is influenced by the continental geotherm and heating effects of the ridges. The sediments show significantly increased maturity at the continental edges near the ridge flanks and the transform margin (Figure 7A). Maturity levels vs. depth drop with increasing distance away from these edges where the oil window (0.55 to 1.3 %Ro) is between ~3.5 and 5.5 km deep and the gas window is between ~5.5 and 9 km deep (1.3 to 4.0 %Ro). An increase in thermal maturity due to heat contribution from the spreading centers alone is largest at the continent edges near the ridges flanks and transform margin (Figure 7B). The lateral extent of the maturity perturbation (difference of 0.2 %Ro) is similar to the thermal perturbation. It extends to a maximum depth of ~11 km and extends ~45 km inwards from the edges near the ridge flanks and at the transform margin. The perturbation bulges at the edge where the western and eastern block meet as this region is exposed to excess heating by the ridge and its flanks for the longest period. The %Ro = 3 (dry gas stage) isosurface that is plotted in Figure 7B indicates to which depth the maturity perturbations are relevant.
In “Stage B” the entire block is within the passive transform phase during this period. The continental lithosphere conductively cools during this phase resulting in a maximum excess thermal anomaly of only ~250 °C near the southwestern edge of the block thereby reducing the uplift to a little bit more than 500 m (Figure 8). The excess temperature anomaly in the meantime propagates significantly inwards from the ridge flank abutting the western edge resulting in most of the continental block being uplifted to some degree (Figure 8C). This effect is observed ~100 km into the continental block diagonally from the westernmost point of the transform margin. On the other hand, the thermal perturbation within the continental block decreases in extent near the easternmost point of the transform margin as heat is also lost to the cooling oceanic lithosphere. Maximum maturity levels vs. depth at the margin and ridge flanks are the same as that observed at the end of Stage A (Figure 9A). However, the increase in time and extent during which the continental lithosphere is heated results in the maturity perturbation migrating significantly further into the northern part of the block (Figure 9B).
3.2. Effect of Spreading Velocity
The spreading velocity of the reference model (Section 3.1) is analogous to a slow spreading ridge. In this section, we test the thermal effects of intermediate- and fast-spreading ridges in a transform setting. The setup is the same as the reference model with the spreading velocity increased to 3 and 5 cm/yr, respectively, for the two models in this section. The result presentation follows the layout of the reference model describing the evolution of the marker sections A, B, and C during the different transform phases.
3.2.1. Intermediate Spreading System (3 cm/yr)
The sections A, B, and C spend 0.83, 1.67, and 2.50 Myr in the continent-continent and ocean-continent transform phases each, respectively, with respect to the eastern ridge. Ridge-pass occurs over 0.167 Myr. The thermal anomaly (50 °C isotherm) extends only 1.5, 1, and 0.6 km into the continental lithosphere on the opposite side of the transform from the eastern ridge after continent-ocean transform (Phase 1) is complete. This results in maximum uplift of 180, 140, and 120 m for the sections A, B, and C, respectively (Figure 10A). The thermal anomaly extends 11, 14, and 16.5 km into the continental lithosphere for sections A, B, and C, respectively, after the ocean-continent transform is complete (Phase 2) resulting in maximum uplift of 1.5 km at the transform margin on the continental side for all sections (Figure 10B). The thermal anomaly extends only by 1 km during the short ridge pass phase that increases the maximum uplift by a hundred meters for all the sections (Figure 10C). Lastly, similar to the reference case, the sections are investigated after they have travelled 300 km east of the eastern ridge, i.e., 10 Myr into the passive margin stage (Phase 4). The continental lithosphere across the transform margin cools thereby reducing the maximum thermal anomaly to between 280 and 310 °C. The thermal anomaly, however, extends further into the continental lithosphere to about 37.5, 39, and 48 km in sections A, B, and C, respectively. The maximum uplift within the continental lithosphere is reduced to between 590 and 650 m (Figure 10D).
3.2.2. Fast Spreading System (5 cm/yr)
The sections A, B, and C spend 0.5, 1, and 1.5 Myr in the continent-continent and ocean-continent transform phases each, respectively, with respect to the eastern ridge. The thermal anomaly (50 °C isotherm) extends only 1, 0.6, and 0.3 km into the continental lithosphere on the opposite side of the transform from the eastern ridge after continent-ocean transform (Phase 1) is complete. This results in maximum uplift of 150, 110, and 100 m for the sections A, B, and C, respectively (Figure 11A). The thermal anomaly extends 8.5, 11, and 13 km into the continental lithosphere for sections A, B, and C, respectively, after the ocean-continent transform is complete (Phase 2) resulting in maximum uplift of approximately 1.5 km at the transform margin on the continental side for all sections (Figure 11B). Ridge-pass occurs over 0.1 Myr during which the thermal anomaly extends only by 1 km and the maximum uplift increases by a hundred meters for all the sections (Figure 11C). Lastly, similar to the reference case, the sections are investigated after they have travelled 300 km east of the eastern ridge, i.e., 6 Myr into the passive margin stage (Phase 4). The continental lithosphere across the transform margin cools thereby reducing the maximum thermal anomaly to between 330 and 310 °C. The thermal anomaly, however, extends further into the continental lithosphere to about 30.5, 31.5, and 34.5 km in sections A, B, and C, respectively. The maximum uplift within the continental lithosphere is reduced to between 700 and 750 m (Figure 11D).
3.3. Effect of Material Properties
The effect of changing material properties such as density and thermal conductivity on heat transfer across the transform margin is investigated by changing the material properties of the upper 20 km of the continental crust to values similar to those representing sediments (Table 1). The rest of the setup is the same as the reference case in Section 3.1.
3.3.1. Sections
The thermal anomaly extends 4, 2.5, and 1.5 km into the continental lithosphere at the end of the continent-continent transform stage for sections A, B, and C, respectively. This results in a maximum uplift near the transform margin of 240, 160, and 130 m (Figure 12A). The continental lithosphere is increasingly heated across the margin by oceanic lithosphere during the continent-ocean transform phase resulting in the thermal anomaly extending 18, 23, and 30.5 km for section A, B, and C, respectively. The corresponding maximum uplift at the margin is similar for all sections at around 1.45 km (Figure 12B). The short time frame of the ridge pass stage allows the thermal anomaly to extend further by around 1.5 km for all sections and increases maximum uplift slightly to 1.5 km (Figure 12C). Lastly, similar to the reference case, the sections are investigated after they have migrated 300 km east of the eastern spreading center during the passive margin stage. The continental lithosphere cools during this stage and the thermal anomaly extends 44, 52.5, and 78 km for section A, B, and C, respectively. The maximum uplift experienced by the continental lithosphere reduces to between 200 and 250 m (Figure 12D).
3.3.2. 3D Continental Block
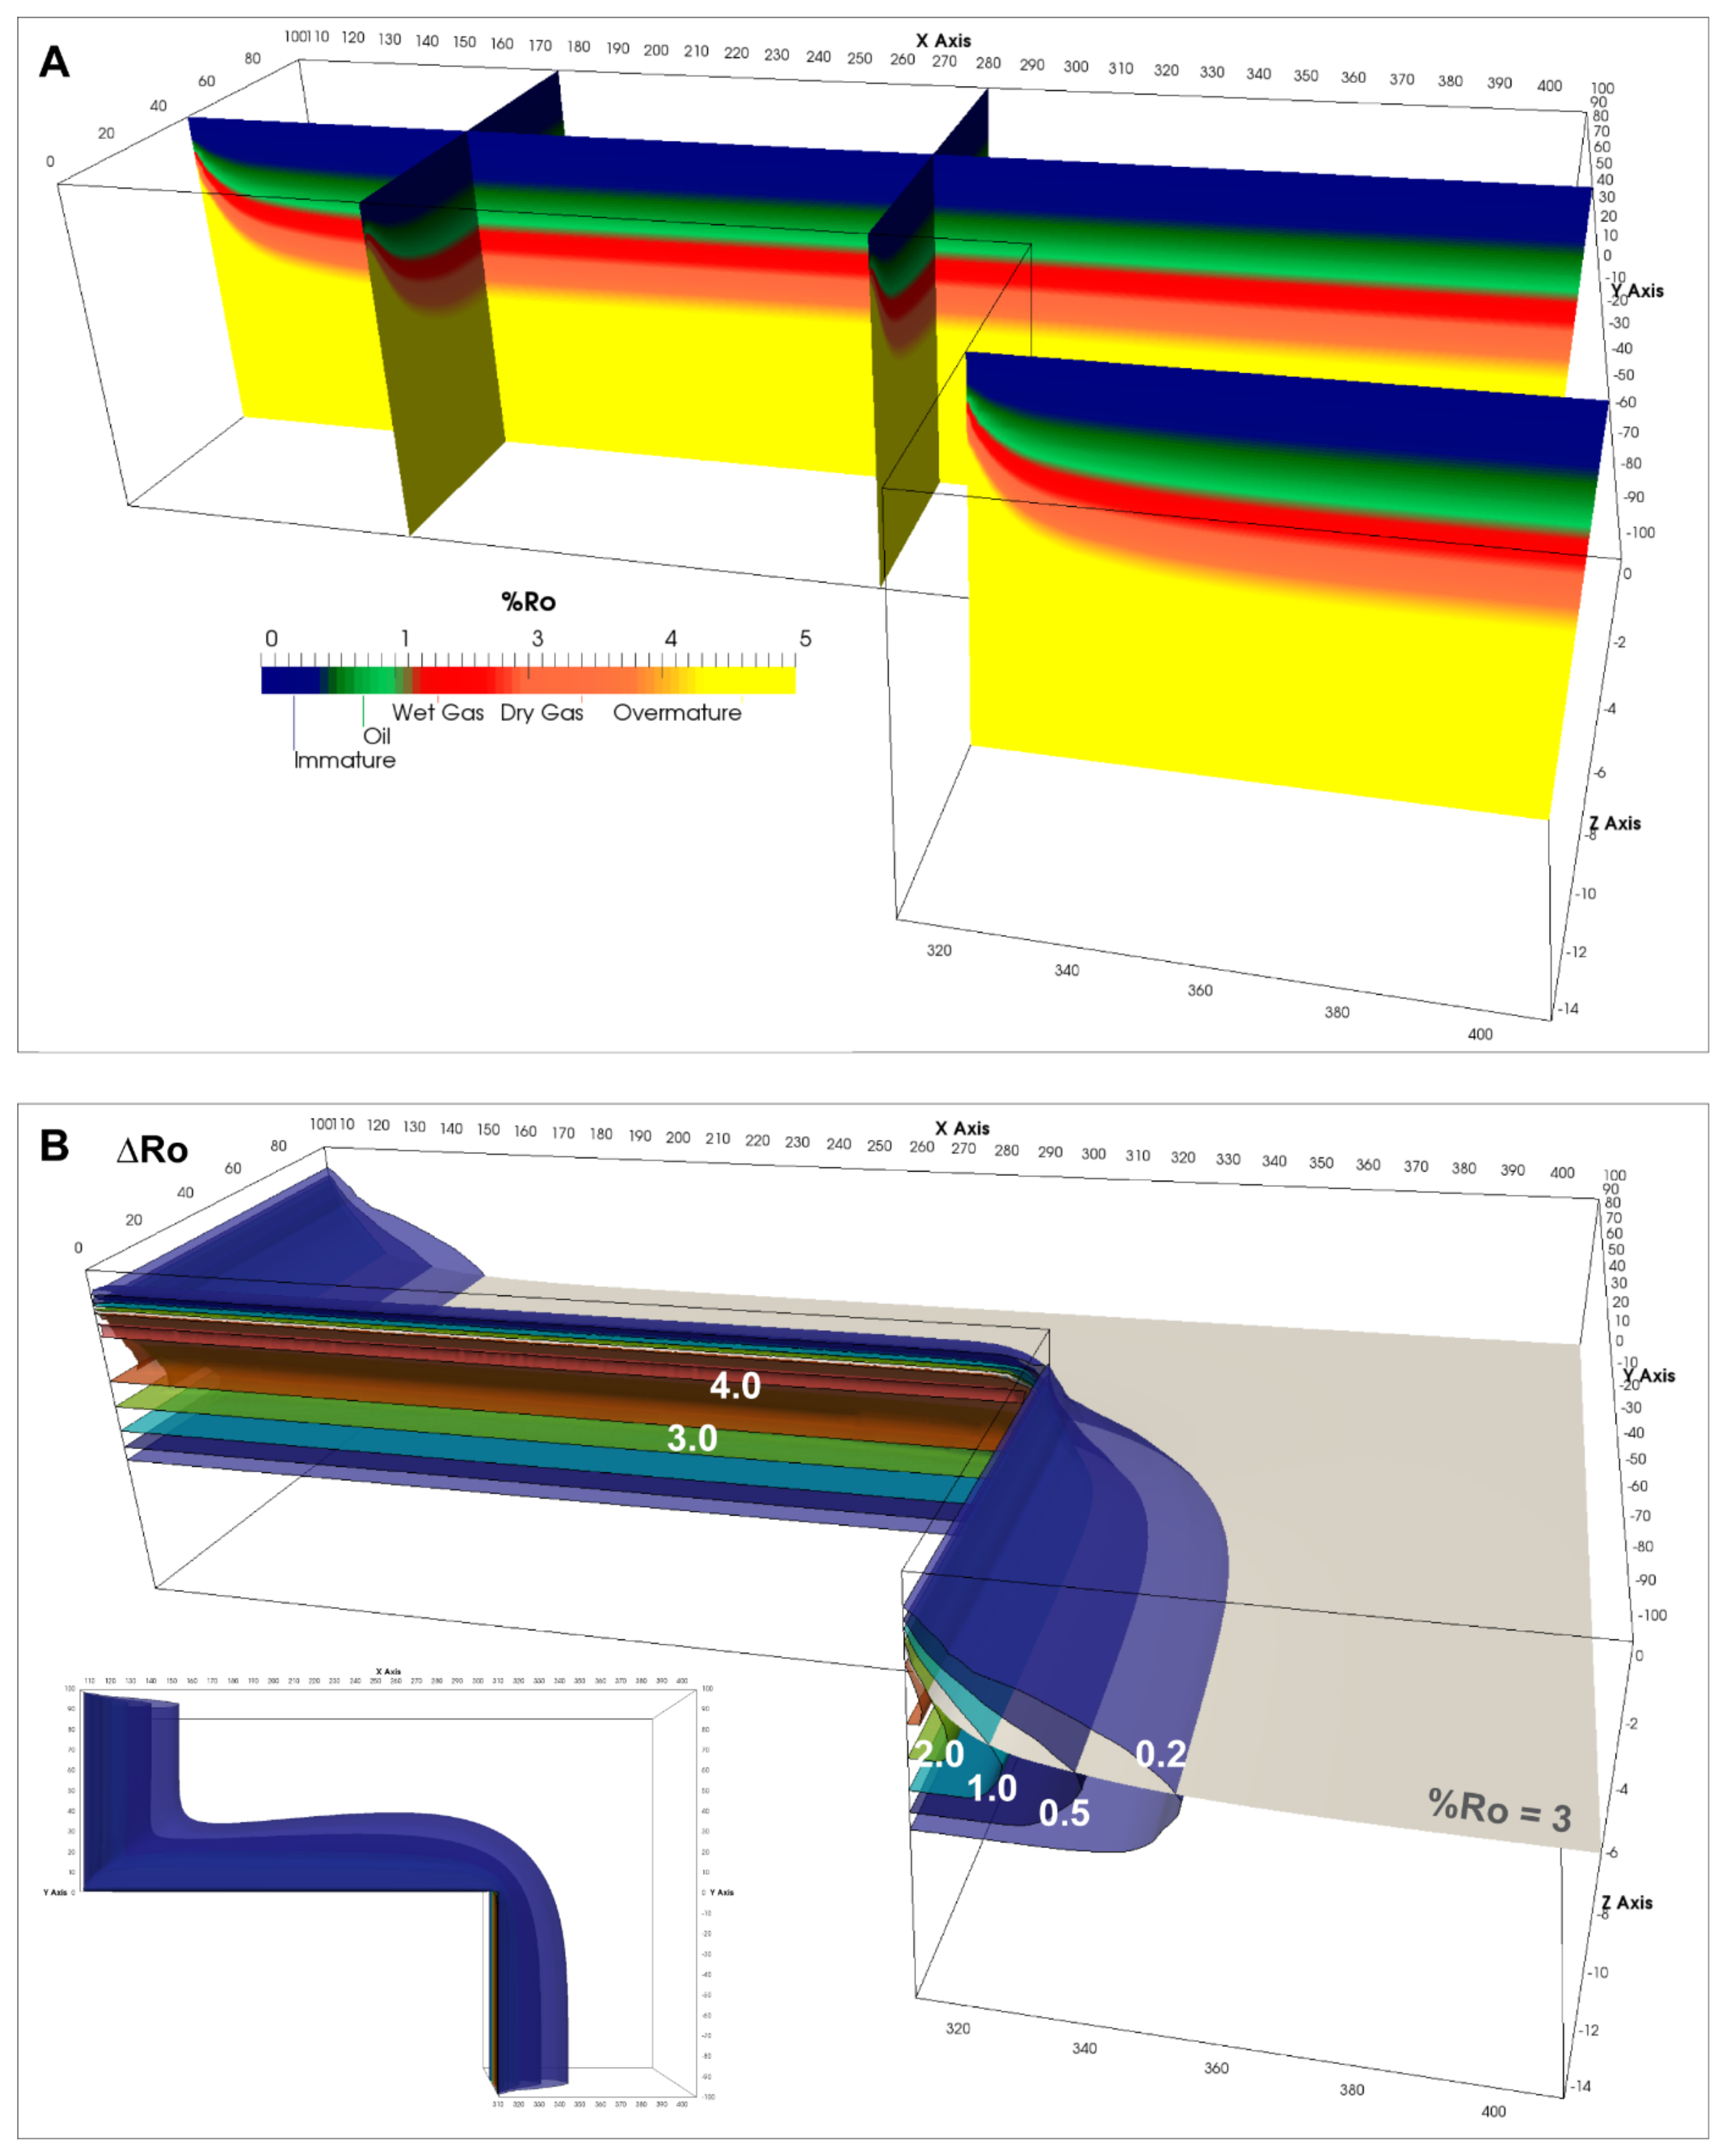
Similar to the reference case, the evolution of this block is investigated at the end of two phases: (a) after 20.5 Myr when the entire block has completed the active transform phase including ridge pass and (b) after an additional 20 Myr during which the block experiences the passive margin phase. The westernmost tip of the block in contact with the transform margin experiences the largest amount of heat transfer that results in an excess temperature anomaly of ~705 °C at the end of Phase A (Figure 13). The excess temperature anomaly decreases asymmetrically towards the east where the continental lithosphere is only heated by the ridge flank of the eastern ridge. The thermal anomaly (50 °C isosurface) extends approximately 45 km into the continental lithosphere from all the edges in contact with either the ridge or the transform margin. Consequently, maximum uplift experienced by the continent is approximately 1500 m at the westernmost edge adjacent to the transform margin. The uplift suffered by the continental lithosphere is asymmetric. It extends around 74 km inwards from the edges abutting the ridge flanks and 71 km inwards from the transform margin. Sediments show significantly increased maturity due to heat transfer at the continental edges near the ridge flanks and the transform margin. An increase in thermal maturity due to heat contribution from the spreading centers alone is largest at the continent edges near the ridges flanks and transform margin (Figure 14). This perturbation (difference of 0.2 %Ro) extends to a maximum depth of ~9 km and extends ~41 km inwards from the edges near the ridge flanks and at the transform margin. The perturbation bulges at the edge where the western and eastern block meet as this region is exposed to excess heating by the ridge and its flanks over the longest period. The entire block is within the passive transform phase during the next 20 Myr (Phase B). The continental lithosphere conductively cools during this phase resulting in a maximum excess thermal anomaly of only ~210 °C near the southwestern edge of the block thereby reducing the uplift to a little bit less than 400 m. The excess temperature anomaly in the meantime propagates inwards from the ridge flank abutting the western edge resulting in most of the continental block, with the exception of the northeast corner, being uplifted to some degree. Maturity levels vs. depth are the same as that observed at the end of Phase A. However, the increase in time during which the continental lithosphere is heated results in the maturity perturbation migrating significantly further into the block.
4. Discussion
The 3D model presented in this manuscript explores the thermal evolution of the continental lithosphere along a continent-ocean transform margin and the results are compared to those obtained by Todd and Keen [12] and Gadd and Scrutton [8]. Todd and Keen [12] use the half-space cooling model described by Parsons and Sclater [14] as boundary conditions for the continental lithosphere section for a given distance away from the ridge which results in the ‘hot’ end-member scenario. Gadd and Scrutton [8], on the other hand, account for the additional lateral cooling of the ridge flank into the continental lithosphere prior to heating the continental section at the same distance away from the ridge, thereby, resulting in the ‘cold’ end-member scenario.
In our models, the thermal structure of continental lithosphere undergoing continent-continent transition (Phase 1) is changed even though it is not directly exposed to hot oceanic lithosphere. Transfer of heat occurs across the continent-ocean transform margin from the ridge flanks to continental lithosphere undergoing ocean-continent transform and into continental lithosphere directly abutting oceanic lithosphere on the same side of the margin. Heat transported into continental lithosphere on either side of the margin is then transported into continental lithosphere that is in the continent-continent phase. The thermal perturbation within the continental lithosphere in Phase 1 depends on the time spent by the continental lithosphere within Phase 1 and various material properties, both of which determine how fast heat can be transported into the continental lithosphere under consideration. Previous 2D models [8,9,12,13] ignore this effect and assume that heat is not transferred from the oceanic lithosphere into continental lithosphere during this stage. Our model shows that this thermal perturbation extends (50 °C excess temperature contour) for 4.5 km into the continental lithosphere resulting in 260 m of maximum uplift for a section that is initially 50 km away from the ridge spreading with a velocity of 1 cm/yr (reference model). The extent of the thermal perturbation and corresponding uplift decreases as the distance of the continental lithosphere from the ridge increases. Continental lithosphere is further heated as it encounters increasingly hotter oceanic lithosphere during ocean-continent transform (Phase 2). The thermal perturbation in the continental lithosphere extends from 19 to 33 km into the section depending on the time spent by the continental lithosphere in this stage. The resulting maximum uplift calculated at the margin is 1600 m for all sections as the vertical thermal structure at the margin is similar. The calculated uplift from our model lies between those obtained by Todd and Keen [12] and Gadd and Scrutton [8] who calculated maximum uplift values of 2400 and 1300 m, respectively, at the end of Phase 2. This is because Todd and Keen [12] assume that the oceanic lithosphere abutting the continental lithosphere has only cooled vertically and the thermal structure can be, therefore, described by the half-space cooling model [14] resulting in a ‘hot’ end-member model. On the other hand, Gadd and Scrutton [8] try to account for additional lateral cooling of the oceanic lithosphere against cold continental lithosphere which results in a ‘cold’ end-member model. Our model, by its inherent 3D nature, accounts for vertical and lateral cooling of the oceanic lithosphere before it enters the ocean-continent transform phase. The resulting thermal structure is slightly higher than that obtained by Gadd and Scrutton [8] since oceanic lithosphere cools slower laterally as the continental lithosphere it cools against will be heated due to prior heat transfer (similar to Phase 1). Correspondingly, the extent of the thermal perturbation obtained from the 3D model (~19 km) at the end of ocean-continent transform is also larger than that obtained by the ‘cold’ end-member model (~15 km) due to increased heating in Phases 1 and 2. The continental lithosphere is heated by the ridge crest during ridge-pass (Phase 3) which does not change the maximum uplift at the margin since the vertical thermal structure does not change significantly when compared to that from the end of Phase 2. The short duration of this phase also results in the thermal perturbation further extending by only ~2 km into the continental lithosphere. Continental lithosphere cools alongside the abutting oceanic lithosphere in the passive margin stage (Phase 4). Although, the time spent by each investigated section in this phase is the same (30 Myr for the reference model), the final thermal structure for each section is different due to variations in the thermal structure and the extent of the thermal perturbation into the continental lithosphere at the start of this phase.
The thermal evolution of the 3D L-shaped continental block initially adjacent to the ridge and the transform margin is more complex than the 2D sections. During the first stage (initial 20.5 Myr), the northern part of the block undergoes active transform. The entire block is heated by the ridges and hot oceanic lithosphere via the edges adjacent to the two ridges. A major portion of the heat is also transferred into the northern part of the block as the eastern ridge migrates from east to west along the transform. The continental block is hottest at its western edge at the end of the active transform stage where the maximum thermal perturbation is ~900 °C that also results in a maximum uplift of 1600 m at the same place. The excess temperature anomaly (50 °C isosurface) extends relatively symmetrically ~45 km away from the ridges and the transform margin into the continental lithosphere. Thermal maturity of sediments within the continental lithosphere show increased maturity at the ridge flanks and the transform margin that gradually decreases to background values away from these regions. An increase in maturity (0.2 Δ%Ro isosurface) due to heat transfer from ridge processes alone is observed ~45 km into the continental block. The continental block experiences passive margin formation during the next stage (additional 20.5 Myr) during which the entire block cools. However, cooling of the block is asymmetric due to the asymmetric thermal structure at the start of the stage. This results in the excess temperature anomaly migrating substantially diagonally inwards from the southwestern edge of the block while it shrinks the most at the eastern edge of the transform margin. The maximum thermal anomaly and uplift in the continental block are reduced to around 250 °C and 500 m, respectively. Most of the northwestern part of the continental block (~100 km) is affected by the thermal effects of the transform margin where the curvature of the thermal perturbation extends to the northern edge. Synthetic vitrinite reflectance calculations provide information based on both temperature and time. In this study, the perturbation in vitrinite reflectance due to ridge and transform margin processes shows the same extent into the northern part (~100 km) of the continental block from the transform margin as the 50 °C excess temperature anomaly. The southern part of the block does not receive a significant thermal contribution from the transform margin and is dominated by heat transfer from the ridge.
Variations in spreading velocity not only change the amount of time spent by the continental lithosphere in each of the transform margin phases but also the thermal structure of the abutting oceanic lithosphere. Overall, an increase in spreading velocity translates to a decrease in the extent of the thermal perturbation into the continental lithosphere as it spends correspondingly less time exposed to hot oceanic lithosphere during the active transform and ridge pass phases. The perturbation extends to less than 16.5 and 13 km at the end of ocean-continent transform for intermediate and fast spreading ridges, respectively. The maximum uplift within the continental lithosphere, however, is not influenced by spreading rate as it depends on the vertical thermal structure, which is similar close to the margin for all spreading velocities at the end of the active transform stage.
The effect of material properties is also briefly explored by adding ‘sediments’ to the top 20 km of the continental crust, i.e., material with significantly lower thermal conductivity and slightly lower density that crustal material. As expected, the extent of the thermal perturbation decreases due to the decrease in the overall thermal conductivity of the continental crust. The extent of the thermal perturbation decreases by ~10% in the model with a sedimentary layer when compared to the reference model. This effect is also observed in the synthetic thermal maturity levels of the sediments.
Model Features and Limitations
Compared to the previous 2D models, the 3D model presented in this paper has some inherent advantages:
Some of the 2D models overestimate heating of the continental lithosphere by a factor 2 when the half-space cooling model is used without accounting for enhanced cooling of the oceanic lithosphere adjacent to cold continental lithosphere (Todd and Keen, 1989). Consequently, other predictions such as uplift that are dependent on the thermal evolution will also be overestimated.
The 3D model is not confined to a 2D section of the continental lithosphere.
2D solutions overestimate the amount of heat transfer at the edges of the transform margin. This may be significant if the transform margin is short or at fast spreading rates (Gadd and Scrutton, 1997).
The limitations of the model are outlined below:
The model geometry, initial and boundary conditions, and kinematics are greatly simplified. This facilitates the analysis and the identification of first order system response. Refined models could be used to study more detailed and realistic cases, such as done, for example, by Maystrenko and Gernigon [20] for the present day 3D temperature distribution beneath the Mid-Norwegian continental margin. In particular, our assumption of a thermal steady state in an unstretched lithosphere as the initial condition underestimates the effect of previous rift episodes. In this respect, the initial condition of our models should be considered a cold end-member case.
Frictional heating within the transform fault has not been included. However, previous studies on transform margins have shown that its effect accounts for only about 5% of the conductive thermal uplift [12].
The 3D model computes uplift based on local isostasy alone. It neglects mechanical coupling across the fracture zone and regional isostasy which reduces the thermal uplift on the continental margin by a factor of 2 to 3 [8,9]. However, uncertainties in material properties such as the thermal expansion coefficient may also result in similar variations [8].
Erosion of the continental crust during uplift has not been included. Isostatic rebound resulting from sediment unloading will promote further exhumation.
Hydrothermal circulation and volcanism within the fracture zone may change the thermal structure there and is not considered in the model [16].
The used measures for the various perturbations are conservative. We chose 50 °C for the excess temperature anomaly and 0.2 Δ%Ro for the maturity perturbation. These two correspond quite well as long as the region of interest is progressively heated. Depending on the application and required precision, it could be argued that smaller temperature and maturity perturbations are relevant in which case the extent of the perturbations into the continental lithosphere would be larger.
5. Conclusions
The model presented in this paper presents the first fully 3D perspective of the thermal evolution of the continental block through the development of an ocean-continent transform. The 3D model shows that the thermal structure of the continental block lies between that predicted by previous 2D models that under- or over-estimated the thermal perturbation within the continent and thereby also under- or over-estimated the ensuing uplift. We also show that, contrary to previous models, continental lithosphere opposite the ridge along the transform margin can be heated to a small but perceptible degree during the continent-continent transform stage. The thermal effect experienced by the continental block is asymmetric with the maximum values observed at the trailing edge near the transform margin that was exposed to ridge processes for the longest period. Subsequently, thermal maturity and uplift within the continental lithosphere is also asymmetric with maximum values observed within the same region. Increase in spreading velocity results in a decrease in the extent of the thermal perturbation experienced by the continent as the time spent by the continent in the active transform phases is correspondingly reduced. We also find that variations in material properties can have a limited impact of up to 10% on the overall thermal structure of the continental block. Our model provides an overall look into the three dimensionality of heat transfer across an active transform margin and its effect on continental uplift and sediment maturity. The thermal effect of transform margin processes can extend up to 100 km into the adjacent continental block.
Author Contributions
Conceptualization, D.W.S., K.I. and E.H.H.; methodology, D.W.S.; investigation, D.W.S., K.I. and E.H.H.; writing—original draft preparation, K.I.; writing—review and editing, D.W.S. and E.H.H.; visualization, D.W.S. and K.I. All authors have read and agreed to the published version of the manuscript.
Funding
This research received no external funding.
Acknowledgments
We would like to thank Marcin Dabrowski for his contributions to this work and Lars Rüpke for his guidance concerning the setup of the models. We would also like to acknowledge Aker BP for giving permission to publish this work.
Conflicts of Interest
The authors declare no conflict of interest.
References
- Atwater, T.; Macdonald, K.C. Are spreading centers perpendicular to their transform faults? Nature 1977, 270, 715–719. [Google Scholar] [CrossRef]
- Gerya, T. Origin and models of oceanic transform faults. Tectonophysics 2012, 522, 34–54. [Google Scholar] [CrossRef]
- Lachenbruch, A.H.; Thompson, G.A. Oceanic ridges and transform faults: Their intersection angles and resistance to plate motion. Earth Planet. Sci. Lett. 1972, 15, 116–122. [Google Scholar] [CrossRef]
- Le Pourhiet, L.; May, D.A.; Huille, L.; Watremez, L.; Leroy, S. A genetic link between transform and hyper-extended margins. Earth Planet. Sci. Lett. 2017, 465, 184–192. [Google Scholar] [CrossRef] [Green Version]
- Oldenburg, D.W.; Brune, J.N. An explanation for the orthogonality of ocean ridges and transform faults. J. Geophys. Res. 1975, 80, 2575–2585. [Google Scholar] [CrossRef]
- Sykes, L.R. Mechanism of earthquakes and nature of faulting on the mid-oceanic ridges. J. Geophys. Res. 1967, 72, 2131–2153. [Google Scholar] [CrossRef] [Green Version]
- Wilson, J.T. Transform faults, oceanic ridges, and magnetic anomalies southwest of Vancouver Island. Science 1965, 150, 482–485. [Google Scholar] [CrossRef] [PubMed]
- Gadd, S.; Scrutton, R. An integrated thermomechanical model for transform continental margin evolution. Geo-Mar. Lett. 1997, 17, 21–30. [Google Scholar] [CrossRef]
- Lorenzo, J.; Vera, E. Thermal uplift and erosion across the continent-ocean transform boundary of the southern Exmouth Plateau. Earth Planet. Sci. Lett. 1992, 108, 79–92. [Google Scholar] [CrossRef]
- Reid, I. Effects of lithospheric flow on the formation and evolution of a transform margin. Earth Planet. Sci. Lett. 1989, 95, 38–52. [Google Scholar] [CrossRef]
- Rüpke, L.H.; Schmid, D.W.; Hartz, E.H.; Martinsen, B. Basin modelling of a transform margin setting: Structural, thermal and hydrocarbon evolution of the Tano Basin, Ghana. Pet. Geosci. 2010, 16, 283–298. [Google Scholar] [CrossRef]
- Todd, B.; Keen, C. Temperature effects and their geological consequences at transform margins. Can. J. Earth Sci. 1989, 26, 2591–2603. [Google Scholar] [CrossRef]
- Vågnes, E. Uplift at thermo-mechanically coupled ocean–continent transforms: Modeled at the Senja fracture zone, southwestern Barents Sea. Geo-Mar. Lett. 1997, 17, 100–109. [Google Scholar]
- Parsons, B.; Sclater, J.G. An analysis of the variation of ocean floor bathymetry and heat flow with age. J. Geophys. Res. 1977, 82, 803–827. [Google Scholar] [CrossRef]
- Behn, M.D.; Boettcher, M.S.; Hirth, G. Thermal structure of oceanic transform faults. Geology 2007, 35, 307–310. [Google Scholar] [CrossRef]
- Grevemeyer, I.; Rüpke, L.H.; Morgan, J.P.; Iyer, K.; Devey, C.W. Extensional tectonics and two-stage crustal accretion at oceanic transform faults. Nature 2021, 591, 402–407. [Google Scholar] [CrossRef] [PubMed]
- Dabrowski, M.; Krotkiewski, M.; Schmid, D.W. MILAMIN: MATLAB-based finite element method solver for large problems. Geochem. Geophys. Geosystems 2008, 9. [Google Scholar] [CrossRef]
- Krotkiewski, M.; Dabrowski, M. MUTILS-a set of efficient modeling tools for multi-core CPUs implemented in MEX. In Proceedings of the EGU General Assembly, Vienna, Austria; 2013; p. 7877. [Google Scholar]
- Sweeney, J.; Burnham, A.K. Evaluation of a simple model of vitrinite reflectance based on chemical kinetics. Aapg Bull. 1990, 74, 1559–1570. [Google Scholar]
- Maystrenko, Y.P.; Gernigon, L. 3-D temperature distribution beneath the Mid-Norwegian continental margin (the Vøring and Møre basins). Geophys. J. Int. 2018, 212, 694–724. [Google Scholar] [CrossRef]
Figure 1.
Model geometry through various stages along the transform margin. (A) Initial configuration: Two 5 km wide ridges are formed (red boxes) and spread symmetrically around their axes (white arrows). The orange 3D marker block is used to track the evolution of the continental lithosphere. Note that only the westernmost L-shaped marker domain of the eastern continental lithosphere is displayed here; the total model extent is 1000 km. The transparent grey box represents the initial continental lithosphere complementing the orange marker block. The marker planes, A, B, and C, are located 50, 100, and 150 km away from the left edge of the eastern ridge and extend along the entire N-S axis. The marker sections are frozen w.r.t. the 3D marker block, i.e., the entire section moves east with the spreading velocity. (B) Position of the marker sections and the 3D marker domain at the end of continent-continent transform at Section A. Blue regions denote oceanic lithosphere. (C) Configuration at the end of the ocean-continent transform phase at Section A. (D) Configuration at the end of the ridge pass phase at Section A. (E) Final configuration at the end of the simulation, far into the passive margin phase of sections A to C.

Figure 2.
Thermal structure of the continental lithosphere along Section A at the end of Phase 1 (2.5 Myr). The thermal anomaly (white contour) extends 4.5 km laterally into the continental lithosphere across the transform margin. The vertical central line denotes the transform margin. The lithosphere to the left of the margin is continent adjacent to the leading ridge flank. The excess temperature contours are restricted to the northern side of the transform margin. The upper left panel shows the corresponding uplift calculated along all the sections at the end of Phase 1. Note that given their different initial positions, the time to reach the end of Phase 1 is different for the three sections. The upper right image shows the model configuration at the end of Phase 1 for Section A.

Figure 3.
Thermal structure of the continental lithosphere along section A at the end of Phase 2 (5 Myr). The thermal anomaly (white contour) extends 19 km laterally into the continental lithosphere across the transform margin. The vertical central line denotes the transform margin. The lithosphere to the left of the margin is the leading edge of the 5 km wide ridge crest. The excess temperature contours are restricted to the northern side of the transform margin. The upper left panel shows the corresponding uplift calculated along all the sections at the end of Phase 2. Note that given their different initial positions, the time to reach the end of Phase 2 is different for the three sections. The upper right image shows the model configuration at the end of Phase 2 for Section A.

Figure 4.
Thermal structure of the continental lithosphere along Section A at the end of Phase 3 (5.5 Myr). The thermal anomaly (white contour) extends 20 km laterally into the continental lithosphere across the transform margin. The vertical central line denotes the transform margin. The lithosphere to the left of the margin is the trailing edge of the 5 km wide ridge crest. The excess temperature contours are restricted to the northern side of the transform margin. The upper left panel shows the corresponding uplift calculated along all the sections at the end of Phase 3. Note that given their different initial positions, the time to reach the end of Phase 3 is different for the three sections. The upper right image shows the model configuration at the end of Phase 3 for Section A.

Figure 5.
Thermal structure of the continental lithosphere along section A after 30 Myr in Phase 4 (35.5 Myr). The thermal anomaly (white contour) extends 48 km laterally into the continental lithosphere across the transform margin. The vertical central line denotes the transform margin. The lithosphere to the left of the margin is oceanic lithosphere with an age of 30 Ma. The excess temperature contours are restricted to the northern side of the transform margin. The upper left panel shows the corresponding uplift calculated along all the sections at 30 Myr into Phase 4. Note that all sections are 300 km east of the eastern ridge at this time. The upper right image shows the model configuration at 30 Myr into Phase 4 for Section A.

Figure 6.
Thermal state of the continental block at the end of Stage A (20.5 Myr). (A) Side view of excess temperature contour surfaces within the continental lithosphere with a 200 °C stepping. Inset shows the position of the 3D marker block. (B) Map view of the 50 °C excess temperature contour surface. (C) Uplift experienced by the continental lithosphere at the end of Stage A.

Figure 7.
(A) Thermal maturity of sediments within the continental block at the end of Stage A. (B) Increase in thermal maturity of sediments within the continental block at the end of Stage A due to heat contribution from the spreading centers only. The thermal maturity isosurface at the onset of dry gas (%Ro = 3) is also shown. Inset shows top view. Note that the Z-axis is restricted to the upper 15 km and vertically exaggerated.

Figure 8.
Thermal state of the continental block at the end of Stage B (40.5 Myr). (A) Side view of excess temperature contour surfaces within the continental lithosphere with a 50 °C stepping. Inset shows the position of the 3D marker block. (B) Map view of the 50 °C excess temperature contour surface. (C) Uplift experienced by the continental lithosphere at the end of Stage B.

Figure 9.
(A) Thermal maturity of sediments within the continental block at the end of Stage B. (B) Increase in thermal maturity of sediments within the continental block at the end of Stage B due to heat contribution from the spreading centers only. The thermal maturity isosurface at the onset of dry gas (%Ro = 3) is also shown. Inset shows top view. Note that the Z-axis is restricted to the upper 15 km and vertically exaggerated.

Figure 10.
Uplift generated in the lithosphere along sections A, B, and C at the end of various phases along the transform margin for an intermediate spreading system. Sub-figures A to D denote transform phases 1 to 4 (see text).
Figure 10.
Uplift generated in the lithosphere along sections A, B, and C at the end of various phases along the transform margin for an intermediate spreading system. Sub-figures A to D denote transform phases 1 to 4 (see text).

Figure 11.
Uplift generated in the lithosphere along sections A, B, and C at the end of various phases along the transform margin for a fast spreading system. Sub-figures A to D denote transform phases 1 to 4 (see text).
Figure 11.
Uplift generated in the lithosphere along sections A, B, and C at the end of various phases along the transform margin for a fast spreading system. Sub-figures A to D denote transform phases 1 to 4 (see text).

Figure 12.
Uplift generated in the lithosphere along sections A, B, and C at the end of various phases along the transform margin for the reference case with sediments. Sub-figures A to D denote transform phases 1 to 4 (see text).
Figure 12.
Uplift generated in the lithosphere along sections A, B, and C at the end of various phases along the transform margin for the reference case with sediments. Sub-figures A to D denote transform phases 1 to 4 (see text).

Figure 13.
Thermal state of the continental block at the end of Stage A (20.5 Myr). (A) Side view of excess temperature contour surfaces within the continental lithosphere with a 200 °C stepping. Inset shows the position of the 3D marker block. (B) Map view of the 50 °C excess temperature contour surface. (C) Uplift experienced by the continental lithosphere at the end of Stage A.

Figure 14.
(A) Thermal maturity of sediments within the continental block at the end of Stage A. (B) Increase in thermal maturity of sediments within the continental block at the end of Stage A due to heat contribution from the spreading centers only. The thermal maturity isosurface at the onset of dry gas (%Ro = 3) is also shown. Inset shows top view. Note that the Z-axis is restricted to the upper 15 km and vertically exaggerated.


Table 1.
List of symbols and values used in the numerical models.
| Symbol | Description | Units | Values |
|---|---|---|---|
| cpW | Water heat capacity | J kg−1 K−1 | 3000 |
| cpR | Rock heat capacity (all lithologies) | J kg−1 K−1 | 854 |
| Tt | Surface temperature | °C | 0 |
| TS | Bottom temperature | °C | 1333 |
| ZW | Water depth | Km | 2.5 |
| ZO | Crustal depth (Ocean) | Km | 8 |
| ZS | Sediment depth | Km | 20 |
| ZC | Crustal depth (Continent) including sediment cover | Km | 35 |
| ZL | Total model depth | Km | 125 |
| kW | Thermal conductivity (Water) | W m−1 K−1 | 420 * |
| kO | Thermal conductivity (Oceanic Crust) | W m−1 K−1 | 2.82 |
| kS | Thermal conductivity (Sediments) | W m−1 K−1 | 1.7 |
| kC | Thermal conductivity (Continental Crust) | W m−1 K−1 | 2.13 |
| kM | Thermal conductivity (Mantle) | W m−1 K−1 | 2.82 |
| α | Thermal expansion coefficient | K−1 | 3 × 10⁻⁵ |
| λ | Radioactive heat production pre-factor in crust | µW m−3 | 2 |
| ρW | Water density | kg m−3 | 1000 |
| ρO | Crustal density (Ocean) | kg m−3 | 3000 |
| ρS | Sediment density | kg m−3 | 2700 |
| ρC | Crustal density (Continent) | kg m−3 | 2800 |
| ρM | Mantle density | kg m−3 | 3300 |
* An increased thermal conductivity of water is used in order to capture the convective nature of water.
Publisher’s Note: MDPI stays neutral with regard to jurisdictional claims in published maps and institutional affiliations. |
© 2021 by the authors. Licensee MDPI, Basel, Switzerland. This article is an open access article distributed under the terms and conditions of the Creative Commons Attribution (CC BY) license (https://creativecommons.org/licenses/by/4.0/).
Share and Cite
MDPI and ACS Style
Schmid, D.W.; Iyer, K.; Hartz, E.H. Thermal Effects at Continent-Ocean Transform Margins: A 3D Perspective. Geosciences 2021, 11, 193. https://doi.org/10.3390/geosciences11050193
AMA Style
Schmid DW, Iyer K, Hartz EH. Thermal Effects at Continent-Ocean Transform Margins: A 3D Perspective. Geosciences. 2021; 11(5):193. https://doi.org/10.3390/geosciences11050193
Chicago/Turabian StyleSchmid, Daniel W., Karthik Iyer, and Ebbe H. Hartz. 2021. "Thermal Effects at Continent-Ocean Transform Margins: A 3D Perspective" Geosciences 11, no. 5: 193. https://doi.org/10.3390/geosciences11050193
Note that from the first issue of 2016, this journal uses article numbers instead of page numbers. See further details here.