Simplified Method for the Assessment of Siltation in Semiarid Reservoirs Using Satellite Imagery


1
Campus Professora Cinobelina Elvas, Federal University of Piauí, Bom Jesus 64900-000, Brazil
2
Department of Agricultural Engineering, Federal University of Ceará, Fortaleza 60450-760, Brazil
*
Author to whom correspondence should be addressed.
†
These authors contributed equally to this work.
Water 2019, 11(5), 998; https://doi.org/10.3390/w11050998
Submission received: 24 March 2019
/
Revised: 28 April 2019
/
Accepted: 1 May 2019
/
Published: 13 May 2019
(This article belongs to the Section Hydrology)
Abstract
:The Brazilian semiarid region strongly depends on superficial reservoirs (one every 5 km) and hence is subject to the deleterious effects of siltation, which reduces water availability. This research proposed a method, simplified bathymetric surveying using remote sensing, for updating the morphological parameters of reservoirs. The study area was the Pentecoste reservoir (360 hm) in northeastern Brazil. The results were compared to the conventional bathymetric survey method, which demands more sampling points (235 compared to 1) and was assumed as reference. Siltation assessed through the proposed method was nearly twice as high as that observed through conventional surveys. The morphological parameters derived by both methods were used to assess the long-term water balance of the reservoir. The results show that the outflow diverged 30%, while the evaporated discharge and water availability diverged 10% between the methods. Therefore, in the conditions of the Brazilian semiarid region, the simplified method suffices to assess the water availability of reservoirs affected by silting.
1. Introduction
Modifications of the natural conditions of water courses through the construction of dams and consequently the formation of artificial lakes directly affect natural hydro-sedimentological processes, as they reduce flow velocity and thus result in the gradual deposition of sediments [1]. The gradual and continuous deposition over time causes reservoir siltation and reduces storage capacity as well as water availability [2,3], which may reduce the reservoir lifetime and also cause problems with water quality [3,4,5].
In these environments, the risk of water shortage is imminent due to demand growth as well as water supply restrictions based on the rainfall statistics of previous years and the accumulated volume in the reservoirs [6]. Consequently, water availability depends on the retention of river flows in reservoirs that are subject to the siltation process and can have serious impacts on the local and regional economy in relation to potable water supply, irrigation, and energy supply [7]. The reduction in water availability is one of the key impact factors of reservoir silting in the semiarid regions. It is estimated that the reduction, for the State of Ceará alone, is approximately 388 yearly (90% annual reliability [2,8]).
However, reservoirs can also be qualitatively affected by silting since they act as filters which retain a considerable portion of the sediment carried by rivers [9,10]. This retained portion, when deposited at high rates, can cause significant increases in nutrients and other water pollutants. The deposition of enriched sediments can have negative environmental consequences that are detected through changes in indicators of water quality, mainly related to the solubility of salts, nutrients and sediment transport [4].
Thus, the monitoring of reservoir silting is critical to the proper management of water resources, in particular maintaining water quality for multiple uses. In semiarid regions, surface reservoirs store water during the rainy season so that it will be available for domestic, industrial and agricultural usage during the dry season [2,4,11]. The need for monitoring becomes even more evident when observed that the majority of reservoirs in the Brazilian semiarid region were created without any kind of integrated planning; a fact that led to the development of a chaotic system that is extremely difficult to control [12] and has a strong potential for conflict over water usage, whether over the water availability to meet demand during the dry season or over the quality of the available water [13].
This is why the development and improvement of methods that provide for a more effective monitoring of water resources have become increasingly necessary, especially techniques that permit the use of Geographic Information Systems and remote sensing [14,15,16]. Some of these water resource monitoring techniques have the potential to determine the storage capacity and silting through a topographic analysis of the areas flooded by the reservoirs [17,18,19,20,21,22,23].
Over time, sediment accumulation alters the reservoir morphology. In semiarid regions, these measurements have become increasingly vital since these territories are mainly supplied through surface water reservoirs [4], as, for example the Federal State of Ceará, where 93% of supplied water comes from superficial reservoirs [2]. Conventionally, the readjustment of elevation–area–volume curves is established through bathymetric surveys that are conducted primarily through echo sounders using satellite positioning equipment. These surveys require intensive fieldwork, time, financial resources, and can often be impractical since semiarid reservoirs may present volumes below their storage capacity, which limits the analysis.
Methods to characterize the morphology of surface water reservoirs, based on Geographic Information Systems (GIS) and remote sensing, have been developed with increasing accuracy. For example, Tong et al. [24] presented a comprehensive approach for analysis of water volume by using a combination of multi-mission altimetry and remotely sensed images. This combination allows for the analysis of the change mechanism with respect to the lake surface area, level, and volume over a period of up to several decades. According to the authors, the use of low resolution images affects accuracy, but does not hinder the applicability of the method. Thus, use of high resolution images tends to improve the quality of the results but does not change the structure of the method. Keys and Scott [25] presented a methodology for quantifying surface water storage variations at near continuous intervals through the use of remote sensing. According to the authors, the proposed method can be used to monitor surface-water bodies with high seasonal variability, such as those in dry tropical areas. We can also cite, among others, the Normalized Difference Water Index [26]; the Automated Water Extraction Index [27]; the Normalized Difference Lake Index [28]; the Dynamic Surface Water Extent [29]; the Automatic Subpixel Water Mapping Method [30]; and the Enhanced Lake Index [31]. In the data-scarce Brazilian semiarid region, where there is a dense network of reservoirs [12], the use of remote-sensing techniques is recent. Zhang et al. (2016, [32]) used TanDEM-X satellite imagery to generate digital elevation models of small reservoirs, achieving an elevation accuracy of 1 m. One of the main hindrances of using remote-sensing techniques to generate DEM in reservoirs is the presence of macrophytes [33], an issue successfully tackled by Zhang et al. (2018, [34]). Pereira et al. (2019, [35]) managed to assess the geometry and volume of over 300 small reservoirs in the region using terrain and shape attributes acquired by remote sensing. They reduced the absolute error by one third in comparison with the traditional method. Despite the positive outcome of these initiatives, the need for improvements persists. In the focus region, e.g., the simultaneous occurrence of cloudy sky and of relevant hydrological processes during the brief rainy season raises challenges for remote-sensing techniques. One of the main contributions of remote sensing to water-resources management is the possibility of reducing monitoring costs [36,37,38]. In the State of Ceará, for example, there are over 30,000 reservoirs, but authorities can afford to monitor less than 1% (only the largest ones), which shows the importance of developing cost-effective methods.
Thus, this research aimed to propose a simplified method for bathymetric survey and assessment of siltation in drought periods with the help of remote sensing, which allows for greater accessibility of use, less work in situ, and significantly lower processing time and investment costs than conventional methods. However, the final goal was to assess the errors caused by the method used to calculate water availability in a reservoir in the Brazilian semiarid region.
2. Materials and Methods
2.1. Bathymetric Survey Using the Simplified Remote-Sensing Method
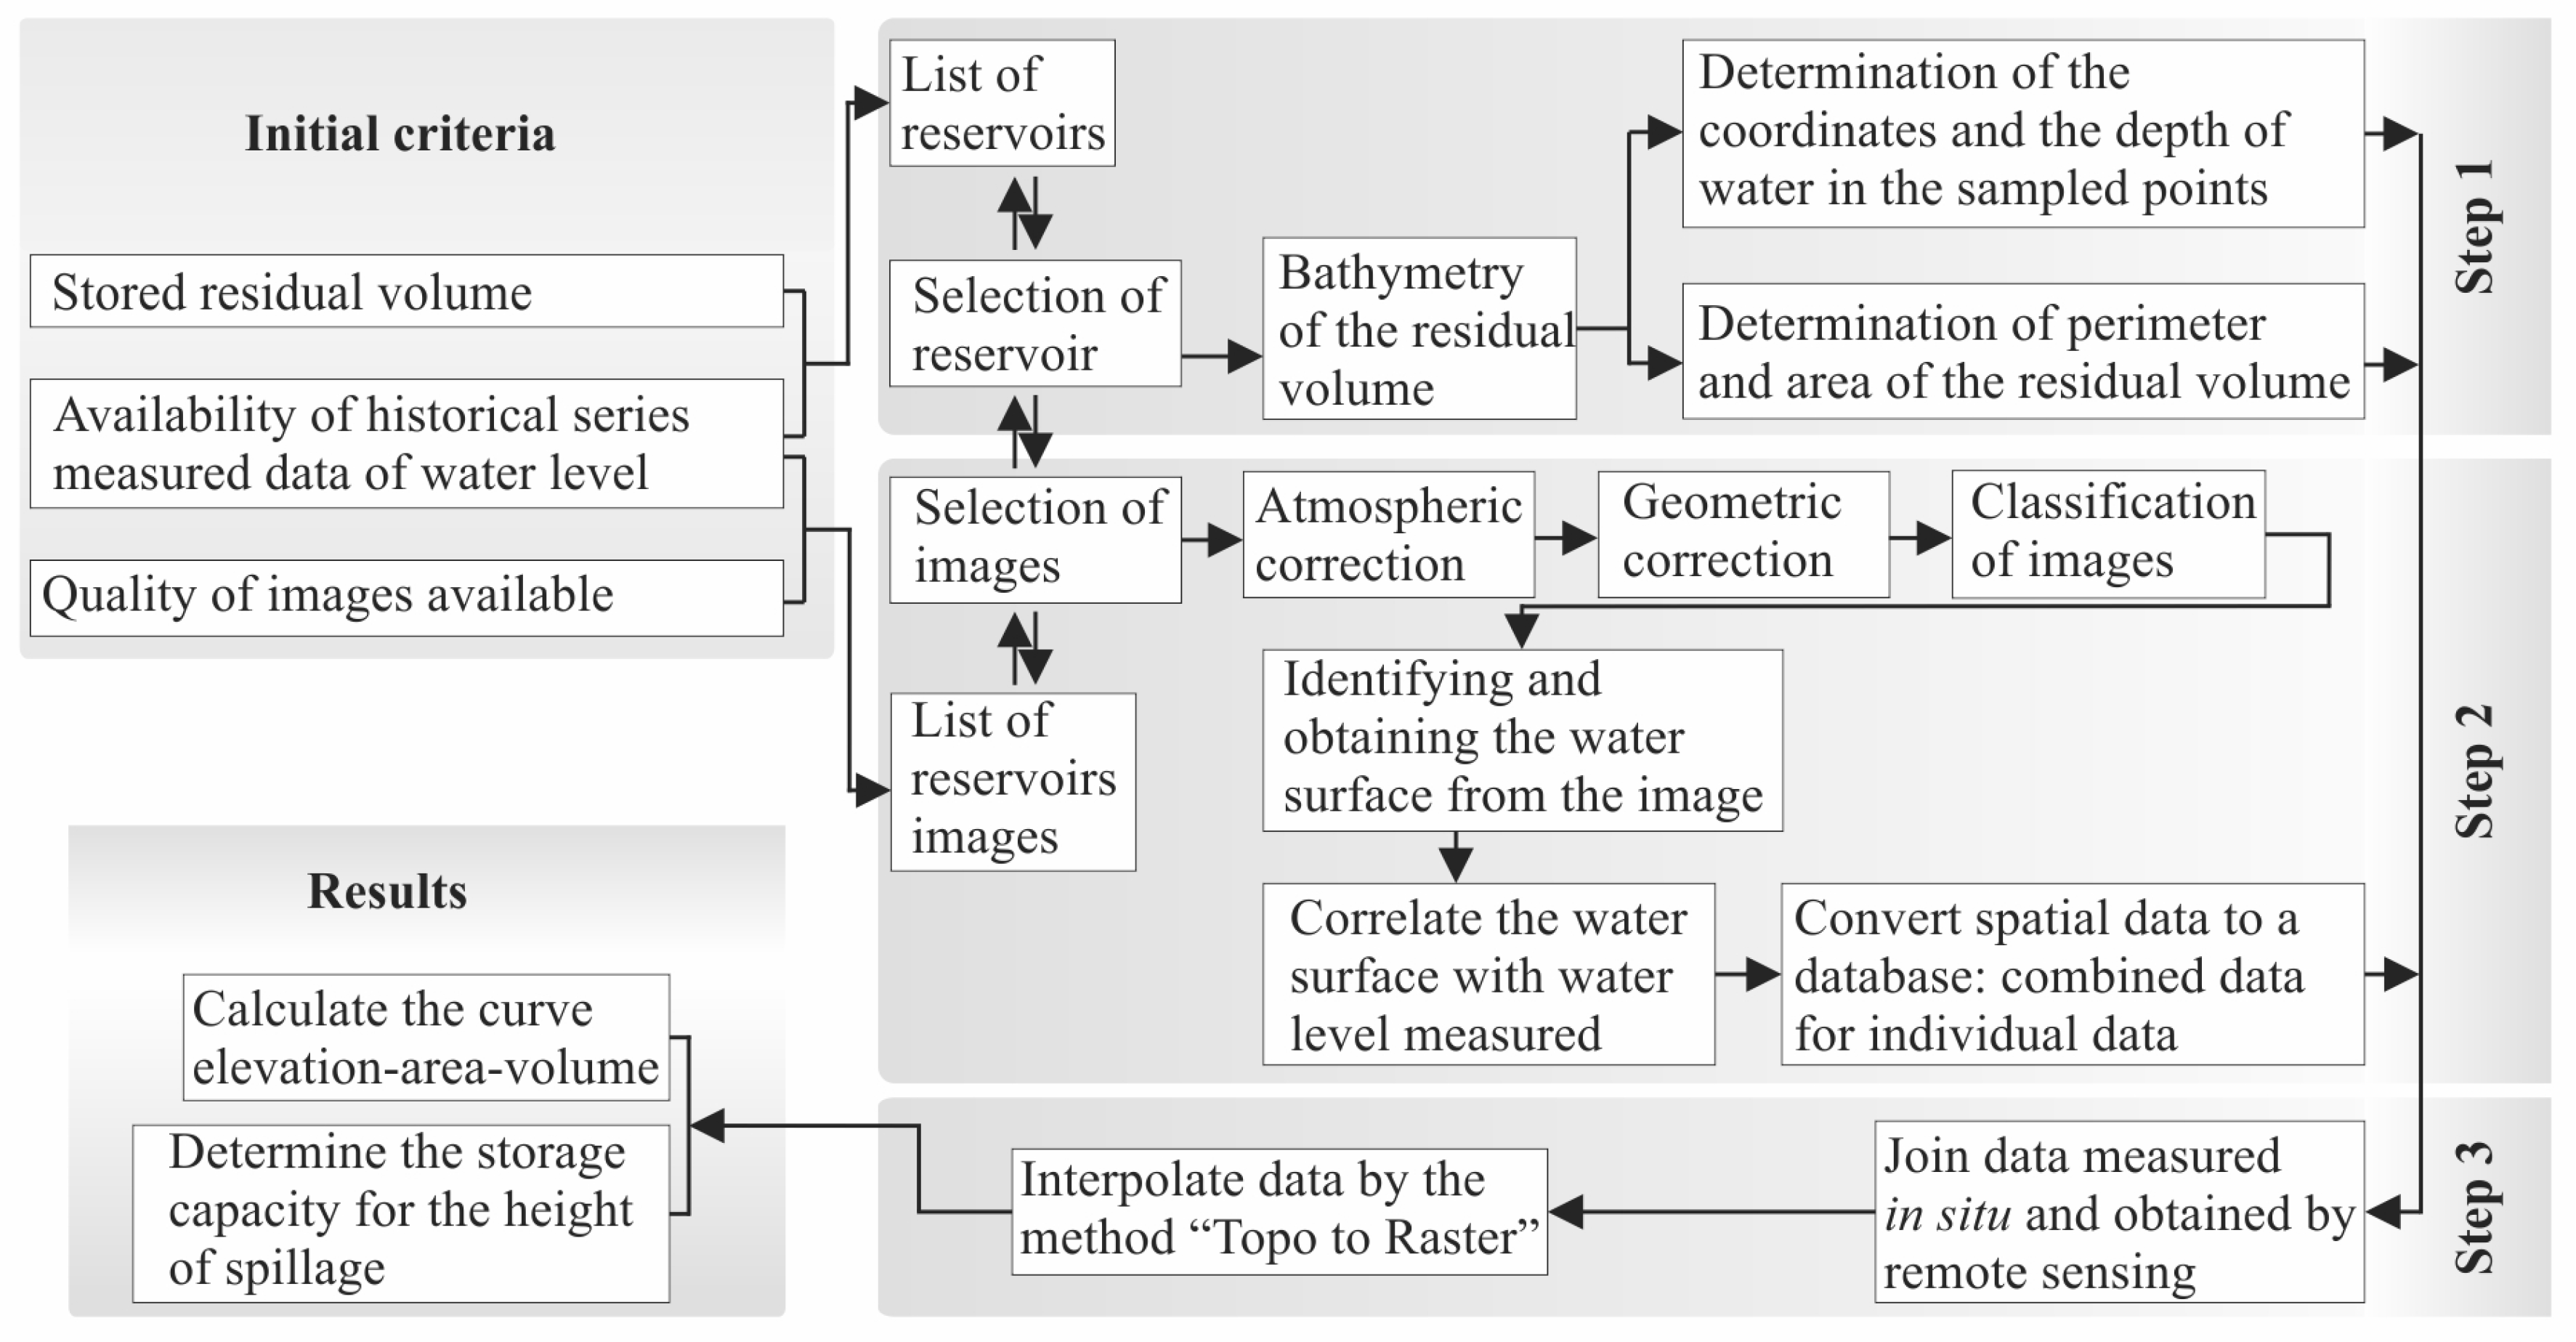
The proposed method (BRS) uses the coupling of a simplified bathymetric survey and remote sensing and is segmented into three main steps, as shown in Figure 1.
The proposed method combines satellite imagery with a simplified bathymetric survey. The small reservoirs in the Brazilian semiarid region deplete completely every year [32,33], whereas the large ones often reduce their storage to 20% or less at the end of after the annual dry season [6]. This feature hampers the use of traditional bathymetric surveys because it requires that the reservoir be full so as to achieve an accurate outcome, which does not happen frequently [12]. However, the here-proposed method can be applied for partially or totally empty reservoirs. In addition, the survey becomes less expensive as the water level lowers, considering that the field bathymetry is the most expense part of proposed method.
The method is intended to be applied to a reservoir of medium or high storage capacity. For that purpose, three criteria should be taken into consideration: (i) the effective storage volume; (ii) the availability of historical data on water levels (this criterion is used both in reservoir selection as well as in the choice of orbital images used to determine the area occupied by the water surface for a given water level at a certain date); and (iii) the quality of available images.
It is important to have images that allow an accurate identification of the flooded area and, in addition, correspond to the day on which the reading of the water level was held. The bathymetric survey of the remaining volume can be carried out with the help of handheld devices. Two devices can be used, for example: a navigation GPS to determine the coordinates of the measuring points, and a portable digital echobathymeter for instantaneous depth measurement. The coordinates of the sampled points are stored in the GPS readings and the depth measurements are documented. Therefore, depth information is obtained as follows: (a) for the water-covered area, the bathymetric survey explicitly measures depth; and (b) for the dry area, the limnimetric rulers over time are monitored, so that we know the reference depth on the same day of the imagery acquisition. The reservoir depth information is continuously monitored by water authorities.
The images destined to identify the flooded areas should have low cloud cover. Before conducting the image classification, it is advisable to perform atmospheric and geometric correction for possible systematic distortions arising from the acquisition process. The classification is then accomplished on a single image, which is made up or not (when using only one spectral band) of the combination of three bands. Because of the scarcity of good-quality imagery over semiarid reservoirs [32,33,34,35], we recommend using the supervised classification and maximum likelihood method (MLM) to obtain informational classes from remote sensing images. The rationale for this approach is to get the most out of the available orbital data, which does not rule out the possibility of using other methods with similar end products [26,27,28,30,31]. In the MLM method, the spectral distribution of the classes is assumed to be normal, i.e., objects belonging to the same class have spectral responses close to the average value for that class. This classification method demands that the user knows the studied area, so that the selection of training samples can be as effective as possible. However, there is the need to select a fairly high number of pixels for each of the class-training sample. After the classification is completed, the simplified method proceeds with the vectorization and conversion of the water banks, where the points correlate to the elevation measured on the corresponding day. Then, the spatial data are converted into specific coordinates that are associated in a database to elevation. The database—provided by the local water authorities—organizes, among others, the daily monitored depth of the reservoir, which can be associated with the flooded area on the same day. The third stage begins by integrating the data obtained in Step 1 (simplified bathymetry for remaining volume) with those obtained in Step 2 (the use of remote sensing). At this stage, interpolation is used to generate the water-level versus area versus volume curves. The applied method is referred to as “Topo to Raster”, an interpolation method that was developed specifically for the proper generation of digital models. It is based on the ANUDEM model [39,40,41] and uses the interactive interpolation technique by the finite-difference method. The method optimizes the computational efficiency of local interpolation without losing the continuity of global interpolation methods, such as kriging and spline. In the final phase, it calculates the volume for different surfaces and the respective reference elevation, producing the elevation–area–volume curves.
2.2. Application of the Bathymetric Survey Using Remote Sensing Simplified Method
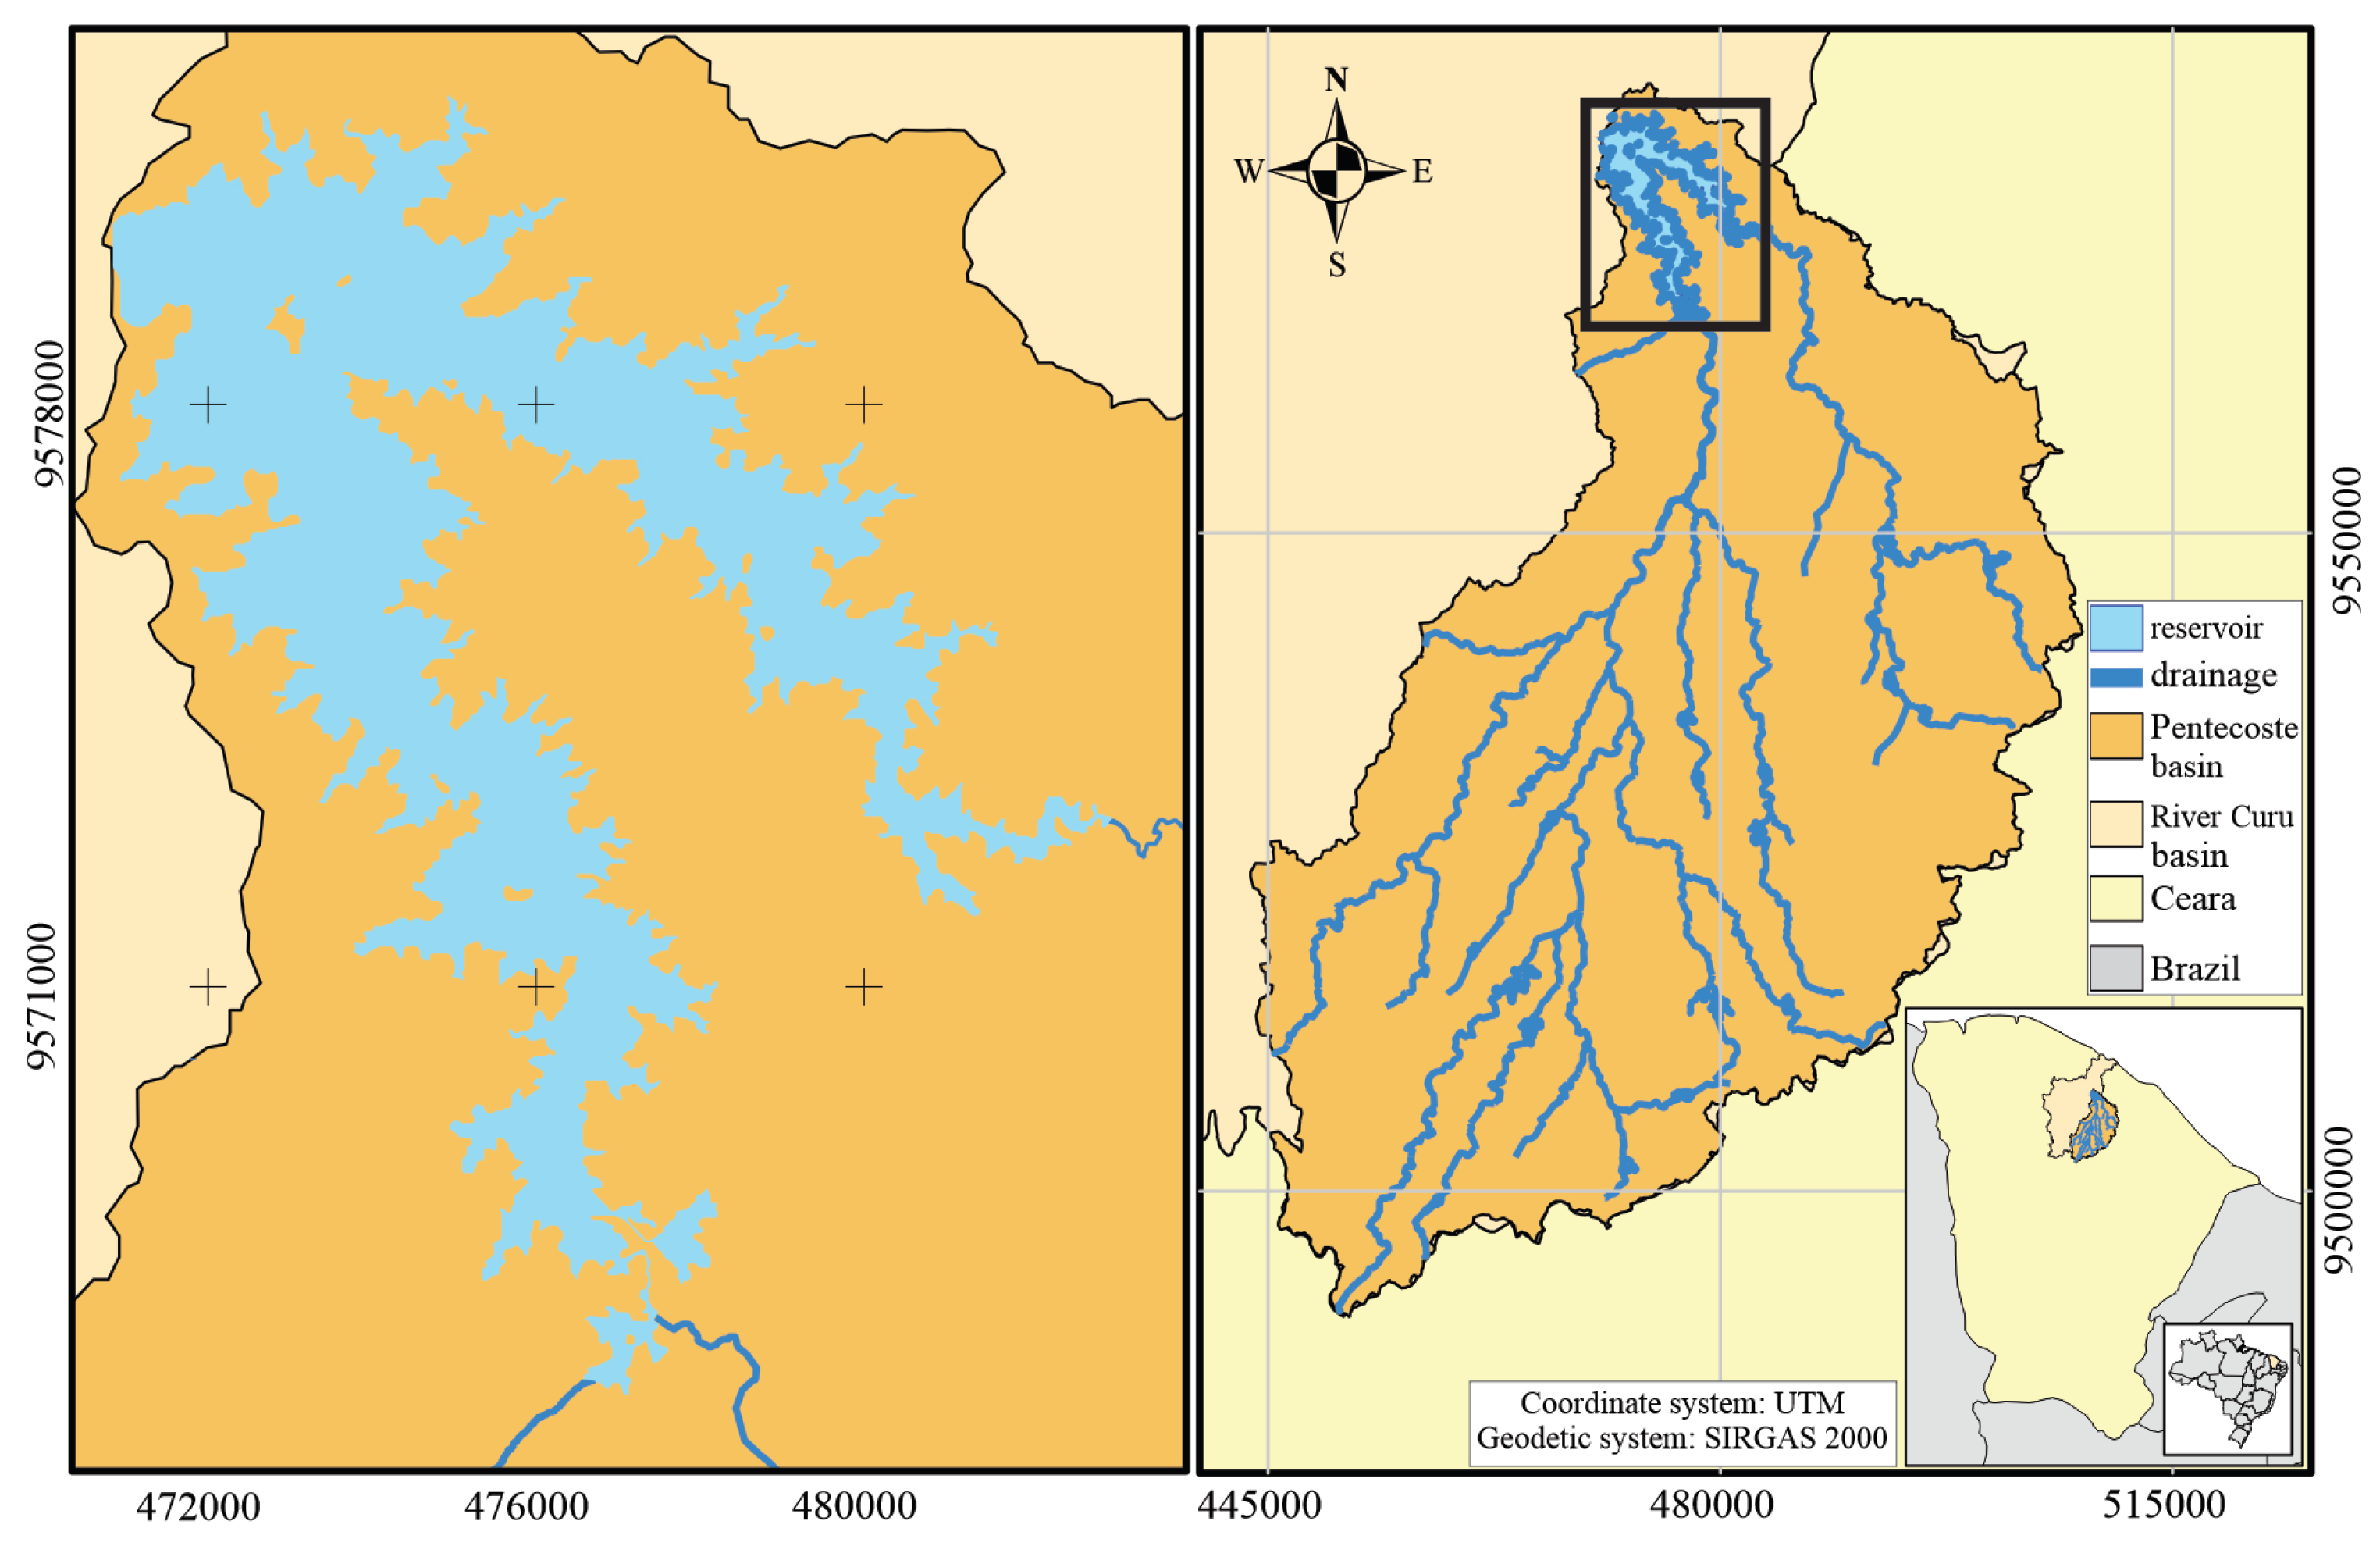
The reservoir selected for application of the method was the Pentecoste reservoir in the State of Ceará, Brazil. The dam, constructed in 1957 in the River Canindé, has a catchment area of 2840 km. The surface area flooded by the reservoir is 5700 ha and the initial storage capacity (1957) was 396 hm (Figure 2).
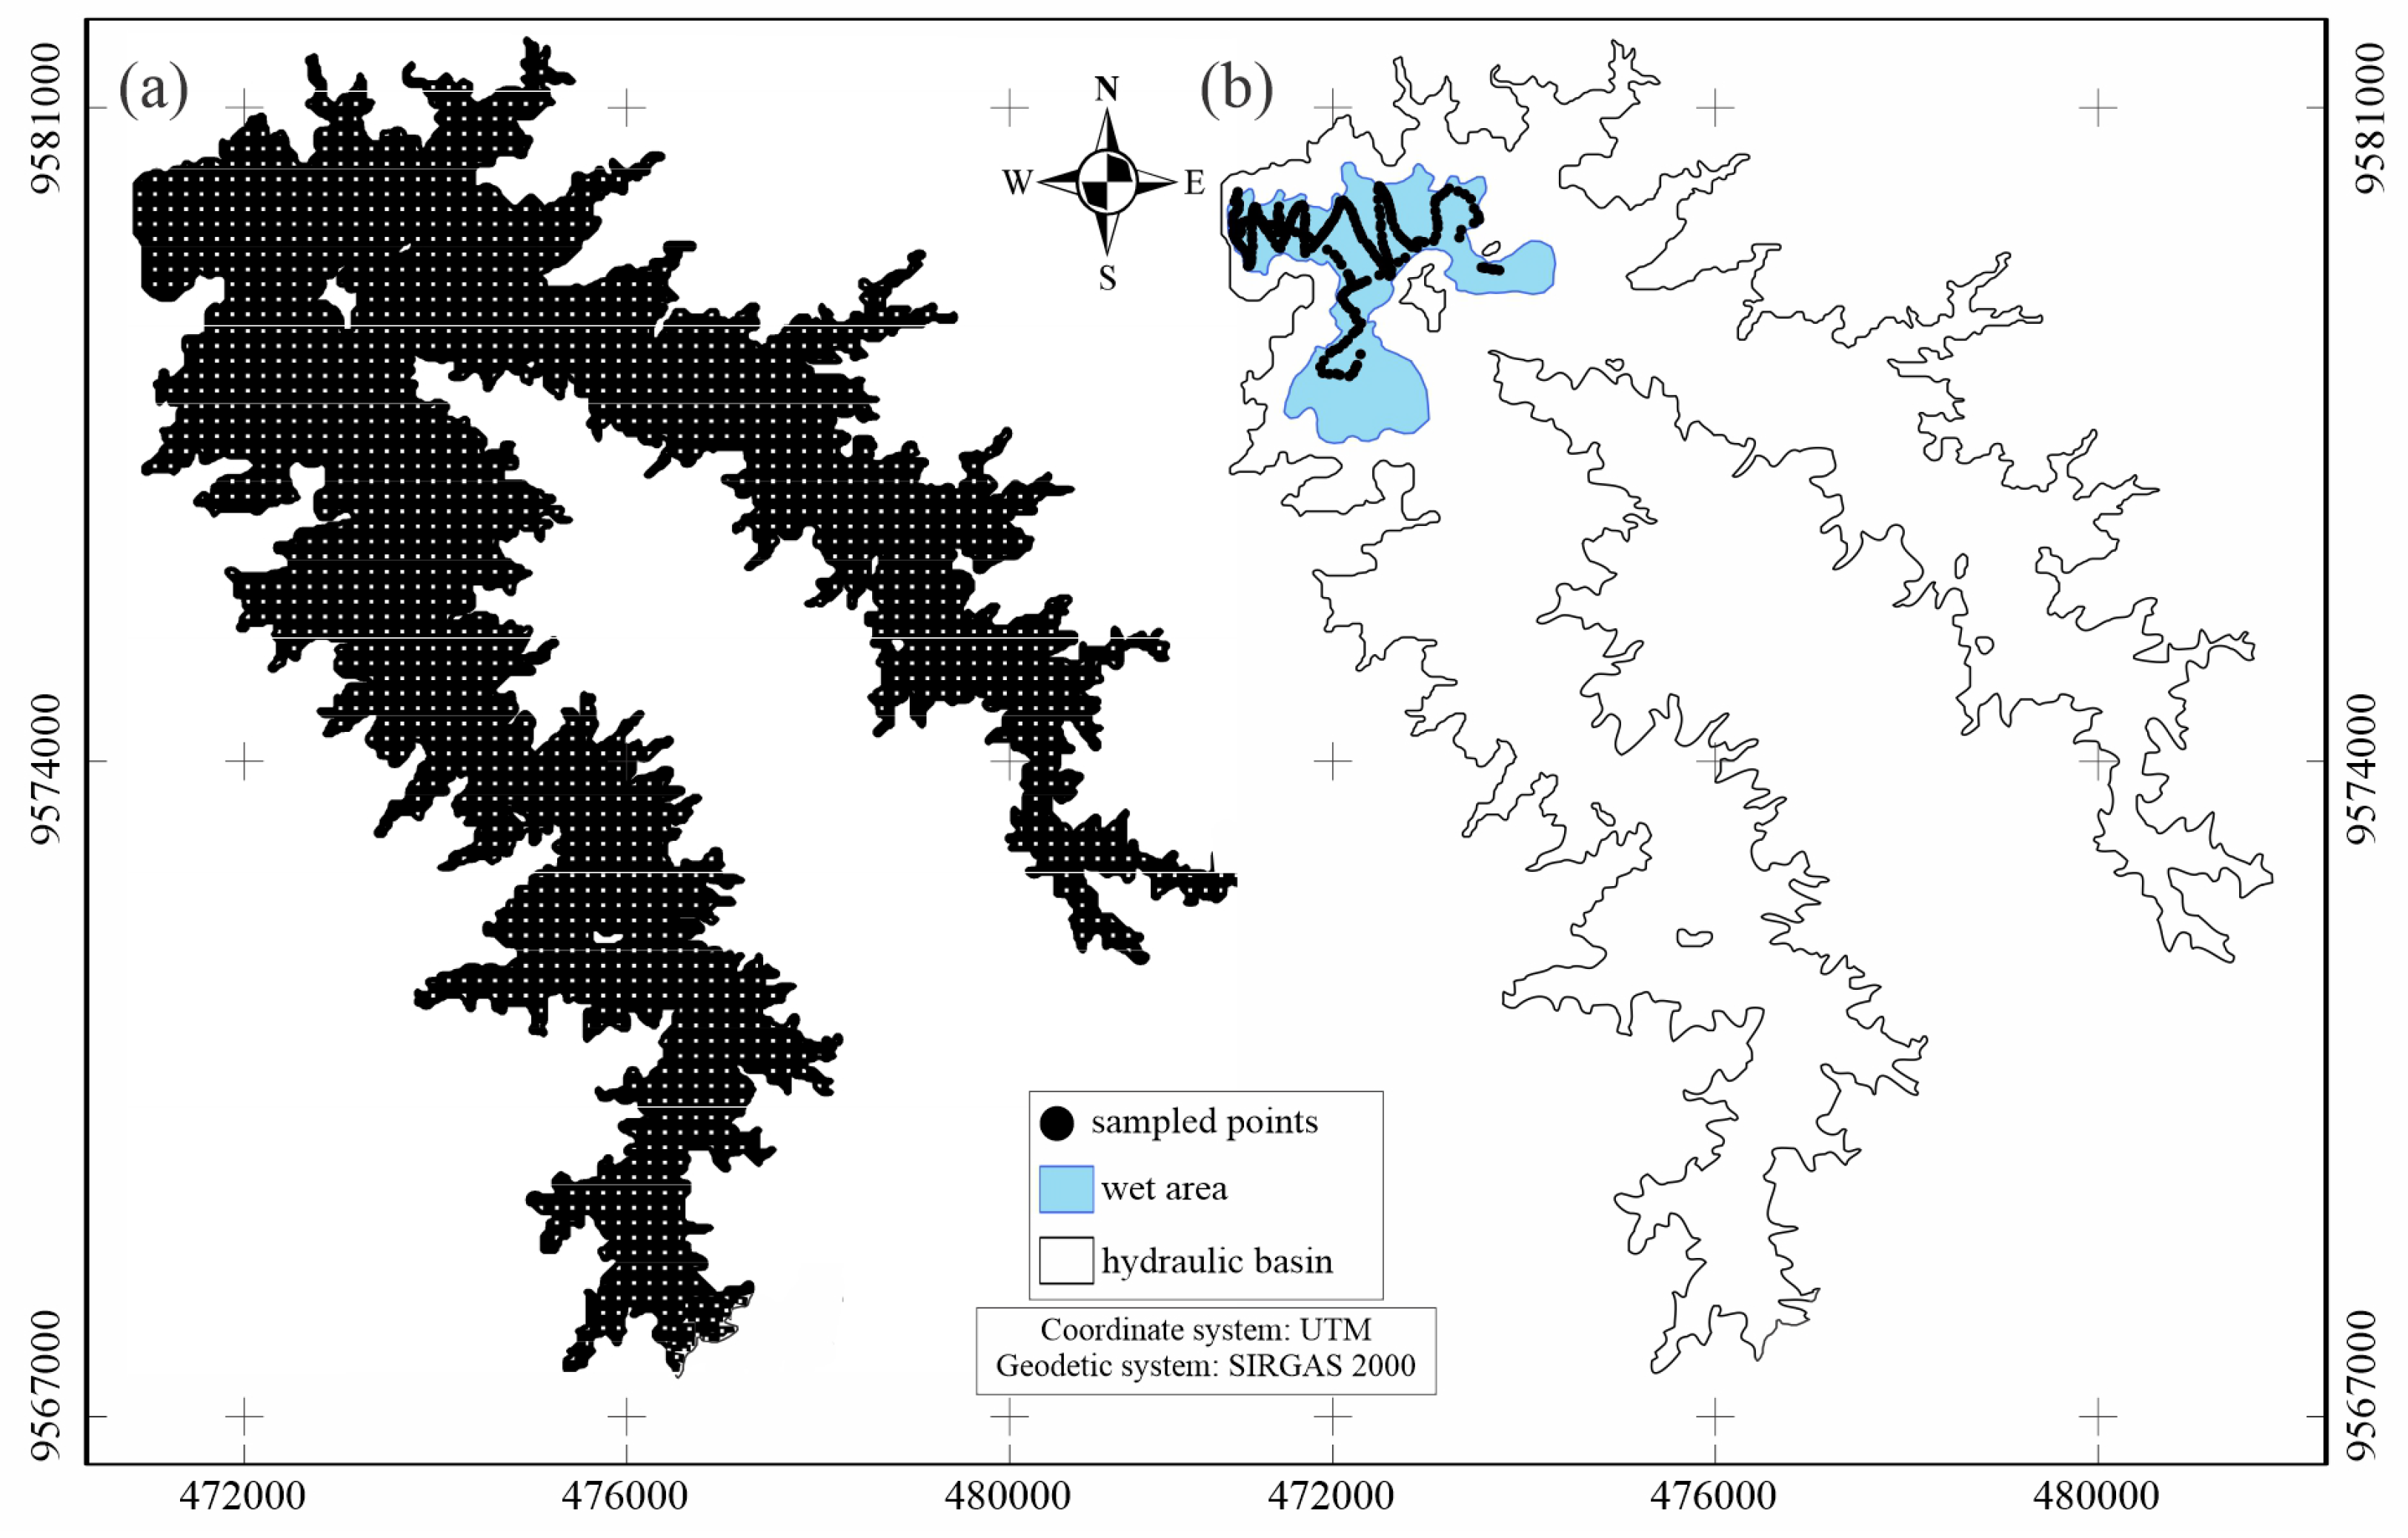
From the above provisions, the first stage of the research was held on 3 December 2014, when the water-level altitude was 43.40 m above sea level (m.a.s.l.). In a bathymetric survey of the remaining volume, 281 sampled points (Figure 2b) were positioned, which was sufficient to evaluate the flooded surface, since at that time the remaining volume represented approximately 1% of maximum capacity. The outline of the water was established by navigation close to the margins. The images that were selected for the delimitation of the flooded areas were from the Landsat 5 TM satellite, obtained from the Brazilian National Institute for Space Research (INPE). Although the Landsat 5 TM satellite has been deactivated since January 2013 [42], it has a set of images that have been distributed since 1984 and thus there is a large database of satellite images, which allows for the selection of images with different reservoir dimensions. Despite the diversity of images of the region (orbit 217, point 063), it was only possible to use five images for the delimitation of the water surface due to the frequent presence of clouds over the reservoir. Hence, the selected images corresponded to stored volume ranging from 10% to 66% of the storage capacity (Table 1). The image classification was made up of the combination of bands 4, 3 and 2, corresponding to the range of red, green and blue, respectively.
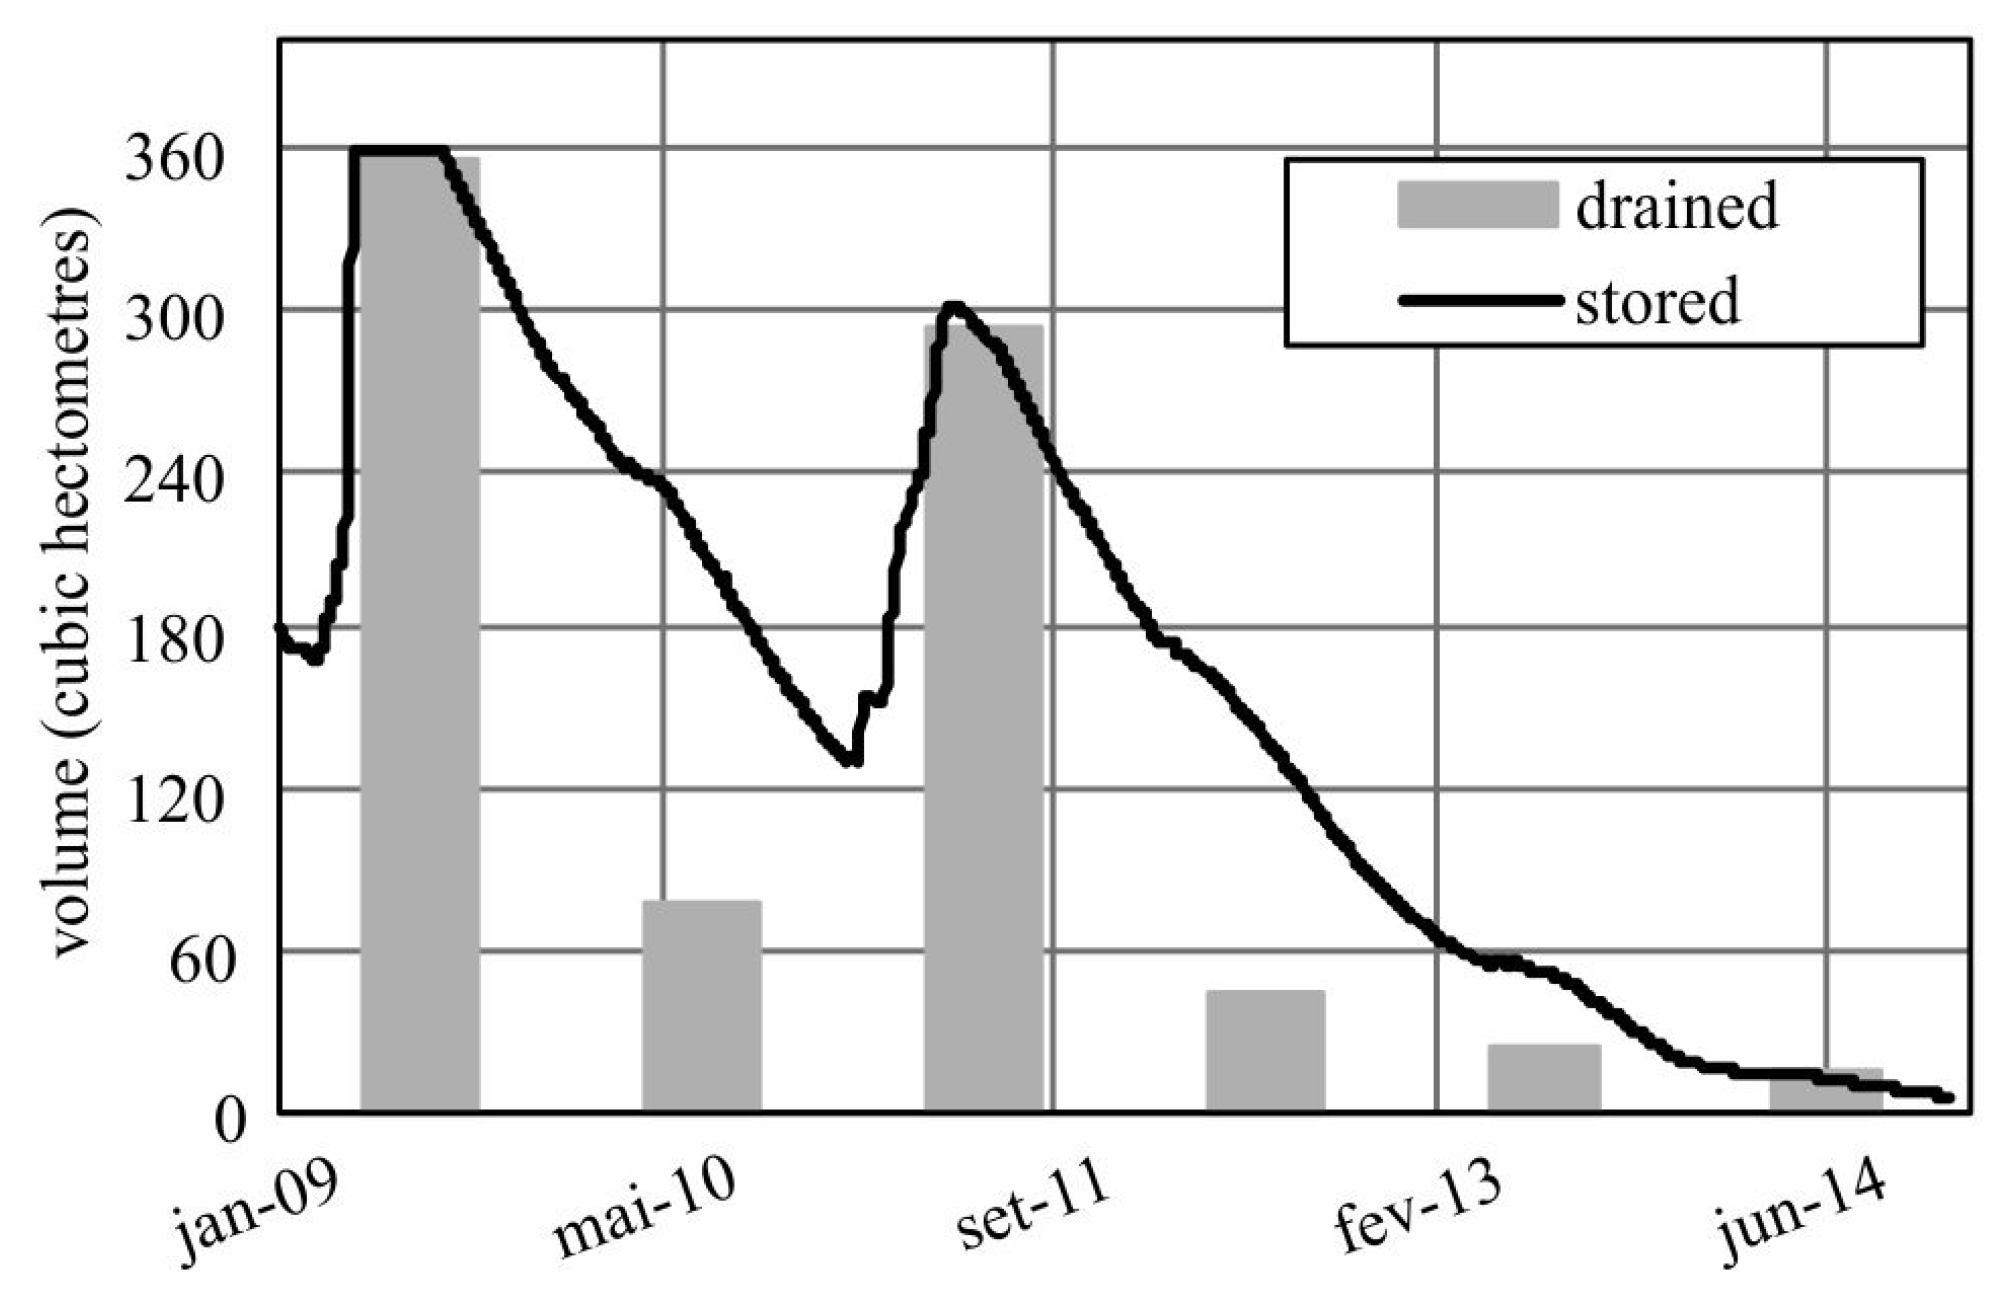
The time lag between both surveys has limited significance. From 2010 (first hydrological year after the conventional bathymetric survey) to 2014 (year of the simplified bathymetric survey), only 2011 had a moderate runoff, whereas 2010, 2012, 2013 and 2014 were drought years with negligible inflow (Figure 3, see also [6]). The volume reduction due to silting in the period (2010–2014) was assessed to be below 0.3%, using regional data [9]. It can, therefore, be assumed that the total siltation of the Pentecoste reservoir from 1957 to 2014 is comparable to that of 1957 to 2009.
2.3. Conventional Bathymetric Survey—Comparative Validation
A conventional bathymetric survey (such as the one conducted by COGERH—State Water Resources Management Company—at the Pentecoste reservoir in 2009) provides accurate results, but at a high cost. SEINFRA [43] reports that a conventional bathymetric survey costs US$0.12/m: in the case of Pentecoste reservoir (4849 ha), this means almost US$6 million. Despite having the advantage of execution speed, the conventional bathymetric survey was carried out during 13 days, plus 3 extra days to register the outline of the hydraulic basin using GPS. The number of depth measurement points was 94,659 and they were distributed homogeneously throughout the water surface of the reservoir. The field survey took place right after intense rainfall events that caused overspill, therefore the reservoir was in its maximum storage capacity, whose water-level elevation was 58.00 m.a.s.l. (water depth of 20 m, Figure 4a). According to that bathymetry, the reservoir storage capacity in 2009 was 360 hm: within 52 years, siltation had caused a 36 hm reduction in the reservoir storage capacity.
2.4. Uncertainties of the Bathymetric Method Concerning Water Availability
This research sought to evaluate the uncertainties that the bathymetric method with remote sensing (BRS) produces concerning the water availability in the reservoir. For this, the hydrological VYELAS model (volume-yield elasticity model, [2]) was used. Below, how the model computes the main water-balance variables of a semiarid reservoir to assess water availability as a function of the annual reliability level is described. To calculate the reservoir water balance separately for wet and dry seasons, the method accounted for the fact that river inflow occurs only in the wet season, followed immediately by spillway overflow whenever the maximum storage capacity of the reservoir is surpassed. No water withdrawal was considered in the wet season, because of the considerable reduction in water demand observed in this period. Thus, at the end of the wet season, the reservoir level was indicated as being the initial volume plus river inflow minus spillway overflow. The dry season was characterized by a volume depletion due to simultaneous evaporation and withdrawal. The reservoir volume at the end of the year was calculated as the volume at the end of the wet season minus evaporation losses and withdrawal. The reservoir operation rule applied to the simulations consists of defining the annual water withdrawal volume or effective reservoir yield, which, in a first step, was set equal to the target reservoir yield as defined by the users’ water demand. For years in which water withdrawal reduced the reservoir storage volume at the end of the dry season to values below the minimum operational volume, water withdrawal was adjusted in a second step through an iterative procedure. If the final water withdrawal was less than the target water yield, the year was considered unsuccessful. The reliability level G was then given by Equation (1).
In Equation (1), represents the number of unsuccessful years and N the total number of years in the simulation.
The river-discharge series can be synthetically generated using the experimental method, as described by Campos [8], and operates according to usual rules in the Brazilian semiarid region. River inflow to the reservoir is generated by a stochastic procedure, using the inverse of the two-parameter gamma probability density function [8,44]. Distribution parameters were derived from the mean and standard deviation of historical annual inflow to the reservoir. A 50,000-year synthetic series was generated for each watershed, which reproduced the historical mean and the coefficient of variation of annual inflow.
The parameter (Equations (2) and (3)) depends on the terrain morphology (the larger the parameter, the more open the morphology) and allows the assessment of the reservoir volume as a function of the water level (h). The model input data, which were required for the simulation of supply flow, can be observed in Table 2.
In the above equations, is the reservoir volume (m) at the water level h above the lowest reservoir level (m), and i is an index referring to discrete water levels.
For a given storage level, a reservoir with a higher parameter has a larger flooded area and, therefore, yields higher evaporation losses. Consequently, the increase of the parameter implies the reduction of water availability [2,8].
Three scenarios were simulated: (i) reservoir with original morphology (as in 1957), used as reference; (ii) silted-reservoir morphology according to the classic bathymetry; and (iii) silted-reservoir morphology according to BRS. In addition, to understand the possible changes in the water balance accomplished by the model as a function of the adoption of the proposed method, the differences () in the main water-balance variables (water yield, evaporation discharge and spillway overflow discharge) with annual reliability of 45% to 99% were compared and determined. For this, Equations (4)–(6) were used as a function of the annual reliability.
In Equations (4)–(6), represents the water yield, the evaporation discharge, and the spillway overflow discharge. The concept of elasticity () was used to analyze the errors caused when determining water availability. As suggested by de Araújo and collaborators [2], this permits results to be interpreted in a more systematic and conclusive way. Equations (7)–(9) represent the concept of elasticity (), where represents the flow associated (with annual reliability G); represents the storage capacity of the reservoir; d represents the absolute difference of the variable ( or ) according to the methods; and the indexes represent the survey methods.
Elasticity represents the relative impact of the difference in reservoir storage capacity to the reduction of availability [2]. Therefore, the higher is the parameter , the greater is the influence of the method used in the bathymetric survey in the calculation of water availability. The calculation of was performed for three water availability reliability levels, namely 99%, 90% and 80%, which are the reliability levels used in semiarid water management.
3. Results and Discussion
3.1. Bathymetric Survey Using Remote Sensing Simplified Method—BRS
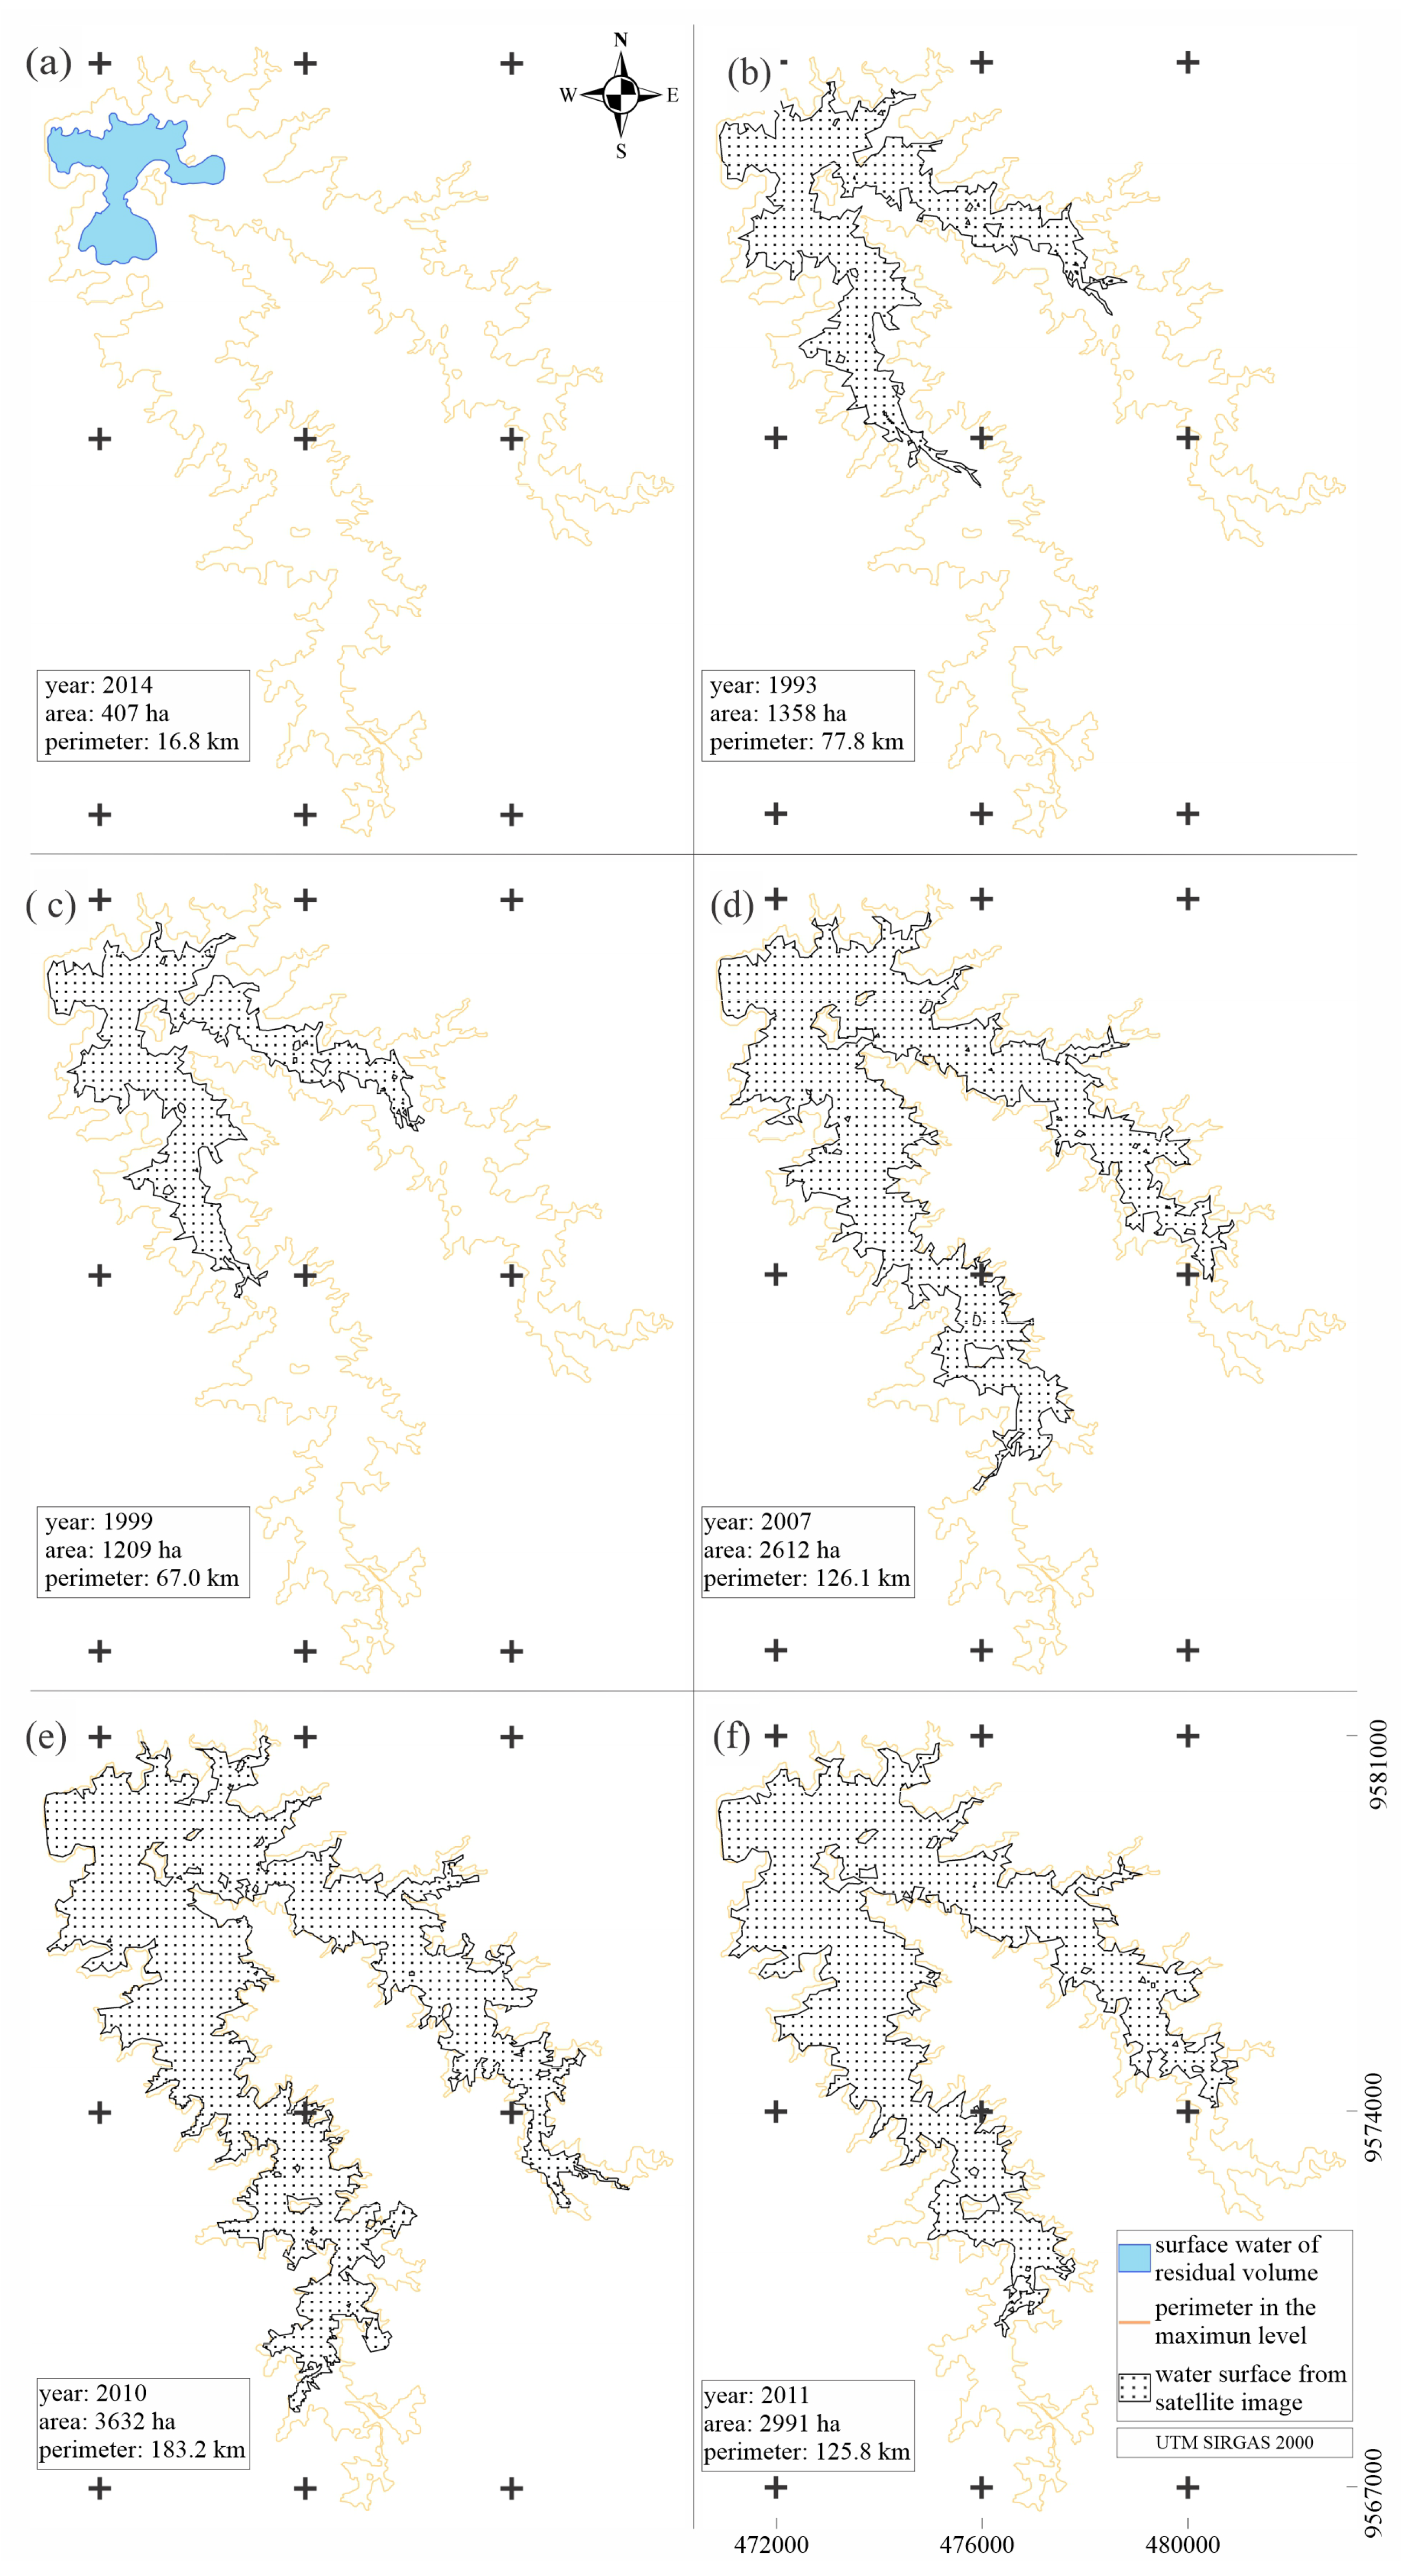
The final disposition of those images used to determine the water-level–volume and water-level–area curves is shown in Figure 5. The five images that represent the studied flooded area ranged from 1209 to 3632 ha, and were complemented by a simplified bathymetry of the remaining volume and the maximum spillage level.
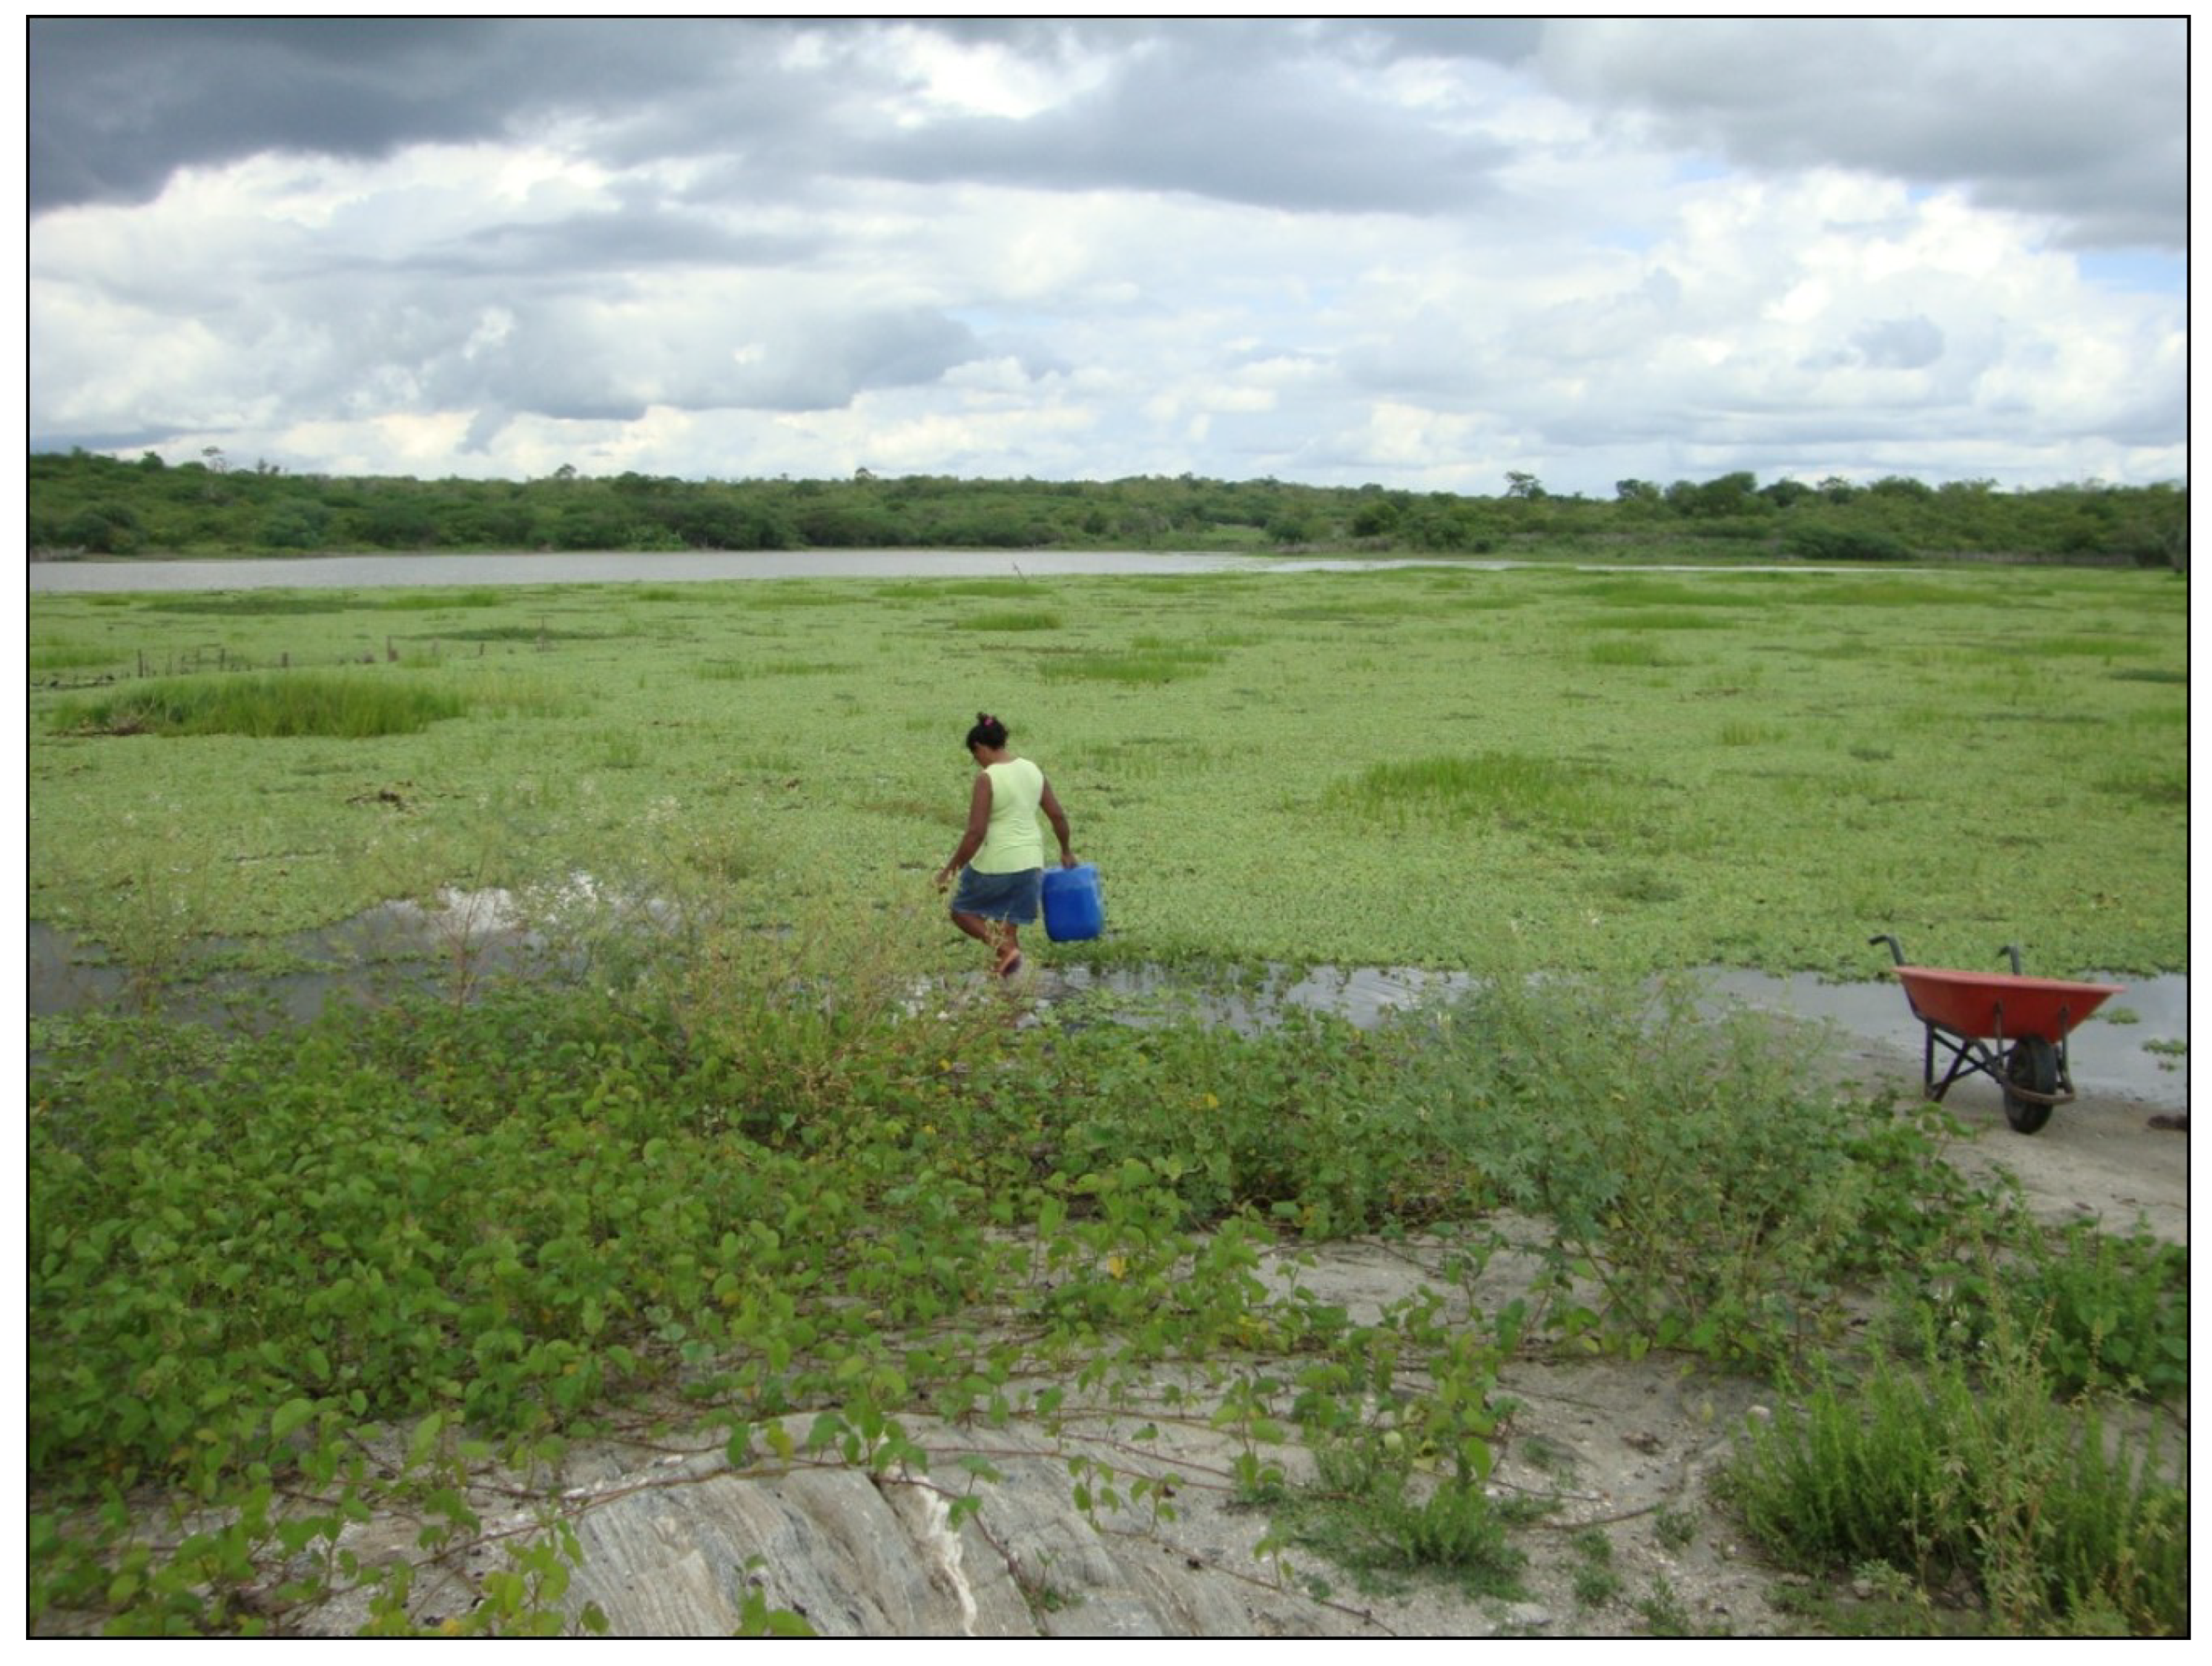
The results obtained through the proposed method evidence the importance of using remote sensing to assess the effective water storage in reservoirs. One of the steps in the process is to assess the flooded area at different levels, since the characteristics of bank occupancy around the reservoir, combined with the qualitative aspects of the stored water, may cause difficulty in the exact definition of classes and occupation, in particular with water bodies and vegetation. This information was obtained through the interpretation and analysis of satellite images [32]. The process occurs first, depending on the degree of eutrophication of the reservoir (recurrent in Brazilian semiarid region [4,45]), which promotes considerable changes in the spectral behavior of water [15,16,46,47]). Eutrophication contributes to the formation of a gradual stratified zone that connects the water body with surrounding vegetation; they become more prominent when there is aquatic vegetation (i.e., macrophytes—Figure 6) in the reservoir [33,34].
The availability of water, in terms of both quantity and ease of access, coupled with the soils in the areas adjacent to the hydraulic basin of the reservoir, allow for the occupation and development of human activities. In most of the observed cases, it appears that the use of this resource is developed in areas of permanent protection, and no attention is given to conservation practices. The Brazilian law establishes that the area near (100 m) the contour of the maximum water level be protected from any use other than environmental preservation. However, flaws in the surveillance system result in land use inside the protection area, mostly for food production. Activities that have an impact in these areas are easily identified, for example, deforestation, land burning, and cattle grazing. Moreover, urbanization of the areas near the water surface intensifies the degradation of the water body and accelerates eutrophication of the lake. This accelerated degradation is intensified due to effluents released into the lake; these materials come from the presence of animals (mainly cattle), the load of sediments containing nutrients [4,45] and the exploitation of intensive fish farming [48]. The latter can be one of the main contributors to the increased phosphorus concentration, since up to 30% of the feed used for intensive fish rearing is wasted [49]. As a result, the organic material that is not consumed and thus added to the aquatic ecosystem may result in the increase of the trophic level of the water [50]. An increase in the trophic level of water degrades water quality, which interferes with the methodology mainly due to the presence of macrophytes. Eutrophication interferes with the quantitative aspect, since there is a lower number of useable images, and also the qualitative one, since the users of the method need to know where the real water contour is located. If the macrophytes are not correctly identified, the flooded area may be misestimated [34]. As a direct reflection of the interference of water quality in image acquisition and processing, the final disposition of those images used to determine the water-level–volume and water-level–area curves is limited (Figure 5).
With help of the surveys, the topographical contours of the reservoir bottom were established and the new elevation–area–volume curve determined (Figure 7). The current volume of the Pentecoste reservoir is approximately 360 hm; 36 hm lower than the initial volume measured in 1957 (396 hm). This represents a 9% volume reduction to the original, as well as a reduction in storage capacity of 1.82% per decade. According to the proposed method (BRS), the current storage capacity of the Pentecoste reservoir is 320 hm. The difference in relation to the original condition is 66 hm, which represents a 19% volume reduction (decay of 3.3% per decade). When comparing the methods considered in the analysis, it can be seen that the difference in storage capacity is only 11%, whereas the volumetric difference is 40 hm (90% deviation, see Table 3).
According to some authors [11], the siltation rate of the reservoirs in the Brazilian semiarid region is 1.83% per decade on average, i.e., practically the same found in this study (1.82%, according to CBS). Regarding the BRS, the siltation rate would be 3.30% per decade, a value 80% above the average behavior in the region. The observed differences can be attributed to the fact that the classic bathymetry captures more specific depths due to the density of the sample grid. Thus, the difference in the maximum depth is about 1.30 m higher than that obtained by the proposed method. This difference in maximum depth has a direct impact on the reservoir storage capacity and also on pattern changes of the elevation–area–volume curves. The differences observed when using the remote sensing method occurred due to the lack of control points in the hydraulic basin, which could not be effectively represented; this resulted in a lower maximum depth when compared to the classic method of bathymetric surveys (Table 3). Besides, the sedimentation rate difference of the remote sensing simplified method can be clarified on the basis of the hypothesis assumed by Foteh and collaborators [14]. For these authors, the method is limited with regards to its accuracy in the identification of water spread areas associated with the misclassification of water pixels on the land around the reservoir periphery.
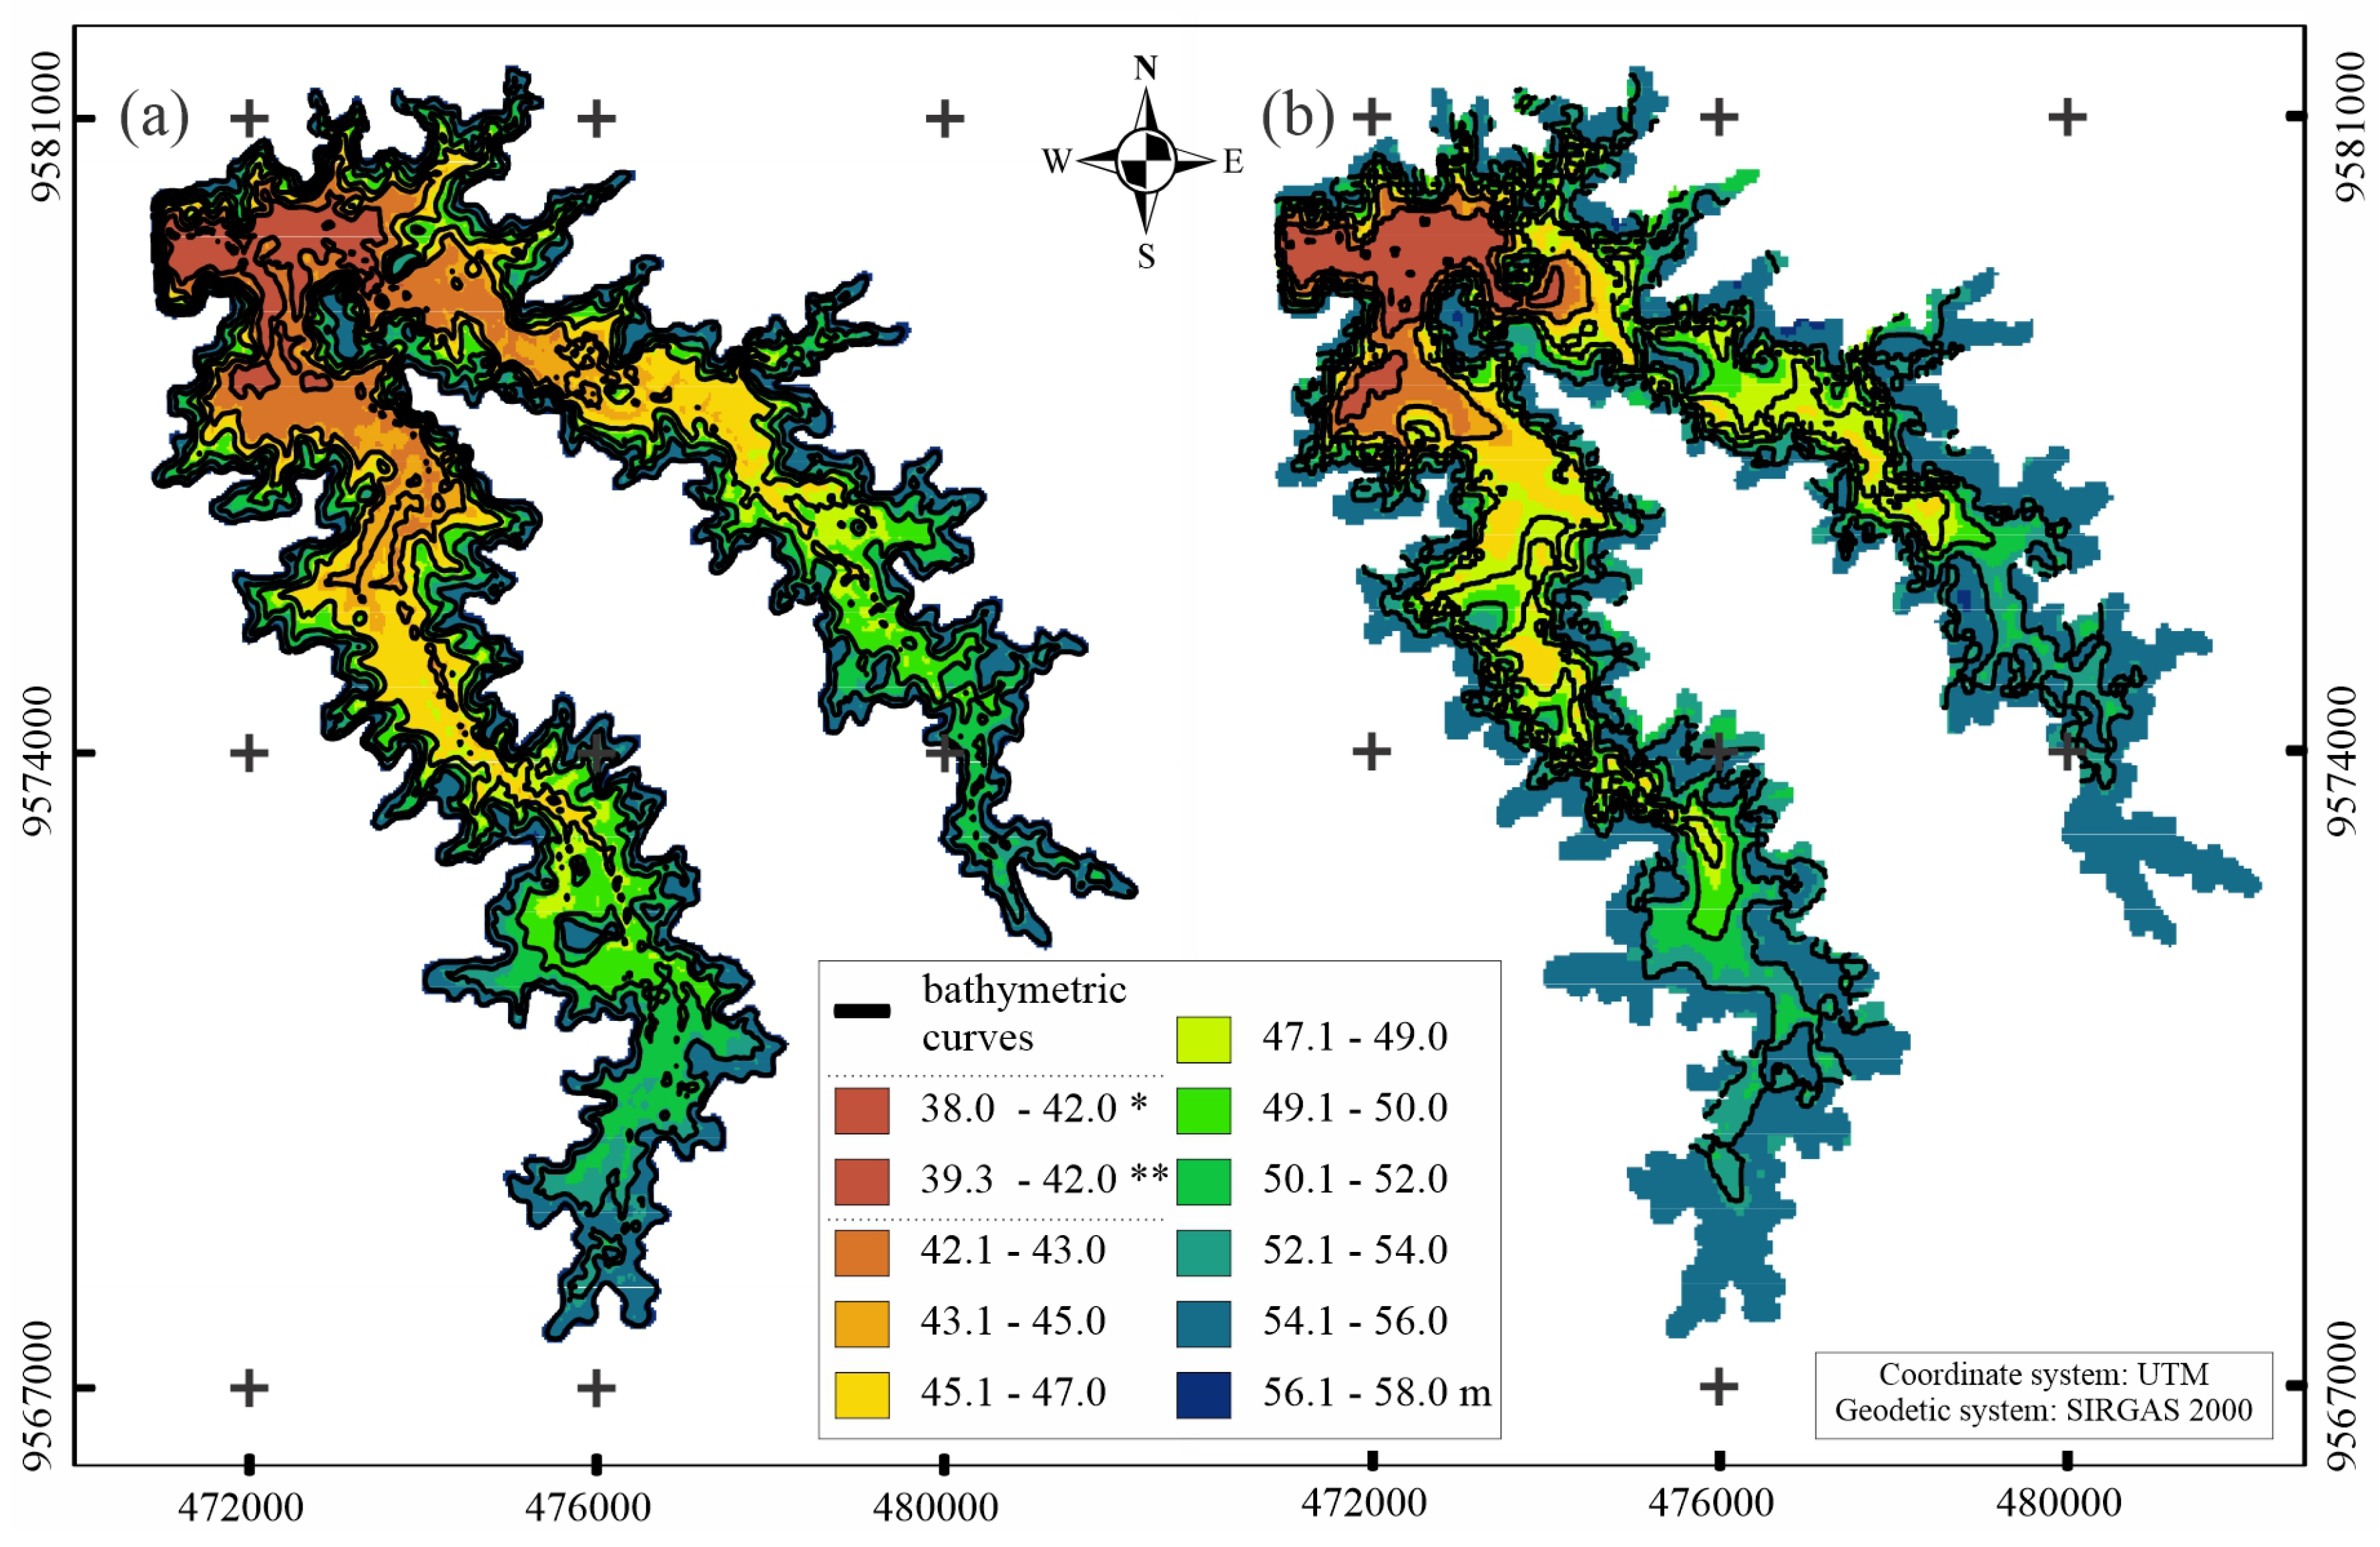
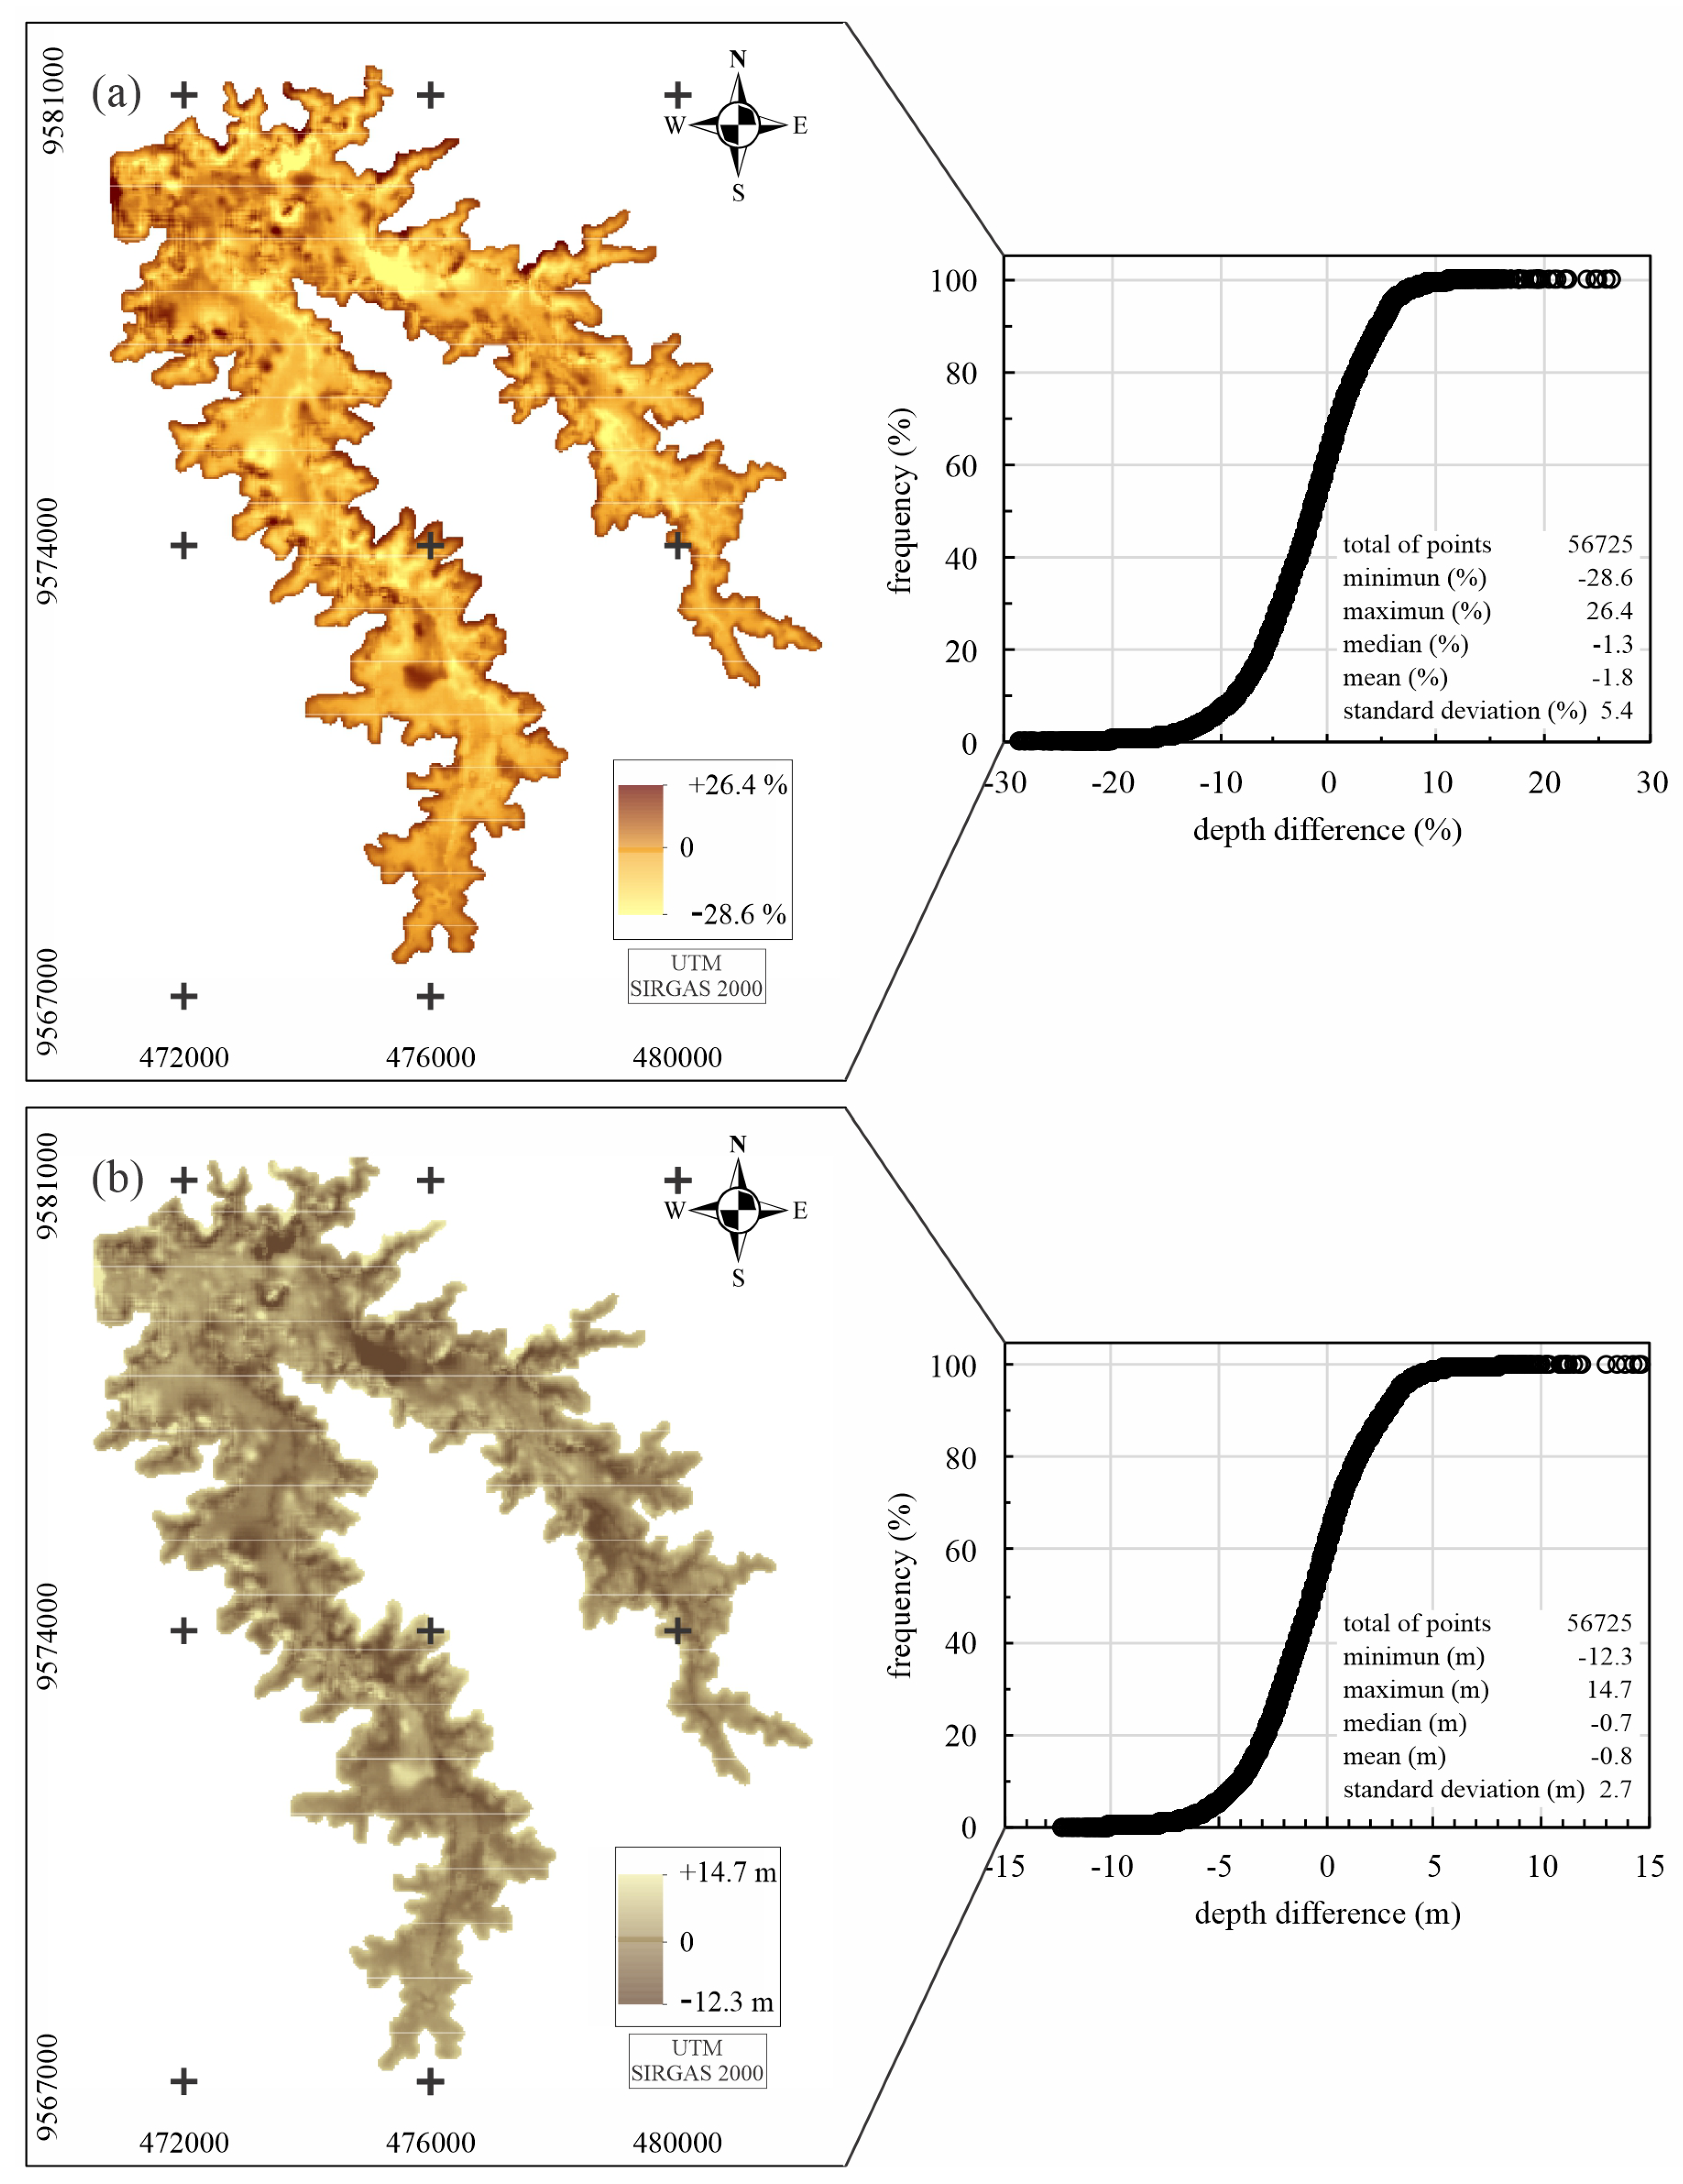
A topographic representation of the terrain shows a distortion in shallow areas, which are located near the edges of the water mirror and in isolated areas, as shown in Figure 8 and Figure 9. The smallest depth coordinates of the reservoir are approximately 20.0 m and 18.7 m when using the classical and BRS methods, respectively (Figure 8). The difference of the maximum depth is 7.0%, whereas the mean and standard deviation are, respectively, 4.3% and 3.6%. The largest difference found is 28.6% in the isolated areas of the hydraulic basin, which may have been built during the drought periods when the reservoir presented its lowest levels of “pits” and “small reservoirs” for the water supply of local residents.
The deepest points (∼20 m) are located near the dam (northwest region of the map, Figure 9), whereas the most divergent depths between the surveys are located elsewhere. These figures show that more than 90% of the surveyed points have differences below 10% of their depths. Therefore, at greater depths, the conditions are similar, showing that the limitations in data collection when using the BRS method do not cause major distortions in deeper places. This demonstrates an important factor for the future use of this method, since it illustrates feasibility and representativeness of terrain features with the largest accumulation of water in a reservoir.
In addition, the specific features of the Brazilian semiarid region, whose water supply depends almost exclusively on surface reservoirs, demand intensive monitoring. However, the existing methods (such as in [24,25,26,27,28,29,30,31,32,34,35]) are often not applicable to such a dense network [12], whose storage level varies extremely within a hydrological year. Therefore, hereby we try to establish equilibrium between cost and accuracy using a hybrid method that associates the traditional approach (bathymetric survey) and remote sensing. The cost reduction will allow water authorities to amplify the extent of the monitored reservoirs, including the rural settlements in the management system. Besides, the method can be helpful to monitor large reservoirs when their storage level is low, as during the recent multiyear drought [6].
3.2. Uncertainty of the Bathymetric Method with Regards to Water Availability
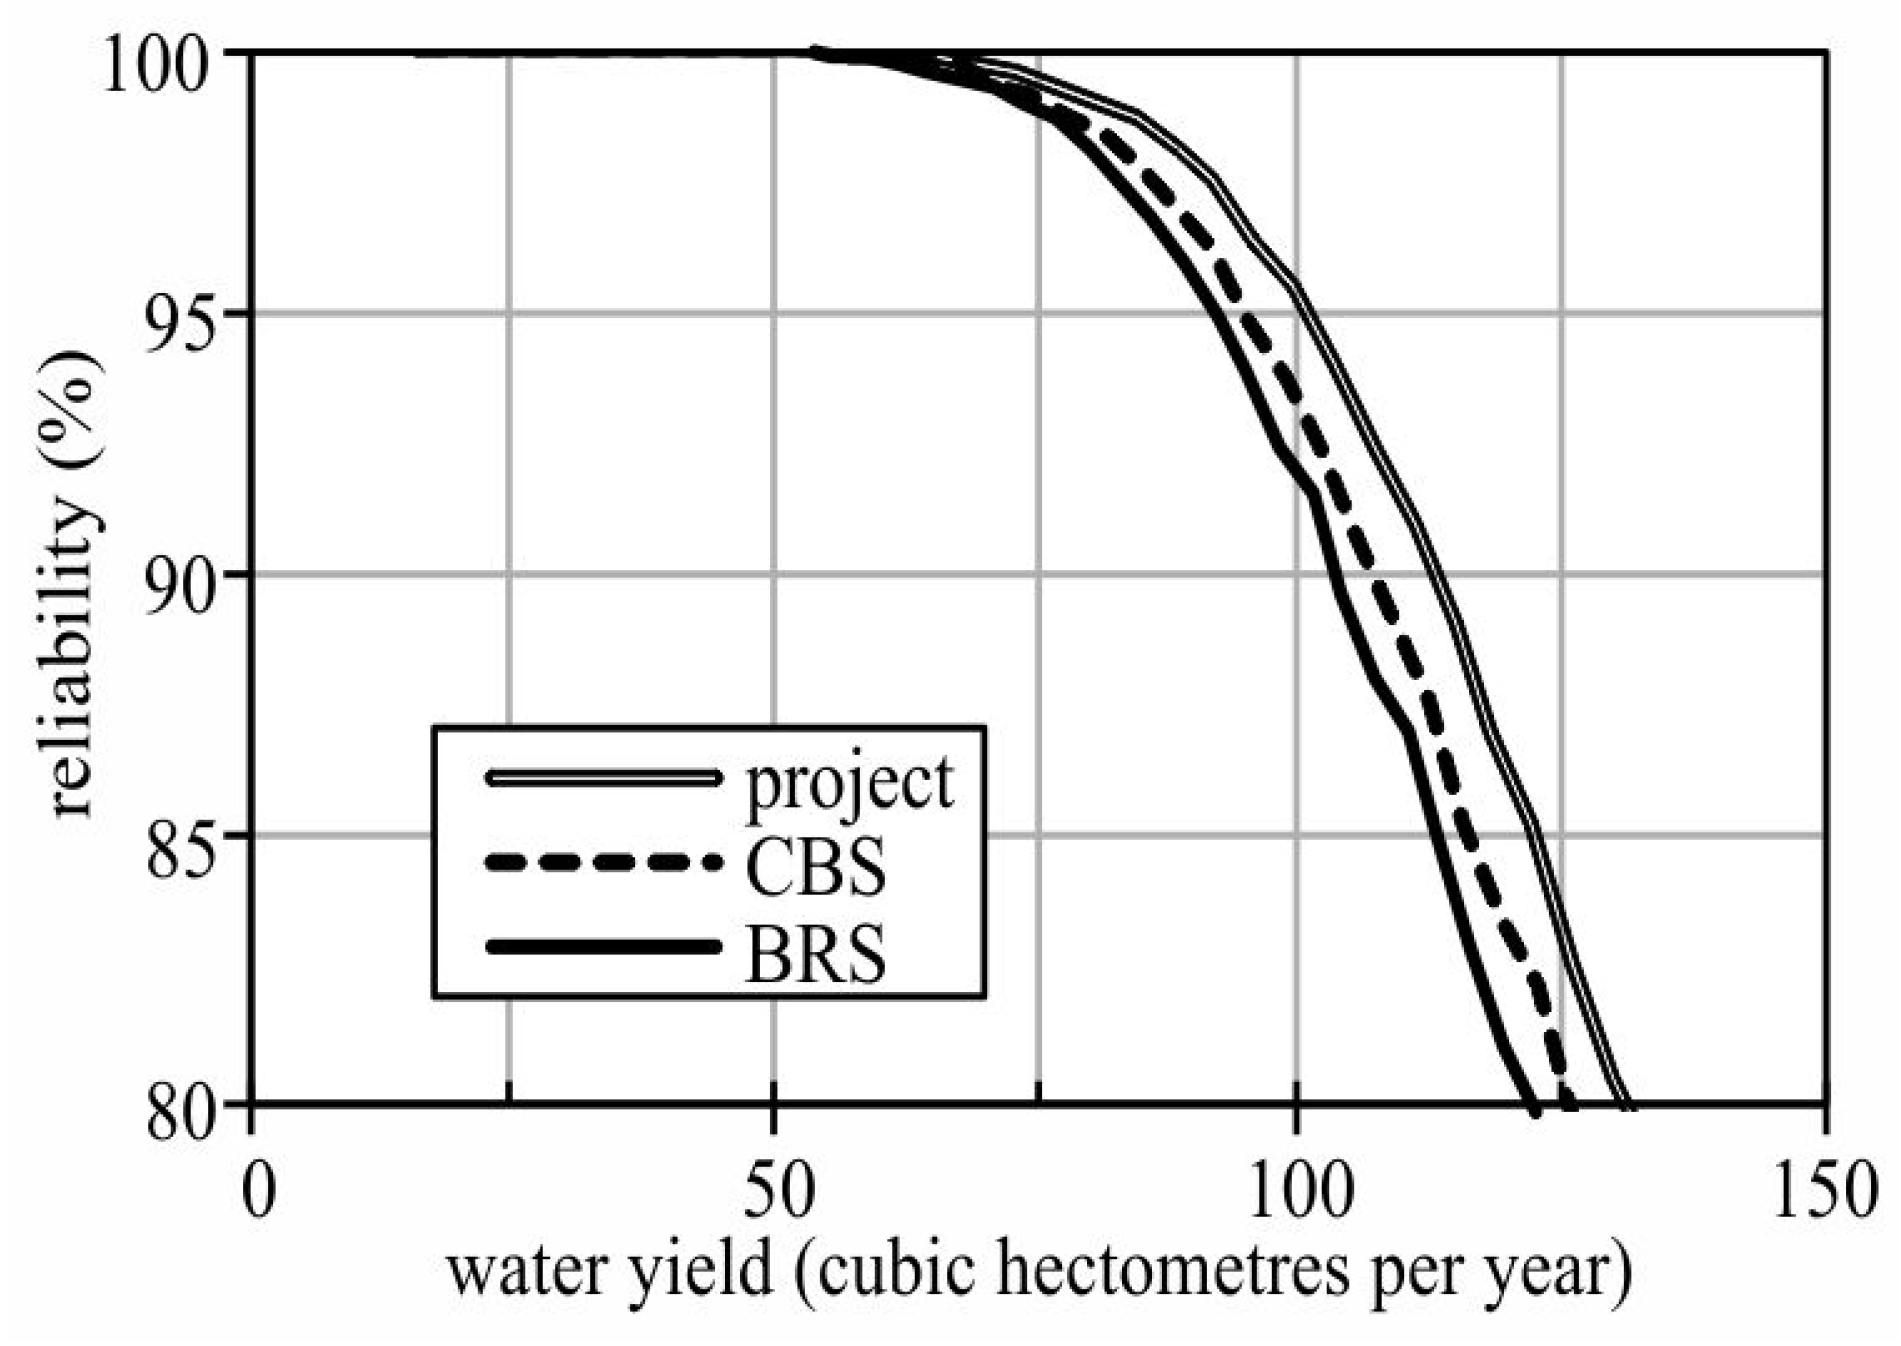
The differences in land topography between the methods directly influence the parameters necessary to determine water availability. As a result, water availability is expected to be lower when using the BRS method, considering that a higher sediment deposition is expected, than with the CBS method. The simplified method provides larger depth errors for shallow depths, and vice versa. Based on the data derived from the conventional survey, water availability (with 90% annual reliability) in 2009 was 106 hm·year. On the contrary, using the simplified-approach data, availability was 102 hm·year (Figure 10). Both results prove a reduction of water availability as the reservoir silting processes evolves, as observed by de Araújo and collaborators [2]. The reduction in water availability might have a great impact on supply, which is crucial for semiarid regions, considering the already existing conflicts over water use [13].
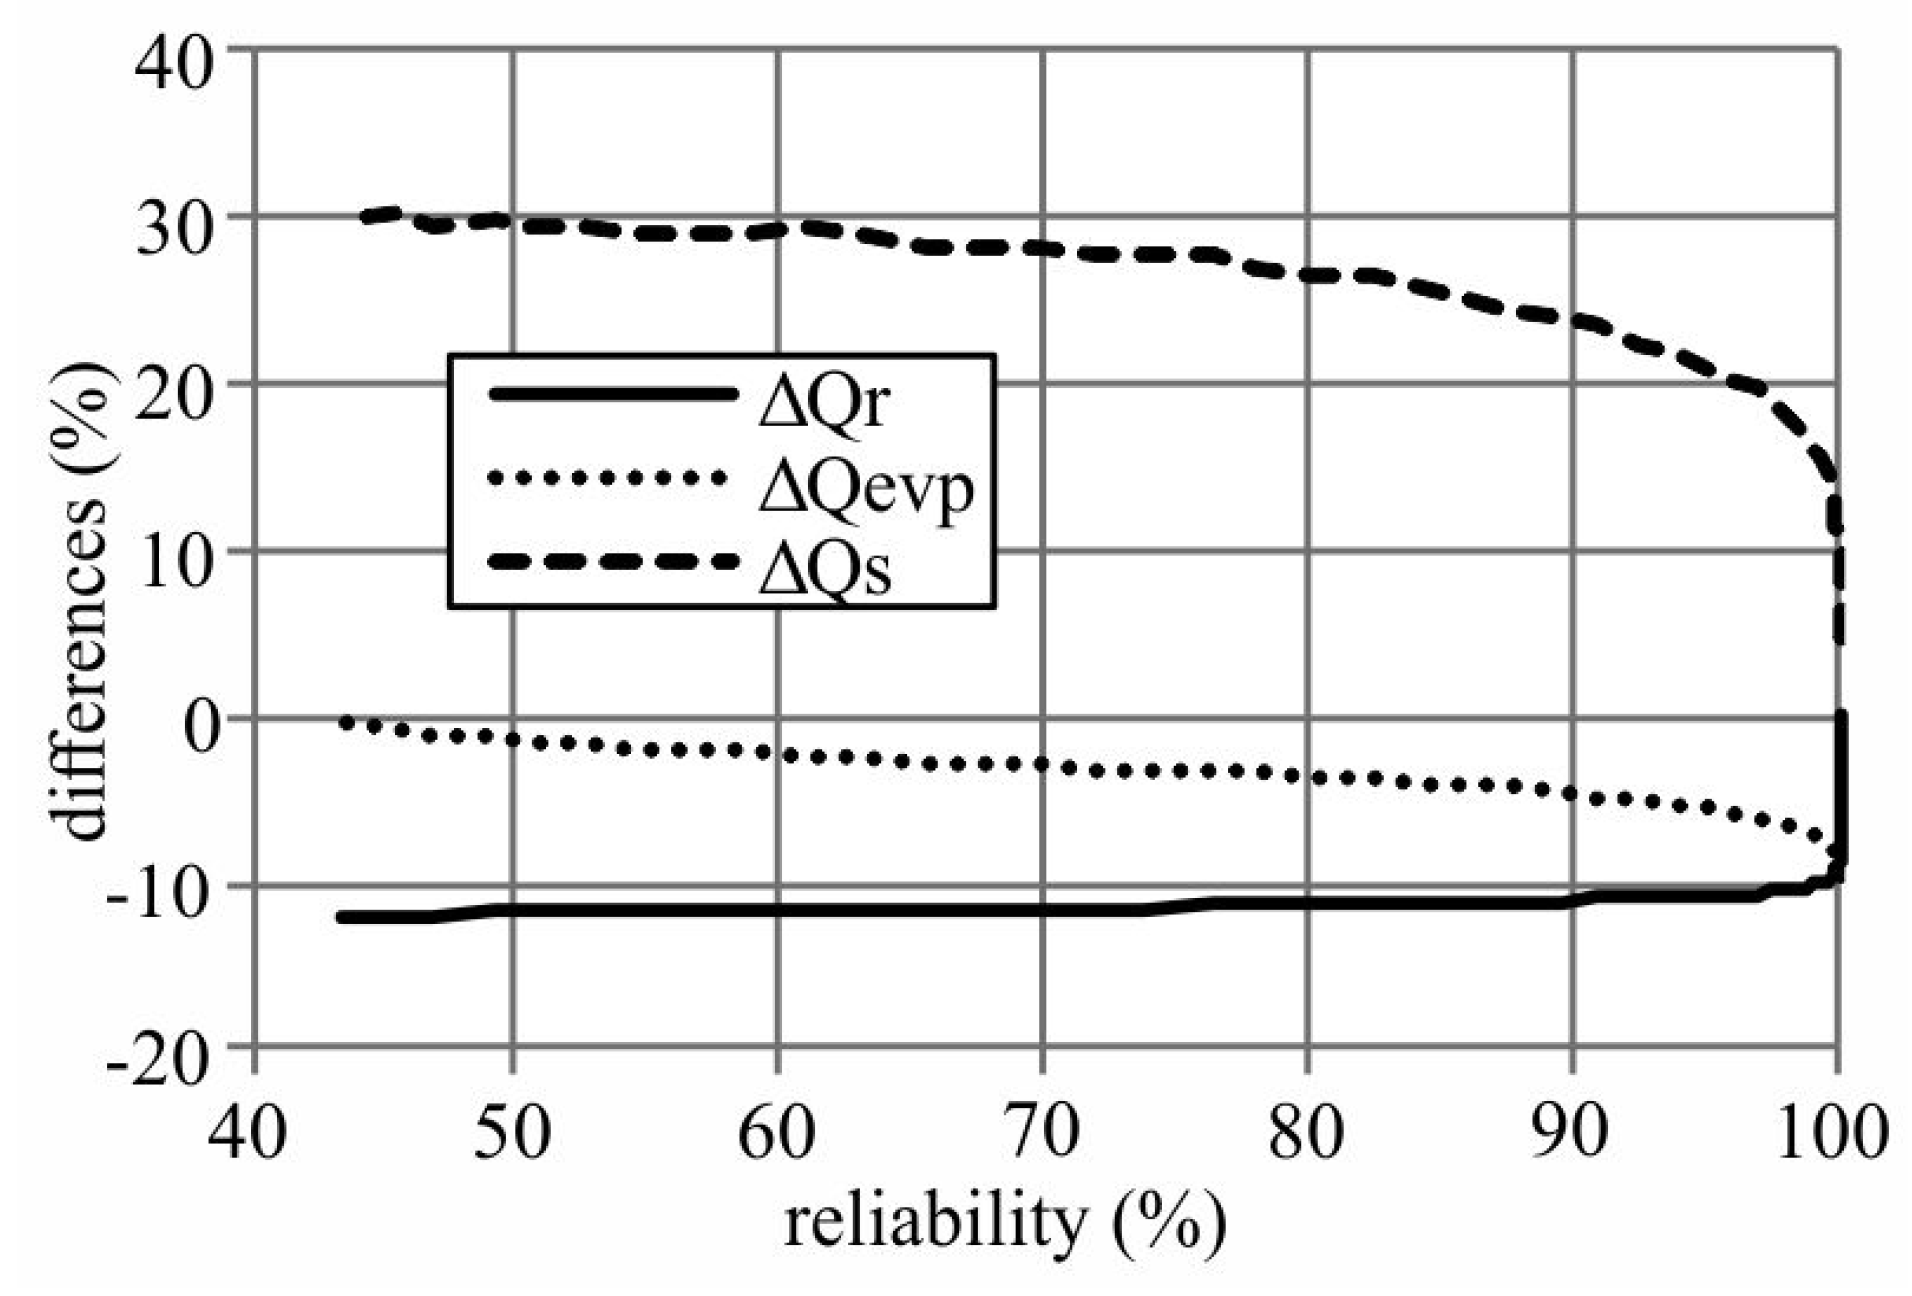
The difference in water yield and spillage shows an inversely proportional behavior to the guarantee. Thus, the higher is the guarantee of the water yield, the smaller is the difference between the methods and hence the smaller is the uncertainty caused by the simplified method. Moreover, it was observed that the effect on the spillage flow is much larger than that on the evaporated flow. This is an important observation, given that spillage flow errors are less significant, since the spillage process occurs at inconstant intervals and variable volume. The evaporation process is continuous and occurs simultaneously when there is use of controlled flow (Figure 11).
The elasticity of water availability errors was estimated, as shown in Table 4, for the reliability levels of 99%, 90% and 80%. The average elasticity is 0.25, showing a downward trend in error propagation. The proposed method tends to have a smaller impact on the flow rates with higher levels of guarantee. The difference of 10% (40 hm) between the results causes a variation of less than 3% for regularized flow rates at different reliability levels.
4. Conclusions
Considering the dense network of reservoirs and its social-economical relevance for the Brazilian semiarid region, continuous monitoring of reservoir morphology is essential for effective water management. We proposed a relatively inexpensive method to update reservoir morphology using simplified bathymetric surveys and remote sensing (BRS). The method was then applied to a large (4 × 10 hm) reservoir in the Brazilian semiarid region, and its results were compared with those of a thorough conventional bathymetric survey. The simplified method estimated the updated storage capacity of the reservoir with an error of 11%. This corresponds to an overestimation of 94% in terms of siltation since the dam was constructed five decades earlier. However, the divergence between the methods led to acceptable differences in terms of the main water-balance variables: average evaporation discharge differed by 10%; spilled discharges differed by 30%; and water availability differed by 10%. Therefore, despite its limitations, the proposed method showed reasonable potential for the continuous monitoring of the thousands of reservoirs affected by silting in the Brazilian semiarid region.
Author Contributions
The paper was conceived, written, reviewed and edited in equal parts by both authors.
Funding
Funding was provided by CAPES (Coordenação de Aperfeiçoamento de Pessoal de Nível Superior), PPGEA/UFC, and CNPq (Conselho Nacional de Desenvolvimento Científico e Tecnológico), grant number 301677/2015-8.
Acknowledgments
We acknowledge Hidrosed research group (www.hidrosed.ufc.br) for the technical support; the company COGERH for the availability of bathymetric data and measured water level data; and Roy Daggenvoorde and Maarten Krol for their contribution in the fieldwork and discussion, respectively.
Conflicts of Interest
The authors declare no conflict of interest.
Abbreviations
The following abbreviations are used in this manuscript:
| INMET | National Institute of Meteorology of Brazil |
| PPGEA/UFC | The Postgraduate Program in Agricultural Engineering of the Federal University of Ceará |
References
- Vörösmarty, C.J.; Sahagian, D. Anthropogenic Disturbance of the Terrestrial Water Cycle. BioScience 2000, 50, 753–765. [Google Scholar] [CrossRef]
- de Araújo, J.C.; Güntner, A.; Bronstert, A. Loss of reservoir volume by sediment deposition and its impact on water availability in semiarid Brazil. Hydrol. Sci. J. 2006, 51, 157–170. [Google Scholar] [CrossRef] [Green Version]
- Habets, F.; Molénat, J.; Carluer, N.; Douez, O.; Leenhardt, D. The cumulative impacts of small reservoirs on hydrology: A review. Sci. Total Environ. 2018, 643, 850–867. [Google Scholar] [CrossRef]
- Andrade, E.M.; Araújo, L.F.P.; Rosa, M.F.; Disney, W.; Alves, A.B. Seleção dos indicadores da qualidade das águas superficiais pelo emprego da análise multivariada. Engenharia Agríccola Jaboticabal 2007, 27, 683–690. [Google Scholar] [CrossRef] [Green Version]
- Do Amaral, A.A.; Pires, S.C.; Ferrari, J.L. Qualidade da água e do sedimento de fundo de alguns córregos do município de Castelo, Estado do Espírito Santo. REVISTA AGRO@MBIENTE ON-LINE 2014, 8, 194. [Google Scholar] [CrossRef] [Green Version]
- de Araújo, J.C.; Bronstert, A. A method to assess hydrological drought in semi-arid environments and its application to the Jaguaribe River basin, Brazil. Water Int. 2016, 41, 213–230. [Google Scholar] [CrossRef]
- Agostinho, A.A.; Gomes, L.C.; Santos, N.C.L.; Ortega, J.C.G.; Pelicice, F.M. Fish assemblages in Neotropical reservoirs: Colonization patterns, impacts and management. Fish. Res. 2016, 173, 26–36. [Google Scholar] [CrossRef]
- Campos, J.N.B. Modeling the Yield–Evaporation–Spill in the Reservoir Storage Process: The Regulation Triangle Diagram. Water Resour. Manag. 2010, 24, 3487–3511. [Google Scholar] [CrossRef] [Green Version]
- Lima Neto, I.E.; Wiegand, M.C.; de Araújo, J.C. Sediment redistribution due to a dense reservoir network in a large semi-arid Brazilian basin. Hydrol. Sci. J. 2011, 56, 319–333. [Google Scholar] [CrossRef] [Green Version]
- Lira, D.; Toledo, C.; Mamede, G. Silting in the dense reservoir network of the Pereira de Miranda catchment. Engenharia Agrícola 2014, 34, 671–682. [Google Scholar] [CrossRef] [Green Version]
- Krol, M.S.; de Vries, M.J.; van Oel, P.R.; de Araújo, J.C. Sustainability of Small Reservoirs and Large Scale Water Availability Under Current Conditions and Climate Change. Water Resour. Manag. 2011, 25, 3017–3026. [Google Scholar] [CrossRef] [Green Version]
- Mamede, G.L.; Araujo, N.A.M.; Schneider, C.M.; de Araujo, J.C.; Herrmann, H.J. Overspill avalanching in a dense reservoir network. Proc. Natl. Acad. Sci. USA 2012, 109, 7191–7195. [Google Scholar] [CrossRef] [Green Version]
- Santos, J.Y.G.; Cunha, T.B.; Vianna, P.C.G. Conflito pelo uso da água no sertão paraibano: O estudo de caso do açude São Francisco II, Teixeira (PB). Cadernos do Logepa 2011, 6, 140–160. [Google Scholar]
- Foteh, R.; Garg, V.; Nikam, B.R.; Khadatare, M.Y.; Aggarwal, S.P.; Kumar, A.S. Reservoir Sedimentation Assessment Through Remote Sensing and Hydrological Modelling. J. Indian Soc. Remote Sens. 2018, 46, 1893–1905. [Google Scholar] [CrossRef]
- Guo, K.; Zou, T.; Jiang, D.; Tang, C.; Zhang, H. Variability of Yellow River turbid plume detected with satellite remote sensing during water-sediment regulation. Cont. Shelf Res. 2017, 135, 74–85. [Google Scholar] [CrossRef] [Green Version]
- Lin, S.; Qi, J.; Jones, J.R.; Stevenson, R.J. Effects of sediments and coloured dissolved organic matter on remote sensing of chlorophyll-a using Landsat TM/ETM+ over turbid waters. Int. J. Remote Sens. 2018, 39, 1421–1440. [Google Scholar] [CrossRef]
- Arsen, A.; Crétaux, J.F.; Berge-Nguyen, M.; del Rio, R. Remote Sensing-Derived Bathymetry of Lake Poopó. Remote Sens. 2013, 6, 407–420. [Google Scholar] [CrossRef] [Green Version]
- de Toledo, C.E.; de Araújo, J.C.; de Almeida, C.L. The use of remote-sensing techniques to monitor dense reservoir networks in the Brazilian semiarid region. Int. J. Remote Sens. 2014, 35, 3683–3699. [Google Scholar] [CrossRef]
- Flener, C.; Lotsari, E.; Alho, P.; Käyhkö, J. Comparison of empirical and theoretical remote sensing based bathymetry models in river environments. River Res. Appl. 2012, 28, 118–133. [Google Scholar] [CrossRef]
- Lima, J.R.d.C.; Shinozaki-Mendes, R.A.; de Almeida, A.Q. Estimativa da batimetria do açude do Saco-PE com auxílio de dados orbitais. Engenharia Agrícola 2013, 33, 1017–1023. [Google Scholar] [CrossRef]
- Narasayya, K. Assessment of reservoir sedimentation using remote sensing satellite imageries. Asian J. Geoinform. 2013, 12. [Google Scholar] [CrossRef]
- Palmer, S.C.; Kutser, T.; Hunter, P.D. Remote sensing of inland waters: Challenges, progress and future directions. Remote Sens. Environ. 2015, 157, 1–8. [Google Scholar] [CrossRef] [Green Version]
- Peng, D.; Guo, S.; Liu, P.; Liu, T. Reservoir Storage Curve Estimation Based on Remote Sensing Data. J. Hydrol. Eng. 2006, 11, 165–172. [Google Scholar] [CrossRef]
- Tong, X.; Pan, H.; Xie, H.; Xu, X.; Li, F.; Chen, L.; Luo, X.; Liu, S.; Chen, P.; Jin, Y. Estimating water volume variations in Lake Victoria over the past 22 years using multi-mission altimetry and remotely sensed images. Remote Sens. Environ. 2016, 187, 400–413. [Google Scholar] [CrossRef]
- Keys, T.A.; Scott, D.T. Monitoring volumetric fluctuations in tropical lakes and reservoirs using satellite remote sensing. Lake Reserv. Manag. 2018, 34, 154–166. [Google Scholar] [CrossRef]
- Rokni, K.; Ahmad, A.; Selamat, A.; Hazini, S. Water Feature Extraction and Change Detection Using Multitemporal Landsat Imagery. Remote Sens. 2014, 6, 4173–4189. [Google Scholar] [CrossRef] [Green Version]
- Feyisa, G.L.; Meilby, H.; Fensholt, R.; Proud, S.R. Automated Water Extraction Index: A new technique for surface water mapping using Landsat imagery. Remote Sens. Environ. 2014, 140, 23–35. [Google Scholar] [CrossRef]
- Hereher, M.E. Environmental monitoring and change assessment of Toshka lakes in southern Egypt using remote sensing. Environ. Earth Sci. 2015, 73, 3623–3632. [Google Scholar] [CrossRef]
- Jones, J. Efficient Wetland Surface Water Detection and Monitoring via Landsat: Comparison with in situ Data from the Everglades Depth Estimation Network. Remote Sens. 2015, 7, 12503–12538. [Google Scholar] [CrossRef] [Green Version]
- Xie, H.; Luo, X.; Xu, X.; Pan, H.; Tong, X. Automated Subpixel Surface Water Mapping from Heterogeneous Urban Environments Using Landsat 8 OLI Imagery. Remote Sens. 2016, 8, 584. [Google Scholar] [CrossRef]
- Chipman, J. A Multisensor Approach to Satellite Monitoring of Trends in Lake Area, Water Level, and Volume. Remote Sens. 2019, 11, 158. [Google Scholar] [CrossRef]
- Zhang, S.; Foerster, S.; Medeiros, P.; de Araújo, J.C.; Motagh, M.; Waske, B. Bathymetric survey of water reservoirs in north-eastern Brazil based on TanDEM-X satellite data. Sci. Total Environ. 2016, 571, 575–593. [Google Scholar] [CrossRef]
- Coelho, C.; Heim, B.; Foerster, S.; Brosinsky, A.; de Araújo, J.; Coelho, C.; Heim, B.; Foerster, S.; Brosinsky, A.; De Araújo, J.C. In Situ and Satellite Observation of CDOM and Chlorophyll-a Dynamics in Small Water Surface Reservoirs in the Brazilian Semiarid Region. Water 2017, 9, 913. [Google Scholar] [CrossRef]
- Zhang, S.; Foerster, S.; Medeiros, P.; de Araújo, J.C.; Waske, B. Effective water surface mapping in macrophyte-covered reservoirs in NE Brazil based on TerraSAR-X time series. Int. J. Appl. Earth Obs. Geoinf. 2018, 69, 41–55. [Google Scholar] [CrossRef]
- Pereira, B.; Medeiros, P.; Francke, T.; Ramalho, G.; Foerster, S.; De Araújo, J.C. Assessment of the geometry and volumes of small surface water reservoirs by remote sensing in a semi-arid region with high reservoir density. Hydrol. Sci. J. 2019, 64, 66–79. [Google Scholar] [CrossRef]
- Andres, L.; Boateng, K.; Borja-Vega, C.; Thomas, E. A Review of In-Situ and Remote Sensing Technologies to Monitor Water and Sanitation Interventions. Water 2018, 10, 756. [Google Scholar] [CrossRef]
- Baup, F.; Frappart, F.; Maubant, J. Combining high-resolution satellite images and altimetry to estimate the volume of small lakes. Hydrol. Earth Syst. Sci. 2014, 18, 2007–2020. [Google Scholar] [CrossRef] [Green Version]
- Van Den Hoek, J.; Getirana, A.; Jung, H.; Okeowo, M.; Lee, H. Monitoring Reservoir Drought Dynamics with Landsat and Radar/Lidar Altimetry Time Series in Persistently Cloudy Eastern Brazil. Remote Sens. 2019, 11, 827. [Google Scholar] [CrossRef]
- Hutchinson, M.F. Calculation of hydrologically sound digital elevation models. In Proceedings of the Third International Symposium on Spatial Data Handling, Sydney, Australia, 17–19 August 1988; pp. 117–133. [Google Scholar]
- Hutchinson, M.F. A new procedure for gridding elevation and stream line data with automatic removal of spurious pits. J. Hydrol. 1989, 106, 211–232. [Google Scholar] [CrossRef]
- Hutchinson, M.F. Development of a Continent-Wide DEM with Applications to Terrain and Climate Analysis. In Environmental Modeling with GIS; Goodchild, M.F., Parks, B.O., Steyaert, L.T., Eds.; Oxford University Press: New York, NY, USA, 1993; pp. 392–399. [Google Scholar]
- USGS. Landsat 5 History; United States Geological Survey: Reston, VA, USA, 2015.
- SEINFRA, C. Tabela de Custos—Secretária de Infraestrutura do Estado do Ceará; State Government of Ceará: Fortaleza, Brazil, 2017.
- Mein, R.G.; McMahon, T.A. River and Reservoir Yield; Water Resources Pubns: Littleton, CO, USA, 1987; p. 368. [Google Scholar]
- Wiegand, M.C.; Piedra, J.I.G.; de Araújo, J.C. Vulnerabilidade à eutrofização de dois lagos tropicais de climas úmido (Cuba) e semiárido (Brasil). Engenharia Sanitária e Ambiental 2016, 21, 415–424. [Google Scholar] [CrossRef] [Green Version]
- Lodhi, M.A.; Rundquist, D.C.; Han, L.; Kuzila, M.S. The potential for remote sensing of loess soils suspended in surface waters. J. Am. Water Resour. Assoc. 2007, 33, 111–117. [Google Scholar] [CrossRef]
- Rudorff, C.M.; Novo, E.M.L.M.; Galvao, L.S.; Pereira Filho, W. Análise derivativa de dados hiperespectrais medidos em nível de campo e orbital para caracterizar a composição de águas opticamente complexas na Amazônia. Acta Amaz. 2007, 37, 269–280. [Google Scholar] [CrossRef]
- Meireles, A.; Chaves, L.; Lopes, F.; Andrade, E.; Becker, H. Qualidade da agua em função da criação de peixes no açude Orós, Ceará. In Proceedings of the I Simpósio Brasileiro de Recursos Naturais do Semiárido, Iguatu, Brazil, 22–24 May 2013; pp. 1–6. [Google Scholar]
- Beveridge, M.C.M. Cage Aquaculture; Wiley-Blackwell: Oxford, UK, 2004; p. 380. [Google Scholar]
- Henry-Silva, G.G.; Camargo, A.F.M. Efficiency of aquatic macrophytes to treat Nile tilapia pond effluents. Sci. Agric. 2006, 63, 433–438. [Google Scholar] [CrossRef]
Figure 1.
Flowchart for the bathymetric survey using remote sensing simplified method.

Figure 2.
Study area location, Pentecoste reservoir, Brazil.

Figure 3.
Inflow (annual drained volume) and stored volume of the Pentecoste reservoir from 2009 to 2014.
Figure 3.
Inflow (annual drained volume) and stored volume of the Pentecoste reservoir from 2009 to 2014.

Figure 4.
Spatial distribution of points shown on the Pentecoste reservoir by: (a) the conventional bathymetric survey method (CBS: it is not possible to view the separate points due to their high density); and (b) the bathymetric survey using remote sensing simplified method (BRS (bathymetric survey and remote sensing)).

Figure 5.
In (a), the figure compare the surface water of residual volume with the area/perimeter in the maximum water storage capacity. From (b–f) the figures show the flooded water surface of the Pentecoste reservoir obtained from Landsat 5 TM images in relation to the maximum water storage capacity.

Figure 6.
Example of reservoir in the Brazilian semiarid region with the occurrence terrestrial and aquatic vegetation: Paus Branco reservoir, Ceará, March 2011; HIDROSED files.
Figure 6.
Example of reservoir in the Brazilian semiarid region with the occurrence terrestrial and aquatic vegetation: Paus Branco reservoir, Ceará, March 2011; HIDROSED files.

Figure 7.
Water-level–volume (a); and water-level–area (b) curves of the Pentecoste reservoir (Project—original curves; CBS—Conventional bathymetric survey; BRS—Bathymetric survey using Remote Sensing simplified method).
Figure 7.
Water-level–volume (a); and water-level–area (b) curves of the Pentecoste reservoir (Project—original curves; CBS—Conventional bathymetric survey; BRS—Bathymetric survey using Remote Sensing simplified method).

Figure 8.
Bathymetric curves and dimensions of the Pentecoste reservoir morphology: (a) CBS (Conventional bathymetric survey); and (b) BRS (Bathymetric survey using Remote Sensing simplified method).
Figure 8.
Bathymetric curves and dimensions of the Pentecoste reservoir morphology: (a) CBS (Conventional bathymetric survey); and (b) BRS (Bathymetric survey using Remote Sensing simplified method).

Figure 9.
Differences in the topography of the Pentecoste reservoir due to survey methods: CBS (Conventional bathymetric survey) and BRS (Bathymetric survey using Remote Sensing simplified method): (a) differences in depths in % [(CBS − BRS)/CBS] and the respective frequency curve; and (b) differences in depths in meters (CBS − BRS) and the respective frequency curve.

Figure 10.
Water yield (availability) versus annual reliability for the Pentecoste reservoir as a function of the morphology (elevation-area-volume curves). Project—original curves; CBS—Conventional bathymetric survey; BRS—Bathymetric survey using Remote Sensing simplified method.
Figure 10.
Water yield (availability) versus annual reliability for the Pentecoste reservoir as a function of the morphology (elevation-area-volume curves). Project—original curves; CBS—Conventional bathymetric survey; BRS—Bathymetric survey using Remote Sensing simplified method.

Figure 11.
Difference between the main water-balance variables in the Pentecoste reservoir as a function of the annual reliability: = []/, in which is the water yield; = []/, in which is the evaporation discharge; and = []/, in which is the spillway overflow discharge.
Figure 11.
Difference between the main water-balance variables in the Pentecoste reservoir as a function of the annual reliability: = []/, in which is the water yield; = []/, in which is the evaporation discharge; and = []/, in which is the spillway overflow discharge.


Table 1.
Dates of the Landsat 5 TM images and their respective measured water-level altitude. The maximum water-level altitude is 58.00 m.a.s.l. The stored volume (%) is taken as a function of the reservoir storage capacity in 2009 (360 cubic hectometers: COGERH).
Table 1.
Dates of the Landsat 5 TM images and their respective measured water-level altitude. The maximum water-level altitude is 58.00 m.a.s.l. The stored volume (%) is taken as a function of the reservoir storage capacity in 2009 (360 cubic hectometers: COGERH).
| Image Date | Measured Water-Level Altitude | Stored Volume | Stored Volume |
|---|---|---|---|
| (m.a.s.l.) | (Cubic Hectometers) | (%) | |
| 7 April 2011 | 55.32 | 236 | 66 |
| 9 July 2010 | 54.58 | 208 | 58 |
| 5 October 2007 | 52.71 | 146 | 41 |
| 12 August 1999 | 48.05 | 46 | 13 |
| 30 October 1993 | 47.41 | 37 | 10 |
Table 2.
Input data of the VYELAS model for the three scenarios of the Pentecoste reservoir. Symbol: * the same in the scenarios.
Table 2.
Input data of the VYELAS model for the three scenarios of the Pentecoste reservoir. Symbol: * the same in the scenarios.
| Data | Source/Observation |
|---|---|
| Mean inflow discharge * | Calculated by water balance from the measured daily volume of the reservoir |
| Coefficient of variation annual discharge * | Calculated from the annual inflow |
| Morphological parameter () | Calculated from the elevation-area-volume curves (original, 2009/CBS, 2014/BRS) |
| Evaporation of the dry period * | Climate station (INMET) |
| Maximum reservoir storage capacity | Original, 2009/CBS and 2014/BRS |
| Minimum operational volume | 10% of respective maximum storage capacity |
| Initial volume (first simulation year) | 50% of maximum storage capacity |
| Number of simulation years (synthetic series) * | 50,000 |
Table 3.
Main features of the silted Pentecoste reservoir according to both methods: CBS (Conventional bathymetric survey) and BRS (Bathymetric survey using Remote Sensing simplified method). The difference refers to the methods (CBS vs. BRS).
Table 3.
Main features of the silted Pentecoste reservoir according to both methods: CBS (Conventional bathymetric survey) and BRS (Bathymetric survey using Remote Sensing simplified method). The difference refers to the methods (CBS vs. BRS).
| Feature | Unit | Original | CBS | BRS | Difference (%) |
|---|---|---|---|---|---|
| Maximum depth | meters | 22.0 | 20.0 | 18.7 | 7 |
| Maximum water surface | hectare | 5700 | 4849 | 5221 | 8 |
| Storage capacity | cubic hectometers | 396 | 360 | 320 | 11 |
| Dry bulk density | tons per cubic meter | 1.30 | - | - | - |
| Average silted mass | tons per decade | - | 89,000 | 172,421 | 94 |
| Average silted volume | cubic hectometers per decade | - | 6.9 | 13.3 | 93 |
| Sedimentation rate | percentage per decade | - | 1.7 | 3.3 | 94 |
Table 4.
Elasticity () for the Pentecoste reservoir as a function of the water-yield reliability; and of the bathymetric methods. Abbreviations: CBS, Conventional bathymetric survey; BRS, Bathymetric survey using remote sensing simplified method; S, storage capacity; , water yield discharge associated with reliability G. For the terms and , please refer to Equation (1)–(3).
| Water Yield | Survey Method | Storage Capacity | |||||||
|---|---|---|---|---|---|---|---|---|---|
| (hm) | CBS | BRS | CBS | BRS | |||||
| 74.5 | 73.8 | 360 | 320 | −0.7 | 74.5 | −40 | 360 | 0.09 | |
| 105.8 | 102.0 | - | - | −3.8 | 105.8 | - | - | 0.33 | |
| 124.2 | 119.9 | - | - | −4.4 | 124.2 | - | - | 0.32 | |
© 2019 by the authors. Licensee MDPI, Basel, Switzerland. This article is an open access article distributed under the terms and conditions of the Creative Commons Attribution (CC BY) license (http://creativecommons.org/licenses/by/4.0/).
Share and Cite
MDPI and ACS Style
Lopes, J.W.B.; de Araújo, J.C. Simplified Method for the Assessment of Siltation in Semiarid Reservoirs Using Satellite Imagery. Water 2019, 11, 998. https://doi.org/10.3390/w11050998
AMA Style
Lopes JWB, de Araújo JC. Simplified Method for the Assessment of Siltation in Semiarid Reservoirs Using Satellite Imagery. Water. 2019; 11(5):998. https://doi.org/10.3390/w11050998
Chicago/Turabian StyleLopes, José Wellington Batista, and José Carlos de Araújo. 2019. "Simplified Method for the Assessment of Siltation in Semiarid Reservoirs Using Satellite Imagery" Water 11, no. 5: 998. https://doi.org/10.3390/w11050998
Note that from the first issue of 2016, this journal uses article numbers instead of page numbers. See further details here.