Copula-Based Research on the Multi-Objective Competition Mechanism in Cascade Reservoirs Optimal Operation
by
Menglong Zhao
1, 
Shengzhi Huang
1,*,
Qiang Huang
1,
Hao Wang
2,
Guoyong Leng
3,
Siyuan Liu
1 and
Lu Wang
1 1
State Key Laboratory Base of Eco-Hydraulic Engineering in Arid Area, Xi’an University of Technology, Xi’an 710048, China
2
State Key Laboratory of Simulation and Regulation of Water Cycle in River Basin, China Institute of Water Resources and Hydropower Research, Beijing 100038, China
3
Environmental Change Institute, University of Oxford, Oxford OX1 3QY, UK
*
Author to whom correspondence should be addressed.
Water 2019, 11(5), 995; https://doi.org/10.3390/w11050995
Submission received: 10 April 2019
/
Revised: 2 May 2019
/
Accepted: 9 May 2019
/
Published: 12 May 2019
(This article belongs to the Special Issue Managing Water Resources in Large River Basins)
Abstract
:Water resources systems are often characterized by multiple objectives. Typically, there is no single optimal solution which can simultaneously satisfy all the objectives but rather a set of technologically efficient non-inferior or Pareto optimal solutions exists. Another point regarding multi-objective optimization is that interdependence and contradictions are common among one or more objectives. Therefore, understanding the competition mechanism of the multiple objectives plays a significant role in achieving an optimal solution. This study examines cascade reservoirs in the Heihe River Basin of China, with a focus on exploring the multi-objective competition mechanism among irrigation water shortage, ecological water shortage and the power generation of cascade hydropower stations. Our results can be summarized as follows: (1) the three-dimensional and two-dimensional spatial distributions of a Pareto set reveal that these three objectives, that is, irrigation water shortage, ecological water shortage and power generation of cascade hydropower stations cannot reach the theoretical optimal solution at the same time, implying the existence of mutual restrictions; (2) to avoid subjectivity in choosing limited representative solutions from the Pareto set, the long series of non-inferior solutions are adopted to study the competition mechanism. The premise of sufficient optimization suggests a macro-rule of ‘one falls and another rises,’ that is, when one objective value is inferior, the other two objectives show stronger and superior correlation; (3) the joint copula function of two variables is firstly employed to explore the multi-objective competition mechanism in this study. It is found that the competition between power generation and the other objectives is minimal. Furthermore, the recommended annual average water shortage are 1492 × 104 m3 for irrigation and 4951 × 104 m3 for ecological, respectively. This study is expected to provide a foundation for selective preference of a Pareto set and insights for other multi-objective research.
1. Introduction
Real-world systems always refer to multiple objective optimization in their operations. Multi-objective optimization problems (MOPs) usually require the simultaneous optimization of some incommensurable and competitive objectives. A reservoir system, for example, serves various purposes and involves multi-objective decision-making in the implementation process. With continuous development and utilization of water resources and hydropower resources and the expansion of management and the protection objectives of natural resources, watershed development has shifted from a traditional single task such as power generation and flood control to comprehensive utilization taking account of the ecological environment. While on the basis of the total amount of water resources availability, there are often contradictions among the development goals in the basin due to unreasonable utilization [1] such as deterioration of the ecological environment caused by the increase of irrigation water usage and large power loss as a result of large discharge in the flooding season and insufficient water after the flooding season.
The proper operation of cascade reservoirs is a multi-stage, nonlinear, high-dimensional and strictly controlled optimization process pertinent to the planning and management of water resources [2,3,4,5]. From the optimization direction, the optimization methods could be categorized as gradient search, direct search and meta-heuristic search [6]. From the development process, algorithms utilized to achieve optimal scheme of reservoir operation could be divided into classic methods and intelligence optimization algorithms. Traditionally, many researchers have adopted classical techniques such as linear programming, nonlinear programming and dynamic programming to deal with the MOPs, either a weighted or a constrained approach, without considering all objectives simultaneously [7,8,9]. The classic methods are relatively simple but are limited by the possibilities such as not attaining global optima, convergence to local optima and being hampered by dimensionality. Natural phenomena drive the development of the latter intelligence optimization methods. One of the strengths of intelligence optimization algorithms is their convergence to be virtually global optimal for any well-defined optimization problem [10,11,12]. In recent years, many intelligent optimization algorithms and improved algorithms, such as Evolutionary Algorithms (EA), Artificial Neutral Network (ANN), Non-Dominated Sorting Genetic Algorithm-II (NSGA-II), Particle Swarm Optimization (PSO) and Cuckoo Search (CS), have been proved to be useful in the multi-reservoir systems optimization for maximizing benefits of multi-objectives [13,14,15,16,17,18]. This study employs improved NSGA-II to solve the MOPs of reservoir optimal dispatching.
As the MOPs usually contain multiple incommensurable and competing objectives, it is impossible to find a single optimal solution to satisfy all the targets. Instead, the solution exists in the form of alternative trade-offs, known as the Pareto optimal solutions [19]. There is a contradiction between objectives of every Pareto optimal solution, identified as universality and particularity. To better understand the evolution process of Pareto optimality and choose the optimum, it is necessary to explore the competition mechanism among multiple objectives and the interactions between two or three objectives.
Currently, most of studies on the competition mechanism between multiple objectives always focus on the objectives of several typical schemes which are unavoidably subjective, while few studies address the competition rules among multi-objectives (3) of long series to reflect the statistical law of each objective [20,21,22]. Copulas [23] are known as an effective means for describing the dependence between random variables, thus expected to be suitable for studying competition or dependence among multi-objectives. Recently, different copulas have been employed for the multivariate analysis of spatiotemporal change in probabilistic forecasting of seasonal droughts [24], multivariate real-time droughts assessment [25], joint return periods of precipitation and temperature extremes [26], flood frequency analysis [27,28], risk analysis [29], energy environmental optimization [30,31,32], stochastic hydrological simulation [33] and so on, while its application in the research field of multi-objective competition relationship has not yet emerged. A key feature of copula is to characterize the dependency structure of two or more variables, either cross-correlation or auto-correlation [34], making it a promising method for the multi-objective questions. In this study, copula function is chosen to construct joint sequence values of two targets. This is the first time that copula is applied to explore multi-objective competition mechanism whereby the overall impact of one objective on the other two objectives can be evaluated.
The Heihe River Basin, as the second largest inland river basin of China, is the study area. The primary goals of this study are: (1) to analyze the three-dimensional and two-dimensional spatial distributions of the Pareto set obtained on account of reservoir dispatching obtained in the preliminary work; (2) to establish a formula for quantitatively describing the relationship between two objectives and to inform the law of water use; and (3) to explore the multi-objective competition mechanism for the overall impact of one objective on the other two objectives with the copula function constructing the joint sequence of two targets. The goal of this study is to reveal the multi-objective competitive mechanism and alleviate the competitive nature of water usage. It also provides guidance for the unified allocation of water resources and provides insights for other multi-objective problems.
2. Study Area and Data
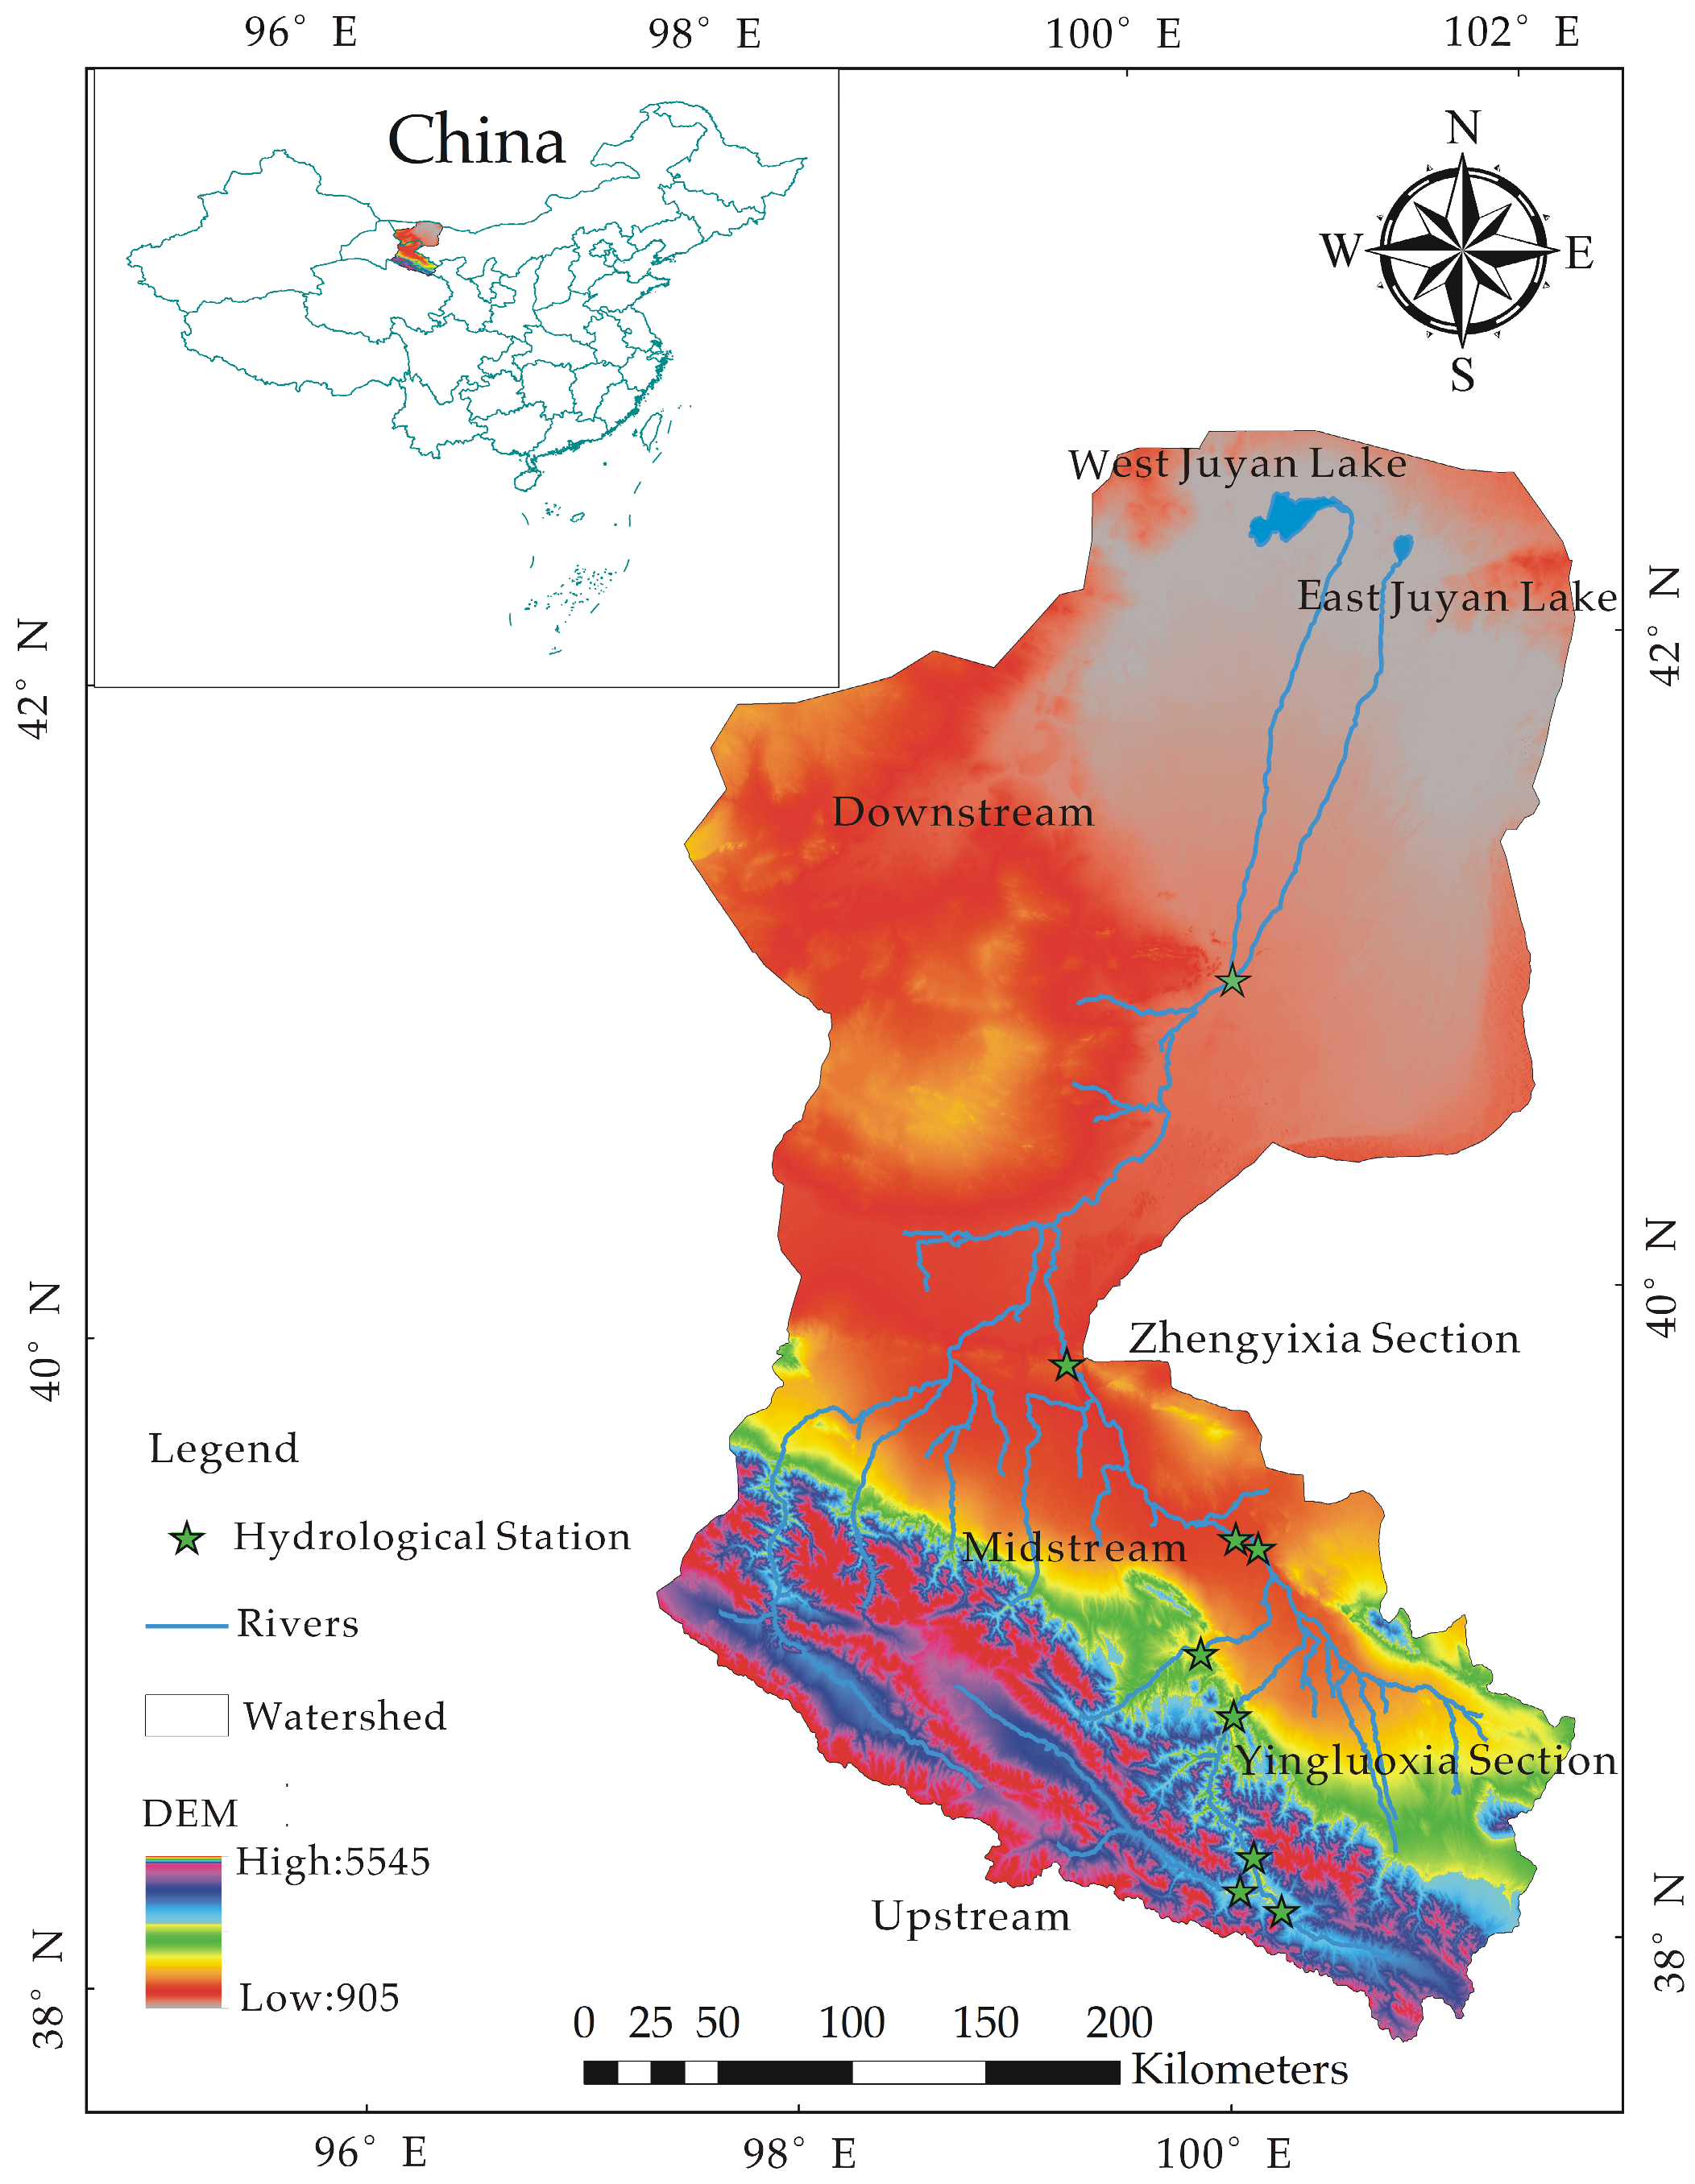
As the second largest inland river basin of China, Heihe River Basin is situated within 98° E~102° E and 37.5° N~42.4° N, with an area of about 134,000 km2. With an average annual precipitation of 400 mm and an average annual potential evaporation of 1600 mm, the basin lays in the interior of the Eurasian continent and characterized by arid hydrological features. The predominant land use types are desert and grass lands, accounting for roughly 60% and 25% of the total area, respectively [35]. Under water and ecological stresses, the Heihe River Basin suffers water-table decline, terminal lakes dryness, grassland degeneration as well as widespread desertification largely owing to the combined impacts of climate change and human activities [36,37]. Given its key role in water resources planning and management in northwestern China, the Heihe River Basin has long been a focus of studies on inland rivers in arid regions and it is therefore selected for this case study.
The main stream of Heihe River is about 928 km long from the birthplace of the Qilian Mountains to the tail of Juyan Lake. It is divided into upstream, middle and downstream areas by the Yingluo Gorge and the Zhengyi Gorge. The upstream is the main water production area. The middle is the main irrigation water area. The downstream is the main ecological water consumption area (as shown in Figure 1). The first control project in the Heihe river basin is Huangzangsi hydro-junction, covering an area of 7648 km2 and controlling almost 80% incoming water in the upper reaches of the Heihe River (Figure 1). Huangzangsi is a within-year reservoir which has 4.06 × 10⁸ m3 total storage and 3.34 × 10⁸ m3 regulating storage, with 6.02 MW guaranteed output and 49 MW installed capacity. Huangzangsi Reservoir and seven run-off hydropower stations, which are Baopinghe, Sandaowan, Erlongshan, Dagushan, Xiaogushan, Longshou-II and Longshou-I, combining with the Zhengyixia Reservoir at the end of the middle reaches, to constitute the structure of cascade reservoirs that have ‘2 reservoirs 7 stations.’
In the previous work, based on the long series of monthly run-off data from July 1957 to June 2014, the model of cascade reservoirs dispatching in the Heihe River Basin has been established and solved, which will be the basis of this study.
3. Research Methodology
3.1. Description of Multi-Objective Model of the Heihe Cascade Reservoirs Operation
Objective Function
The comprehensive utilization of water resources in the main stream of Heihe River is mainly embodied by three aspects: power generation in the upper reaches, irrigation in the middle reaches and ecological water use in the lower reaches. Consequently, this configuration has three objectives, namely minimum irrigation water shortage, minimum ecological water shortage and maximum generation capacity of cascade hydropower stations. The allocation of water resources in the Heihe River Basin requires that the ‘electricity regulation’ complies with the ‘water regulation,’ that is, the irrigation water and the ecological water need to be given priority while taking into account power generation requirements. With the decision variables of the final water level of the time interval of Huangzangsi Reservoir and Zhengyixia Reservoir, the objective functions are as follows:
Objective 1: Minimum Irrigation Water Shortage
Objective 2: Minimum Ecological Water Shortage
Objective 3: Maximum generation capacity
Subject to the following constraints:
All variables need to satisfy non-negative constraints where, (104 m3) is irrigation water shortage; (104 m3) denotes ecological water shortage; (108 kW·h) indicates generation capacity of cascade hydropower stations; t is time interval number and T is total number of time intervals, T = 684; i is river number and I is total river reach number, I = 5; and indicates irrigation water demand and water supply flow of time t and river i respectively, m3/s; denotes the irrigation coefficient of time t and river I; Δt is unit time, Δt = 2.63 × 10⁶ s; and represents the ecological water demand and water supply flow of time t respectively; is the ecological coefficient in time t; j is hydropower station number and J is total number of hydropower stations, J = 9; is comprehensive output coefficient of station j; indicates generation flow in time t of station j; (m) denotes the net water head in time t of station j; indicates the terminal storage capacity of time t and station j; and denote the input and outflow. and describe the lowest water level and the highest water level for power generation in Reservoir j; is the final reservoir level of time t and station j; and indicates the minimum discharge and maximum safe discharge of station j; and are the guarantee output and installed capacity respectively of station j; is the output of time t and station j.
The constraints include: reservoir water balance constraint; reservoir water level constraint; reservoir discharge; hydropower station output; boundary initial conditions; and non-negative variables.
3.2. ICGC-NSGA-II Algorithm
NSGA-II is recognized as one of the most effective multi-objective optimization algorithms. By non-dominated sorting of multi-objective problems, NSGA-II replaces the traditional multi-objective methods in transforming objective functions (such as weighted or constrained transformation). Its inherent parallelism makes it possible to search multi-objective non-inferior solution sets simultaneously and to deal with non-inferior frontier irregular optimization problems [7,38,39]. Moreover, it can better maintain the diversity of the population and has a strong robustness. However, multi-objective reservoir dispatching is a multi-stage decision-making problem. The value of decision variables in the previous stage usually affects the scope of the feasible region in the next stage. When evolutionary algorithm is adopted to solve the problem, the feasible region takes a small proportion in the search space and the efficiency of the evolutionary algorithm is very low. Reducing the proportion of infeasible areas in search area is thus one of the most effective methods for improving the efficiency of operation. In this study, ICGC-NSGA-II is used to solve the reservoir dispatching model and the specific procedures can be found in Reference [21].
3.3. Normalization of Objective Sequence
In this study, the three target values are normalized. To eliminate the difference of dimension of each objective and make them comparable, each object is normalized according to the following formula:
where, and are target eigenvalue and the normalized value of the non-inferior solution of the object respectively; is the difference between the target eigenvalue and the moderate value.
Among the three objectives of this study, the average irrigation water shortage (Obj-1) and ecological water shortage (Obj-2) are the minimizing objectives. Conversely, the multi-year average generation capacity (Obj-3) belongs to the maximizing objective. The optimization directions of objectives are different. In order to construct the joint sequence values of two targets, the optimization direction of normalized values needs to be consistent. The normalized value of Obj-1 and Obj-2 were subtracted by 1. A new normalized matrix is generated by replacing the original normalized value with the difference.
3.4. Copulas Theory
The copula was originally introduced by Sklar et al. [40] as a useful method to derive joint distributions with marginals. Its design allows it to deal with non-normal distributions. This method is also likely to be beneficial when the marginals can be definitely stipulated but the joint distribution is not straightforward to construct. The name ‘copula’ basically comes from the word ‘couple’ to emphasize a manner whereby a joint distribution function and the marginals can be combined [23]. The copula is a multidimensional joint probability distribution function with a uniform distribution in [0,1] interval. It can connect multiple random variables with their respective marginal distribution functions for the joint distribution function. Therefore, copula is often referred to as ‘connection functions’ or ‘dependent functions.’ Among them, the marginal distribution function describes the distribution of a single variable, while the copula function indicates the joint distribution of multi-dimensional composite variables [41].
The ‘Sklar theorem’ defines that: Assuming F is an n-dimensional distribution function whose marginals are (F1, F2, …, Fn) of a random vector (X1, X2, …, Xn), there exists an n-dimensional copula function C, which satisfies the following formula for arbitrary :
If the marginal distributions F1, F2, …, Fn are continuous, function C is uniquely determined. Conversely, if C is an n-dimensional copula function and F1, F2,…, Fn are a set of univariate distribution functions, the function F defined by Equation (11) is an n-dimensional distribution function having marginal distribution as F1, F2, …, Fn.
Copula functions could be divided into four categories as a whole: Archimedean Copula, Extreme Copula, Elliptical Copulas and other hybrid families of copulas. In this study, two-dimensional copula of Clayton Copula, Frank Copula and Gumbel Copula in the Archimedean Copula function family and Gaussian Copula and Student Copula in the elliptic population are selected.
Copula is able to construct multi-dimensional joint probability distribution function by arbitrary marginal distribution and correlation structure [42]. It is flexible in forms and does not require all variables to obey the same scatter. In recent years, copula is often used to analyze the joint recurrence period of multi-variables and the frequency of combined events. Copula function has natural advantages in constructing joint distribution of two variables. In this study, copula is used to construct joint sequence values of two targets and applied to the study of multi-objective competition mechanism for the first time. Procedures of constructing joint sequence values of two targets are as follows:
- Dependence measurement. Before constructing multivariate joint distribution, it is necessary to measure the correlation between different random variables according to the correlation index.
- Marginal distribution fitting. The marginal distribution of each single variable should be fitted to find the appropriate distribution type. Since all the parametric methods in this study have not passed the test, the non-parametric method is adopted here. In this paper, a non-parametric empirical frequency determination method based on the Gringorten formula [43,44] is introduced.
- Parameter estimation of copula function. In this paper, the maximum likelihood estimation method [45] is used to estimate parameters.
- Goodness of fit evaluation. The goodness-of-fit evaluation is an important way of comparing and analyzing the goodness-of-fit evaluation indices of different types of copula functions, so as to optimize the most suitable distribution of copula functions.
The AIC (Akaike Information Criterion) method is proposed by Akaike in 1974 [46] from the perspective of information theory. It is a goodness-of-fit evaluation criterion based on the Kullback-Leibler information metric, which contains two factors: the deviation between the empirical points and theoretical copula functions as well as the error fluctuation caused by the number of parameters of copula functions. Taking the joint copula function of two variables as an example, the concrete formulas of the AIC information criterion method are as follows:
where, , are the empirical and theoretical frequencies of the joint copula function with two variables are expressed, respectively. MSE is the mean square error and m is the number of parameters of the model.
Among them, the smaller the value of AIC, the better the fitting of the copula function. The AIC information criterion is applicable to the comparison and optimization of copula functions with a different number of model parameters.
- 5.
- Computation of Joint Distribution Sequence Values. In order to find a new sequence that reflects the overall characteristics of the two variables, it needs to inverse the frequency sequence obtained above and then get the joint sequence value of the two variables. In this study, the inverse function, that is, NORMINV for the normal cumulative distribution function in the MATLAB software is used to derive the sequence values of the joint probability distribution of the copula function.
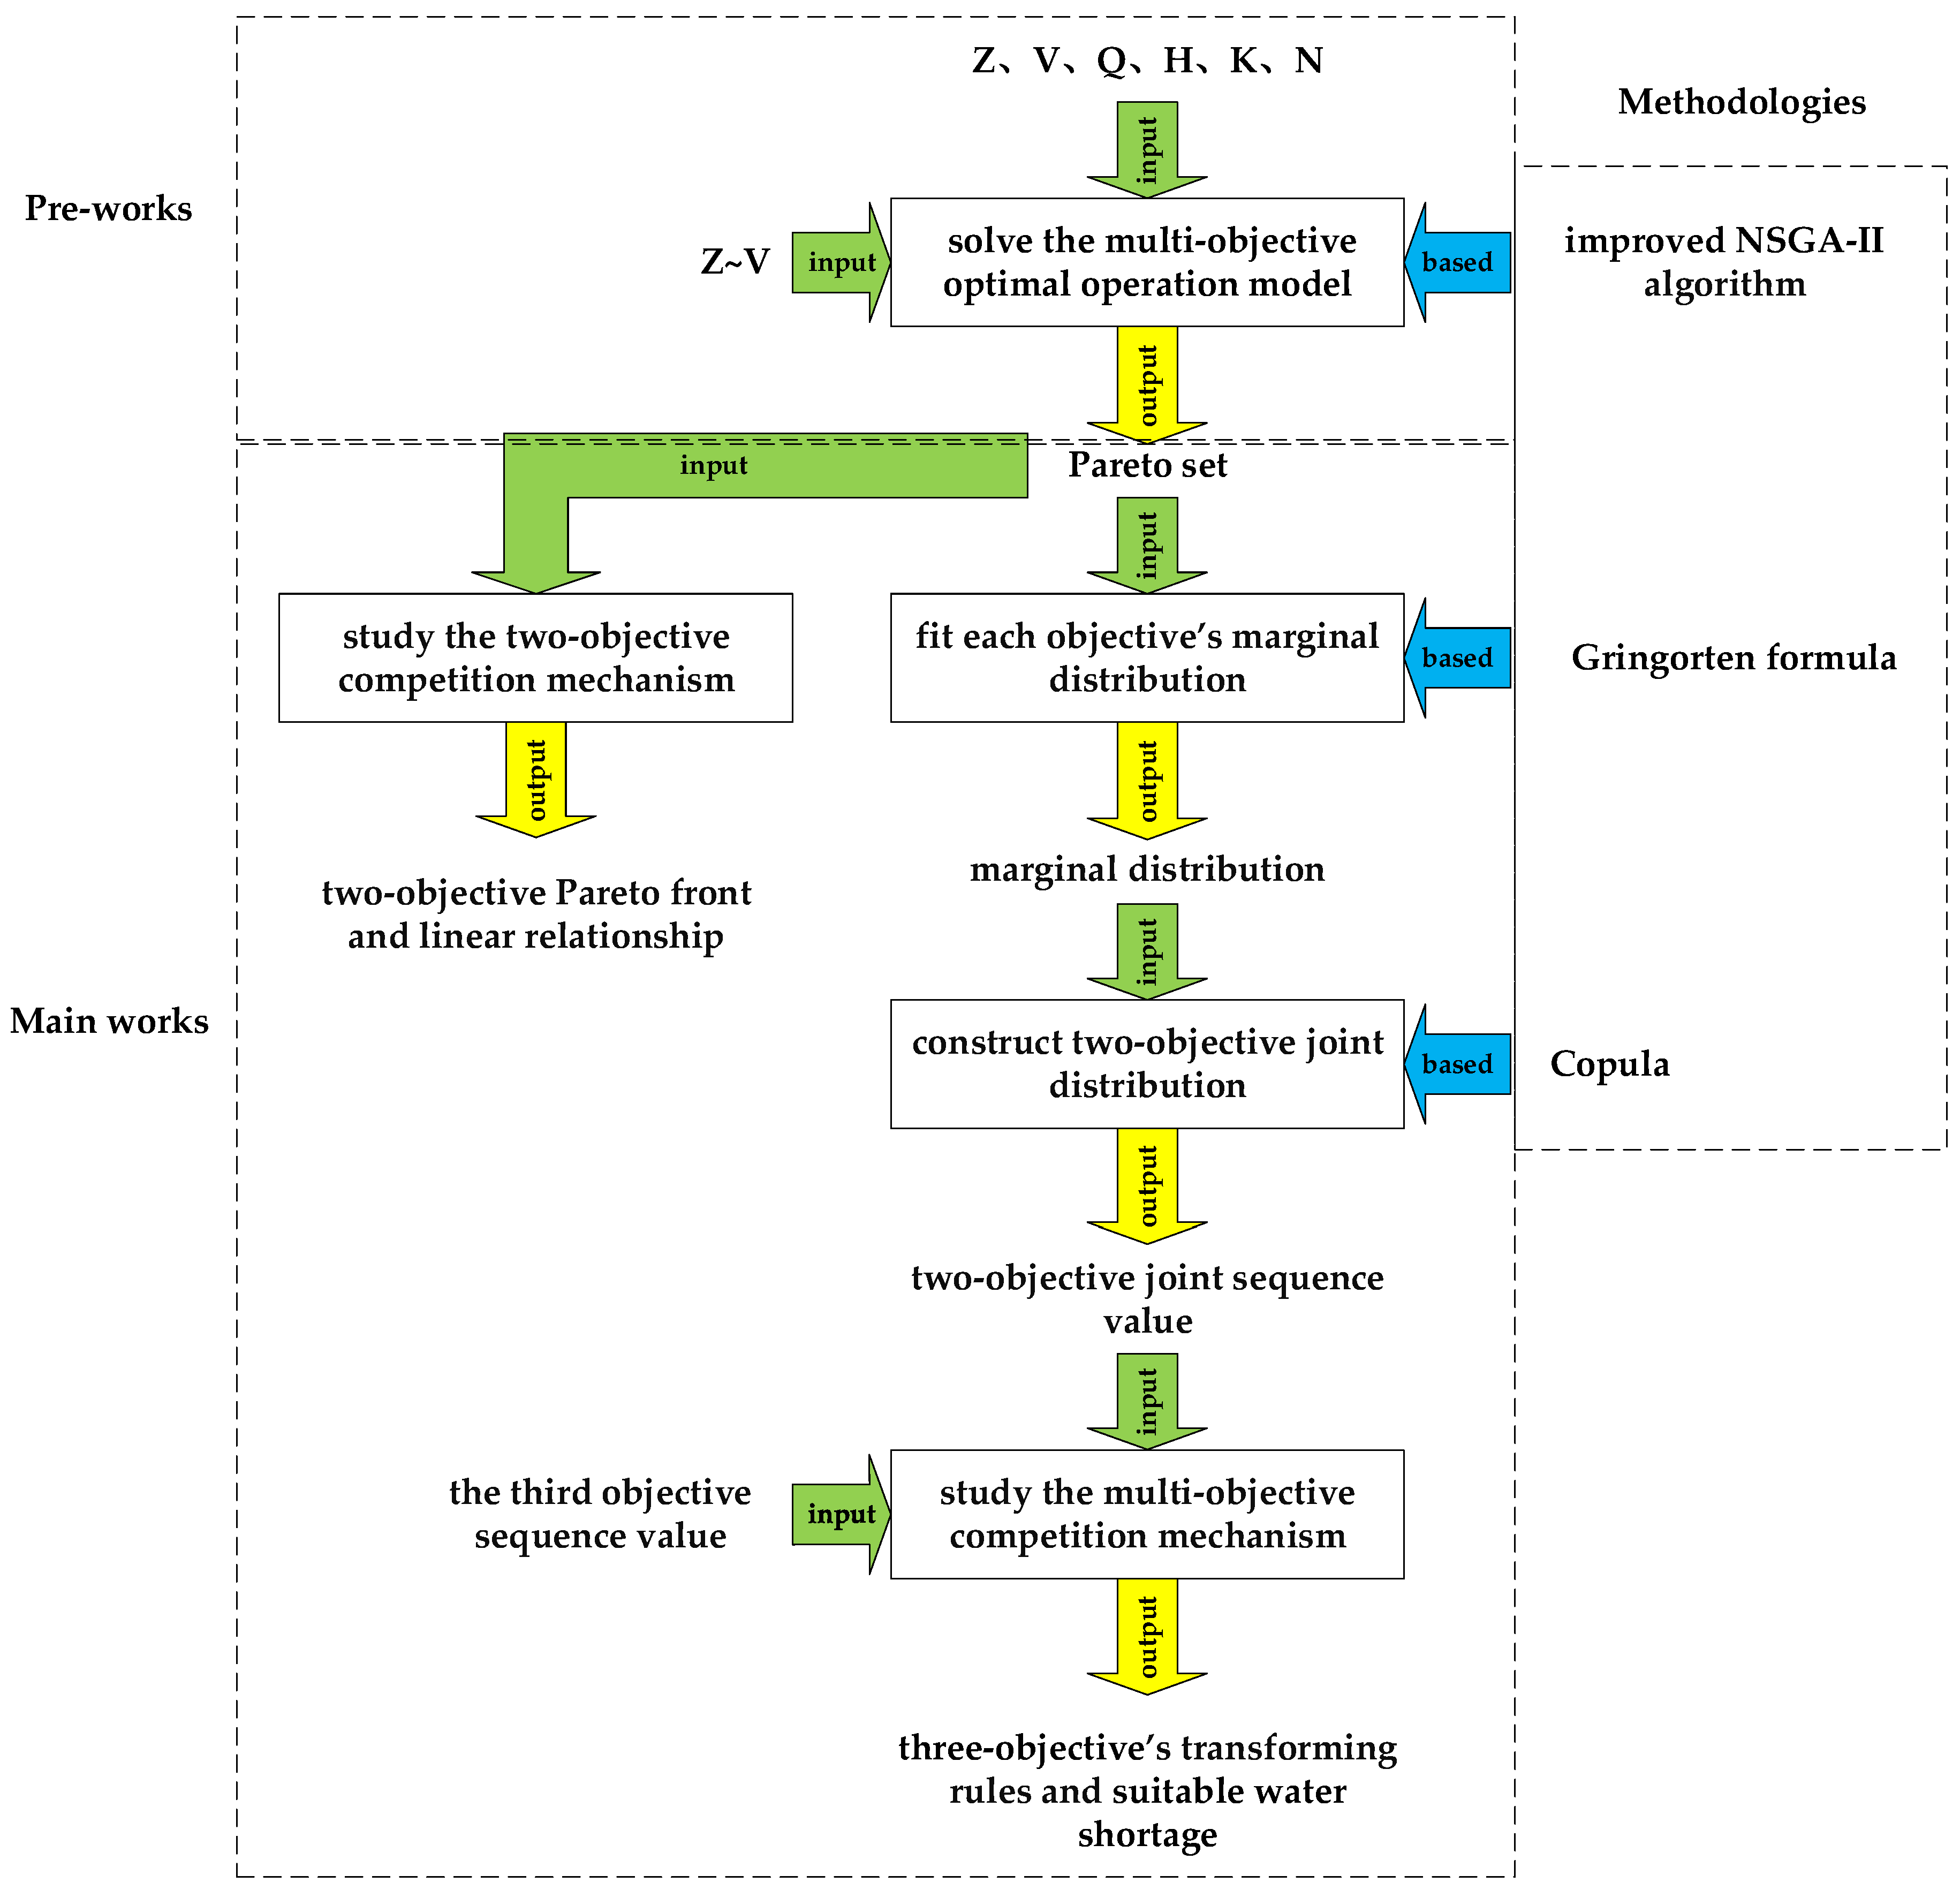
In this paper, with the Pareto set output from the multi-objective optimal operation model as the input, copula is employed to study the multi-objective competition mechanism. The main research process is as follows (Figure 2):
4. Results and Discussions
4.1. Optimal Results of the ICGC-NSGA-II
In the main stream of the Heihe River, Huangzangsi Reservoir, seven run-off hydropower stations of Baopinghe, Sandaowan, Erlongshan, Dagushan, Xiaogushan, Longshou-II and Longshou-I and Zhengyixia Reservoir at the end of the middle reaches constitute the structure of ‘2 reservoirs 7 stations’ as the cascade reservoirs’ hydropower station system. With the ICGC-NSGA-II algorithm for solving the optimal dispatching multi-objective model, the decision variables are the final water level of the time interval of Huangzangsi Reservoir and Zhengyixia Reservoir. The population size is 2000 and the number of iterations is 500 generations. The results of long-term optimal scheduling are sorted according to the ascending order of annual water shortage, as shown in Table 1.
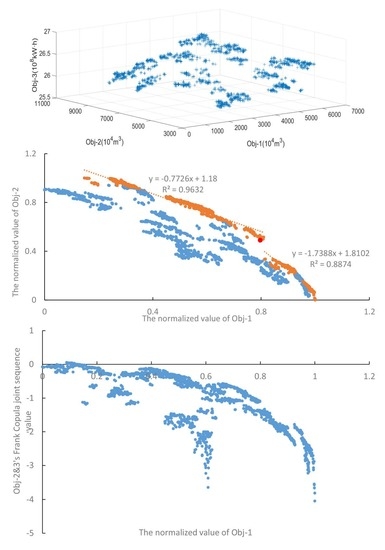
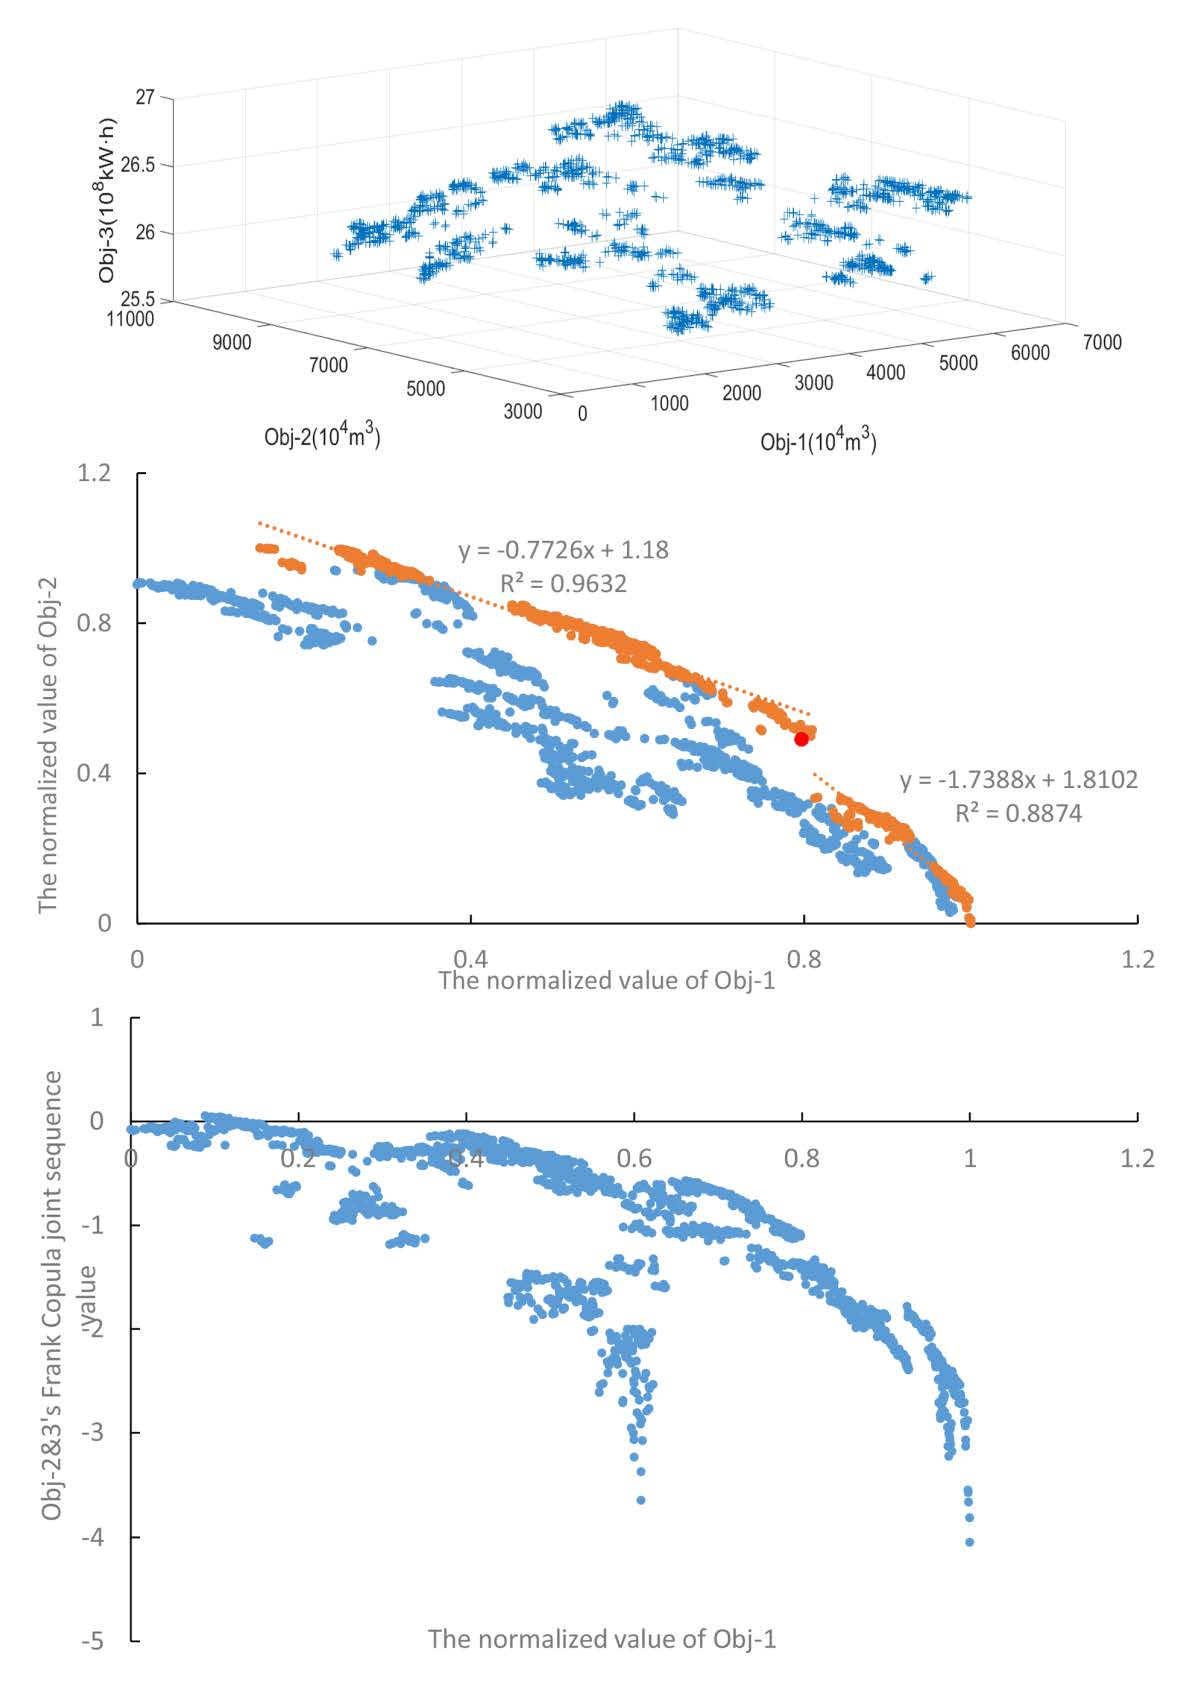
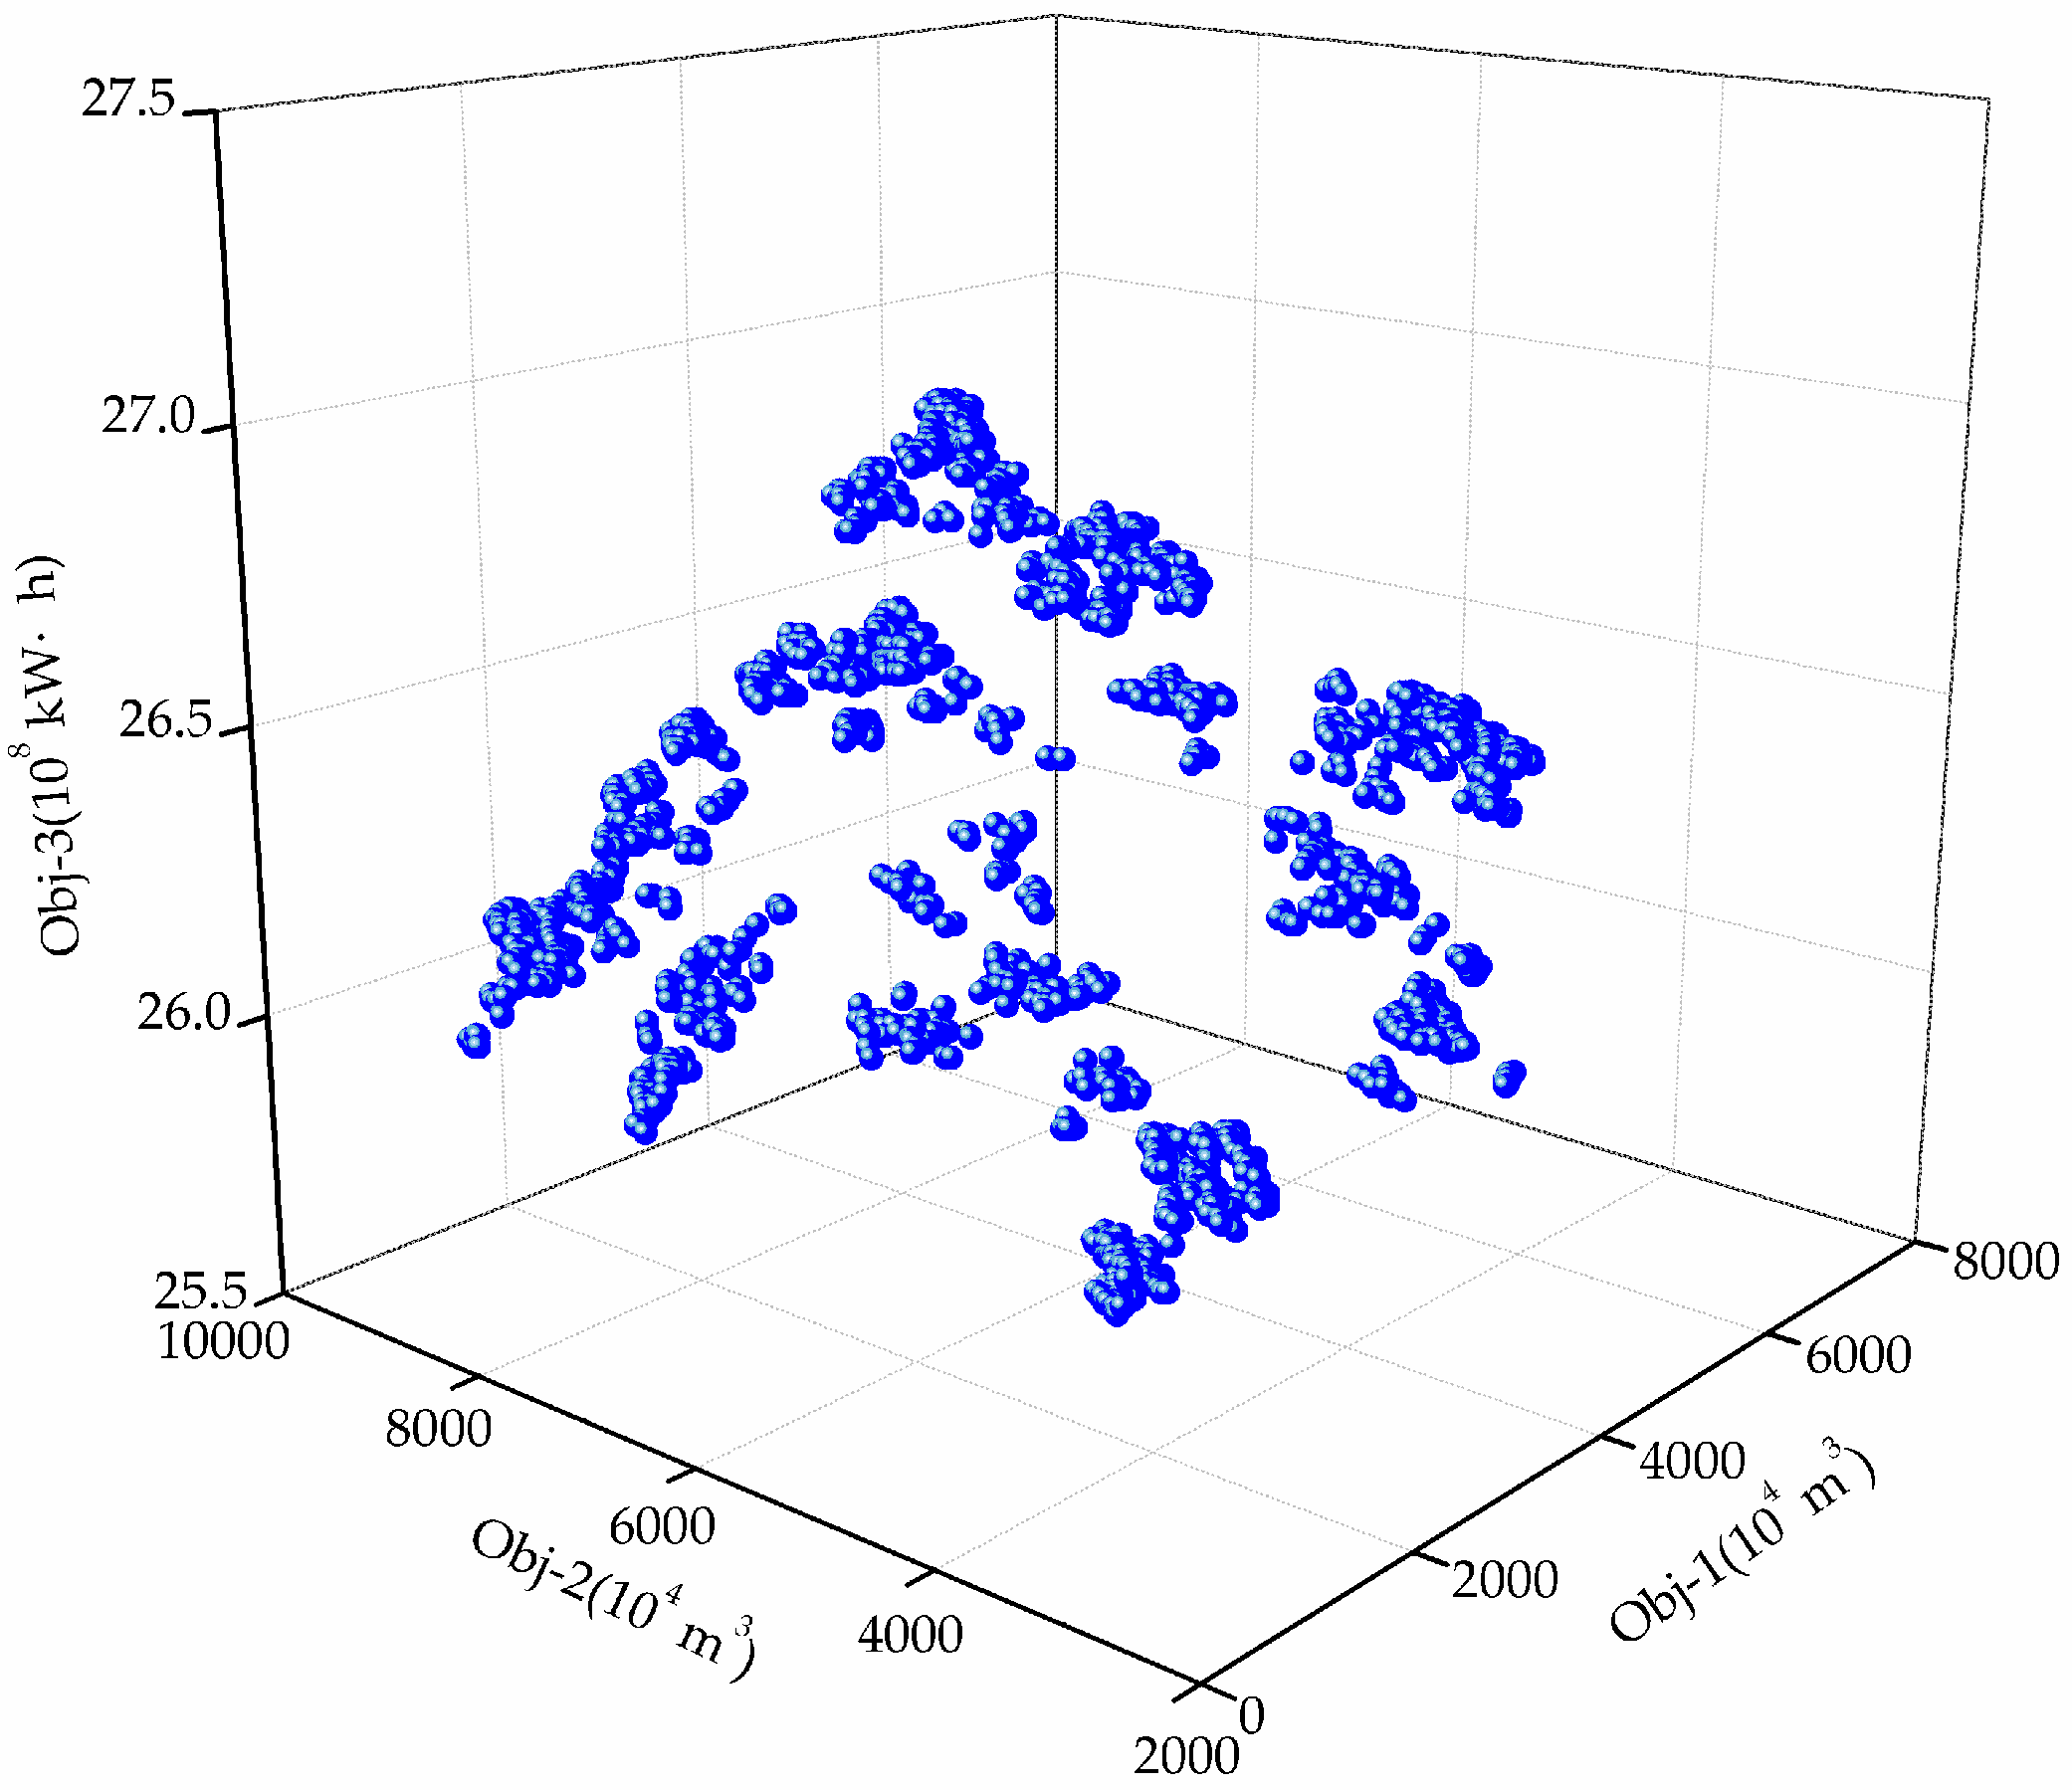
According to Table 1, the minimum and maximum annual average water shortage of irrigation are 925 × 104 m3 and 6595 × 104 m3; the minimum and maximum of the ecological water shortage are 3925 × 104 m3 and 9058 × 104 m3; and the minimum and maximum of the multi-year average power generation are 25.54 × 10⁸ kW·h and 26.99 × 10⁸ kW·h, respectively. The non-inferior solution set is plotted in one coordinate system and the Pareto surface maps of irrigation, ecology and power generation are obtained, as shown in Figure 3.
Intuitively, the three-dimensional spatial distribution and the surface shape of the multi-objective non-inferior solution are shown in Figure 3. The non-inferior solutions appear in clusters in the Pareto surface graph (Figure 3) and are distributed over a wide range. The results show that there is little difference among non-inferior solutions in the same cluster and the optimal scheduling results converge well near the clusters to which the non-inferior solution belongs. The algorithm itself retains the diversity of non-inferior solutions. As the basic regulating rules, the Obj-1 and Obj-2 are ‘the smaller the better’ and the Obj-3 is the larger the better. Hence, theoretically, the optimal solution for the scheme is ‘925 × 104 m3, 3925 × 104 m3, 26.99 × 10⁸ kW·h.’ However, the three objectives cannot reach the optimal solution of the sample theory at the same time—an indication of mutual restrictions and influences among the three objectives. The Pareto surface of the scheme is a smooth space surface oriented to the vector ± (−1, −1, 1) direction (the main vertical line of the surface is consistent with the direction of a vector, which is expressed as the surface oriented to the vector direction). It can be inferred that the set of non-inferior solutions is composed of the non-inferior solution, which is weighted by the equivalent distance from the optimal solution of the sample theory. Vector ± (−1, −1, 1) is the superior direction of non-inferior solutions, consistent with the direction of the non-inferior solutions set towards the optimal solution of the sample theory, while vector ± (1, 1, −1) is the inferior direction.
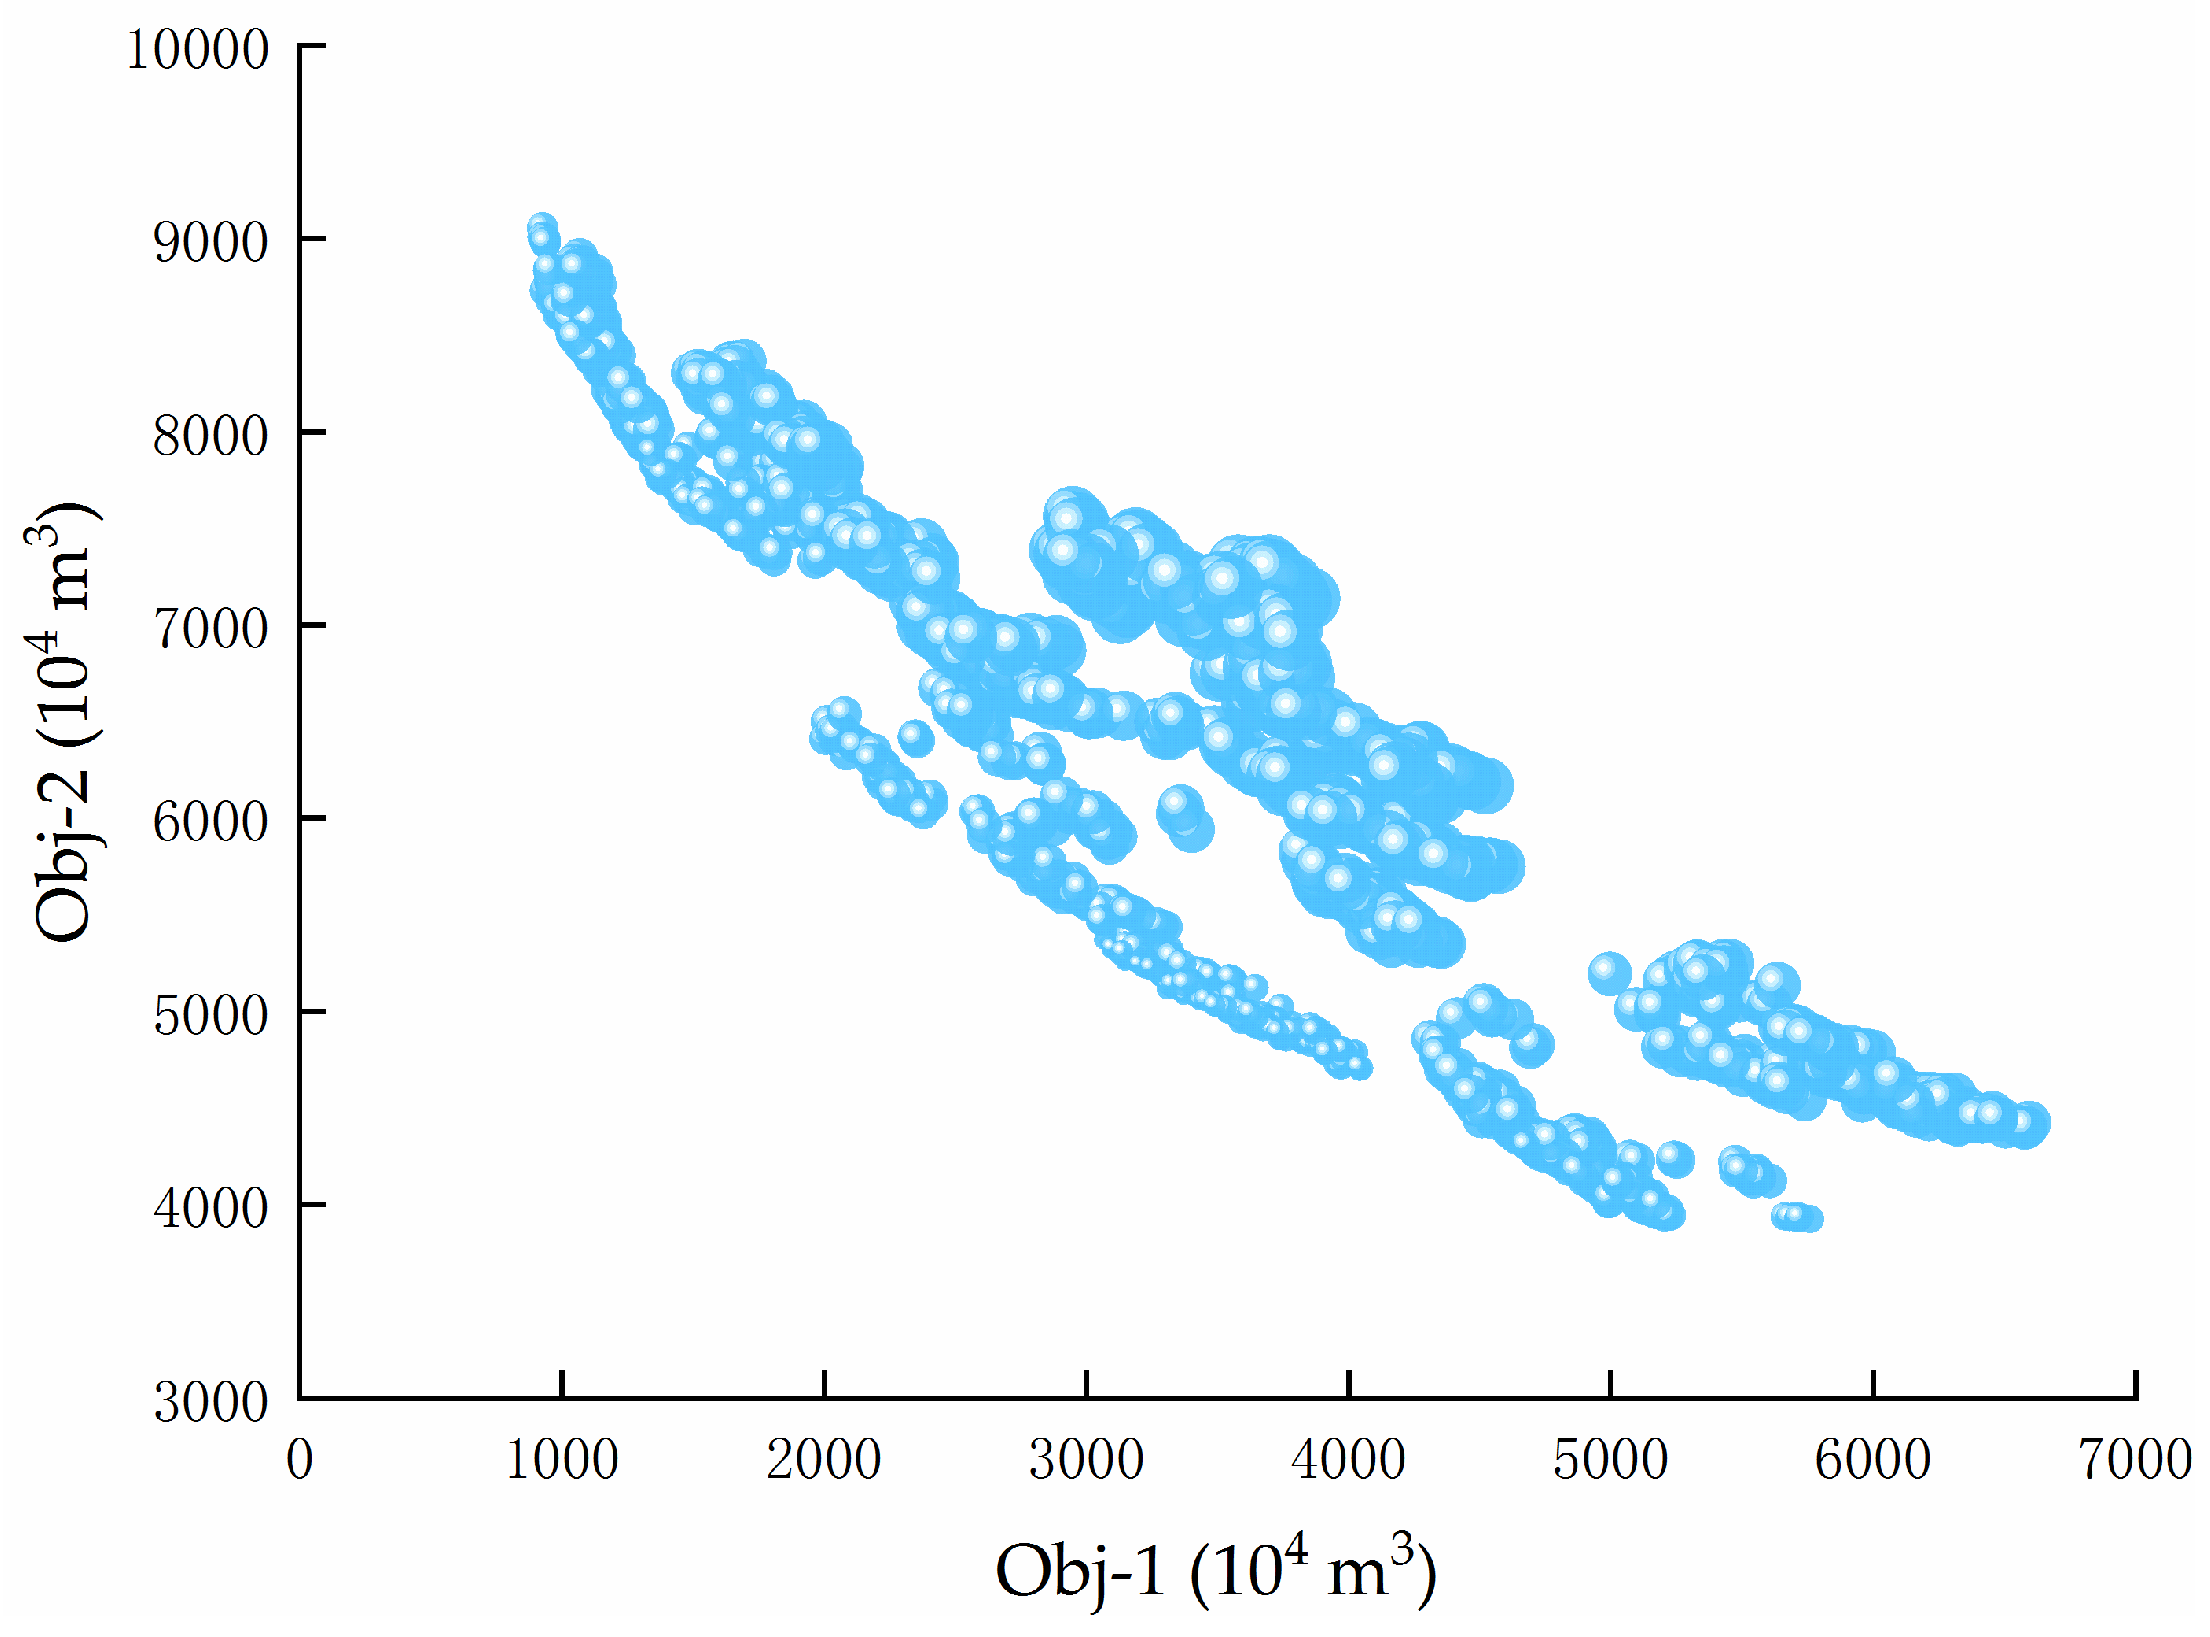
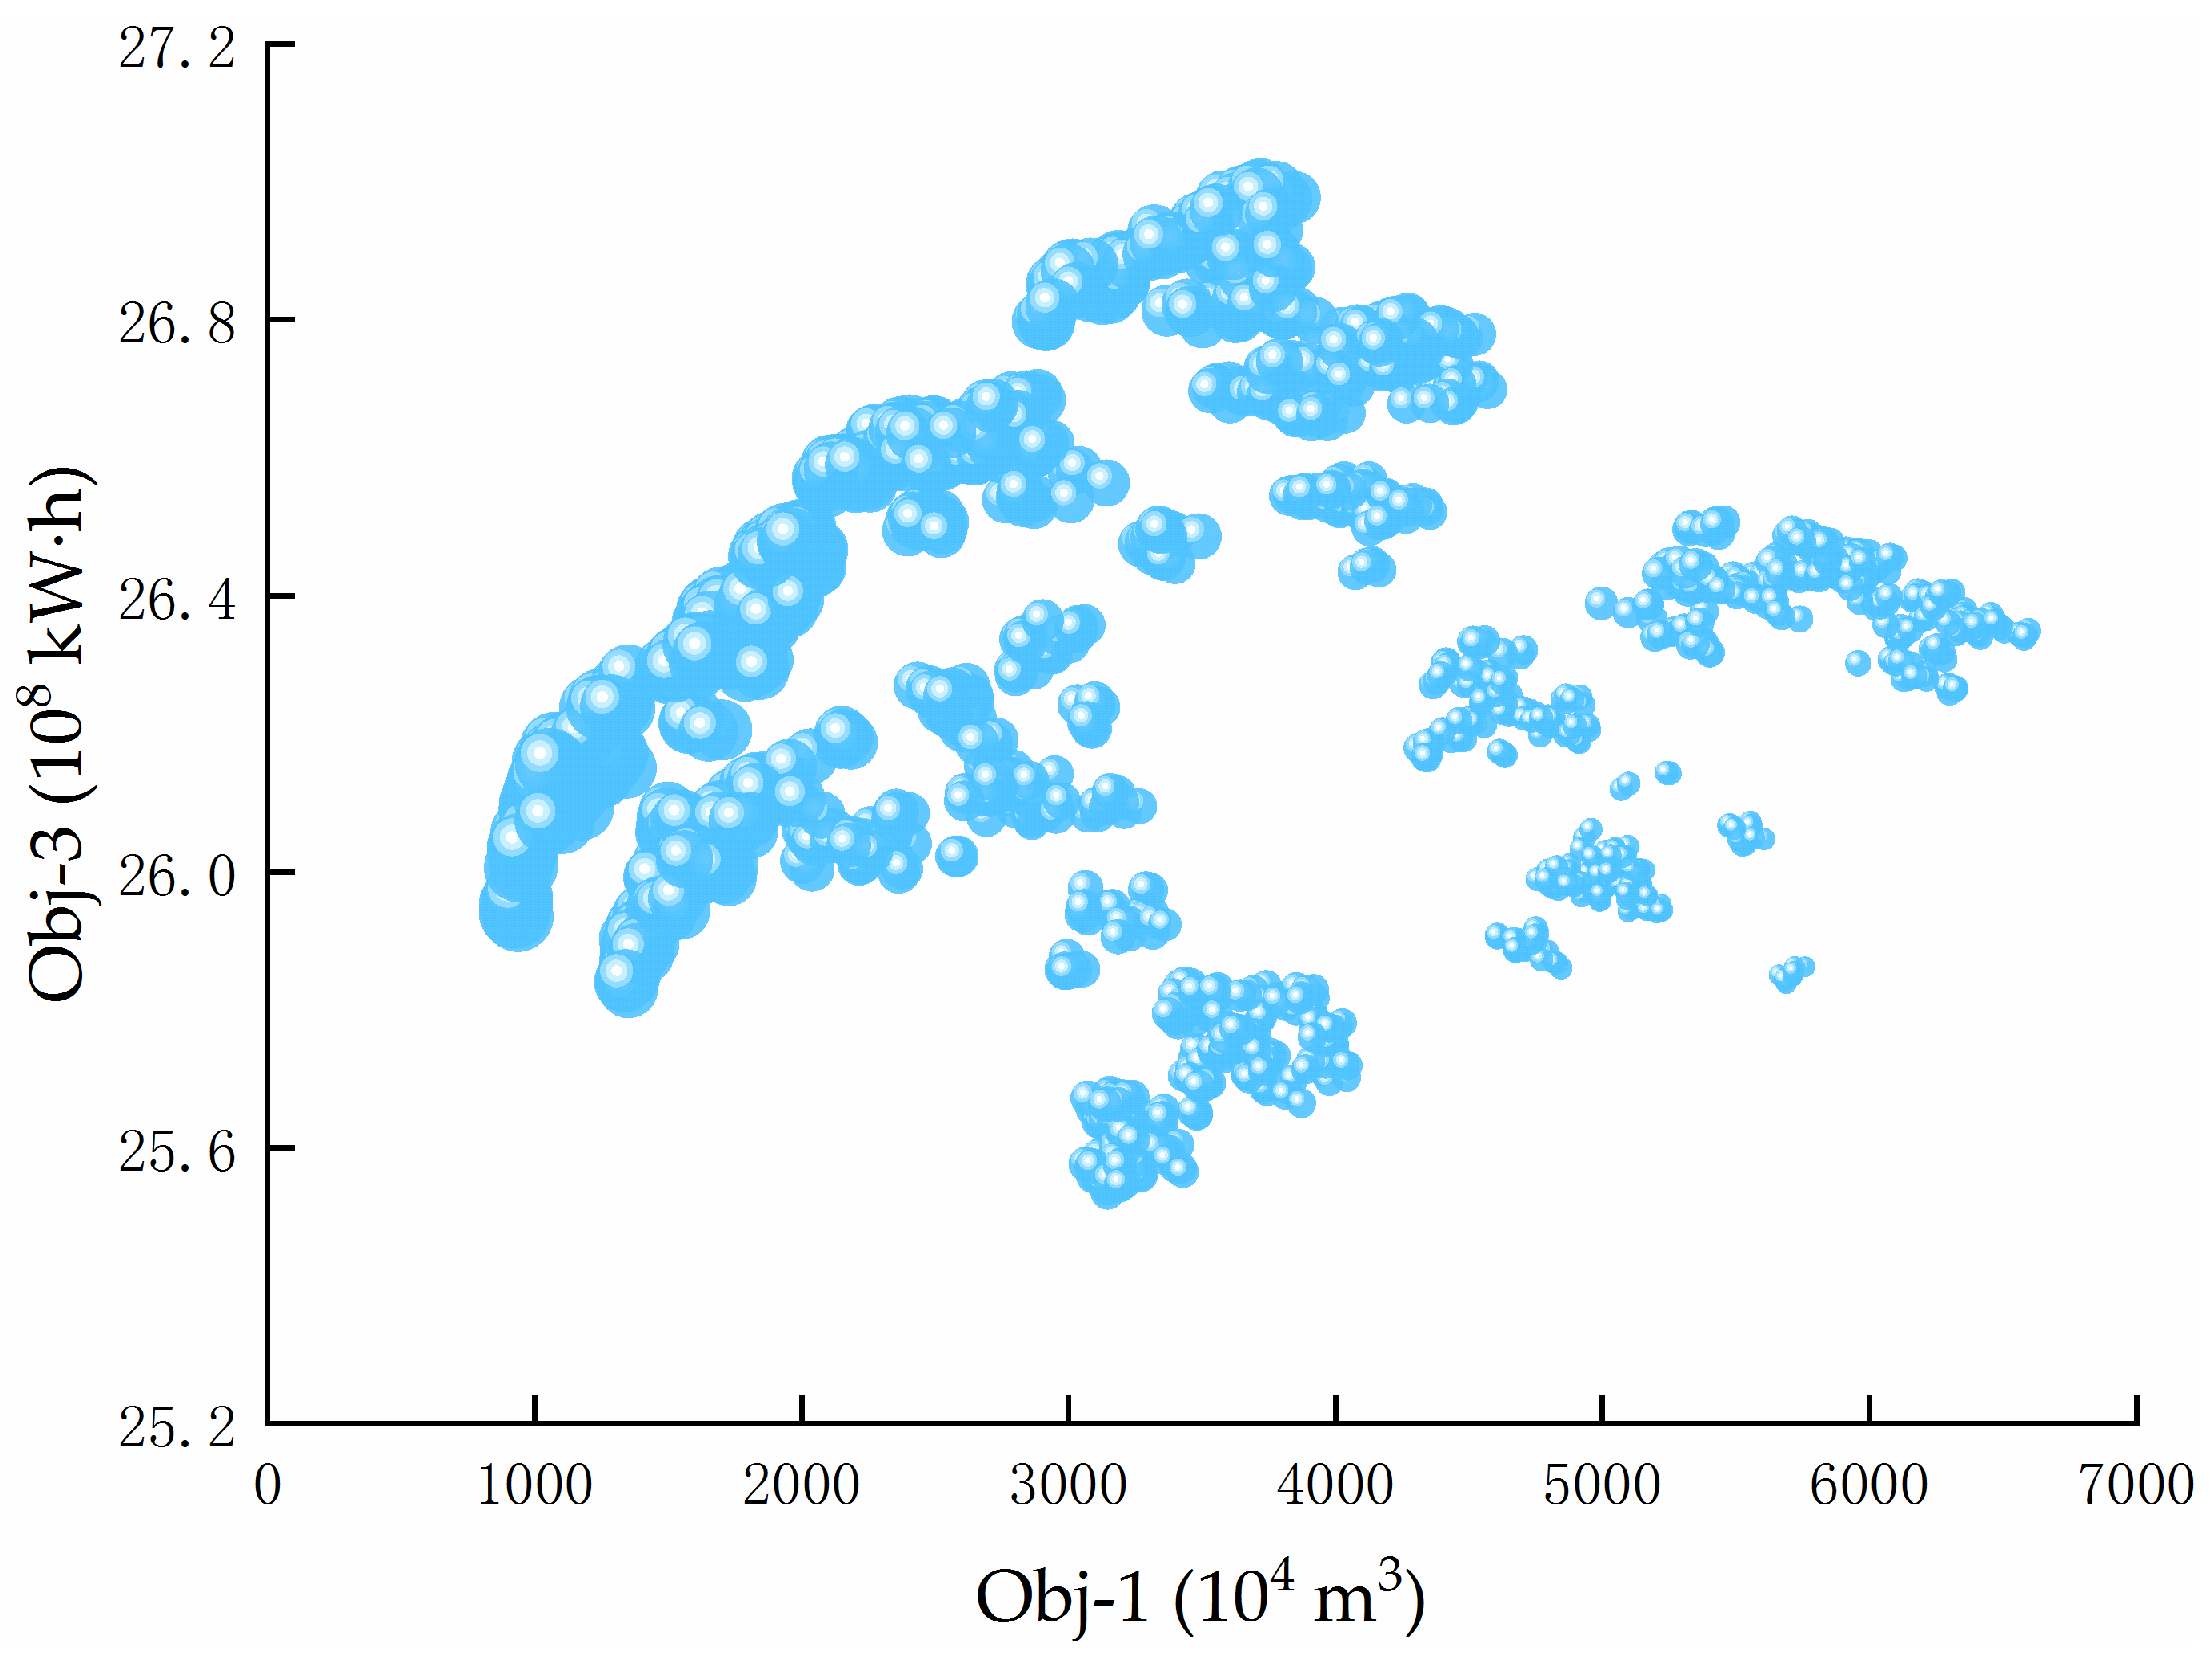
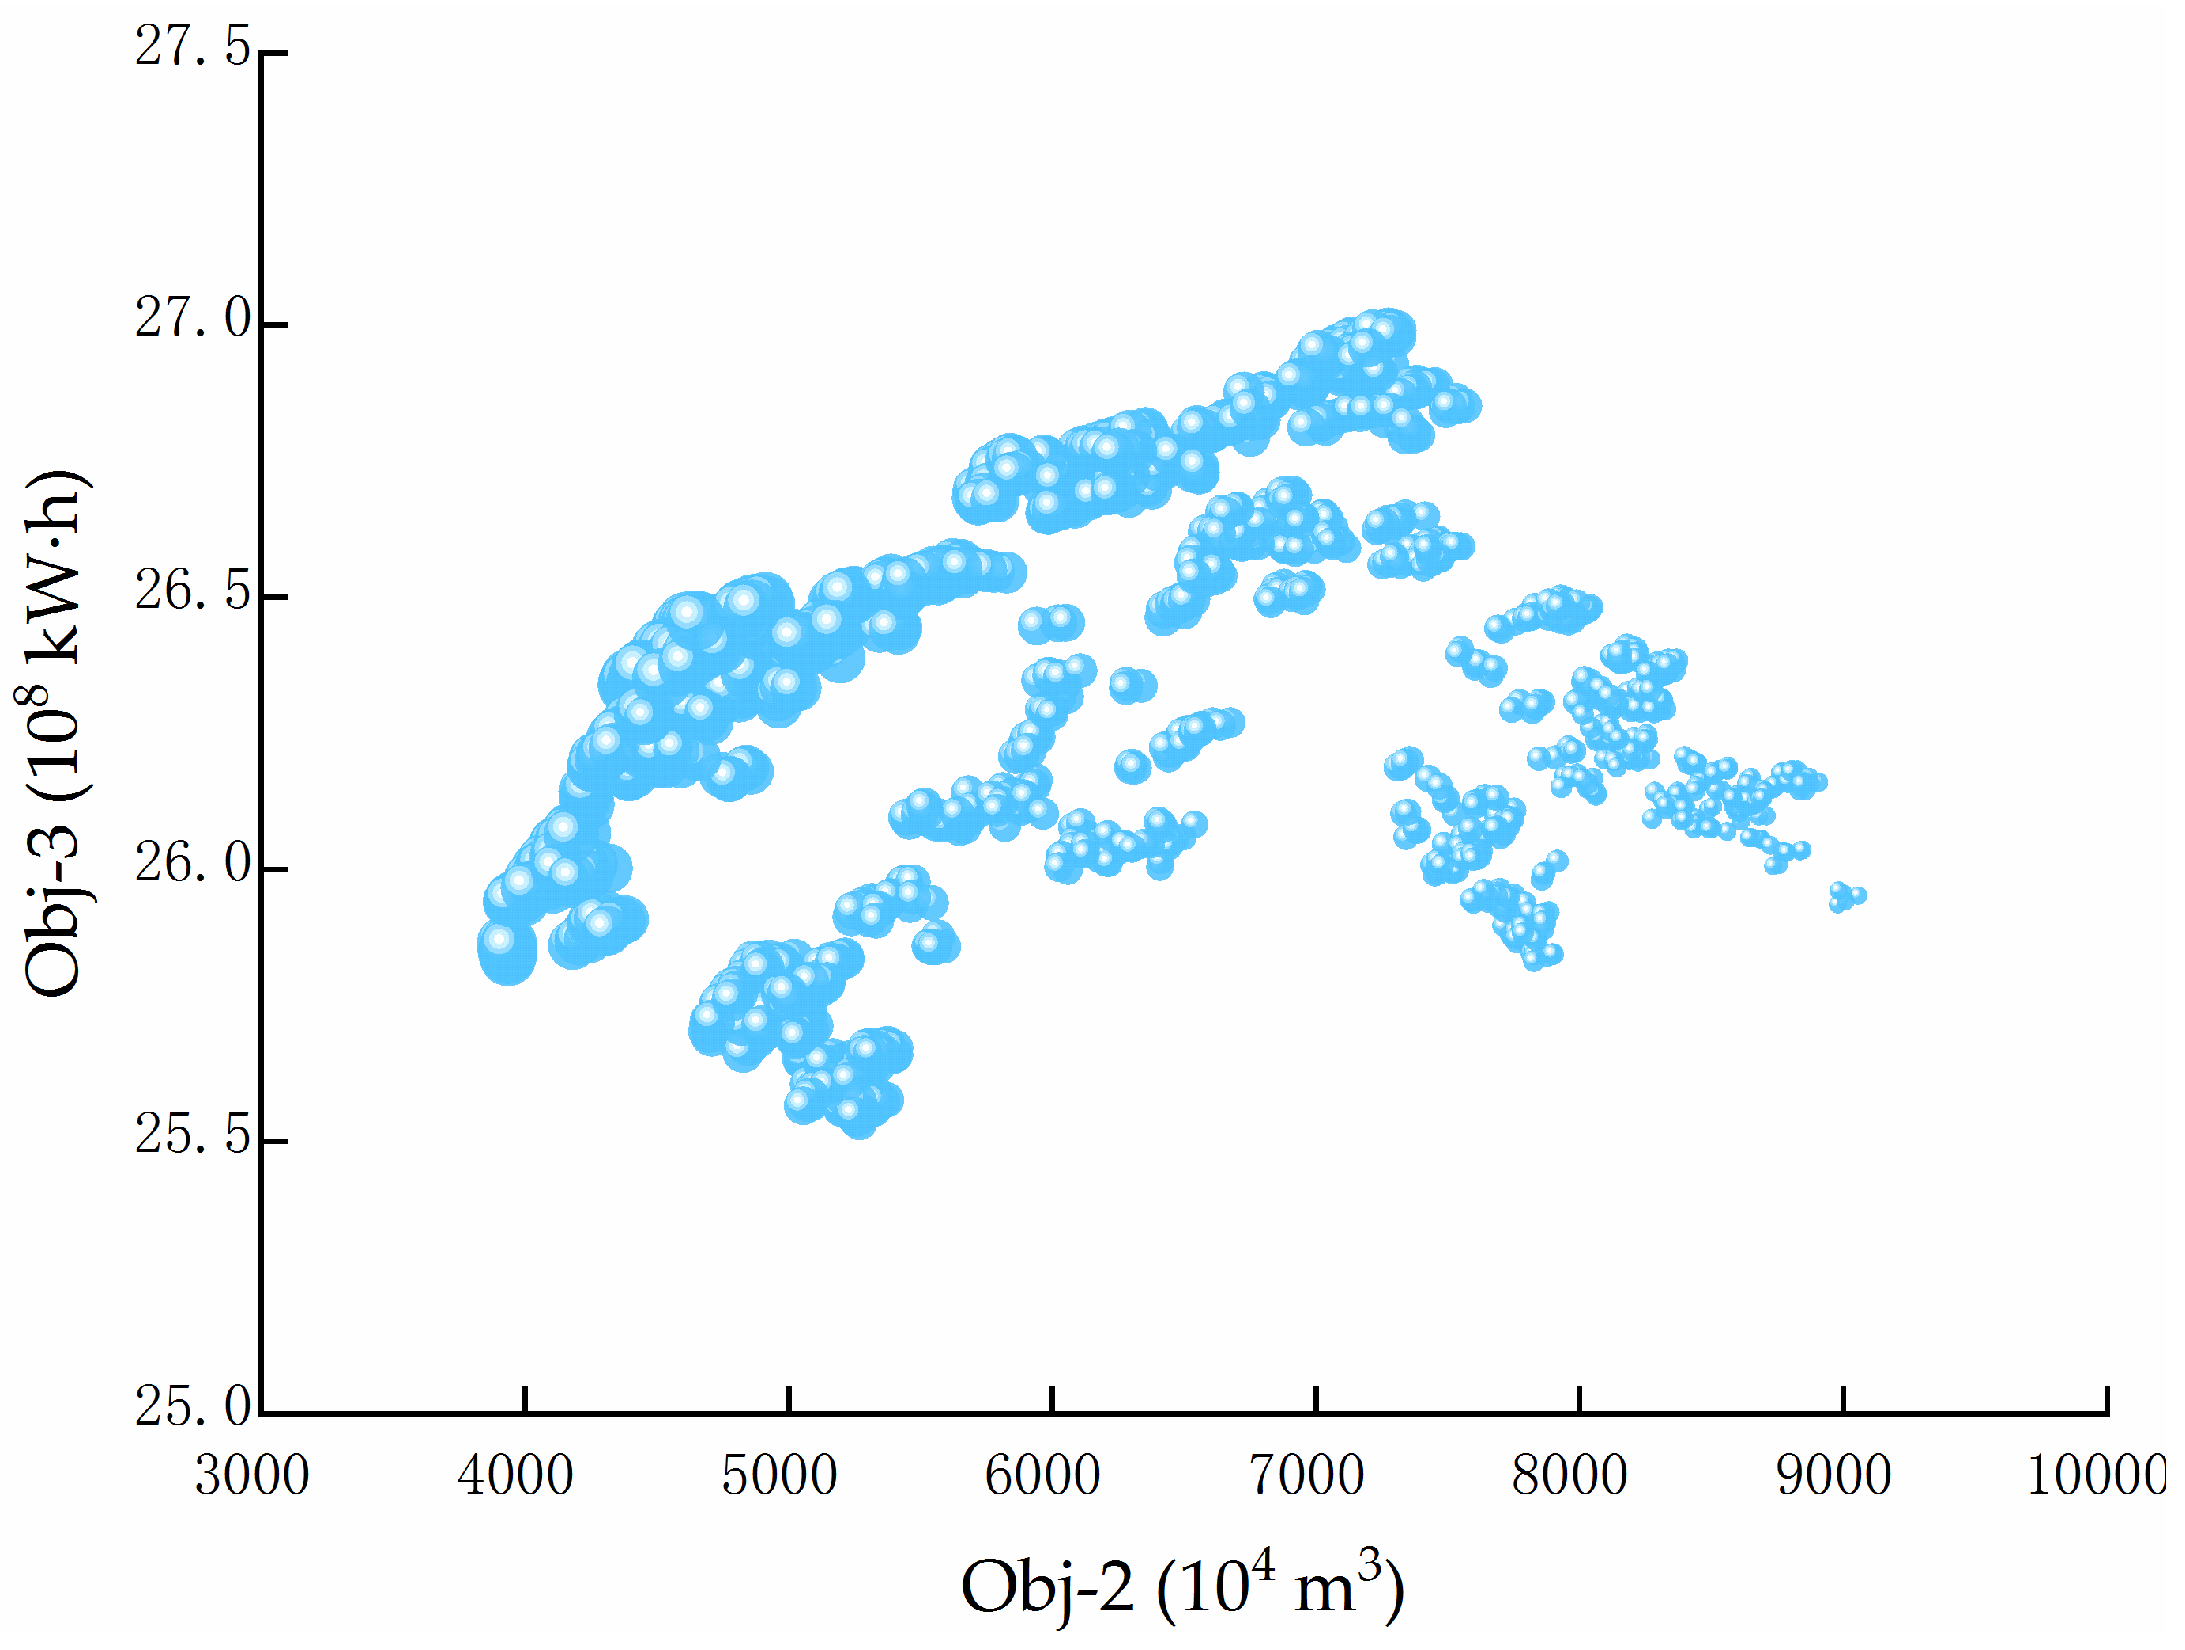
It is difficult to exhibit the mutual restriction among different objectives; therefore, the three-dimensional stereogram was converted into two-dimensional plane map [47] and three objectives are respectively described in terms of bubble size. The bigger the bubble, the better the objective. Thus, the multi-objective bubble diagram is generated and shown in Figure 4, Figure 5 and Figure 6.
The bubble diagram shows an approximate linear distribution with layers (Figure 4, Figure 5 and Figure 6). Taking the bubble graph of irrigation and ecology (Figure 4) as an example, the majority distribution of non-inferior solutions spreads wider. The stratification phenomenon and the wide distribution are supportive of the convergence and diversity of the optimal dispatching results. The approximate linear distribution indicates that there exists a distinct growth-decline phenomenon and a direct water competition relationship between the irrigation water shortage and the ecological water shortage. It is notable that the closer to the intersection of the two coordinate axes, the smaller the bubble; while the farther away from the intersection, the larger the bubble. Within the same layer, the bubble size is equivalent. According to the basic regulating rules, it is evident that the closer the equivalent weighted distance from the intersection, the better the non-inferior solution and the larger the air bubbles. The distribution of bubble size illustrates the competitive relationship between power generation with irrigation and ecological water, that is, the smaller the water shortage of irrigation and ecology, the less power generation capacity. The contrary indicates more power generation.
4.2. Analysis of Two-Objective Competition Mechanism
As a way of exploring the competition mechanism and quantitatively describe the transformation law among objectives, the Pareto frontier is fitted to obtain the quantitative transformation formula between any two objectives. According to the previous analysis, the three-objective Pareto solution set is fully optimized and most of the solutions are high-quality feasible solutions close to the optimum one. On the premise of sufficient optimization, there is a macro-rule of ‘one falls another rises.’ By sorting the normalized values of one objective and drawing two-dimensional scatter plots of the normalized indices of the other two, several solutions are intercepted using the normalized values from small to large. It can be found that these solutions are exactly the Pareto frontier of the other two objectives. In other words, when the normalized value of one objective is small (that is, the solution is inferior), then the other two targets show the strongest regularity and optimum. Additionally, the number of interception solutions for sorting targets depends on the coverage of the Pareto frontier of the other two targets.
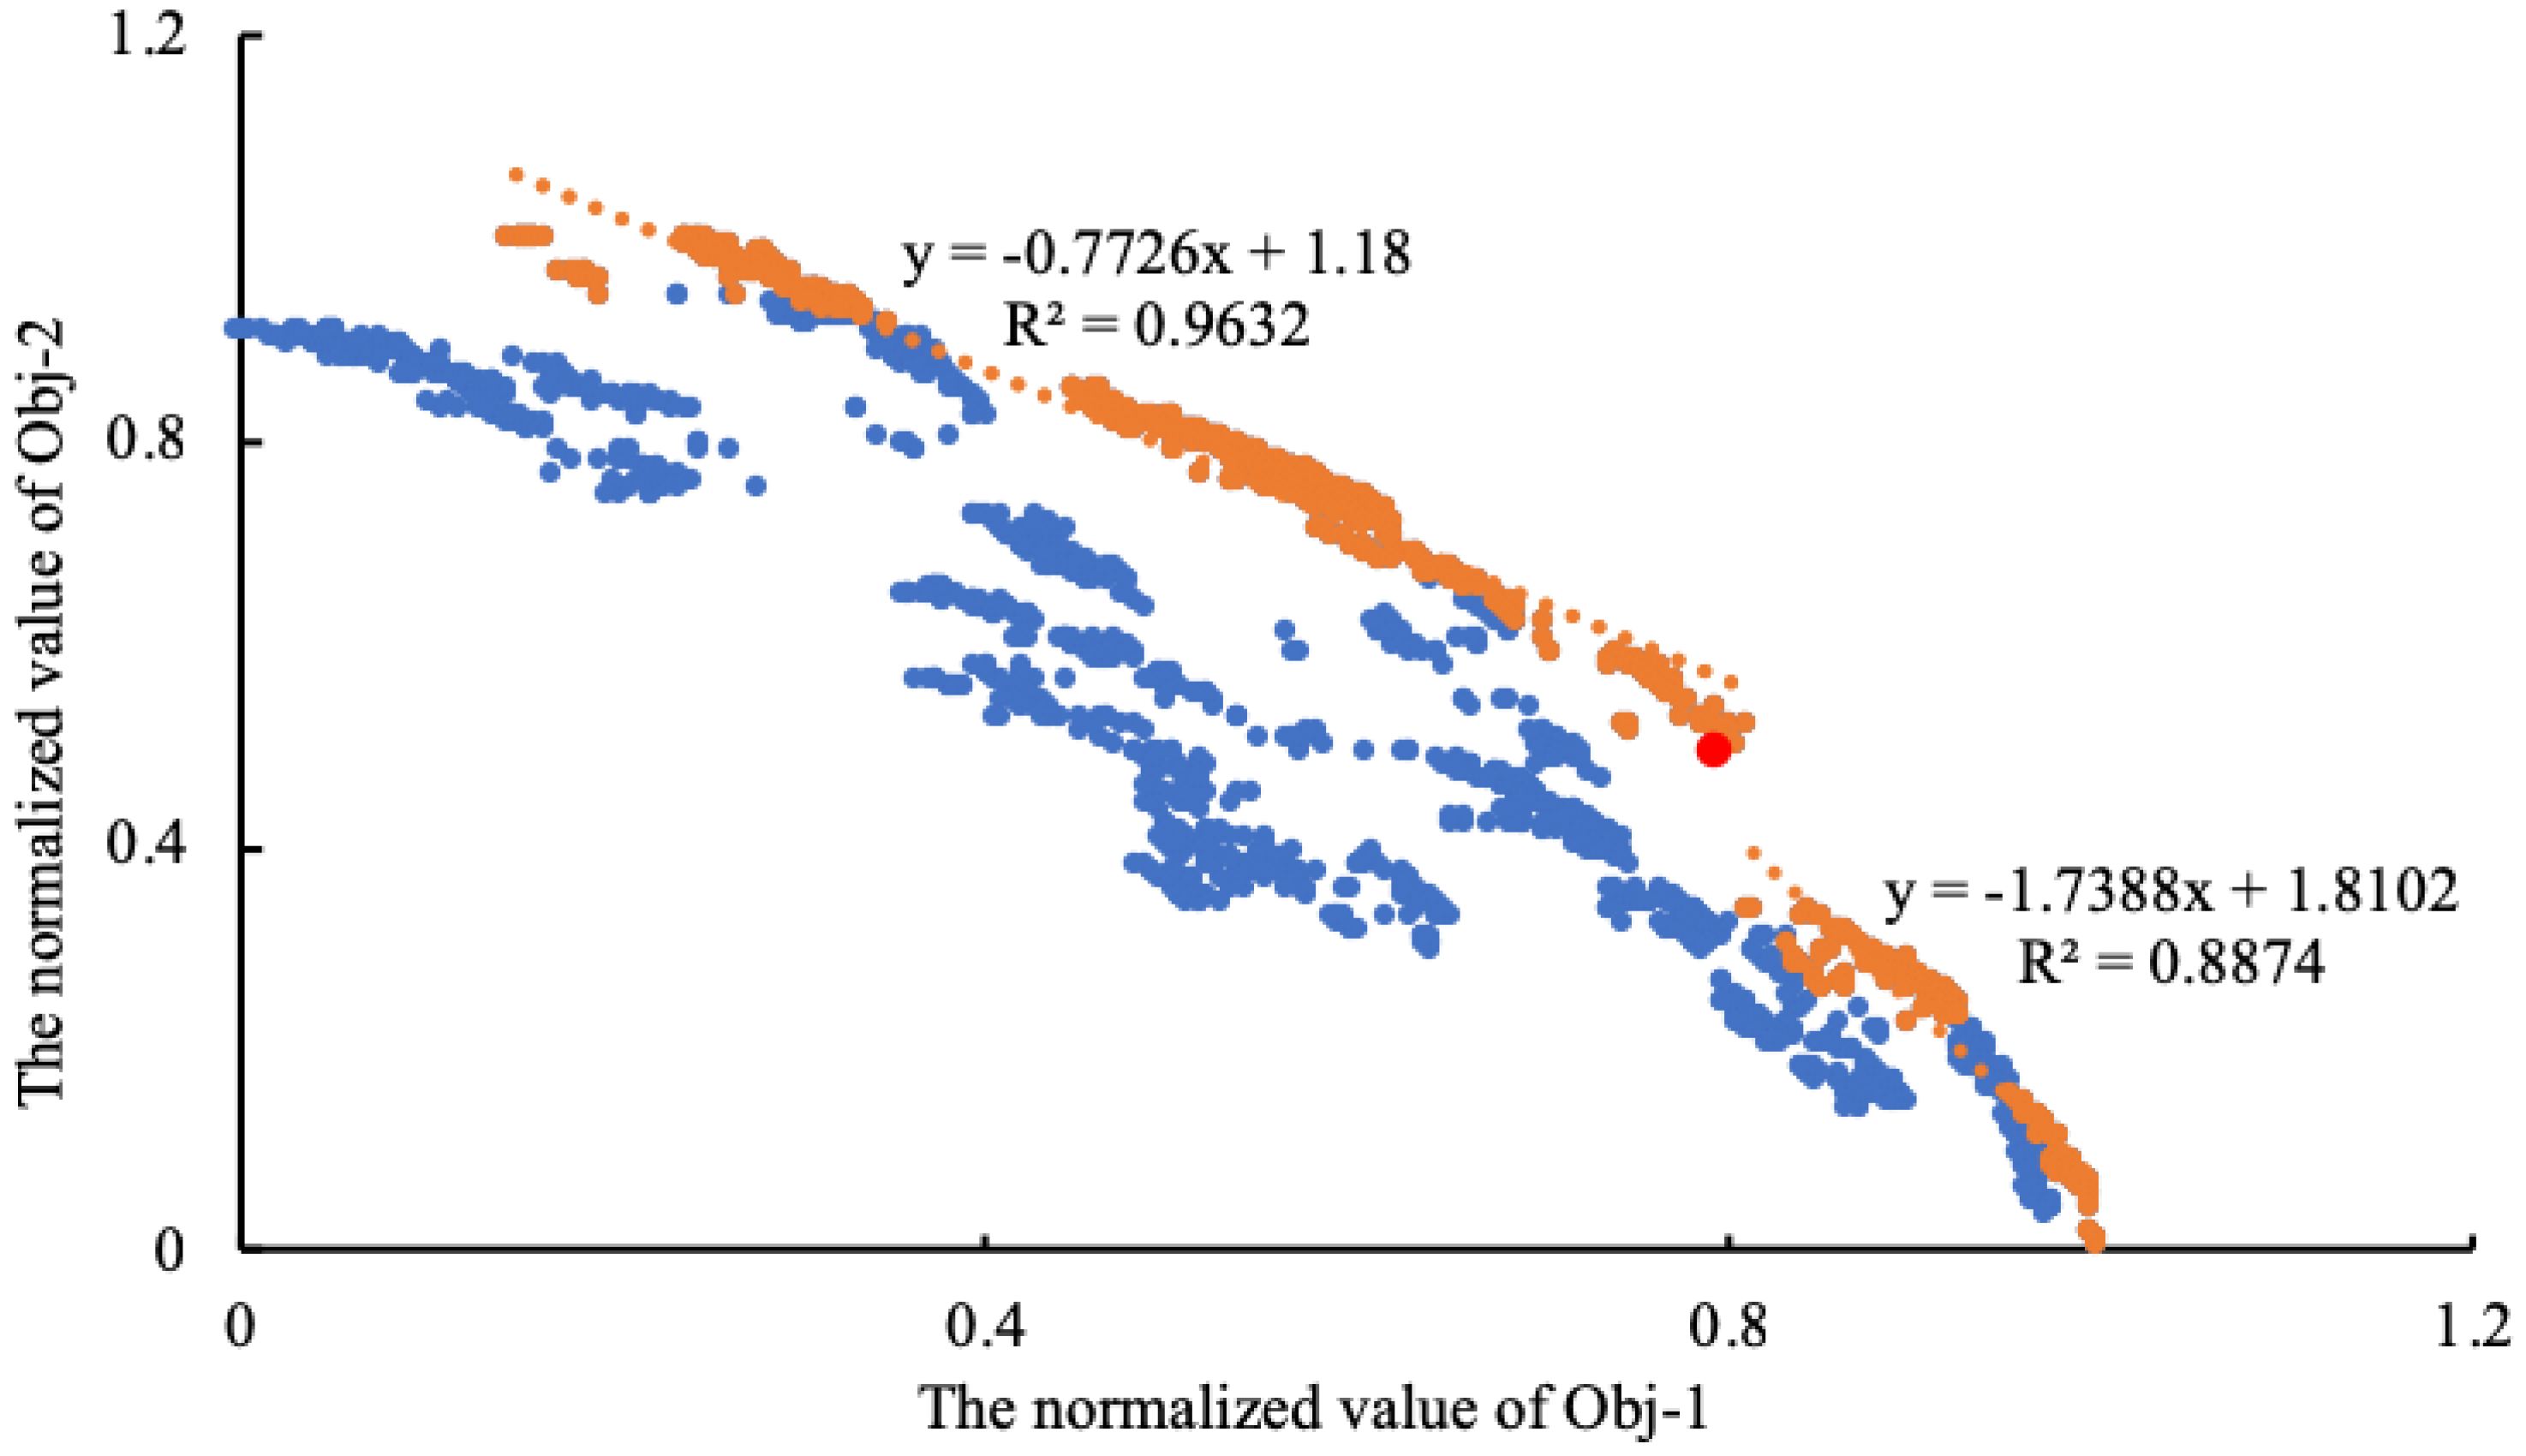
As shown in Figure 7, the two-dimensional scatter plots of Obj-1 and Obj-2 normalization indices, the non-inferior solutions are sorted in descending order according to the normalized value of Obj-3. After 700 solutions are intercepted, the Pareto frontier of Obj-1&2 is obtained as the orange points (Figure 7). A mutation point (0.7968, 0.4905) is found in the red dot (Figure 7).
The scatter plots are drawn by selecting two sequences before and after the mutation points in the Pareto frontier (Figure 7). Then, the piecewise linear function relationship of the two series is obtained, as shown in Figure 7. The correlation coefficients of the two series are 0.981 and 0.942, respectively.
From the above formula, it can be seen that both the slopes of the two piecewise functions are less than zero and the normalized values of Obj-1 and Obj-2 are inversely correlated.
In front of the mutation point, the independent variable fluctuates within the range of [0,0.7968] and the normalized value of Obj-2 decreases by 0.7726 for each increase of Obj-1. Following the mutation point, the range changes to [0.7968,1] and the normalized value of Obj-2 decreases by 1.7388 for each increase of Obj-1. Converting to their own respective target values of the scheme, when the independent variable is between 925~2078 × 104 m3, the average annual ecological water shortage will increase by 9.0553 × 10⁴ m3 for each reduction of 1 × 10⁴ m3 of the average annual irrigation water shortage. Yet, when the independent variable is between 2078~6595 × 104 m3, the average annual ecological water shortage will increase by 0.6825 × 10⁴ m3 for each reduction of 1 × 10⁴ m3 of the average annual irrigation water shortage. Conclusively, in the interval where the irrigation water shortage is large, the increase of the ecological water shortage is slow while reducing the irrigation water shortage. In the interval where the irrigation water shortage is small, continuing to reduce the irrigation water shortage will lead to a significant increase in the ecological water shortage.
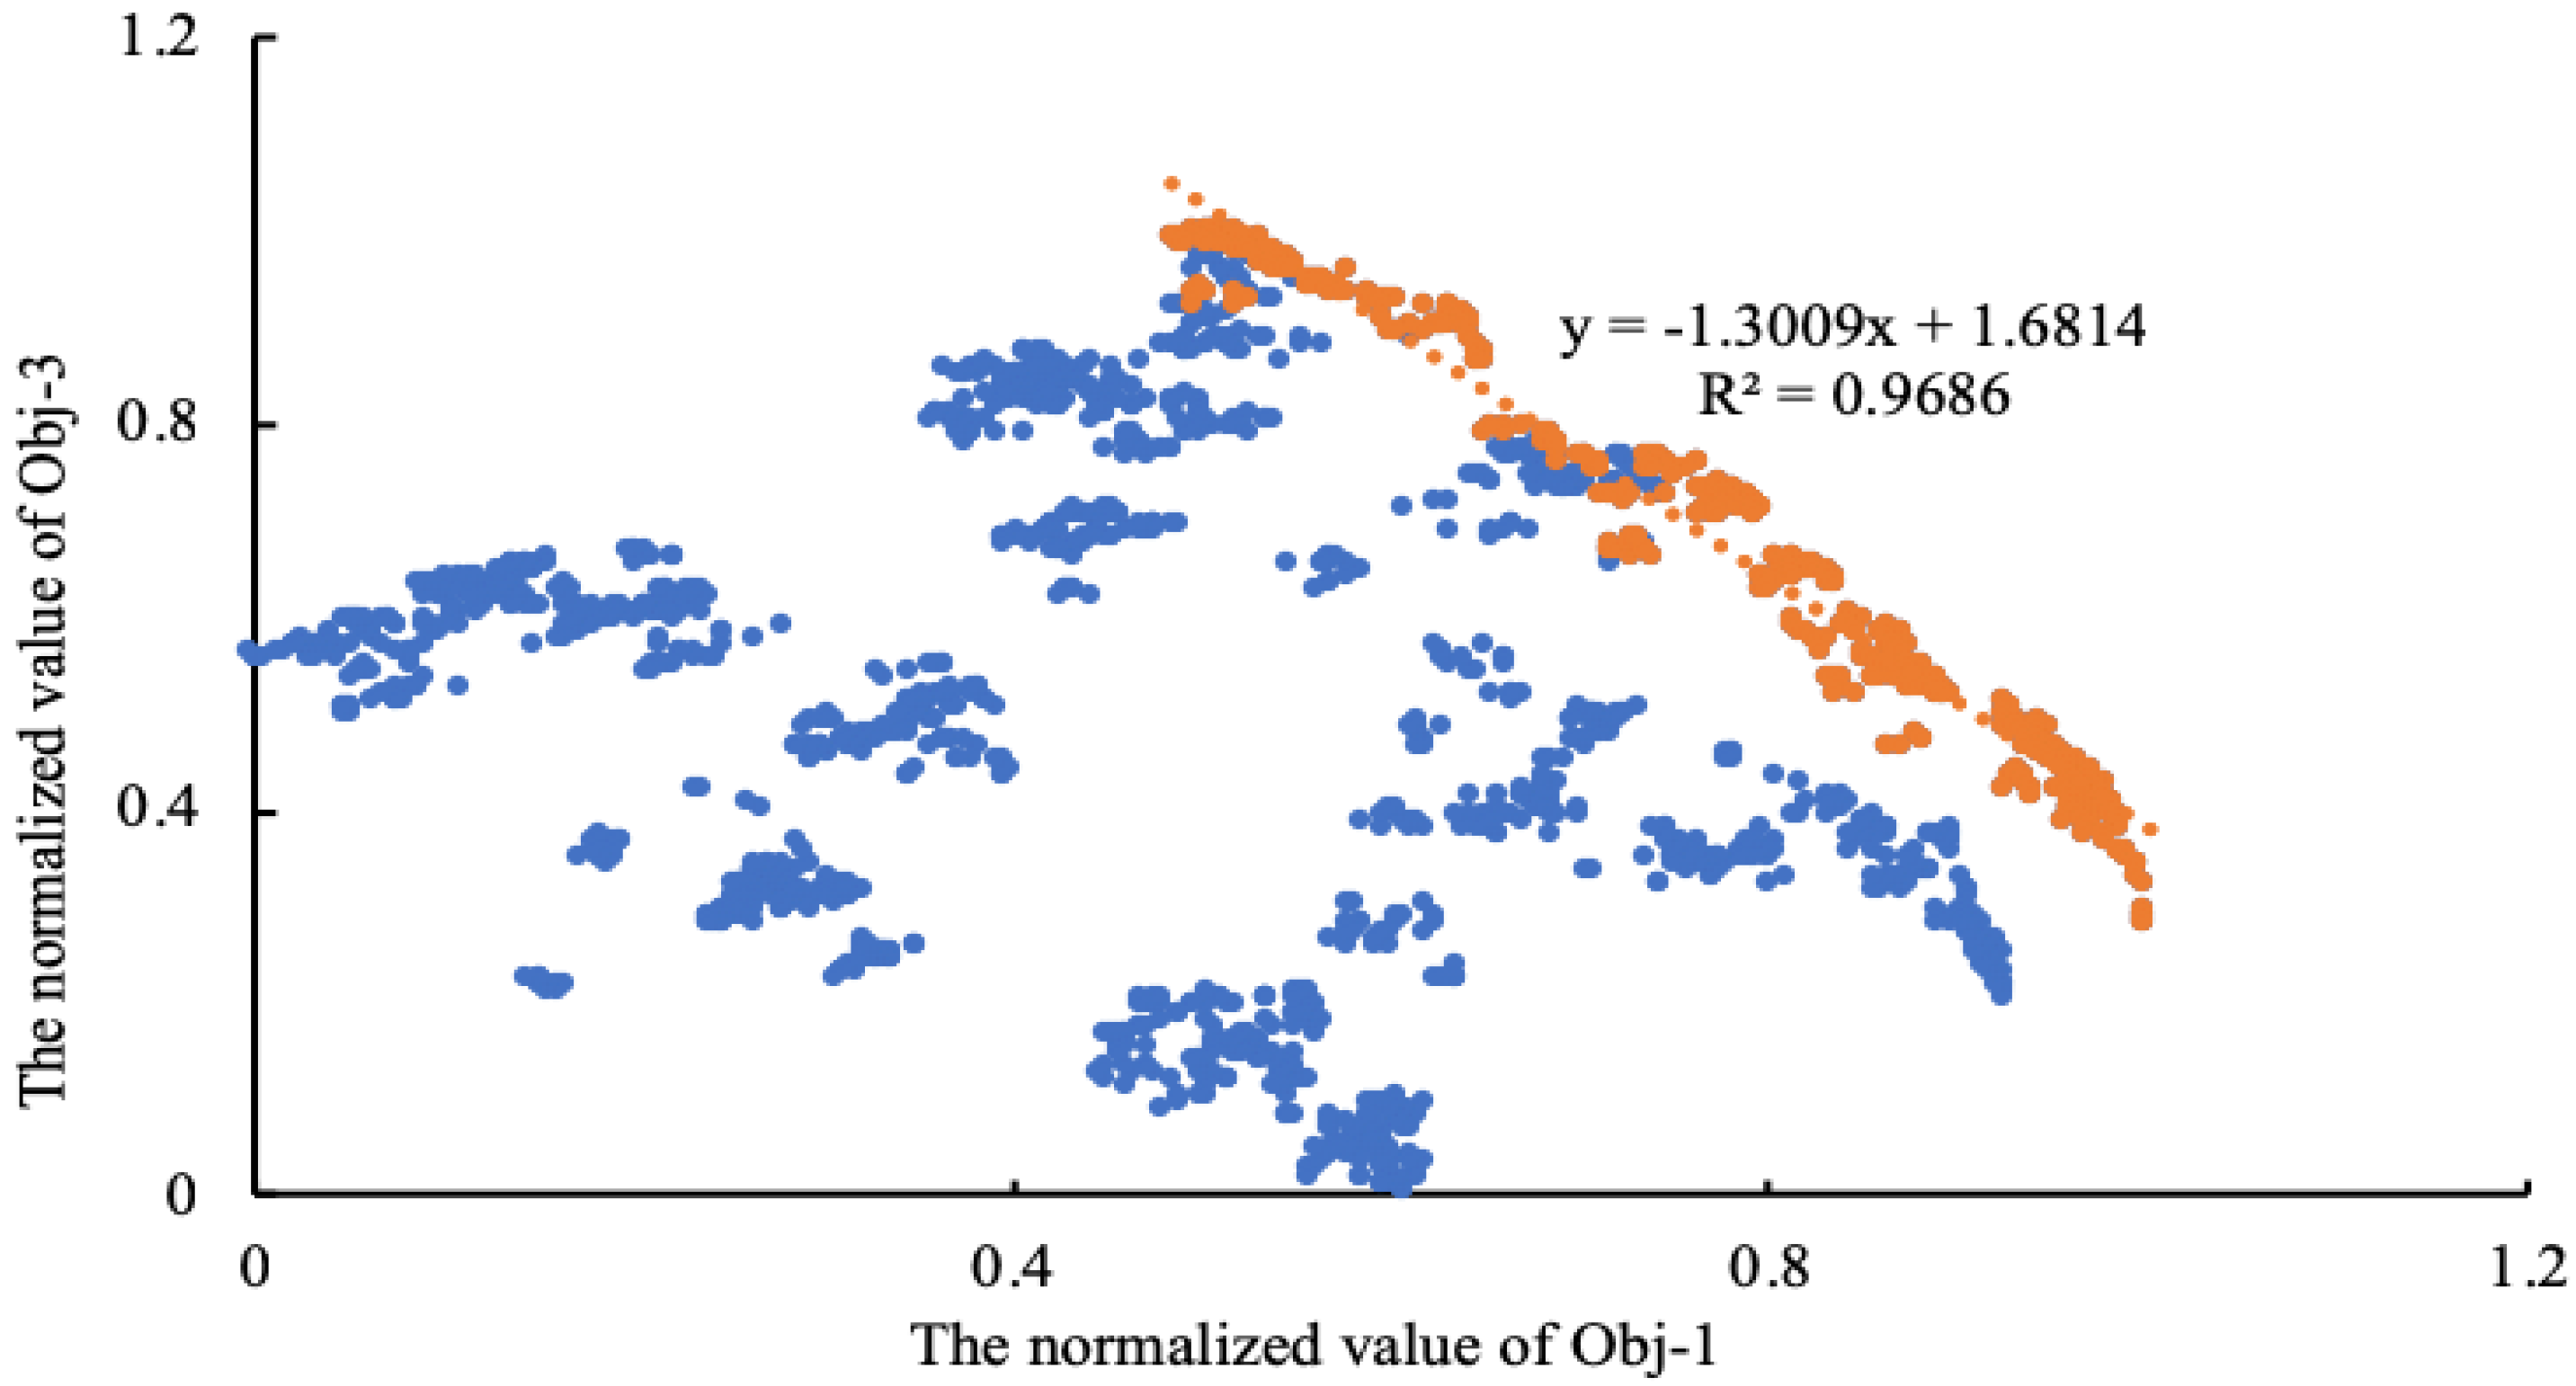
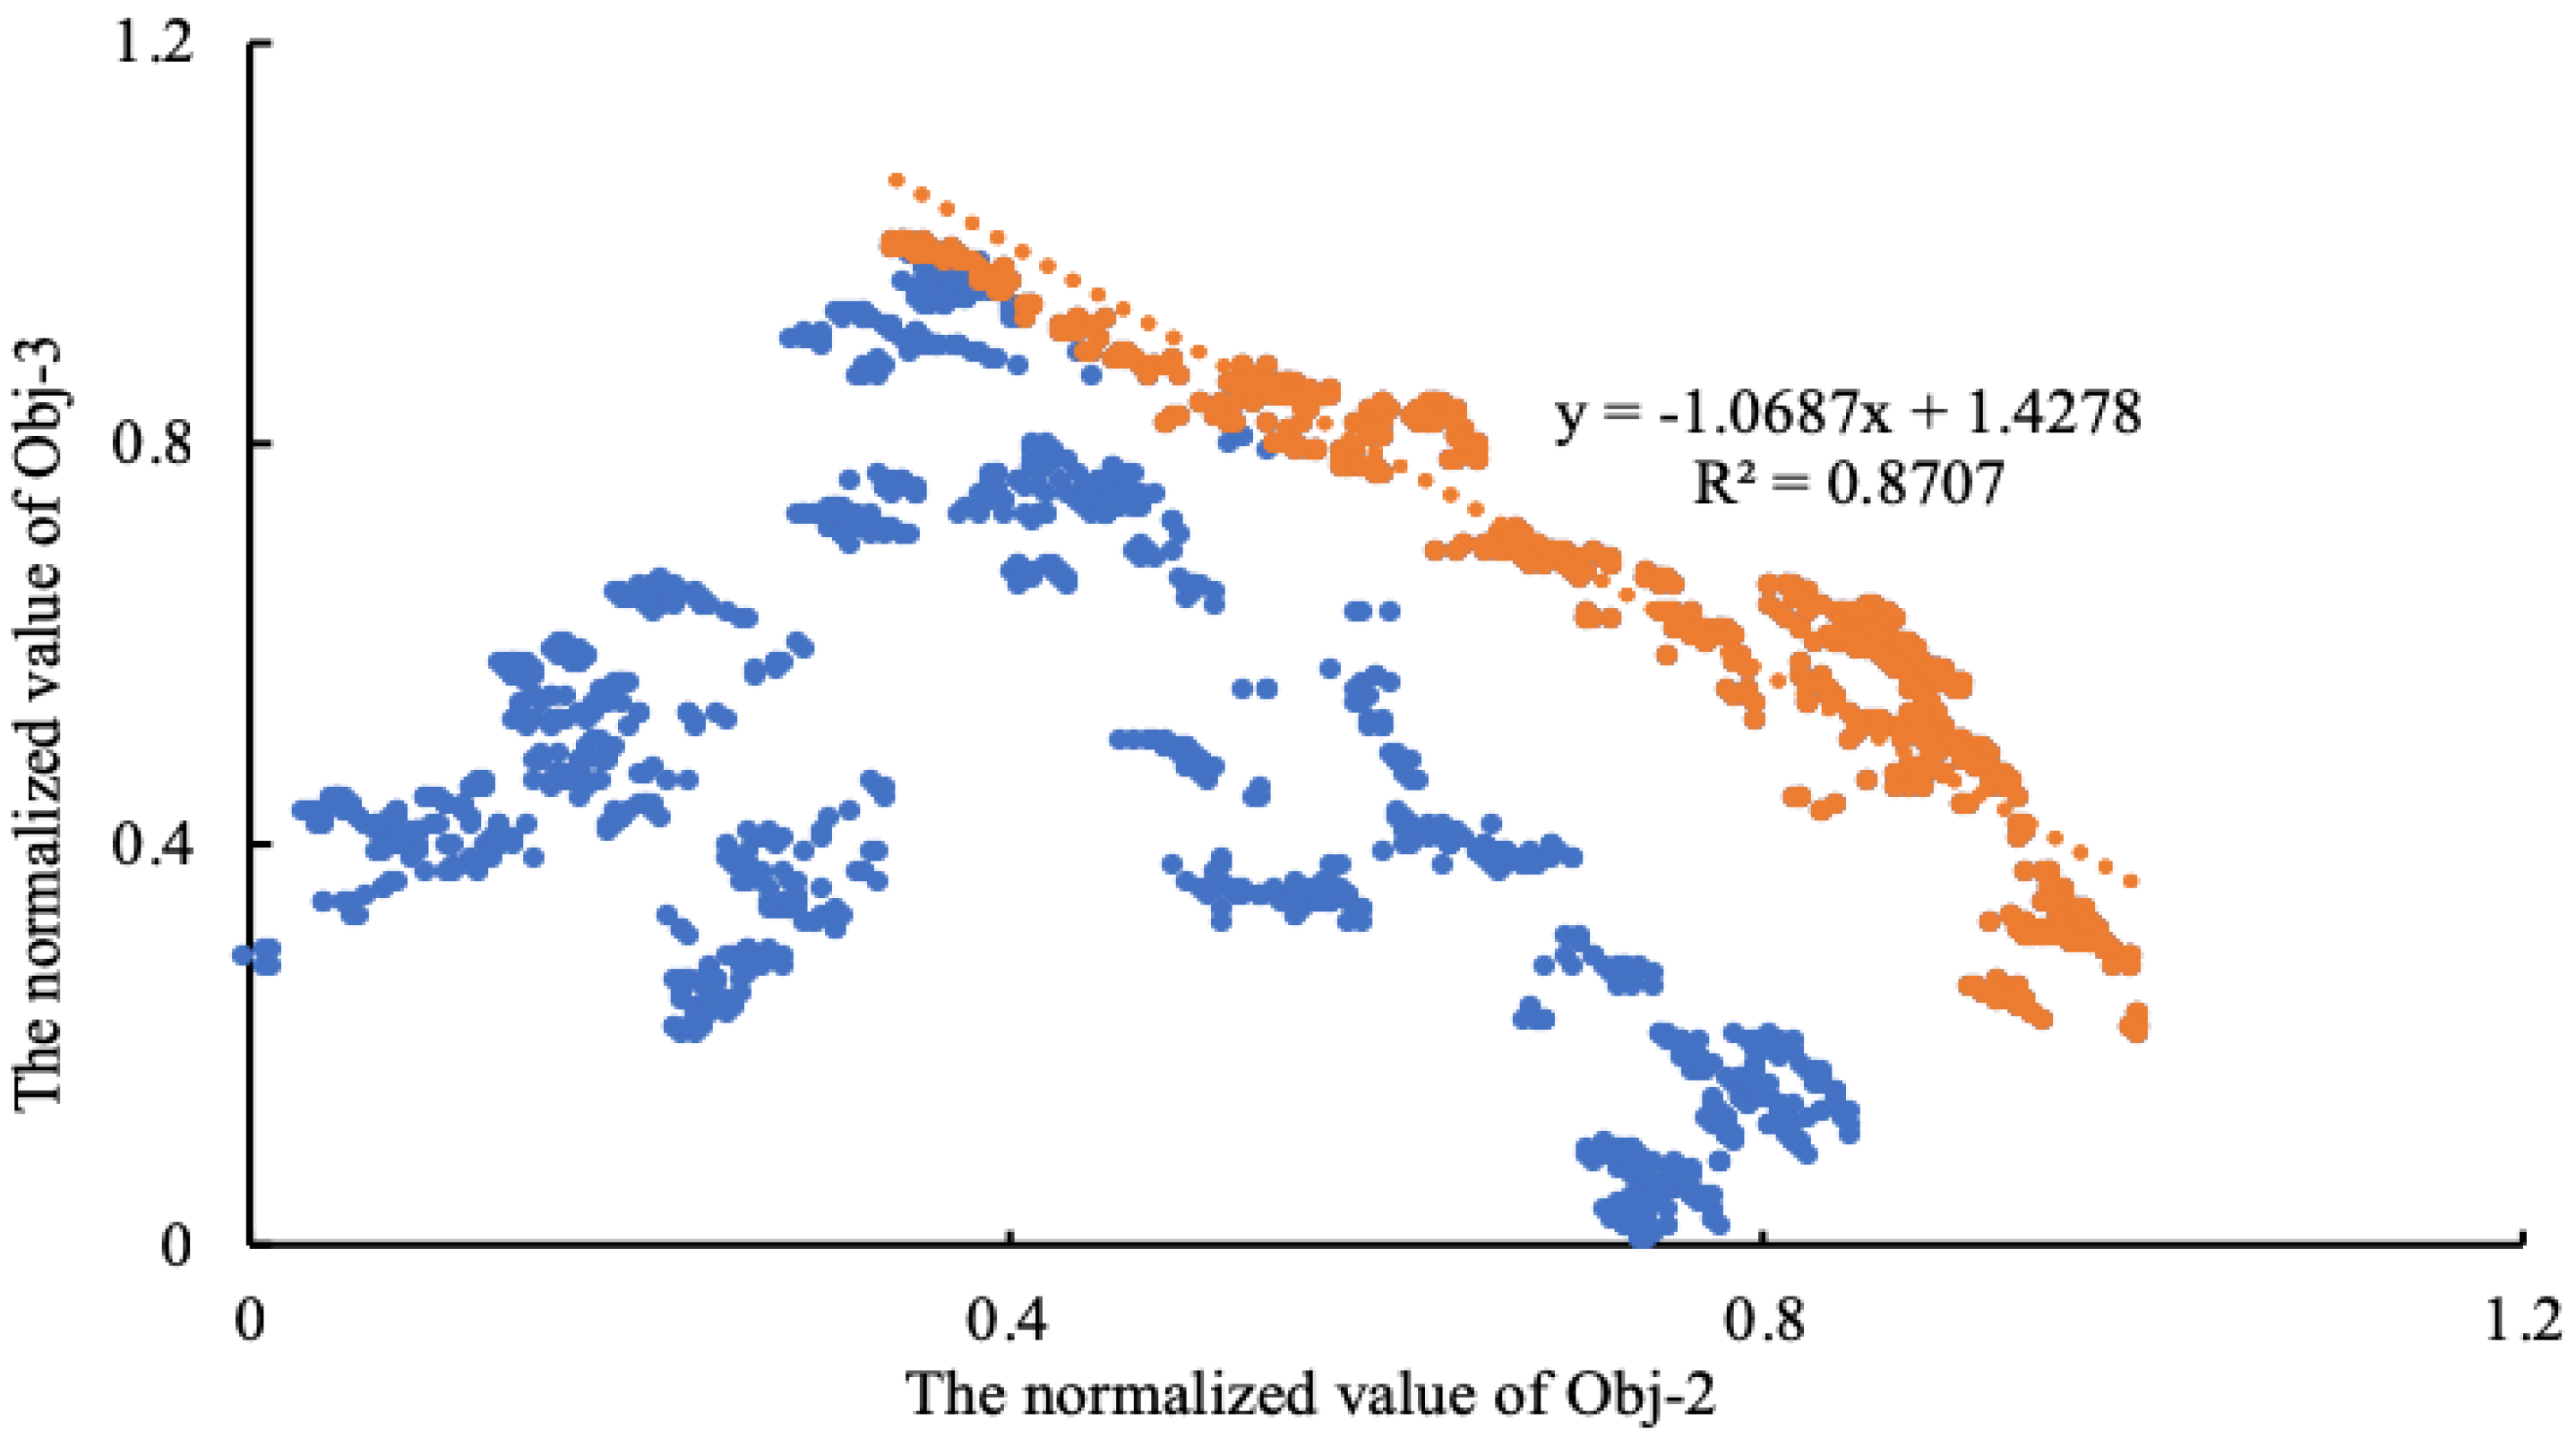
The two-dimensional scatter plot of the normalized indices of ’Obj-1 and Obj-3’ and ‘Obj-2 and Obj-3’ is shown in Figure 8 and Figure 9 in the way similar to Figure 7, with correlation coefficients of 0.984 and 0.933, respectively.
From Figure 8, it can be seen that the slope of the trend line is negative and the normalized values of Obj-1 and Obj-3 are inversely correlated. The normalized value of Obj-3 decreases by 1.3009 units for each additional unit of Obj-1 normalized value. An indication is that for each reduction of the average annual irrigation water shortage by 100 × 104 m3, the average annual power generation decreases by 0.03349 × 10⁸ kW·h. The average annual irrigation water shortage is positively correlated with the average annual power generation.
From Figure 9, the slope is also negative and the normalized values of Obj-2 are inversely correlated with Obj-3. The normalized value of Obj-3 decreases by 1.0687 units for each additional unit of Obj-2 normalized value. The inference of the results is that: for each reduction of the average annual ecological water shortage by 100 × 104 m3, the average annual power generation decreases by 0.03443 × 10⁸ kW·h. There is a positive correlation between the average annual irrigation water shortage and the average annual power generation.
4.3. Analysis of Three-Objective Competition Mechanism
Considering that the objectives of the Heihe River Basin are integrally and mutually restrictive, it is virtually impossible to reveal the law of the whole water resources system only by studying the relationship between the two objectives. This section synthesizes the sequence values of any two targets into a new sequence that represent the characteristics and information of two sub-sequences and analyses impact of the change of one target on the whole of the other targets in the Heihe River Basin. Through these analyses, the competition mechanism among the three objectives is explored.
Dependence between hydrological series is the premise of constructing the joint distribution using multivariate copula. The previous study indicates that the correlation coefficient between any two objectives is within 0.933~0.984. Such a high correlation supports the construction of the joint copula function of two variables.
The marginal distribution of each target is constructed with the non-parametric method of Gringorten and the empirical frequency estimates of each target sequence are obtained. The maximum likelihood method is used to get the parameter estimates of five joint copula functions between the two target sequence values and the corresponding cumulative distribution function values are calculated. The goodness of fit of five copula functions is evaluated with the AIC method which are best matching with existing hydrological sequences. The AIC evaluation indices of five combined copula functions under different objective combinations are obtained as shown in Table 2.
According to the AIC information criterion, the smaller the value of AIC evaluation index, the better the fit of representative copula function. As can be seen from Table 2 above, the minimum AIC evaluation index of Obj-1&2 is −16,437.86 with the Student Copula function. Similarly, the minimum in Obj-1&3 and Obj-2&3 are −10,671.15 (Gaussian Copula) and −11,292.73 (Frank Copula) respectively. As a result, the three two-variable-copula functions are selected as the optimal bivariate copula joint distribution for combining sequences.
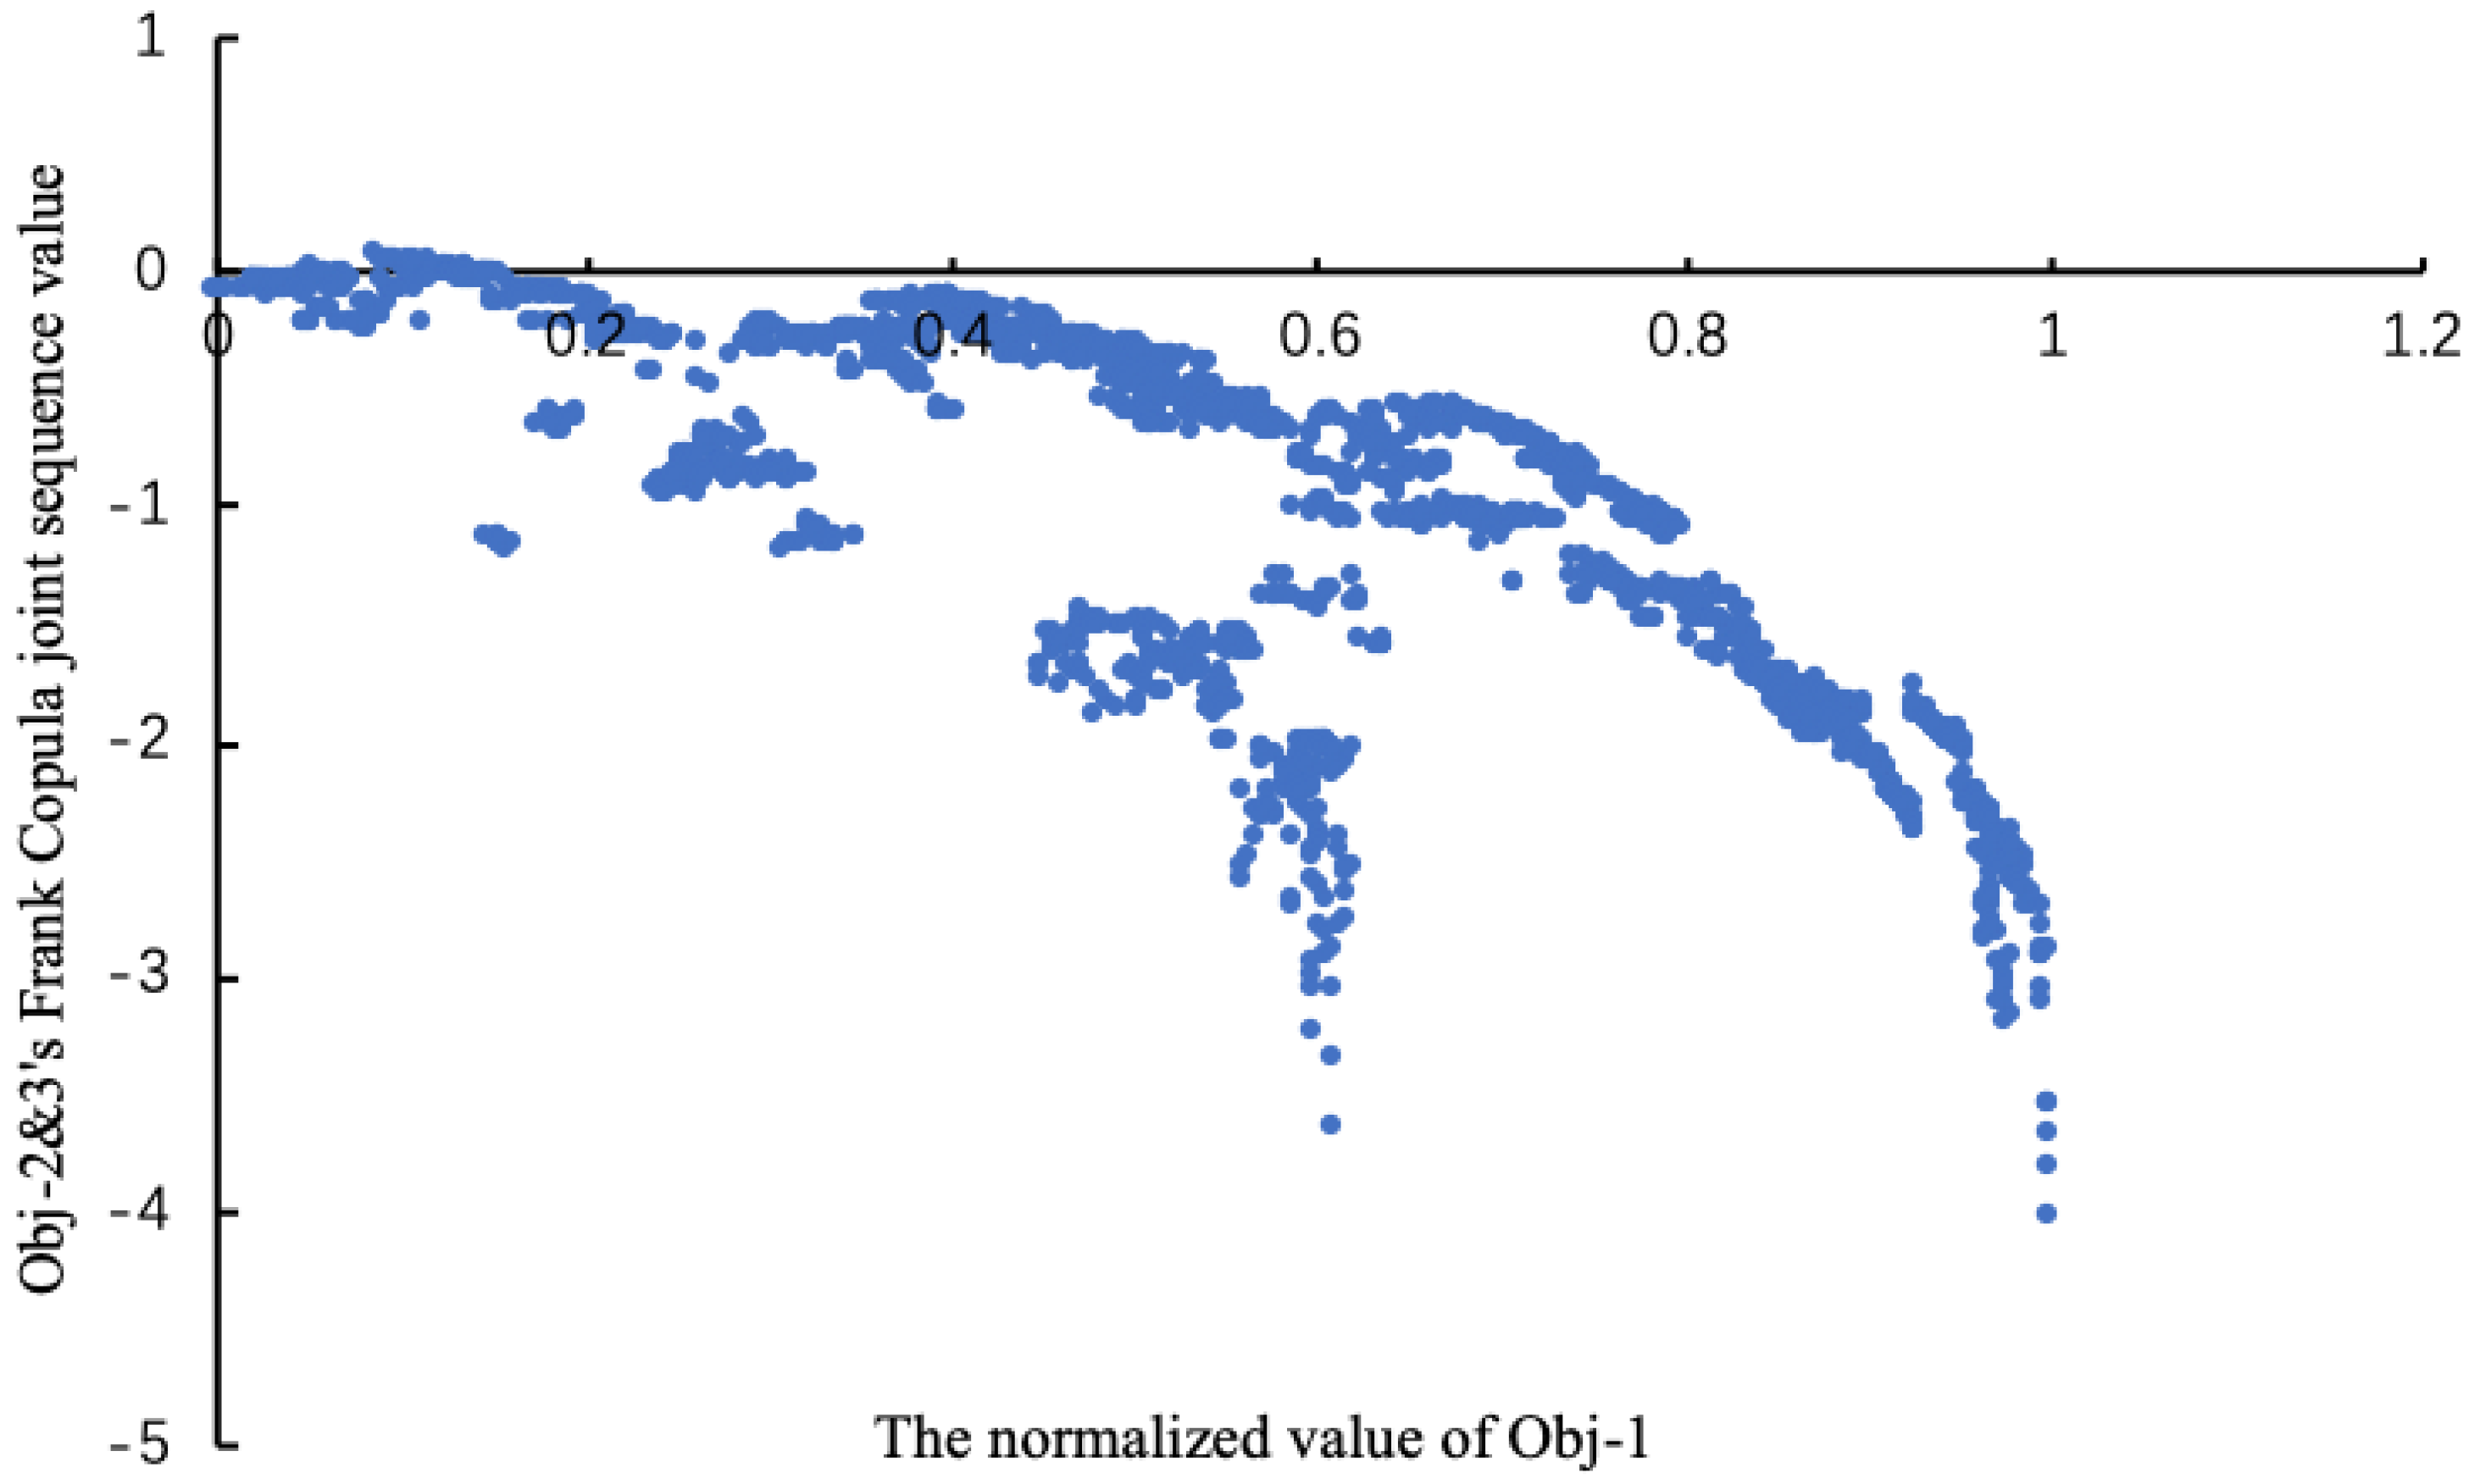
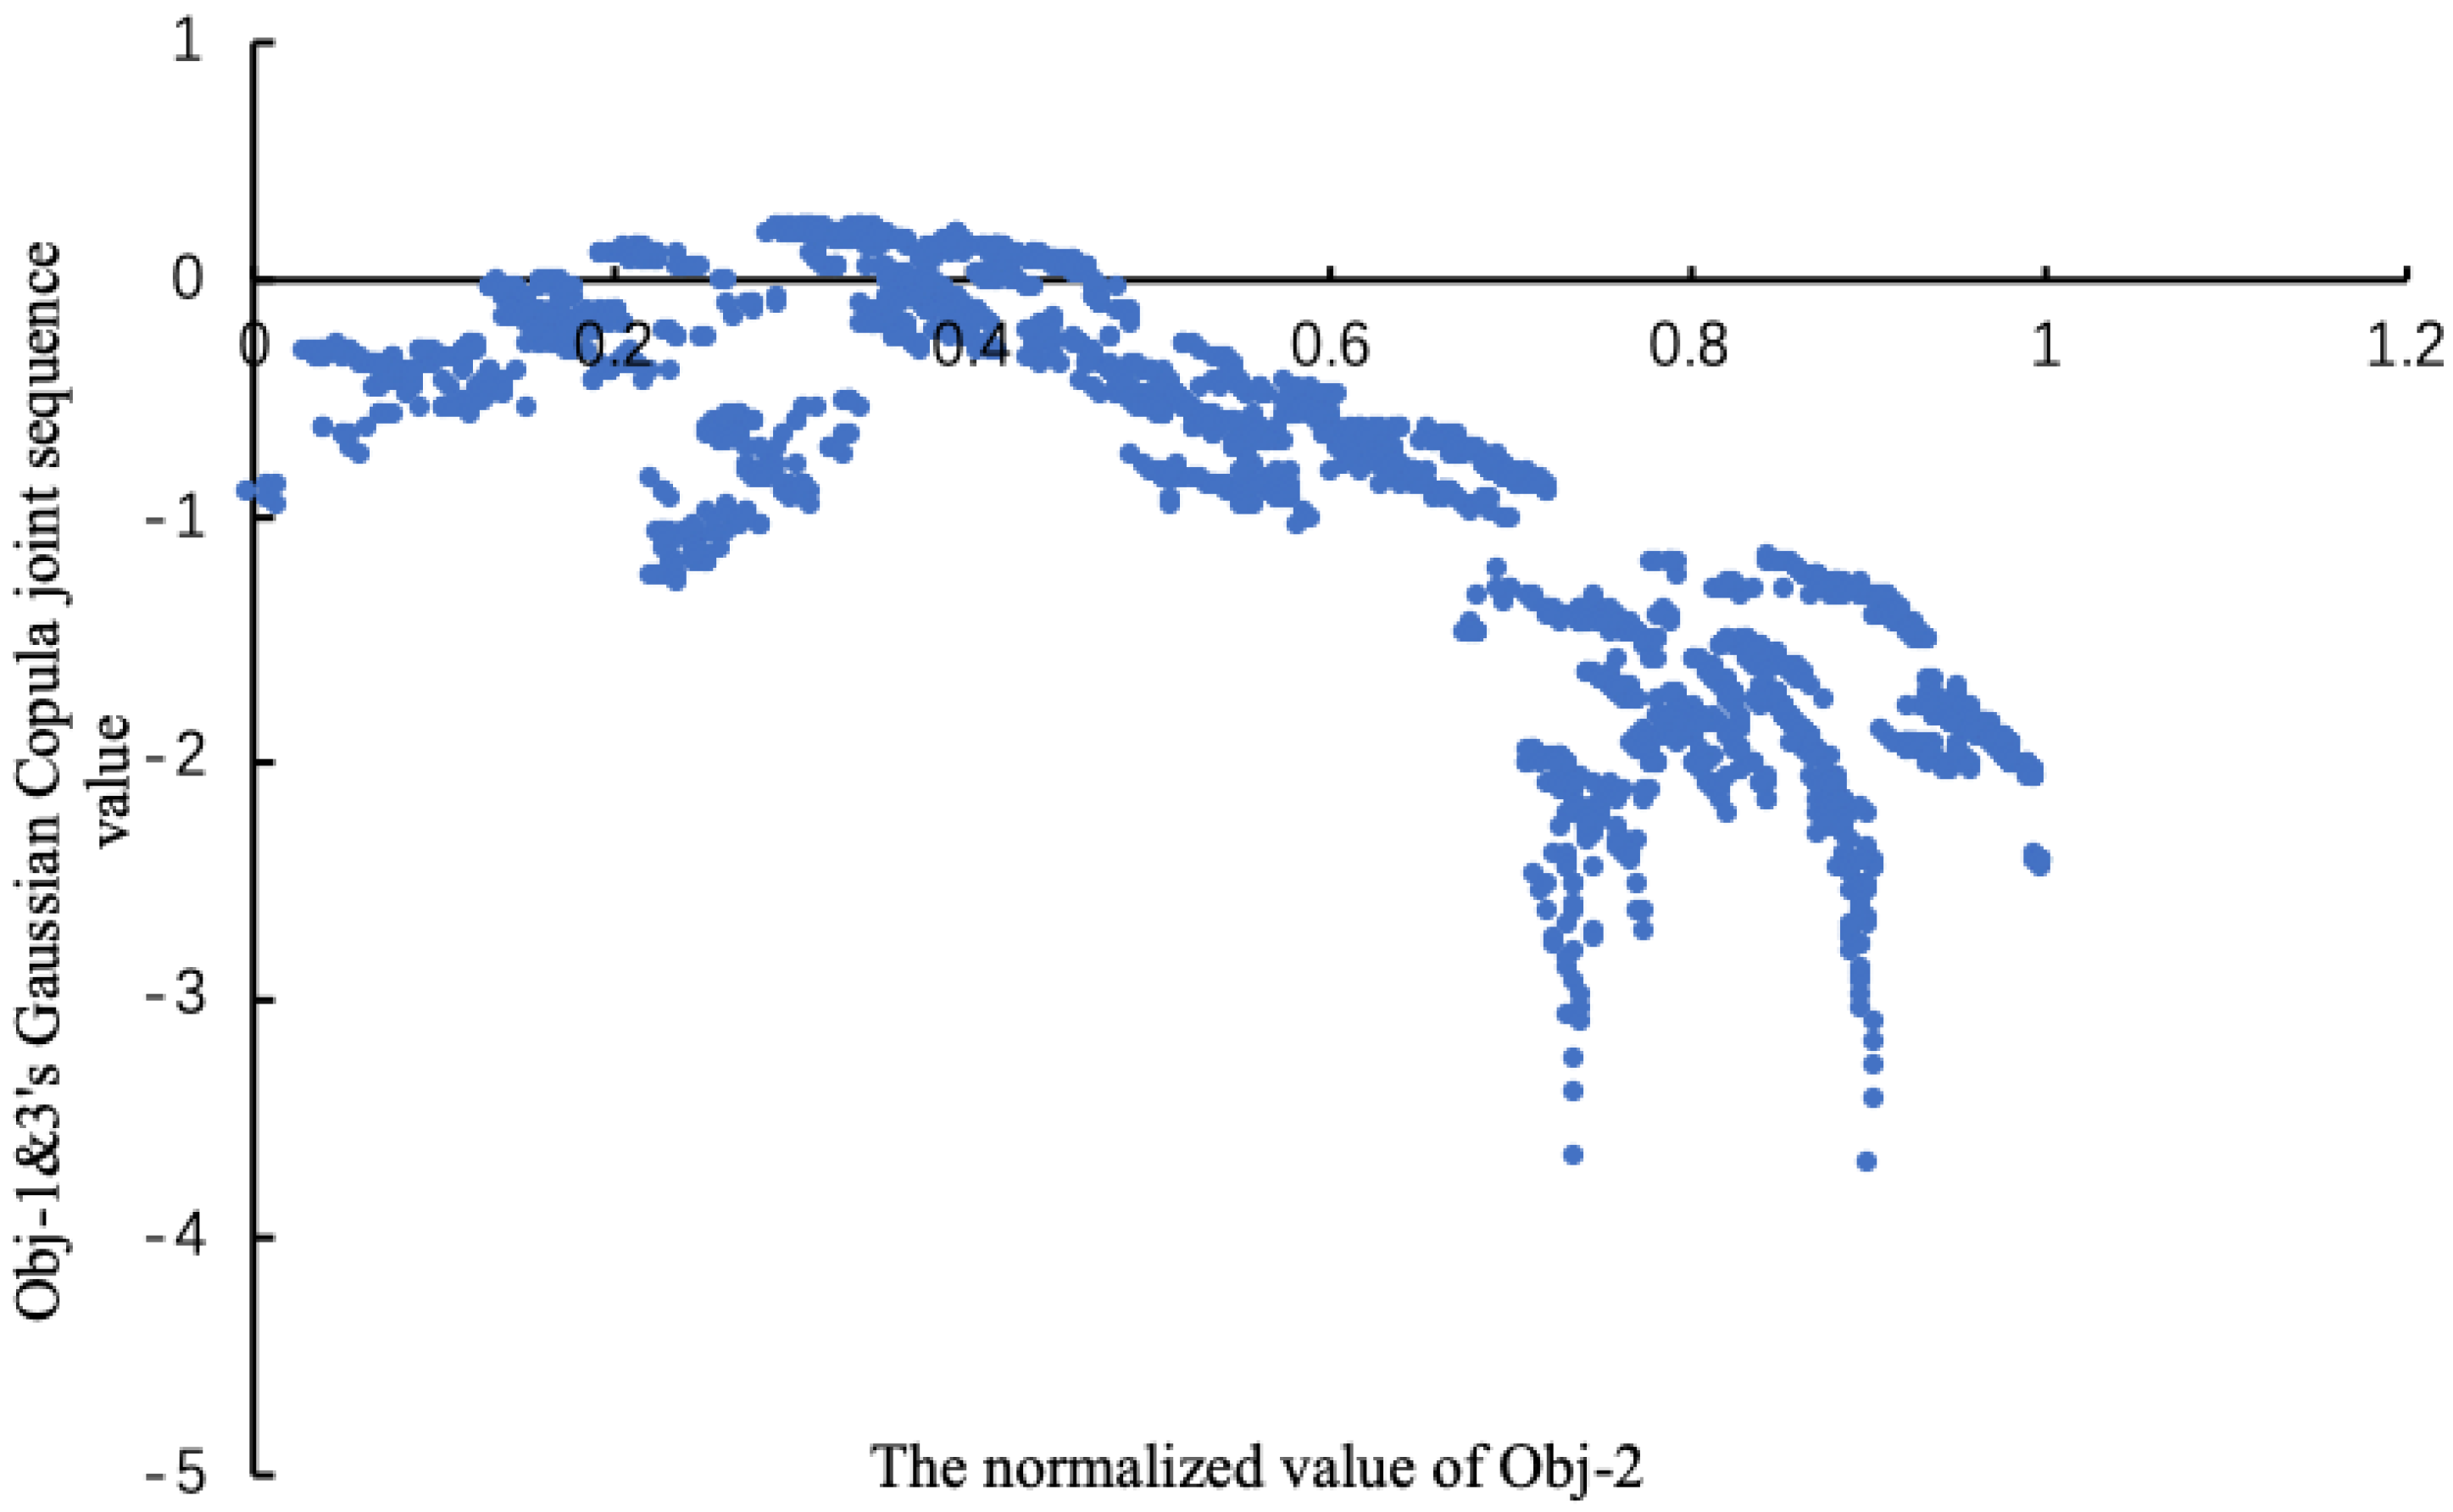
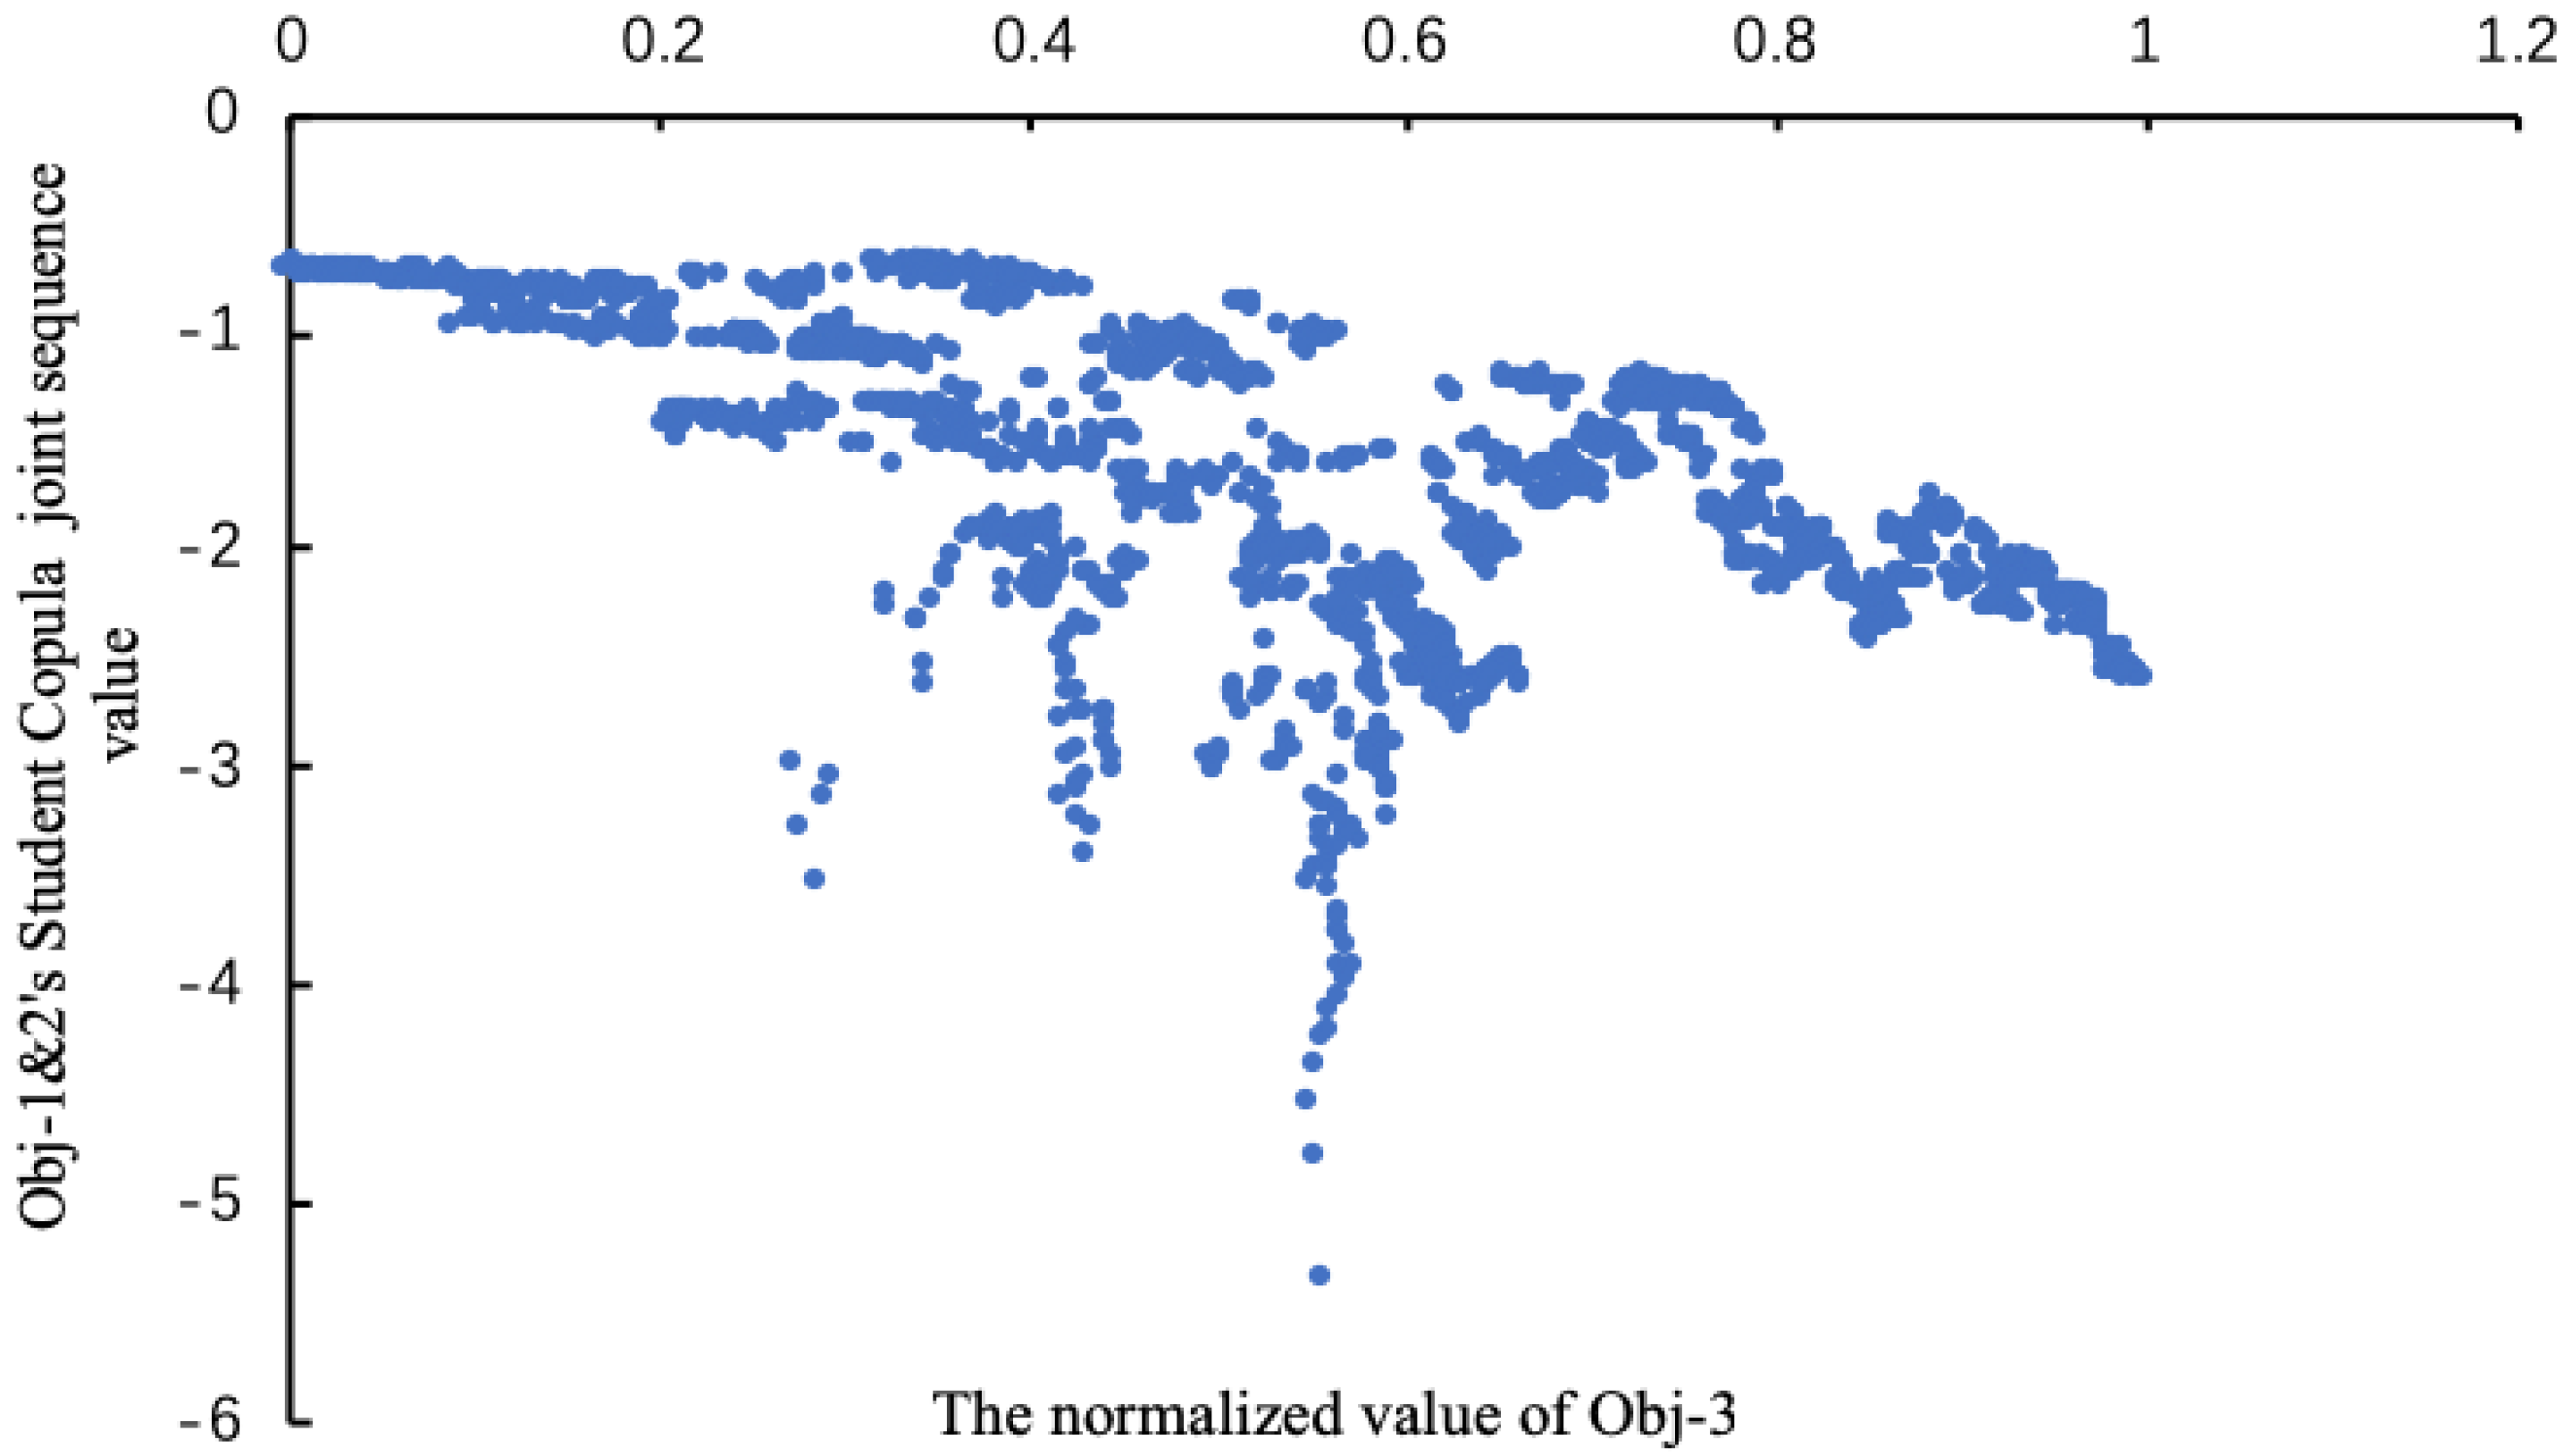
To derive the sequence value of joint distribution, the joint sequence value of the optimal copula function under three combinations is obtained. The joint sequence value covers the characteristics and the information of the two objective sequences that represent the overall level. The scatter plot of the Obj-1 normalized value and the Frank Copula joint sequence value of Obj-2&3 is illustrated in Figure 10, as well as the ‘Obj-2 + Obj-1&3(Gaussian Copula)’ and ‘Obj-3 + Obj-1&2(Student Copula)’ showed in Figure 11 and Figure 12, respectively.
Comparing Figure 10, Figure 11 and Figure 12, Figure 12 appears the most discrete, which indicates that the regularity of the impact of Obj-3 on Obj-1&2 in the Heihe River Basin is the worst. It is known that power generation does not consume but rather utilizes surface water resources, so the competition between power generation and the other objectives is minimal. Moreover, the slope is the smallest, indicating that the change of power generation has the least impact on Obj-1&2.
The increase of Obj-1 normalization index will lead to the decrease of combined sequence value of Obj-2&3, which indicates that when Obj-1 tends to be more optimized, the Obj-2&3 will become worse as a whole. The slope of the Obj-1 normalized value in scatter plot ahead of 0.9 is milder than that after 0.9, which denotes that when irrigation water shortage is greater than 1492 × 104 m3, with the decrease of irrigation water shortage, the overall impact on ecological water and power generation is smaller and the cost of the optimal irrigation water shortage is lower. When Obj-1 is more satisfied, that is, when irrigation water shortage is less than 1492 × 104 m3, with the decrease of irrigation water shortage, the overall impact on ecological water and power generation is greater and the cost of the optimal irrigation water shortage is higher. Therefore, it is recommended that the average annual water shortage for irrigation should be about 1492 × 104 m3.
The plot of the Obj-1 normalization index is scattered before 0.6 and clustered after 0.6. It illustrates that when the irrigation water shortage is greater than 3193 × 104 m3, the change of irrigation water has little effect on the ecological water and power generation integrally; after 0.6, when the irrigation water shortage is less than 3193 × 104 m3, the irrigation water exhibits a strong influence on other objectives.
The increase of the Obj-2 normalization index will lead to the decrease of the combined sequence value of Obj-1&3, which indicates that when the Obj-2 is more optimized, the Obj-1&3 may become worse as a whole. The slope of the Obj-2 normalization index in the scatter plot before 0.8 is milder than that after 0.8, which denotes that, in the stage of lower ecological satisfaction, when ecological water shortage is greater than 4951 × 104 m3, with the decrease of ecological water shortage, the overall impact of irrigation water and power generation is smaller and the cost of optimizing the ecological water shortage is lower. Otherwise, when ecological water shortage is less than 4951 × 104 m3, with the decrease of ecological water shortage, the overall impact on irrigation water and power generation is greater and the cost of optimizing ecology water shortage is higher. It is recommended that the average annual water shortage in the ecological process should be around 4951 × 104 m3.
The increase of normalized index of Obj-3 will lead to a decrease of the combined sequence value of Obj-1&2, which indicates that when the Obj-3 tends to be more optimized, the Obj-1&2 will become worse as a whole. The scatter plots before 0.65 are discrete and after 0.65 are concentrated, showing that when the average annual power generation is less than 26.48 × 10⁸ kW h, the change of power generation has little effect on the irrigation and ecological water as a whole; on the contrary, the impact is stronger.
5. Conclusions
This study takes the multi-objective joint optimal dispatch of cascade reservoirs in the Heihe River Basin as a study object. Based on the ICGC-NSGA-II algorithm to solve this model, the Pareto non-inferior solution set is obtained. The competition mechanism among two objectives is quantitatively described by statistical means and with the copula function constructing the joint sequence of two targets, the three objectives’ competition mechanism is explored too. This study expects to provide a foundation for selective preference of the Pareto set and a new idea for multi-objective study. The main conclusions are summarized as follows:
- The three-dimensional and two-dimensional spatial distributions of the Pareto solutions prove that there are mutual restrictions and influences among the three objectives. In order to avoid the disadvantage of choosing only a limited number of representative solutions and being too arbitrary, the long series of non-inferior solutions obtained are adopted to study the competition mechanism in this study. On the premise of sufficient optimization, there is a macro-rule of ’one falls another rises.’ When one objective solution is inferior, then the other two targets show the strongest regularity and optimum.
- In the analysis of the two-objective competition mechanism, the functional formulas between the sequences of two objects are given, which can quantitatively describe the relationship and interactions. It was found that when the irrigation water shortage was large, with it decreasing, the ecological water shortage increased slowly, which indicates that the two are inversely correlated. In addition, there is a positive correlation between the multi-year average irrigation water shortage and the average power generation, as there is between ecological water shortage and power generation.
- This study first applied the two-variable joint copula function to the study of the multi-objective competition mechanism. Based on the advantage that copula function cannot produce information distortion in the process of connecting the marginal distribution of two sub-sequences, a new sequence containing the comprehensive information of the two targets is generated by using the joint copula function of two variables to combine the sequence values of any two objectives and the competition mechanism between the remaining target sequence and the joint sequence of two targets is studied. A new way is provided for studying the influence of a single sequence on the compound sequence of two sequences.
- The three-objective competition mechanism infers that the competition between power generation and other objectives is the least and the change of power generation has the least influence on the other two as a whole. Specifically, the recommended annual average water shortage for irrigation is about 1492 × 104 m3. When it is less than this value, with decreasing irrigation water shortage, the overall impact of ecological water and power generation is greater. Only when the irrigation water shortage is less than 3193 × 104 m3, will there be a strong impact on other objectives. Additionally, the average annual ecological water shortage is about 4951 × 104m3, when it is less than this value, the overall impact of the irrigation water and power generation will be greater as the ecological water shortage decreases. After the average generation capacity has been more than 26.48 × 10⁸ kW h for many years, the objective of power generation has a strong influence on the other targets.
To summarize, the copula function could combine the marginal distribution of any two sequences and construct a new joint sequence and all the information of the sub-sequence is contained, so there is no information distortion during the combination process. It is an effective tool for quantitatively studying the multi-objective competition mechanism. At present, the research on multi-objective competition mechanisms is in the preliminary stage and the methods adopted in this paper enrich this field.
Author Contributions
Conceptualization, software, data curation and writing—original draft preparation, M.Z.; methodology, L.W.; validation, H.W.; formal analysis, G.L.; resources, S.H.; writing—review and editing, S.L.; supervision, project administration and funding acquisition, Q.H.
Funding
This study was jointly funded by the National Key Research and Development Program of China (grant number 2017YFC0405900), the National Natural Science Foundation of China (grant number 51709221), the Planning Project of Science and Technology of Water Resources of Shaanxi (grant numbers 2015slkj-27 and 2017slkj-19), the China Scholarship Council (grant number 201608610170) and the Doctorate Innovation Funding of Xi’an University of Technology (grant number 310-252071712).
Conflicts of Interest
The authors declare no conflict of interest.
References
- Asvini, M.S.; Amudha, T. Design and development of bio-inspired framework for reservoir operation optimization. Adv. Water Resour. 2017, 110, 193–202. [Google Scholar] [CrossRef]
- Guan, J.; Kentel, E.; Aral, M.M. Genetic Algorithm for Constrained Optimization Models and Its Application in Groundwater Resources Management. J. Water Resour. Plan. Manag. 2008, 134, 64–72. [Google Scholar] [CrossRef]
- Mathur, Y.P.; Nikam, S.J. Optimal Reservoir Operation Policies Using Genetic Algorithm. Int. J. Eng. Technol. 2009, 1, 184–187. [Google Scholar] [CrossRef]
- Rodrigues, D.; Pereira, L.A.M.; Nakamura, R.Y.M.; Costa, K.A.P.; Yang, X.-S.; Souza, A.N.; Papa, J.P. A wrapper approach for feature selection and optimum-path forest based on bat algorithm. Expert Syst. Appl. 2014, 41, 2250–2258. [Google Scholar] [CrossRef]
- Jiang, Z.; Ji, C.; Qin, H.; Feng, Z. Multi-stage progressive optimality algorithm and its application in energy storage operation chart optimization of cascade reservoirs. Energy 2018, 148, 309–323. [Google Scholar] [CrossRef]
- Yang, T.; Hsu, K.; Duan, Q.; Sorooshian, S.; Wang, C. Method to Estimate Optimal Parameters; Springer Nature: Basingstoke, UK, 2018; pp. 1–39. [Google Scholar]
- Reddy, M.J.; Kumar, D.N. Optimal reservoir operation using multi-objective evolutionary algorithm. Water Resour. Manag. 2006, 20, 861–878. [Google Scholar]
- Tauxe, G.W.; Inman, R.R.; Mades, D.M. Multiobjective dynamic programing with application to a reservoir. Water Resour. Res. 1979, 15, 1403–1408. [Google Scholar] [CrossRef]
- Liang, Q.; Johnson, L.E.; Yu, Y.S. A Comparison of two methods for multiobjective optimization for reservoir operation 1. JAWRA J. Am. Water Resour. Assoc. 1996, 32, 333–340. [Google Scholar] [CrossRef]
- Momtahen, S.; Dariane, A.B. Direct Search Approaches Using Genetic Algorithms for Optimization of Water Reservoir Operating Policies. J. Water Resour. Plan. Manag. 2007, 133, 202–209. [Google Scholar] [CrossRef]
- Yuan, X.; Zhang, Y.; Yuan, Y. Improved self-adaptive chaotic genetic algorithm for hydrogenation scheduling. J. Water Resour. Plan. Manag. 2008, 134, 319–325. [Google Scholar] [CrossRef]
- Yang, X. A new metaheuristic bat-inspired algorithm. In Nature Inspired Cooperative Strategies for Optimization; Studies in Computational Intelligence, NISCO; Springer: Berlin/Heidelberg, Germany, 2010; Volume 284. [Google Scholar]
- Yang, T.; Gao, X.; Sellars, S.L.; Sorooshian, S. Improving the multi-objective evolutionary optimization algorithm for hydropower reservoir operations in the California Oroville–Thermalito complex. Environ. Model. Softw. 2015, 69, 262–279. [Google Scholar] [CrossRef]
- Goyal, M.K.; Ojha, C.S.P.; Singh, R.D.; Swamee, P.K.; Nema, R.K. Application of ANN, fuzzy logic and decision tree algorithms for the development of reservoir operating rules. Water Resour. Manag. 2013, 27, 911–925. [Google Scholar]
- Kim, T.; Heo, J.H.; Jeong, C.S. Multi-reservoir system optimization in the Han River basin using multi-objective genetic algorithms. Hydrol. Process. Int. J. 2006, 20, 2057–2075. [Google Scholar] [CrossRef]
- Ming, B.; Chang, J.-X.; Huang, Q.; Wang, Y.-M.; Huang, S.-Z. Optimal Operation of Multi-Reservoir System Based-On Cuckoo Search Algorithm. Water Resour. Manag. 2015, 29, 5671–5687. [Google Scholar] [CrossRef]
- Ostadrahimi, L.; Mariño, M.A.; Afshar, A. Multi-reservoir operation rules: Multi-swarm PSO-based optimization approach. Water Resour. Manag. 2012, 26, 407–427. [Google Scholar] [CrossRef]
- Ming, B.; Liu, P.; Cheng, L.; Zhou, Y.; Wang, X. Optimal daily generation scheduling of large hydro–photovoltaic hybrid power plants. Energy Convers. Manag. 2018, 171, 528–540. [Google Scholar] [CrossRef]
- Reddy, J.M.; Kumar, N.D. Multi-objective differential evolution with application to reservoir system optimization. J. Comput. Civ. Eng. 2007, 21, 136–146. [Google Scholar] [CrossRef]
- Reddy, M.J.; Kumar, D.N. Performance evaluation of elitist-mutated multi-objective particle swarm optimization for integrated water resources management. J. Hydroinform. 2009, 11, 79–88. [Google Scholar] [CrossRef] [Green Version]
- Wang, X.; Chang, J.; Meng, X.; Wang, Y. Research on multi-objective operation based on improved NSGA-II for lower Yellow River. J. Hydraul. Eng. 2017, 48, 135–145. [Google Scholar]
- Yang, W. Study on Multi-Objective Conversion Law of Joint Operation of Heihe Cascade Reservoir Group; Xi’an University of Technology: Xi’an, China, 2018. [Google Scholar]
- Nelsen, R.B. An Introduction to Copulas; Springer: New York, NY, USA, 2006. [Google Scholar]
- Li, J.; Zhang, Q.; Chen, Y.D.; Singh, V.P. Future joint probability behaviors of precipitation extremes across China: Spatiotemporal patterns and implications for flood and drought hazards. Planet. Chang. 2015, 124, 107–122. [Google Scholar] [CrossRef] [Green Version]
- Chen, Y.; Zhang, Q.; Xiao, M.; Singh, V.P.; Zhang, S. Probabilistic forecasting of seasonal droughts in the Pearl River basin, China. Stoch. Environ. Res. Risk Assess. 2016, 30, 2031–2040. [Google Scholar] [CrossRef]
- Goswami, U.P.; Bhargav, K.; Hazra, B.; Goyal, M.K. Spatiotemporal and joint probability behavior of temperature extremes over the Himalayan region under changing climate. Theor. Appl. Climatol. 2018, 134, 477–498. [Google Scholar] [CrossRef]
- Sraj, M.; Bezak, N.; Brilly, M. Bivariate flood frequency analysis using the copula function: A case study of the Litija station on the Sava River. Hydrol. Process. 2015, 29, 225–238. [Google Scholar] [CrossRef]
- Huang, S.; Chang, J.; Huang, Q.; Chen, Y. Spatio-temporal changes and frequency analysis of drought in the Wei River Basin, China. Water Resour. Manag. 2014, 28, 3095–3110. [Google Scholar] [CrossRef]
- Fang, W.; Huang, S.; Huang, G.; Huang, Q.; Wang, H.; Wang, L.; Zhang, Y.; Li, P.; Ma, L. Copulas-based risk analysis for inter-seasonal combinations of wet and dry conditions under a changing climate. Int. J. Climatol. 2019, 39, 2005–2021. [Google Scholar] [CrossRef]
- Chen, F.; Huang, G.; Fan, Y.; Chen, J. A copula-based fuzzy chance-constrained programming model and its application to electric power generation systems planning. Appl. Energy 2017, 187, 291–309. [Google Scholar] [CrossRef]
- Yu, L.; Li, Y.; Huang, G.; Fan, Y.; Nie, S. A copula-based flexible-stochastic programming method for planning regional energy system under multiple uncertainties: A case study of the urban agglomeration of Beijing and Tianjin. Appl. Energy 2018, 210, 60–74. [Google Scholar] [CrossRef]
- Kong, X.M.; Huang, G.H.; Li, Y.P.; Fan, Y.R.; Zeng, X.T.; Zhu, Y. Inexact Copula-Based Stochastic Programming Method for Water Resources Management under Multiple Uncertainties. J. Water Resour. Plan. Manag. 2018, 144, 04018069. [Google Scholar] [CrossRef]
- Fan, Y.R.; Huang, G.H.; Baetz, B.W.; Li, Y.P. Development of a copula-based particle filter (CopPF) approach for hydrologic data assimilation under consideration of parameter interdependence. Water Resour. 2017, 53, 4850–4875. [Google Scholar] [CrossRef]
- Guo, S.; Yan, B.; Xiao, Y.; Fang, B.; Zhang, N. Application and research progress of Copula function in multivariate hydrological analysis and computation. J. China Hydrol. 2008, 28, 1–7. [Google Scholar]
- Zhao, J.; Xu, Z.-X.; Zuo, D.-P.; Wang, X.-M. Temporal variations of reference evapotranspiration and its sensitivity to meteorological factors in Heihe River Basin, China. Water Sci. Eng. 2015, 8, 1–8. [Google Scholar] [CrossRef] [Green Version]
- Min, L.; Yu, J.; Liu, C.; Zhu, J.; Wang, P. The spatial variability of streambed vertical hydraulic conductivity in an intermittent river, northwestern China. Environ. Earth Sci. 2013, 69, 873–883. [Google Scholar] [CrossRef]
- Wang, Y.; Feng, Q.; Chen, L.; Yu, T. Significance and Effect of Ecological Rehabilitation Project in Inland River Basins in Northwest China. Environ. Manag. 2013, 52, 209–220. [Google Scholar] [Green Version]
- Goldberg, D.E.; Deb, K. A Comparative Analysis of Selection Schemes Used in Genetic Algorithms. Found. Genet. Algorithms 1991, 1, 69–93. [Google Scholar] [Green Version]
- Deb, K.; Agrawal, S.; Pratap, A.; Meyarivan, T. A fast elitist non-dominated sorting genetic algorithm for multi-objective optimization: NSGA-II. In Proceedings of the International Conference on Parallel Problem Solving from Nature, Paris, France, 18–20 September 2000; Springer: Berlin/Heidelberg, Germany, 2000; pp. 849–858. [Google Scholar]
- Sklar, M. Fonctions de repartition an dimensions et leurs marges. Publ. Inst. Statist. Univ. Paris 1959, 8, 229–231. [Google Scholar]
- Shiau, J.-T. Fitting Drought Duration and Severity with Two-Dimensional Copulas. Water Resour. Manag. 2006, 20, 795–815. [Google Scholar] [CrossRef]
- Guo, Y.; Huang, S.; Huang, Q.; Wang, H.; Fang, W.; Yang, Y.; Wang, L. Assessing socioeconomic drought based on an improved Multivariate Standardized Reliability and Resilience Index. J. Hydrol. 2019, 568, 904–918. [Google Scholar] [CrossRef]
- Yue, S.; Ouarda, T.; Bobée, B.; Legendre, P.; Bruneau, P. The Gumbel mixed model for flood frequency analysis. J. Hydrol. 1999, 226, 88–100. [Google Scholar] [CrossRef]
- Zhao, M.; Huang, S.; Huang, Q.; Wang, H.; Leng, G.; Xie, Y. Assessing socio-economic drought evolution characteristics and their possible meteorological driving force. Geomat. Hazards Risk 2019, 10, 1084–1101. [Google Scholar] [CrossRef]
- Guindon, S.; Gascuel, O. A Simple, Fast, and Accurate Algorithm to Estimate Large Phylogenies by Maximum Likelihood. Syst. Biol. 2003, 52, 696–704. [Google Scholar] [CrossRef] [Green Version]
- Akaike, H. A new look at the statistical model identification. IEEE Trans. Autom. 1974, 19, 716–723. [Google Scholar] [CrossRef]
- Yang, T.; Tao, Y.; Li, J.; Zhu, Q.; Su, L.; He, X.; Zhang, X. Multi-criterion model ensemble of CMIP5 surface air temperature over China. Theor. Appl. Clim. 2017, 132, 1057–1072. [Google Scholar] [CrossRef]
Figure 1.
Location and sections distribution of the Heihe River Basin.

Figure 2.
The main research framework.

Figure 3.
Multi-objective Pareto surface graph of Obj 1~3 in one coordinate system. Blue points indicates non-inferior solution.
Figure 3.
Multi-objective Pareto surface graph of Obj 1~3 in one coordinate system. Blue points indicates non-inferior solution.

Figure 4.
Bubble graph of irrigation and ecology, in which the bubble size represents the multi-year average power generation (Obj-3).
Figure 4.
Bubble graph of irrigation and ecology, in which the bubble size represents the multi-year average power generation (Obj-3).

Figure 5.
Bubble graph of irrigation and power generation, in which the bubble size represents the multi-year average ecological water shortage (Obj-2).
Figure 5.
Bubble graph of irrigation and power generation, in which the bubble size represents the multi-year average ecological water shortage (Obj-2).

Figure 6.
Bubble graph of ecology and power generation, in which the bubble size represents the multi-year average irrigation water shortage (Obj-1).
Figure 6.
Bubble graph of ecology and power generation, in which the bubble size represents the multi-year average irrigation water shortage (Obj-1).

Figure 7.
The two-dimensional scatter plots of Obj-1 and Obj-2’s normalized value. All the points indicate Pareto set, and among them, the orange points represent the Pareto frontier.
Figure 7.
The two-dimensional scatter plots of Obj-1 and Obj-2’s normalized value. All the points indicate Pareto set, and among them, the orange points represent the Pareto frontier.

Figure 8.
The two-dimensional scatter plots of Obj-1 and Obj-3’s normalized value. All the points indicate Pareto set, and among them, the orange points represent the Pareto frontier.
Figure 8.
The two-dimensional scatter plots of Obj-1 and Obj-3’s normalized value. All the points indicate Pareto set, and among them, the orange points represent the Pareto frontier.

Figure 9.
The two-dimensional scatter plots of Obj-2 and Obj-3’s normalized value. All the points indicate Pareto set, and among them, the orange points represent the Pareto frontier.
Figure 9.
The two-dimensional scatter plots of Obj-2 and Obj-3’s normalized value. All the points indicate Pareto set, and among them, the orange points represent the Pareto frontier.

Figure 10.
The normalized value of Obj-1 and Obj-2&3’s joint series scatter diagram.

Figure 11.
The normalized value of Obj-2 and Obj-1&3’s joint series scatter diagram.

Figure 12.
The normalized value of Obj-3 and Obj-1&2’s joint series scatter diagram.


Table 1.
Multi-objective Pareto optimal set.
| No. | Annual Water Shortage in Irrigation (104 m3) | Annual Water Shortage in Ecological (104 m3) | Annual Generation Capacity (108 kW·h) |
|---|---|---|---|
| 1 | 925 | 9058 | 25.95 |
| 2 | 926 | 9010 | 25.94 |
| 3 | 935 | 9000 | 25.96 |
| … | … | … | … |
| 1998 | 6580 | 4396 | 26.34 |
| 1999 | 6584 | 4400 | 26.34 |
| 2000 | 6595 | 4424 | 26.35 |
Table 2.
Five copula functions’ Akaike Information Criterion (AIC) evaluating value.
| Objective Combination | Clayton Copula | Frank Copula | Gumbel Copula | Gaussian Copula | Student Copula |
|---|---|---|---|---|---|
| Obj-1&2 | −8635.43 | −16,051.64 | −8635.43 | −16,435.24 | −16,437.86 |
| Obj-1&3 | −10,140.03 | −10,629.38 | −10,140.03 | −10,671.15 | −10,669.85 |
| Obj-2&3 | −10,075.94 | −11,292.73 | −10,075.93 | −11,282.21 | −11,281.74 |
© 2019 by the authors. Licensee MDPI, Basel, Switzerland. This article is an open access article distributed under the terms and conditions of the Creative Commons Attribution (CC BY) license (http://creativecommons.org/licenses/by/4.0/).
Share and Cite
MDPI and ACS Style
Zhao, M.; Huang, S.; Huang, Q.; Wang, H.; Leng, G.; Liu, S.; Wang, L. Copula-Based Research on the Multi-Objective Competition Mechanism in Cascade Reservoirs Optimal Operation. Water 2019, 11, 995. https://doi.org/10.3390/w11050995
AMA Style
Zhao M, Huang S, Huang Q, Wang H, Leng G, Liu S, Wang L. Copula-Based Research on the Multi-Objective Competition Mechanism in Cascade Reservoirs Optimal Operation. Water. 2019; 11(5):995. https://doi.org/10.3390/w11050995
Chicago/Turabian StyleZhao, Menglong, Shengzhi Huang, Qiang Huang, Hao Wang, Guoyong Leng, Siyuan Liu, and Lu Wang. 2019. "Copula-Based Research on the Multi-Objective Competition Mechanism in Cascade Reservoirs Optimal Operation" Water 11, no. 5: 995. https://doi.org/10.3390/w11050995
Note that from the first issue of 2016, this journal uses article numbers instead of page numbers. See further details here.