Impact of the Artificial Strait in the Vistula Spit on the Hydrodynamics of the Vistula Lagoon (Baltic Sea)


Faculty of Civil and Environmental Engineering, Gdańsk University of Technology, Narutowicza 11/12, 80-233 Gdańsk, Poland
*
Author to whom correspondence should be addressed.
Water 2019, 11(5), 990; https://doi.org/10.3390/w11050990
Submission received: 25 March 2019
/
Revised: 7 May 2019
/
Accepted: 8 May 2019
/
Published: 10 May 2019
(This article belongs to the Special Issue Modeling and Analysis of Hydrodynamics, Water Quality and Ice Phenomena for Lagoons and Shallow Bays)
Abstract
:In the Vistula Lagoon, storm surges are induced by variable sea levels in the Gulf of Gdańsk and wind action. The rising of the water level in the southern part of the basin, exceeding 1.0 m above mean sea level, can be dangerous for the lowland area of Żuławy Elbląskie, causing the inundation of the polders adjacent to the lagoon. One of the potential possibilities to limit the flood risk is to decrease the water level in the lagoon during strong storm surges by opening an artificial canal to join the lagoon with the Gulf of Gdańsk. The decision to build a new strait in the Vistula Spit was made in 2017. In order to analyze the impact of the artificial connection between the sea and the lagoon during periods of high water stages in the southern part the lagoon, mathematical modelling of the hydrodynamics of the Vistula Lagoon is required. This paper presents the shallow water equations (SWEs) model adapted to simulate storm surges driven by the wind and sea tides, and the numerical results obtained for the present (without the new strait) and future (with the new strait) configuration of the Vistula Lagoon.
1. Introduction
Coastal lagoons are defined in [1] as inland and shallow water bodies (depths not exceeding a few meters), separated from the ocean by a barrier. They are connected to the ocean by at least one restricted inlet. The orientation of the lagoon may vary, but the parallel to the shore is dominant. According to [2], coastal lagoons occur on about 12% of the length of the world’s coastline. The formation of lagoons could be caused by alluvial progradation, the transgression of barriers in response to a sea level rise, or be formed behind storm-build barriers. A good example of this last type of formation can be found on the southern shores of the Baltic Sea. These semi-closed water areas are very calm and have the same salinity as the open sea, making them ideal for aquaculture. Some lagoons have been extensively converted for brackish-water fish ponds (e.g., the lagoons south of Madras), shellfish aquaculture (i.e., lakes on Hokkaido Island [3]), or cage culture, which is widespread around the world [4]. Changing climatic conditions [5,6] over the next century are likely to increase marine influences in lagoons, by the action of wind and storm surges. The paper presents some possibility of flood relief by the example of the proposed cut channel on the Vistula Lagoon transboundary water body.
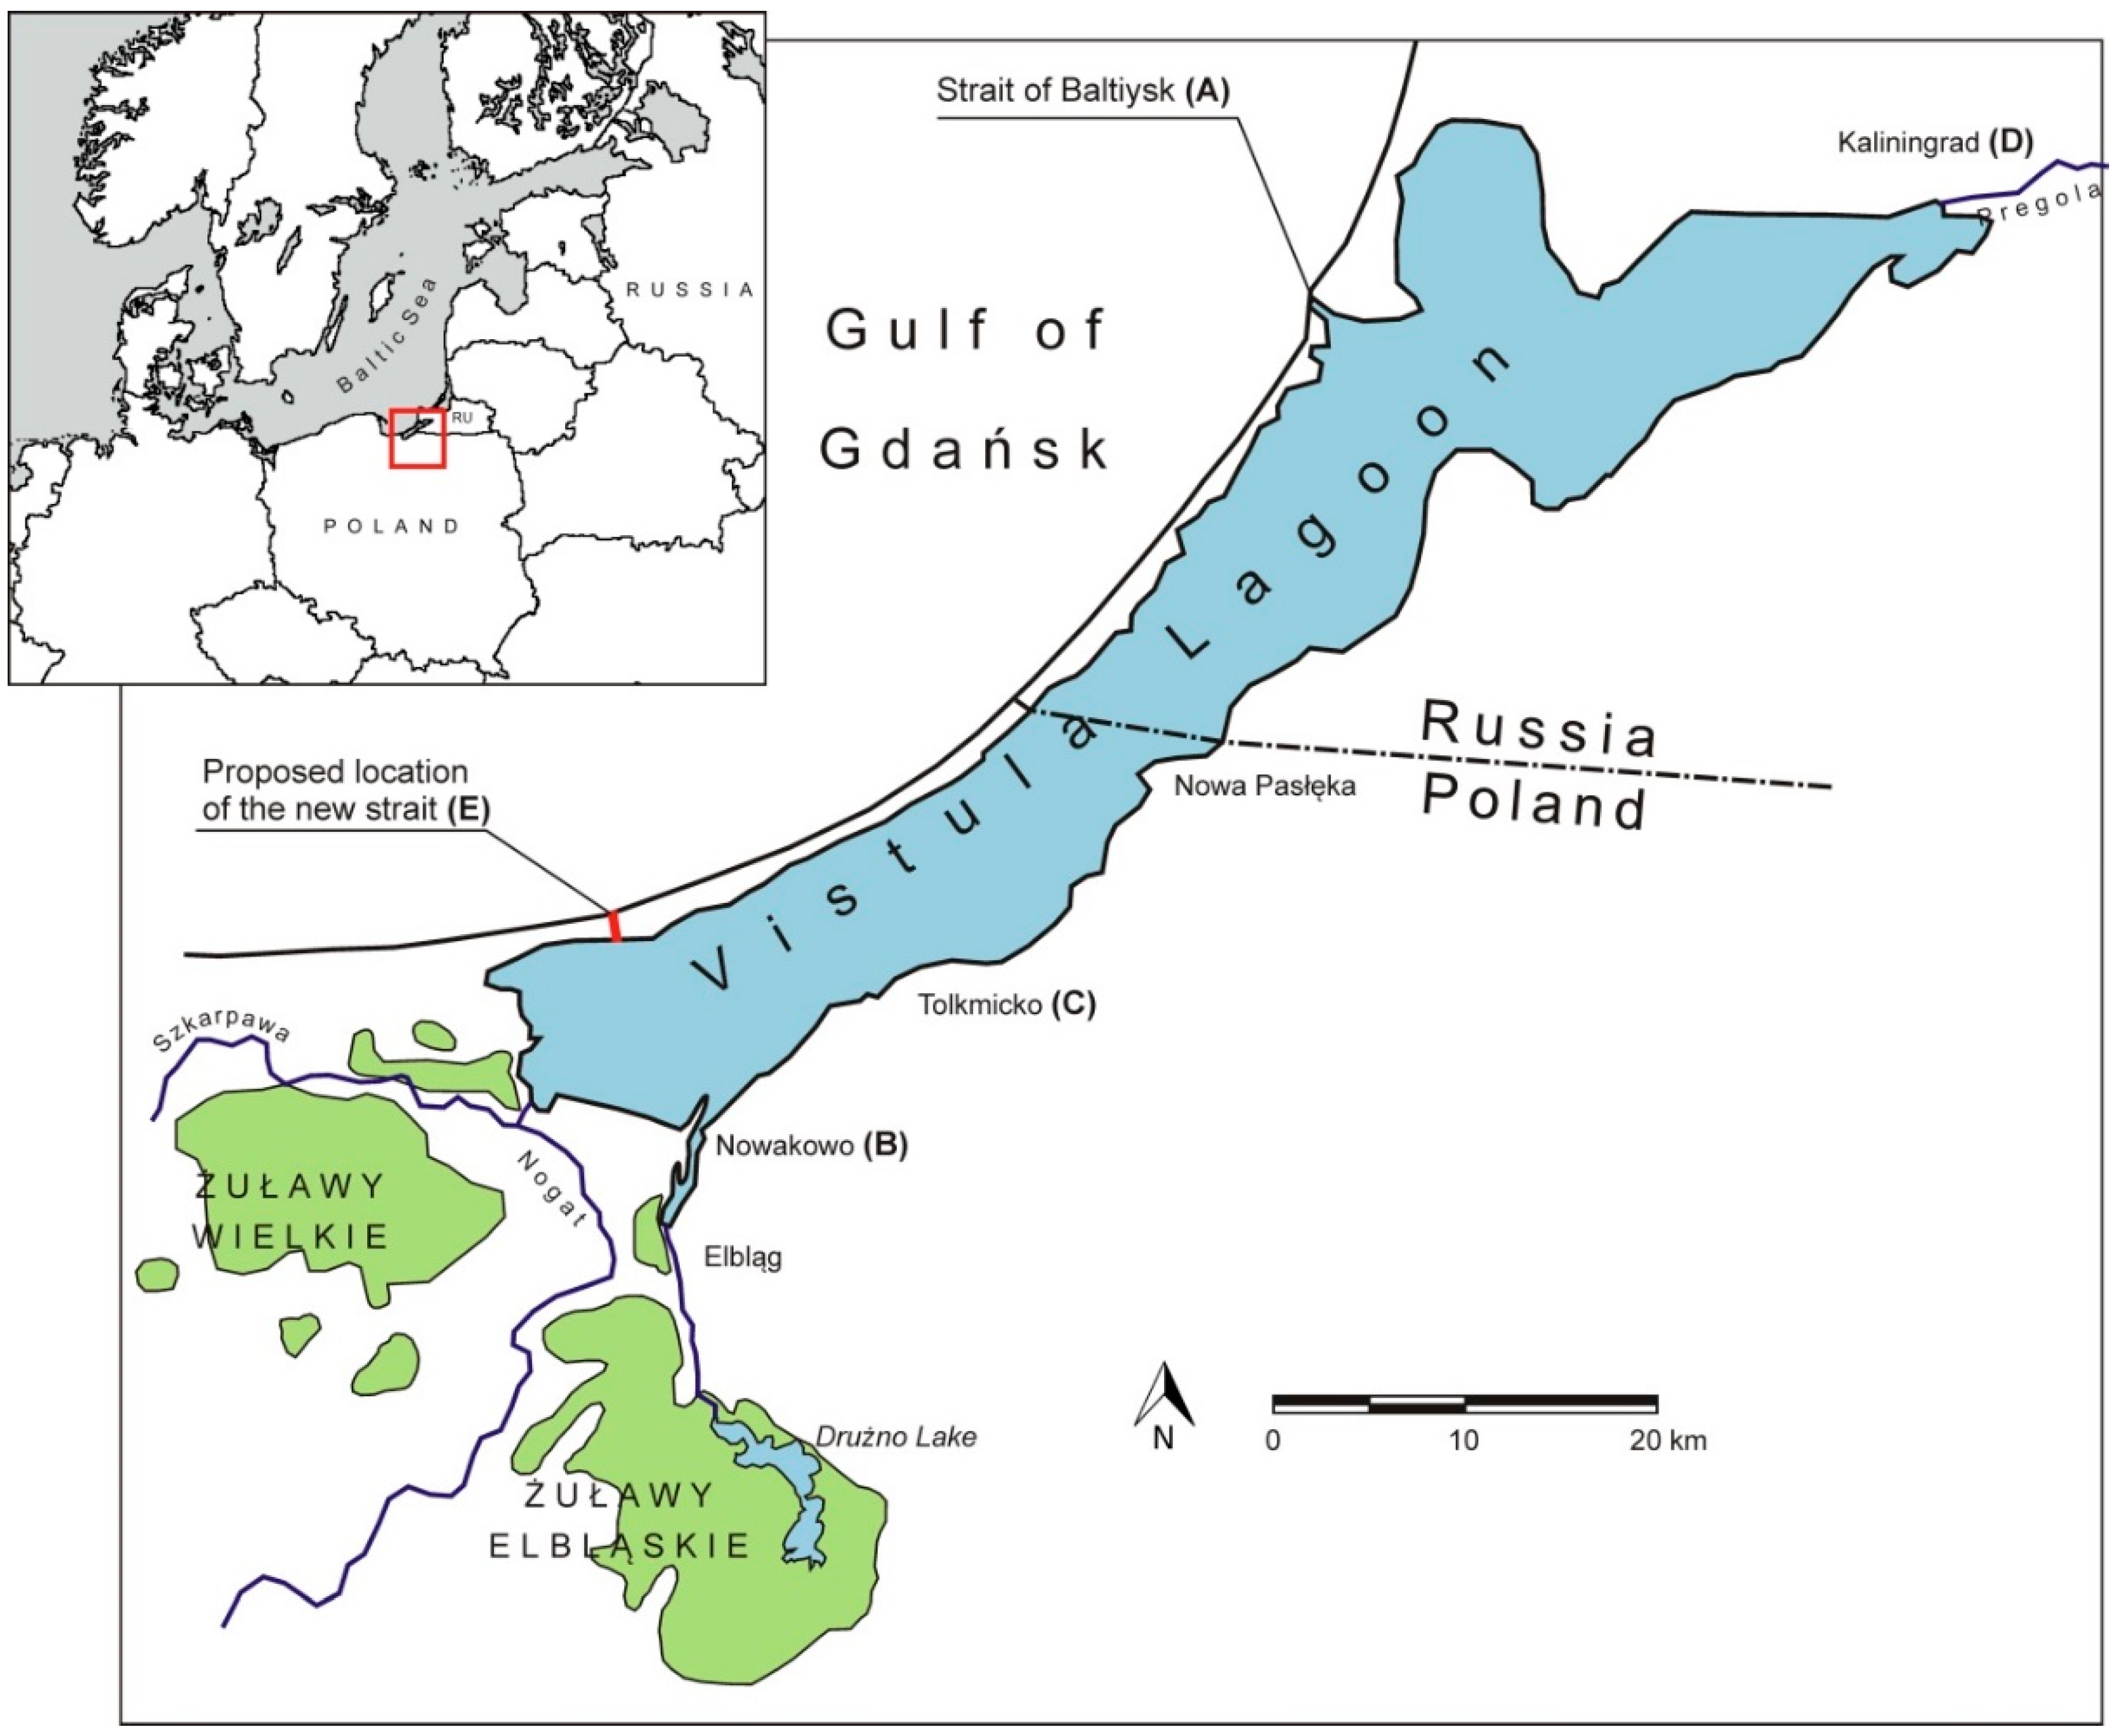
The Vistula Lagoon is located on the southern coast of the Baltic Sea, in the east part of the Gulf of Gdańsk (Figure 1). The length of the lagoon is 90.7 km and its width varies from almost 6 km up to 13 km. The mean width is 8.9 km. The lagoon is a very shallow basin with a mean depth of only 2.75 m. It is separated from the Gulf of Gdańsk by the Vistula Spit of a length of about 65 km. The only connection between the Vistula Lagoon and the Baltic Sea is through the Strait of Baltiysk, which is 2 km long, 440 m wide, and approximately 8.8 m deep. The Vistula Lagoon, which developed about 6000 years ago, was created by being cut off from the Baltic Sea by the Vistula Spit. Since the digging of the canal (artificial strait) across the Vistula Spit in 1497 in the vicinity of Baltiysk, the Vistula Lagoon has been in constant contact with the sea [7]. The lagoon represents a transboundary area divided into two parts by the state border between Poland and Russia. The total area of the lagoon measures 838 km2, of which 472.5 km2 belongs to Russia. The shore line is 270 km long, with a water volume of 2.3 km3 [8].
Unsteady flows in the Vistula Lagoon are usually caused by changes of the sea level in the Gulf of Gdańsk and by wind action on the water surface of the lagoon. When the water stage of the Gulf of Gdańsk rises, a difference in sea level in relation to the lagoon appears. This results in a strong water current directed into the lagoon. The decrease of the water table in the Baltic Sea causes the lagoon water to flow into the sea, creating a strong current in the strait in the opposite direction. The total volume of sea water inflowing into the lagoon equals about 17 km3 per year. In extreme conditions, the water inflow reaches 10,000 m3 s−1. Such a situation can occur several times per year, mainly in autumn and winter, when storm surges in the sea reach a water level of over 0.8 m a.s.l. [9]. The total outflow from all the rivers entering into the lagoon is about 180 m3 s−1, and has no significant influence on changes in the water stage in this basin. Except for the water exchange through the Strait of Baltiysk, the hydrodynamic conditions of the lagoon depend on the wind action. In the region of the Vistula Lagoon, SW (from South-West direction) winds with a velocity from 4 to 6 m s−1 (wind velocity measurements at a height of 10 m) prevail [8]. These winds can cause a rise of the water level in the Gulf of Gdańsk and in the Vistula Lagoon of up to 0.8 m over the mean sea level. However, NE (from North-East direction) winds in particular cause a dangerous water level rise in the southern part of the Vistula Lagoon. For long periods (12 h and more) of strong NE winds (10 m s−1 and more), a rise of the water level exceeding +1.0 m and in extremes reaching +1.5 m above the mean sea level can be observed [9]. The total tidal vertical range in the southern part of the lagoon is about 3.0 m (from –1.5 up to +1.5 m a.s.l.). Although NE winds are relatively rare, they can be very dangerous for the polders adjacent to the lagoon, resulting in extensive inundation of the lowland areas of Żuławy Elbląskie.
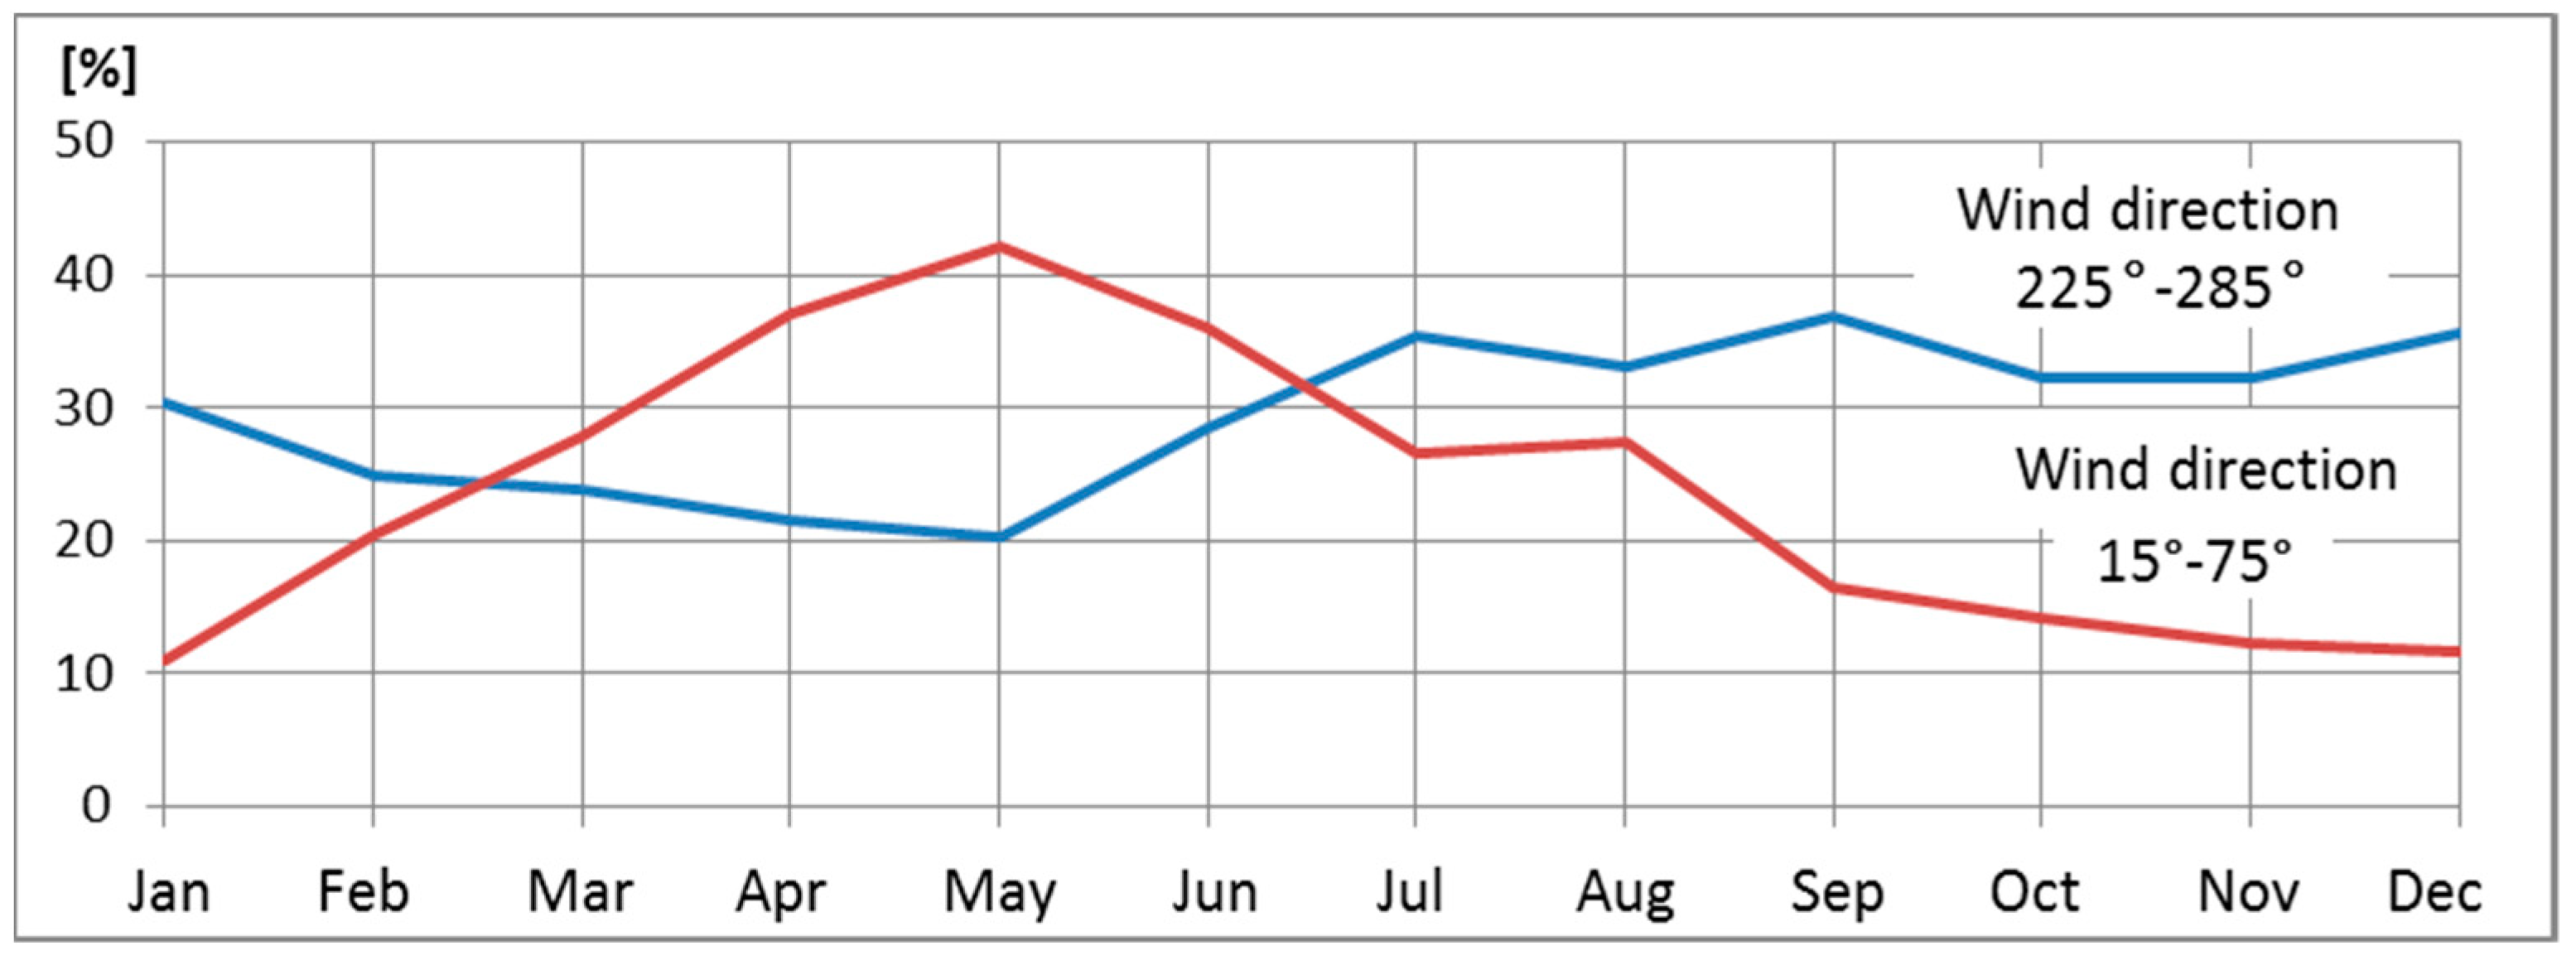
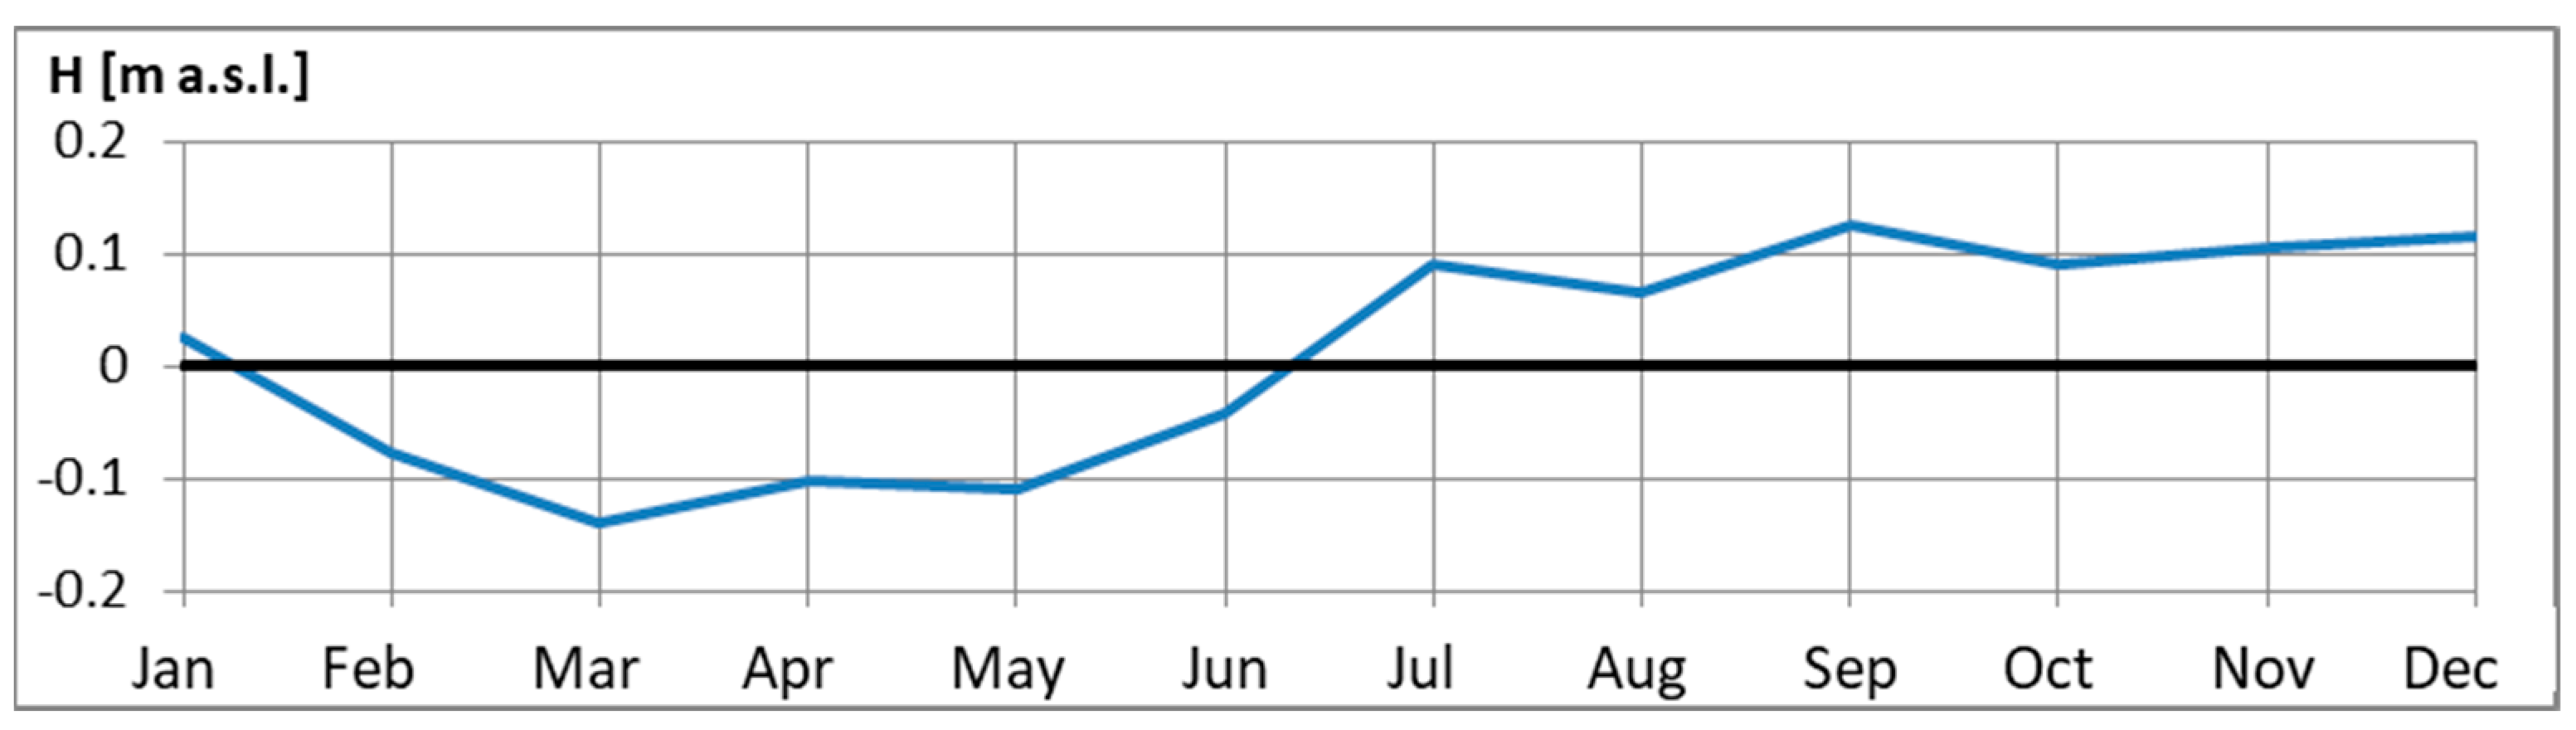
Figure 2 and Figure 3 present the correlation between the mean wind direction and the sea level in the Gulf of Gdańsk. As seen from the plots, the sea level on the southern shore of the Baltic Sea is strongly affected by winds blowing from the SW direction.
Table 1 presents the maximum probable storm surges in the Gulf of Gdańsk, based on the probability calculations of the highest annual Baltic Sea levels on the Polish coast [10]. Computations were performed taking into consideration observational data of the highest annual sea levels in Gdańsk.
There is a concept to create a new connection between the Polish part of the Vistula Lagoon and the Gulf of Gdańsk [11]. The aim is to significantly shorten and improve the sea route to the Baltic Sea. The idea to build a new strait between the sea and the lagoon is not new; it was first proposed in 1577. Over the years, the idea was often returned to [12,13], but the final decision was made in 2017 when the President of Poland signed a special act regarding the Vistula Spit cut. Nowy Świat (Figure 1) was chosen as the location of a new canal with a lock. According to this act, the canal is to be 1.1 km long, up to 80 m wide, and 5 m deep. In addition to the creation of an independent connection of the Polish part of the Vistula Lagoon with the Baltic Sea, there are some additional arguments for building the Strait of Nowy Świat. The first is the increased possibility of using the sea port in Elbląg. Moreover, due to the possibility of opening the canal for outflowing water in case of an accumulation and rise of water in the southern part of the Vistula Lagoon, the flood risk for the polders of the lowland areas of Żuławy Elbląskie can be potentially limited. In order to assess the impact of the artificial strait in the Vistula Spit on the storm surges in the Vistula Lagoon, a numerical simulation is needed. This paper presents the mathematical modelling of the hydrodynamics of the Vistula Lagoon, based on the solution of shallow water equations (SWEs) considering wind stresses.
2. Mathematical Model and Solution Method
Mathematical modelling of the Vistula Lagoon hydrodynamics and mass transport has been developed over the last 35 years. In the first period, two-dimensional models were built and used to predict floods that can occur in the Żuławy Elbląskie lowland areas during the winter storm season. They were useful prediction tools for water level forecasts in the lagoon [14,15]. In the next period, from 1994 to 2001, complex 2D models composed of hydrodynamics, water quality, and eutrophication modules were used for the modelling of hydrobiological and hydrochemical processes in the Vistula Lagoon [16,17,18,19]. Starting from the beginning of the 21st century, 3D water flow and mass transport models were applied to simulate the Vistula Lagoon hydrodynamics and migration phenomena [8,20,21]. These models were used for cases when the vertical variability of flow currents and the distribution of mass had to be considered. Such an approach can be necessary to model the hydro-sedimentary processes in lagoons and enclosed bays, for example, sand transport or contaminant migration [22]. However, in the case of storm surges driven by winds, mass (water volume) conservation plays the main role and the vertical variation of flow parameters can be neglected. Therefore, a 2D model seems to be sufficient to simulate the problem described in this paper. Moreover, the problem of the influence of a second connection between the Gulf of Gdańsk and the Vistula Lagoon has not been investigated intensively so far. The first numerical approach to this problem was proposed in [23]. Recently, some numerical simulations of the hydrodynamics of the lagoon in view of the artificial canal through the Polish part of the Vistula Spit have been analyzed in [21].
In the numerical analysis presented in this paper, the 2D SWEs model is used to simulate the impact of the artificial canal in the vicinity of Nowy Świat, where the Vistula Spit cut is planned. The application of this model is reasonable since the assumption of a uniform vertical distribution of horizontal velocities is satisfied. Although the measurements carried out in the lagoon [8] show that due to strong winds the vertical velocity distributions are not quite uniform, the SWEs model is sufficient to describe the water surface movement and horizontal circulation neglecting the vertical accelerations, which was confirmed with the previous satisfactory simulation results [14,24,25].
The set of shallow water equations can be written as:
where: x, y—spatial coordinates; t—time; U, V—depth-averaged components of velocity in the x- and y-direction, respectively; |W| = (U2 + V2)1/2—modulus of the velocity vector; h—water elevation above some plane of reference; H—water depth; g—acceleration due to gravity; n—Manning friction coefficient; v0—coefficient of horizontal turbulent viscosity; Tx—wind stresses in the x-direction; Ty —wind stresses in the y-direction.
The system of partial differential Equations (1)–(3) for the imposed initial and boundary conditions can be solved by different numerical techniques. Some applications of the finite difference method (FDM) [26], finite element method (FEM) [27], and finite volume method (FVM) [28] were used, for example, to numerically integrate the SWE in space. In general, the main disadvantages of numerical methods used to solve 2D problems are the large dimension of the system of algebraic equations if implicit time integration schemes are applied, or the long computational time (small time integration step) if explicit schemes are used. In order to avoid these disadvantages, the two-dimensional problem can be split into a sequence of two one-dimensional problems, which can be solved efficiently in an implicit way. Here, the idea of the splitting technique presented in [24] was adapted. For this approach, the set of Equations (1)–(3) can be written in the matrix notation as follows:
where: C = (U, V, h)T; and F—vector containing all the terms of (1-3) except time derivatives. The solution of this equation can be obtained by integration in the time increment (t, t + Δt). The general integration formula is:
In the mentioned splitting method, the vector, F, is expressed as a sum of vectors:
where:
Finally, Equations (1)–(3) can be written as:
Following [24], for the time increment (t, t + Δt), one can obtain a solution of Equation (4) by the successive solution of the following equations:
with the initial condition, , and:
with the initial condition, . The final solution at the time (t + Δt) is . The accuracy of the method depends on the accuracy of the methods applied for the solution of the Equations (10) and (11). Here, they were integrated using the method to solve the 1D unsteady flow equations proposed in [29].
In order to solve the set of Equations (1)–(3) the initial and boundary conditions are needed. In general, the following initial conditions are prescribed: For time, t = t0, in the functions, U(x,y,t0) = U0(x,y), V(x,y,t0) = V0(x,y), h(x,y,t0) = h0(x,y). The boundary conditions depend on the boundary type. At open boundaries, where flow occurs, a velocity normal (N) to the boundary, WN = W(t), or the water level, h = h(t), is forced (the second condition was used in the simulations presented in the paper). At the same time, a velocity tangential (T) to the boundary is forced equal to zero (WT = 0) and a ‘free slip’ exists (δWT/δn = 0). At closed (impermeable) boundaries, normal velocity is set to zero, WN = 0, and tangential velocity can be zero, WT = 0, or a ‘free slip’ can be assumed.
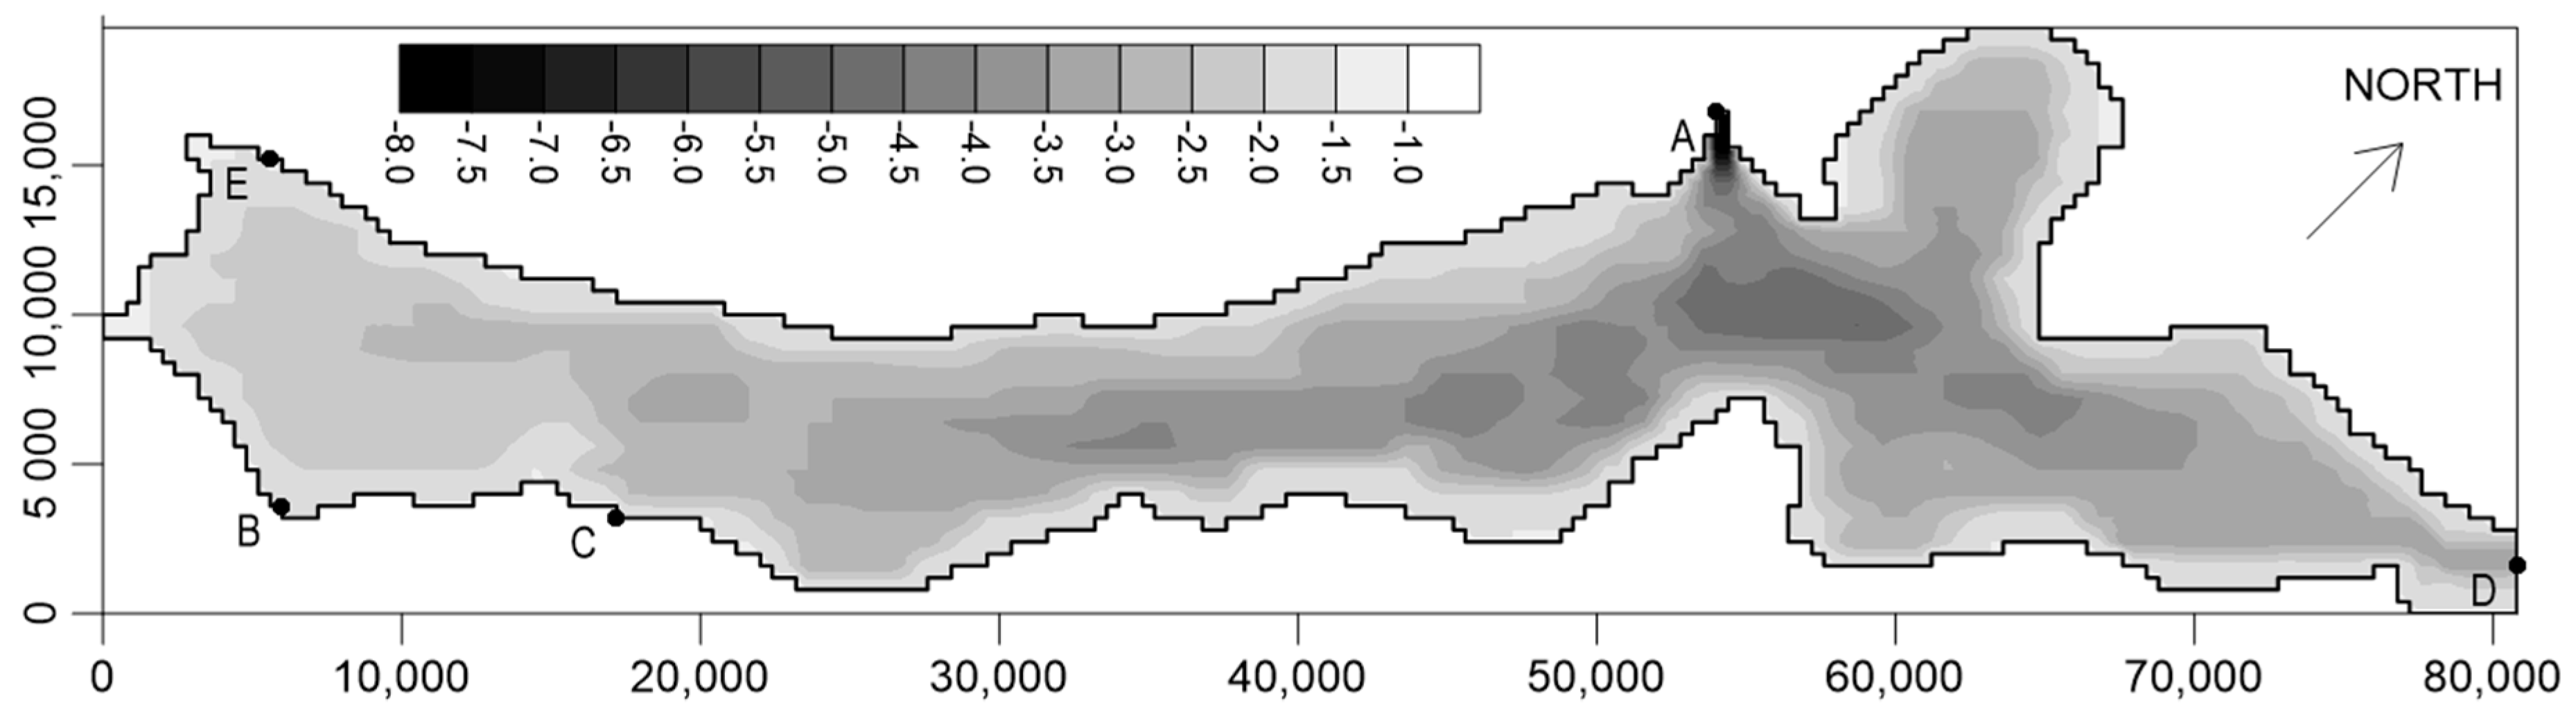
The SWE model (1–3), solved by the described technique, was applied to simulate an unsteady flow in the Vistula Lagoon. A structured square numerical mesh of grid dimensions, Δx = Δy = 400 m, was applied to represent the lagoon (the lowland areas of Żuławy Elbląskie are not included directly in the model). The contour of the mesh representing the flow area is shown in Figure 4. The archival bathymetry data [9] (Figure 4) was used for the simulations. The coordinate system with a vertical datum based on the Baltic Sea level (0.0 m a.s.l., Kronstadt) was rotated 45° clockwise. For all numerical cases, the initial conditions were determined by the hydrostatic state, with the horizontal water table corresponding to the initial water level in the Gulf of Gdańsk and the Strait of Baltiysk. The boundary conditions were chosen in the following way. At open boundaries, where connections of the Vistula Lagoon with the Gulf of Gdańsk exist, the sea water level (representing storm surges) was forced together with null velocity tangential to the boundary. Such a condition represents the variation of the sea level. The water discharge in a direction normal to the cross-section of the strait was always calculated based on the actual value of normal velocity and the water depth. The same type of boundary condition was imposed for the existing Strait of Baltiysk (Figure 4, point A) as well as for the artificial canal in Nowy Świat (Figure 4, point E) while it was analyzed. The other boundaries are located along the shore line of the lagoon and they were treated as closed boundaries with a ‘free slip’ condition. The inflow of rivers entering into the lagoon was neglected.
3. Results and Discussion
There are 10 numerical simulations presented in this section for different conditions and scenarios. The overall data for each case study is shown in Table 2.
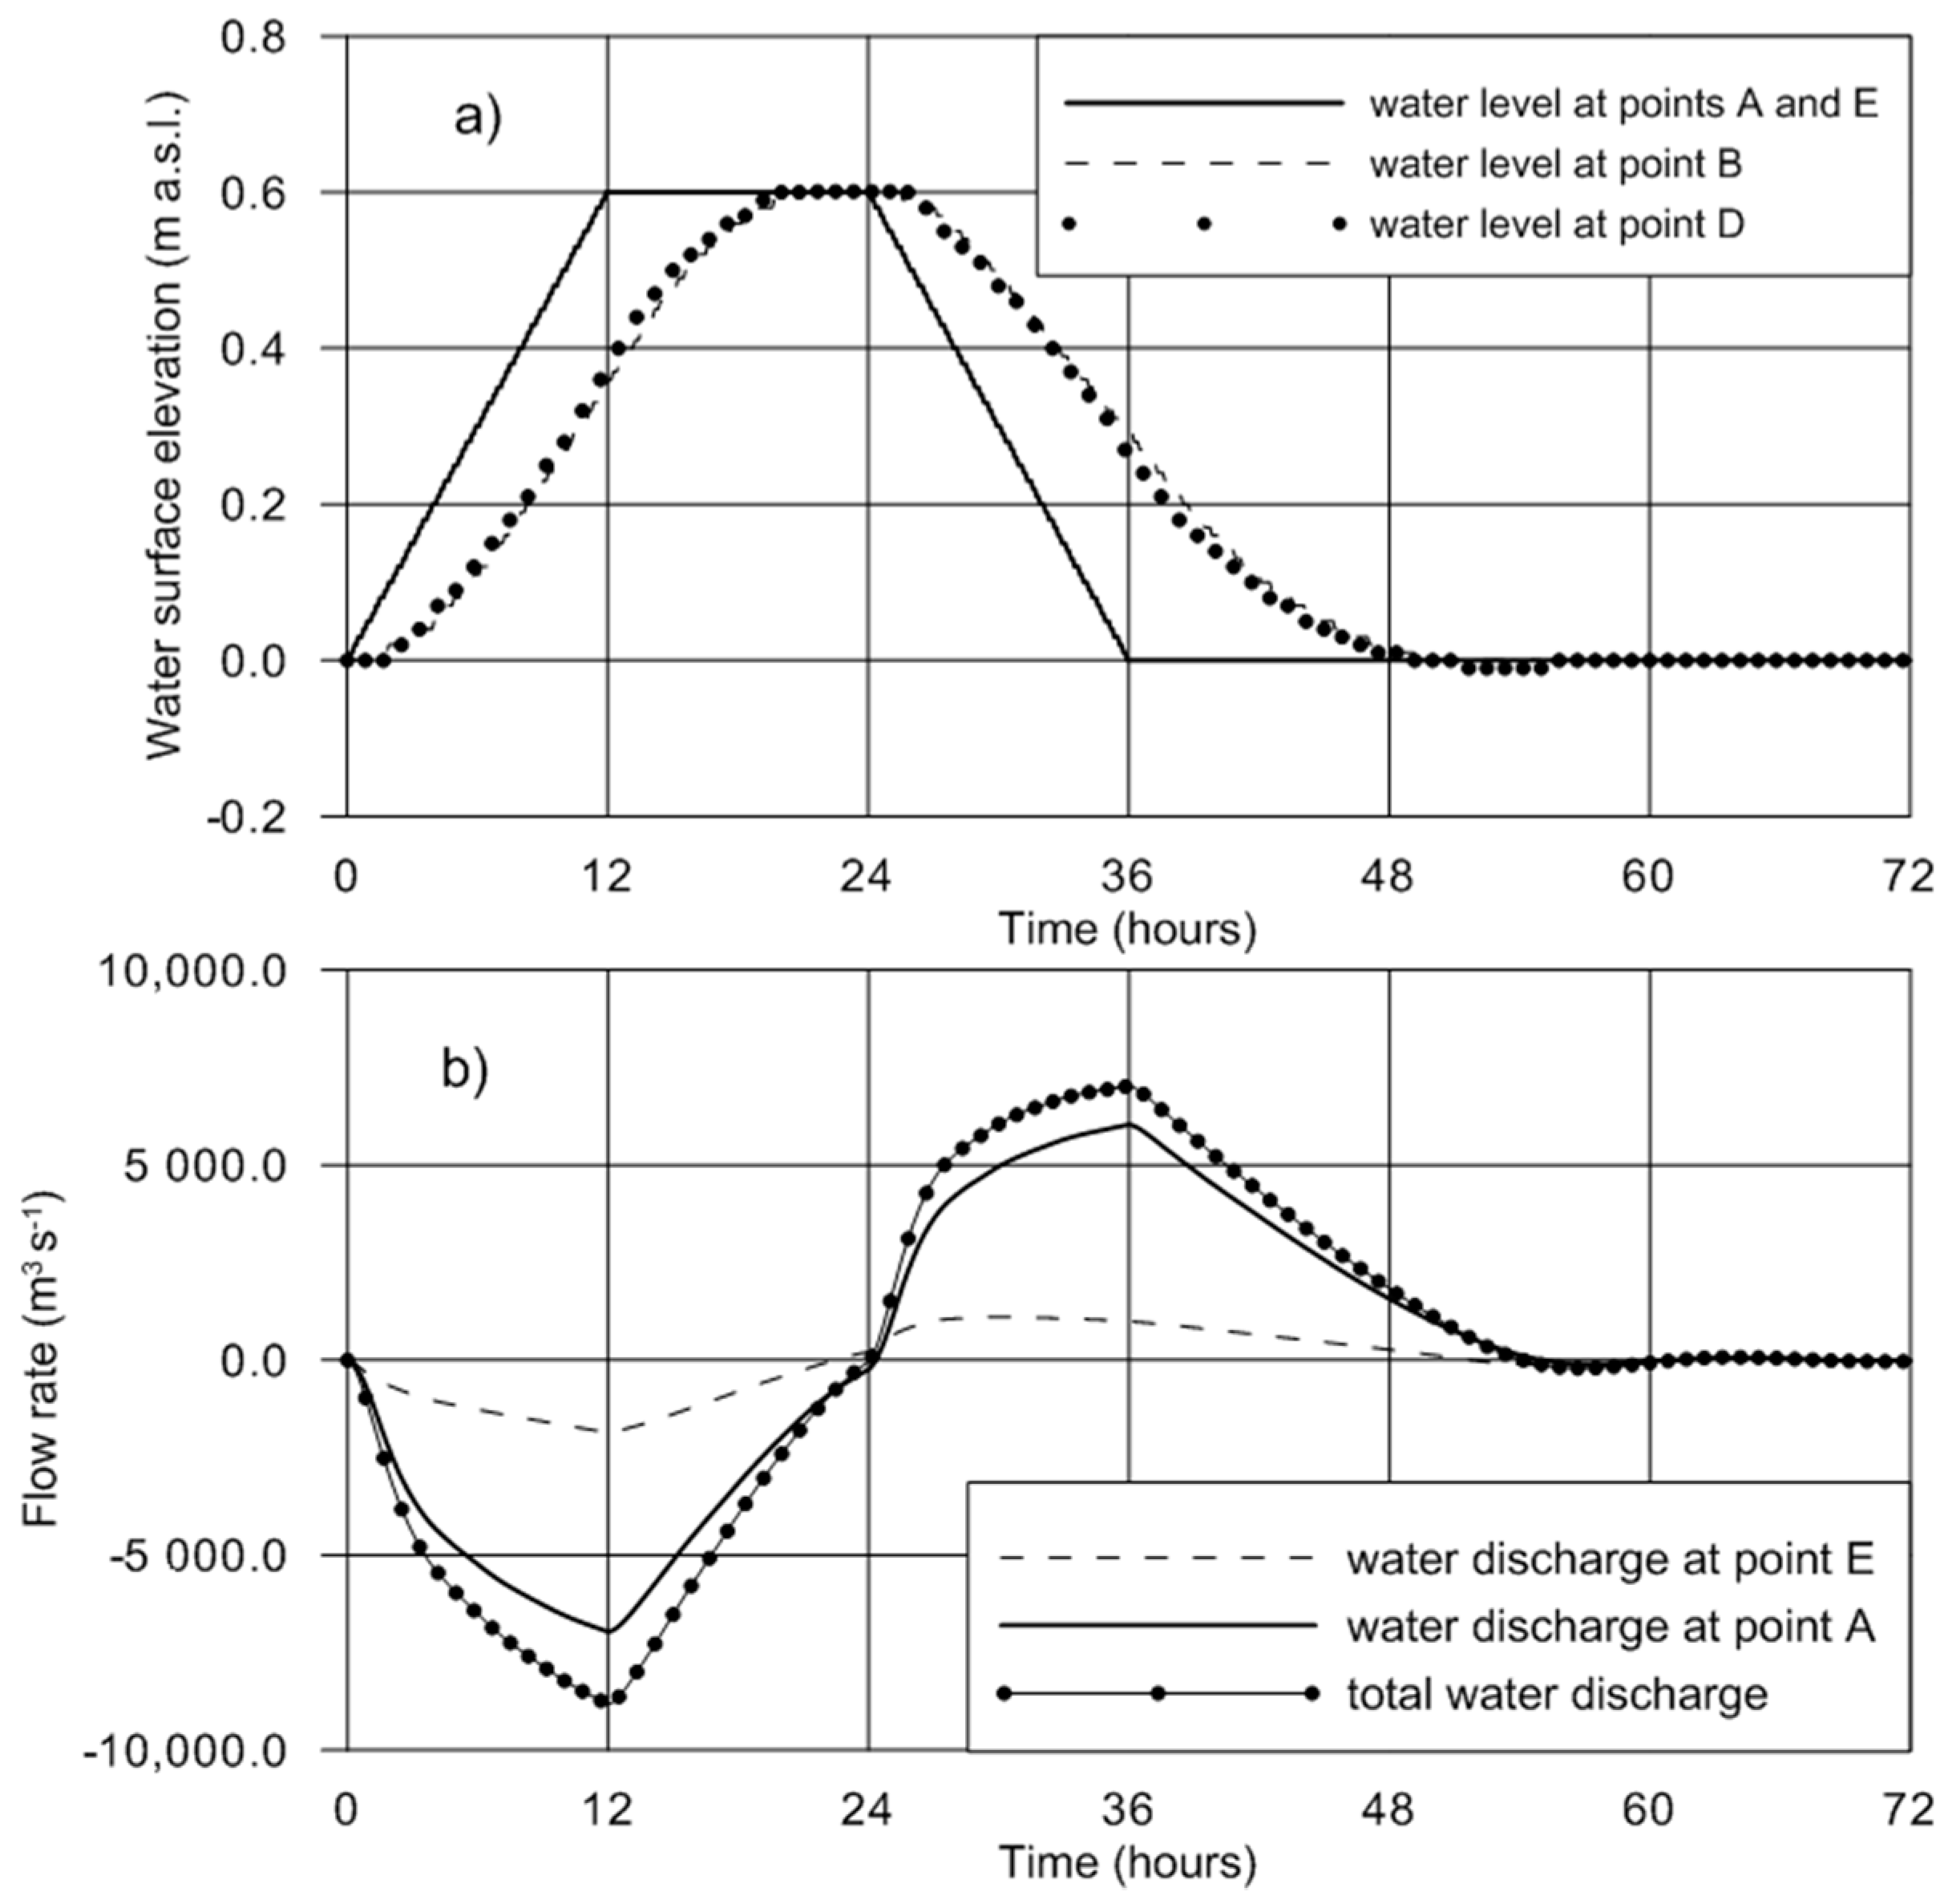
To investigate the influence of sea tides on the water exchange between the Gulf of Gdańsk and the Vistula Lagoon, and to test the boundary conditions imposed at the open boundaries of the strait, a numerical experiment was carried out for the hypothetical change in sea level without wind action. Two variants, first without and then with the new opening in the Vistula Spit, were simulated. The variation of the sea level forced as a boundary condition is shown in Figure 5. Such a boundary condition makes the Vistula Lagoon fill with sea water starting from the mean sea level (0.0 m a.s.l.) and then empty to the initial state. In the same figure, the evolution of the water surface elevation at Nowakowo (point B, Poland) and Kaliningrad (point D, Russia) is presented while only one strait is considered (point A). It can be observed that the whole lagoon fills with water up to 0.6 m a.s.l. after 24 h. The same effect was presented in [9]. Moreover, it is visible that the Russian end of the lagoon (point D) fills and empties quicker than the Polish end (point B), which is a result of the difference in the distance from the Strait of Baltiysk.
The change in the simulated water discharge through the Strait of Baltiysk is also shown in Figure 5. The negative and positive values of the flow rate represent the inflow to and outflow from the lagoon, respectively. The total volume of inflow was estimated to equal 420,031,200 m3 and the total outflow was 420,733,800 m3. The difference between the volumes is about 0.17%, which proves the good mass conservation in the model. Unfortunately, it is not possible to verify the discharge calculation for hypothetical cases nor real flow events, due to the lack of flow rate or velocity measurements in the strait. However, the total volume exchange can be compared to the volume of the lagoon for the given water depth. The area of the structural, rectangular numerical mesh applied in the simulation is equal to 698,960,000 m2. If the water layer of a thickness of 0.6 m is considered, the total volume of water in the lagoon is equal to 419,376,000 m3. This value is close to the volume of inflow and outflow during the filling and emptying processes.
In the second numerical simulation, two straits were considered. The new strait (point E) was assumed to have a cross-sectional area equal to 400 m2. The same boundary condition was imposed for the new strait (point E) as for the existing one (point A). It can be observed (Figure 6) that with the same situation in the sea, the full filling of the lagoon is faster than before (after about 18 h). This is due to the additional opening in the spit. Moreover, it can be seen that for the given boundary condition, the lagoon stays fully filled with water for a longer time than for the previous situation. Finally, it can be found that the different parts of the lagoon fill at the same time.
The influence of the new connection between the gulf and the lagoon can be investigated in Figure 6 as a variation of the water discharge through the straits. A similar flow rate time distribution for both straits can be observed. However, because of the greater cross-sectional area, the discharge through the Strait of Baltiysk is always greater than through the hypothetical new canal. For the maximum inflow to and outflow from the lagoon, the ratio of the flow rates is 0.27 and 0.16, respectively. Of course, the division of the discharge is not constant and depends on the actual situation in the sea and the lagoon. Moreover, the hydraulic characteristics of the new strait as an artificial hydraulic structure, and its mode of work are not known at this moment because there is only a general concept of the canal with no information about the construction details. Because of this, the calculated flow rate ratio can be considered as an approximate value.
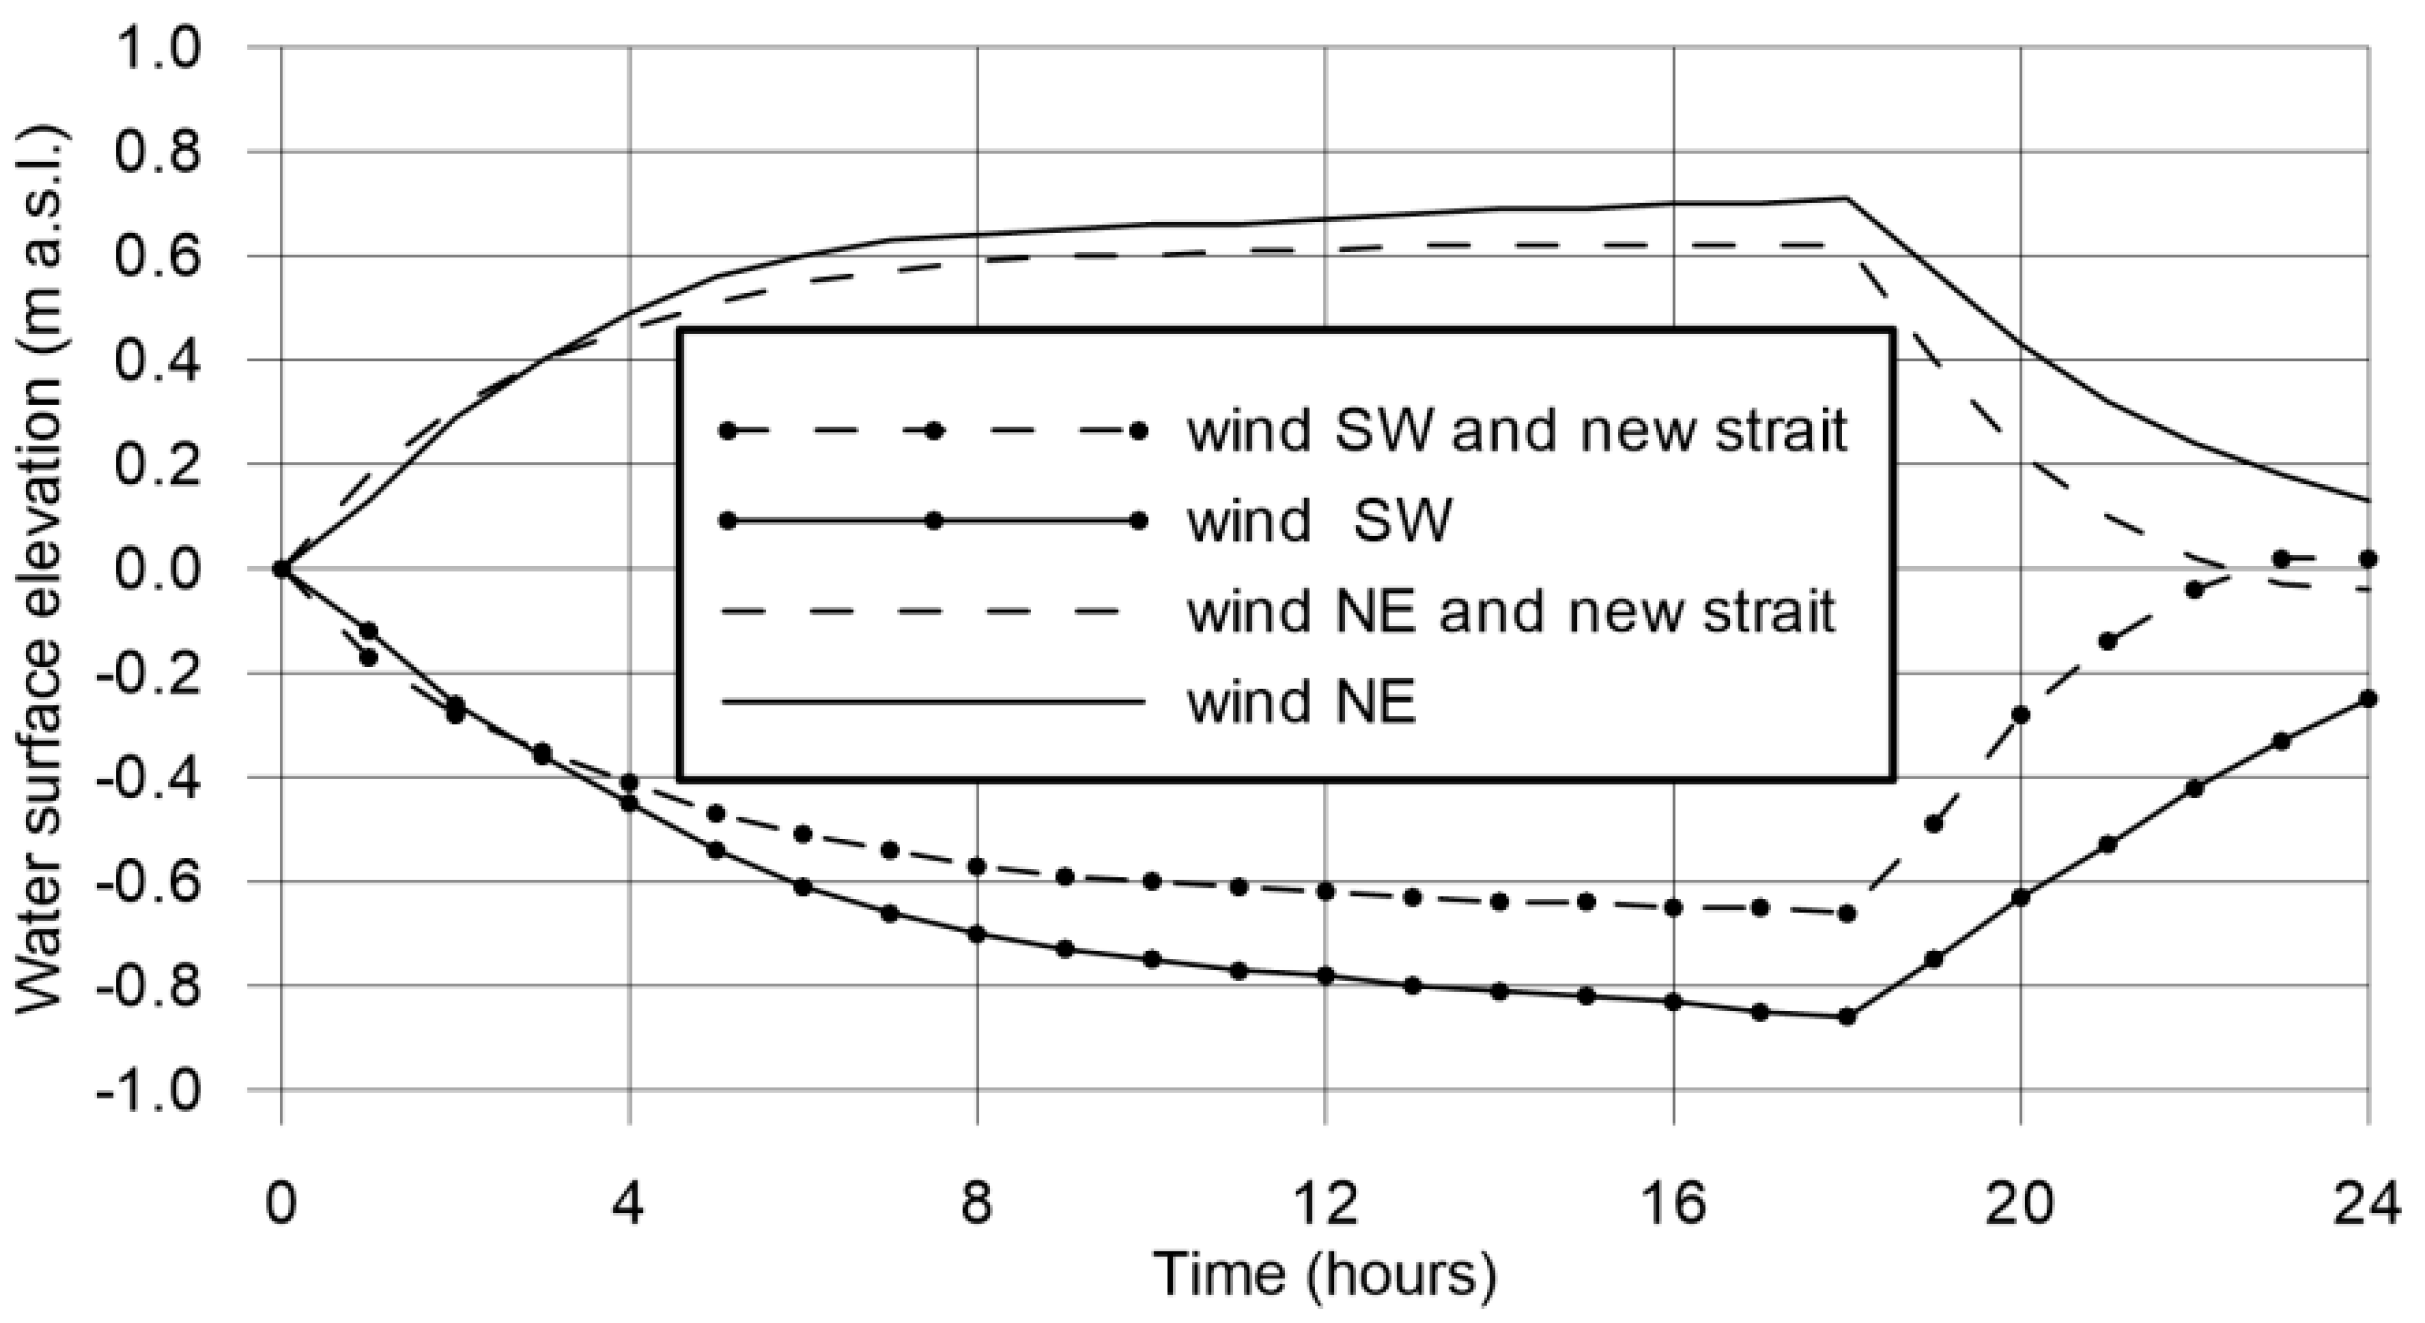
In the second step, in order to assess the impact of the new artificial connection between the lagoon and the sea on the variation of the water level in the lagoon, several numerical simulations with wind action were carried out. First, two hypothetical case studies of strong constant winds blowing along the lagoon axis were simulated. Two scenarios of a storm surge were analyzed, induced by constant NE and SW winds, respectively. Calculations were made for the following data—the water level in the Gulf of Gdańsk is constant at the mean sea level (0.0 m a.s.l.) and the wind has a constant velocity of 12 m s−1 from NE and SW, respectively, over the whole area of the lagoon for the first 18 h of simulation. Then, the wind stops and the total time of flow simulation is 24 h. For each scenario of the synthetic hydro-meteorological situation, two variants of lagoon configuration were considered—without and with the new opening in the Vistula Spit. The results of the computations after 12 h of flow simulation are shown in Figure 7, Figure 8, Figure 9, Figure 10, Figure 11, Figure 12, Figure 13, Figure 14 and Figure 15.
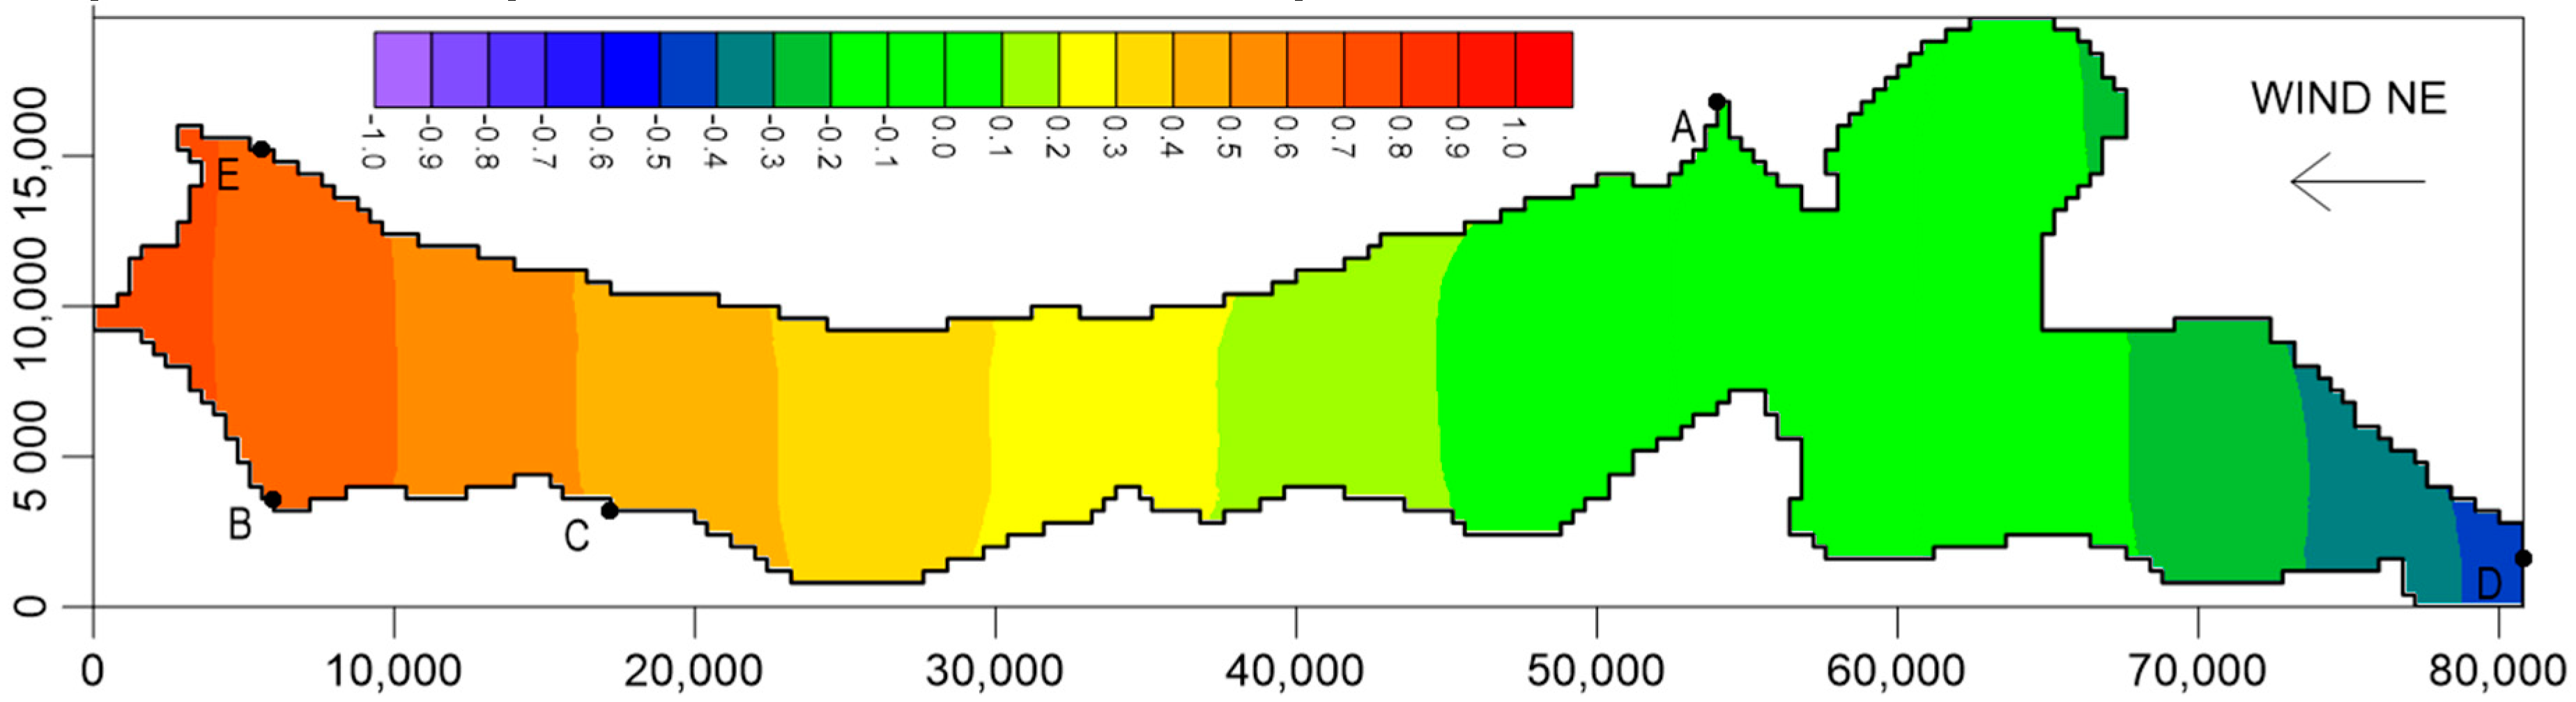
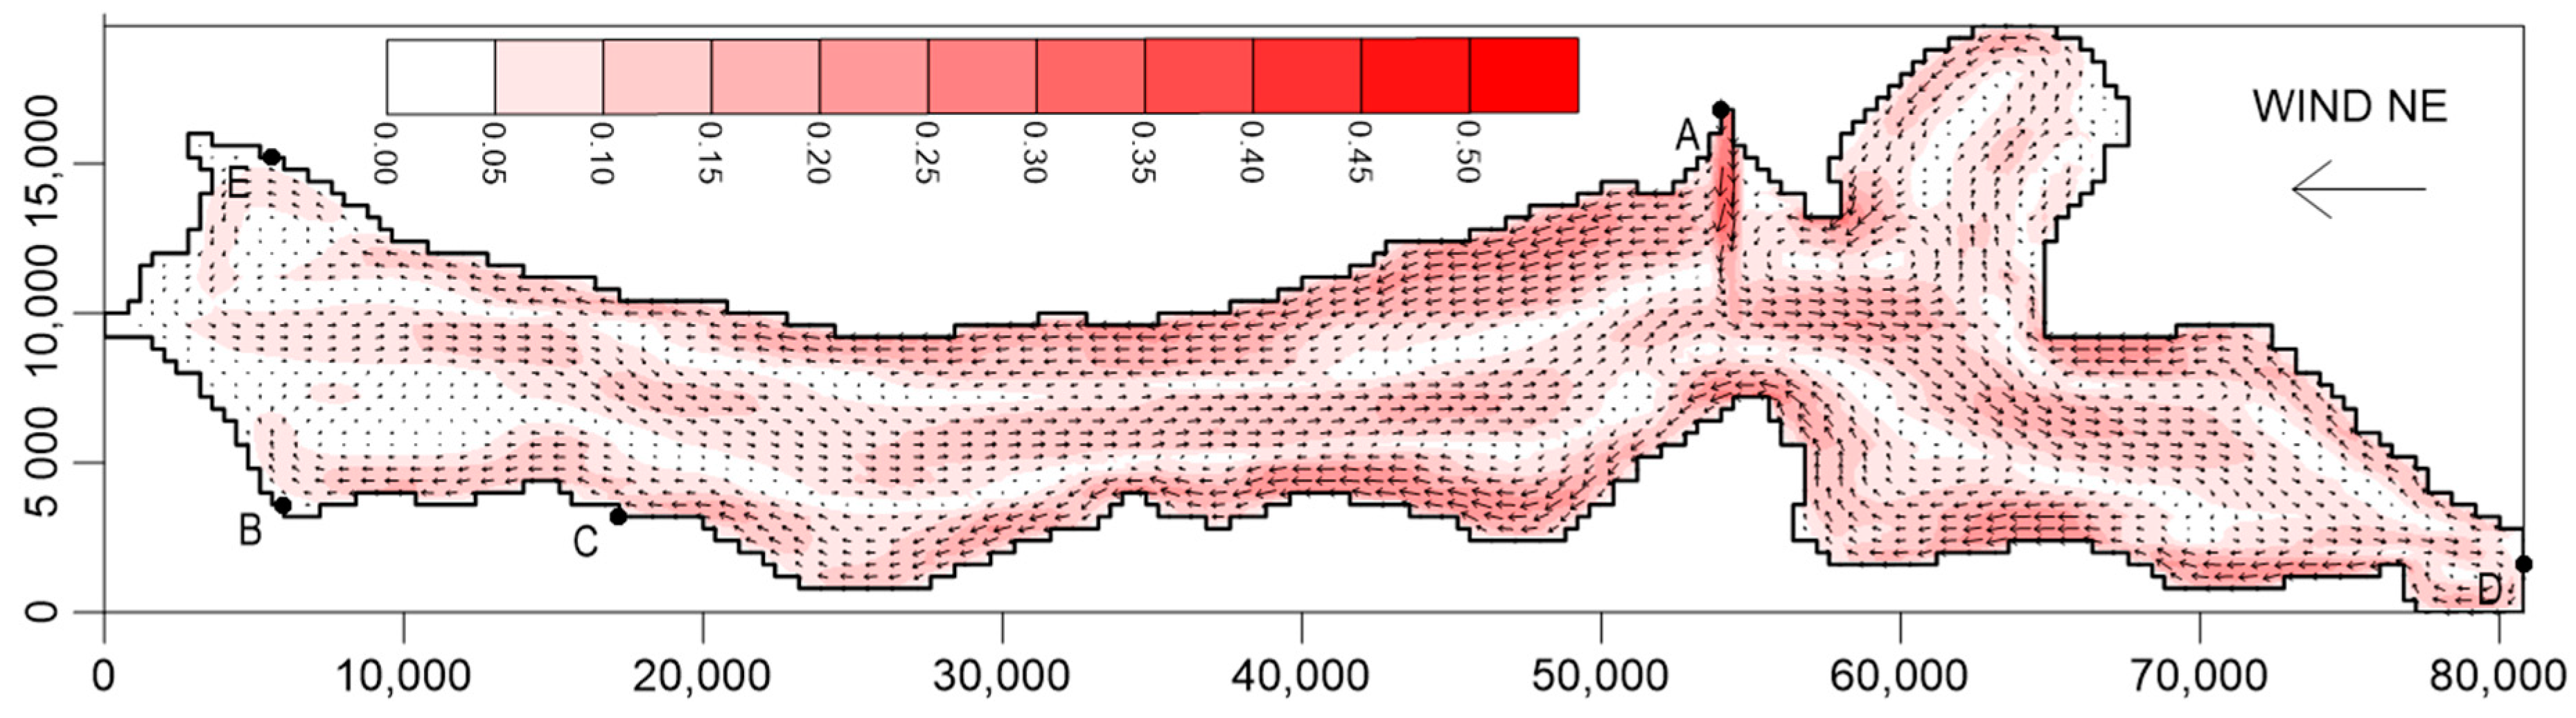
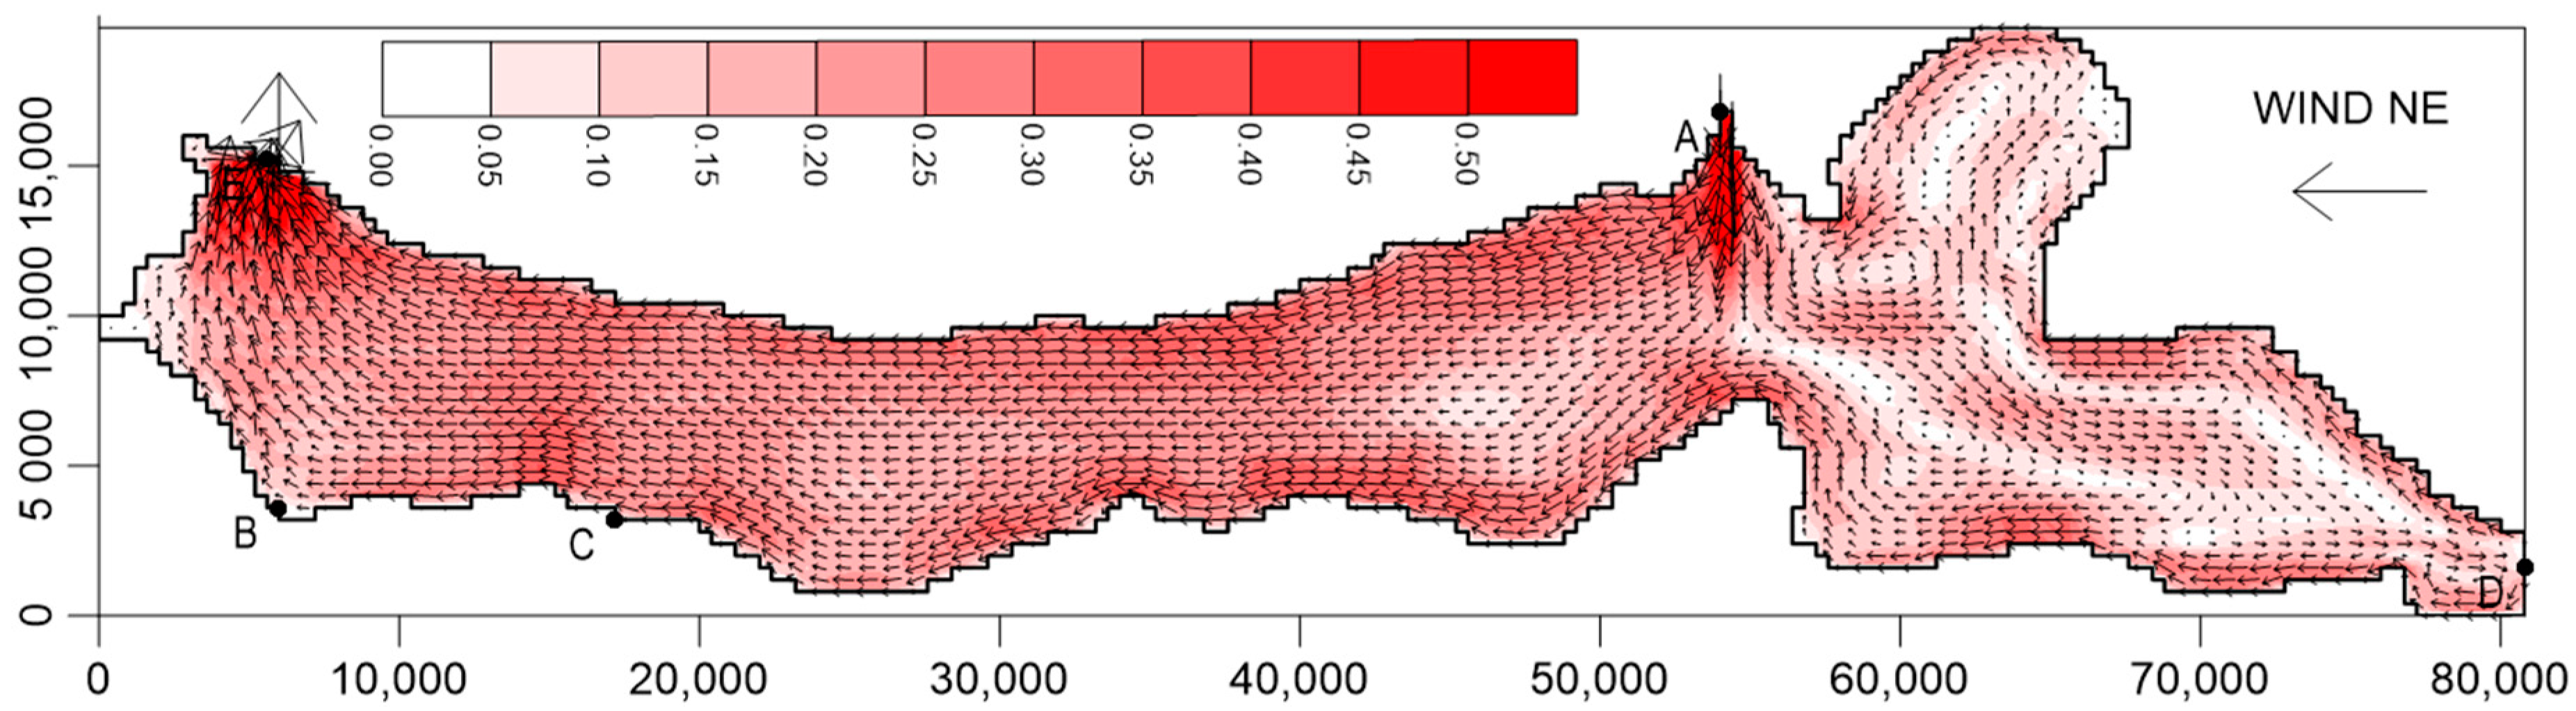
In Figure 7 and Figure 8, the calculated water levels and flow velocity fields for a NE wind with no strait in the Polish part of the lagoon are presented. The very regular shape of the water table can be seen as the current state. A significant increase of the water level is observed in the SW part of the lagoon, exceeding 0.8 m a.s.l. near points B and E (Figure 7), which makes flooding in the Żuławy Elbląskie polder area possible. At the NE end of the lagoon, a water table decrease below −0.5 m a.s.l. is calculated at the same time. The flow circulation is the result of the water inflow through the Strait of Baltiysk (point A). The main stream of sea water is split and circulations occur in each part of the lagoon. It can be seen that in the main part of the lagoon, the water flows in a SW direction along the shore and returns in a NE direction along the main axis. An area of water flow stagnation with very low velocities can be seen in the Polish part, in the vicinity of Elbląg (point B) and the Vistula Spit (point E).
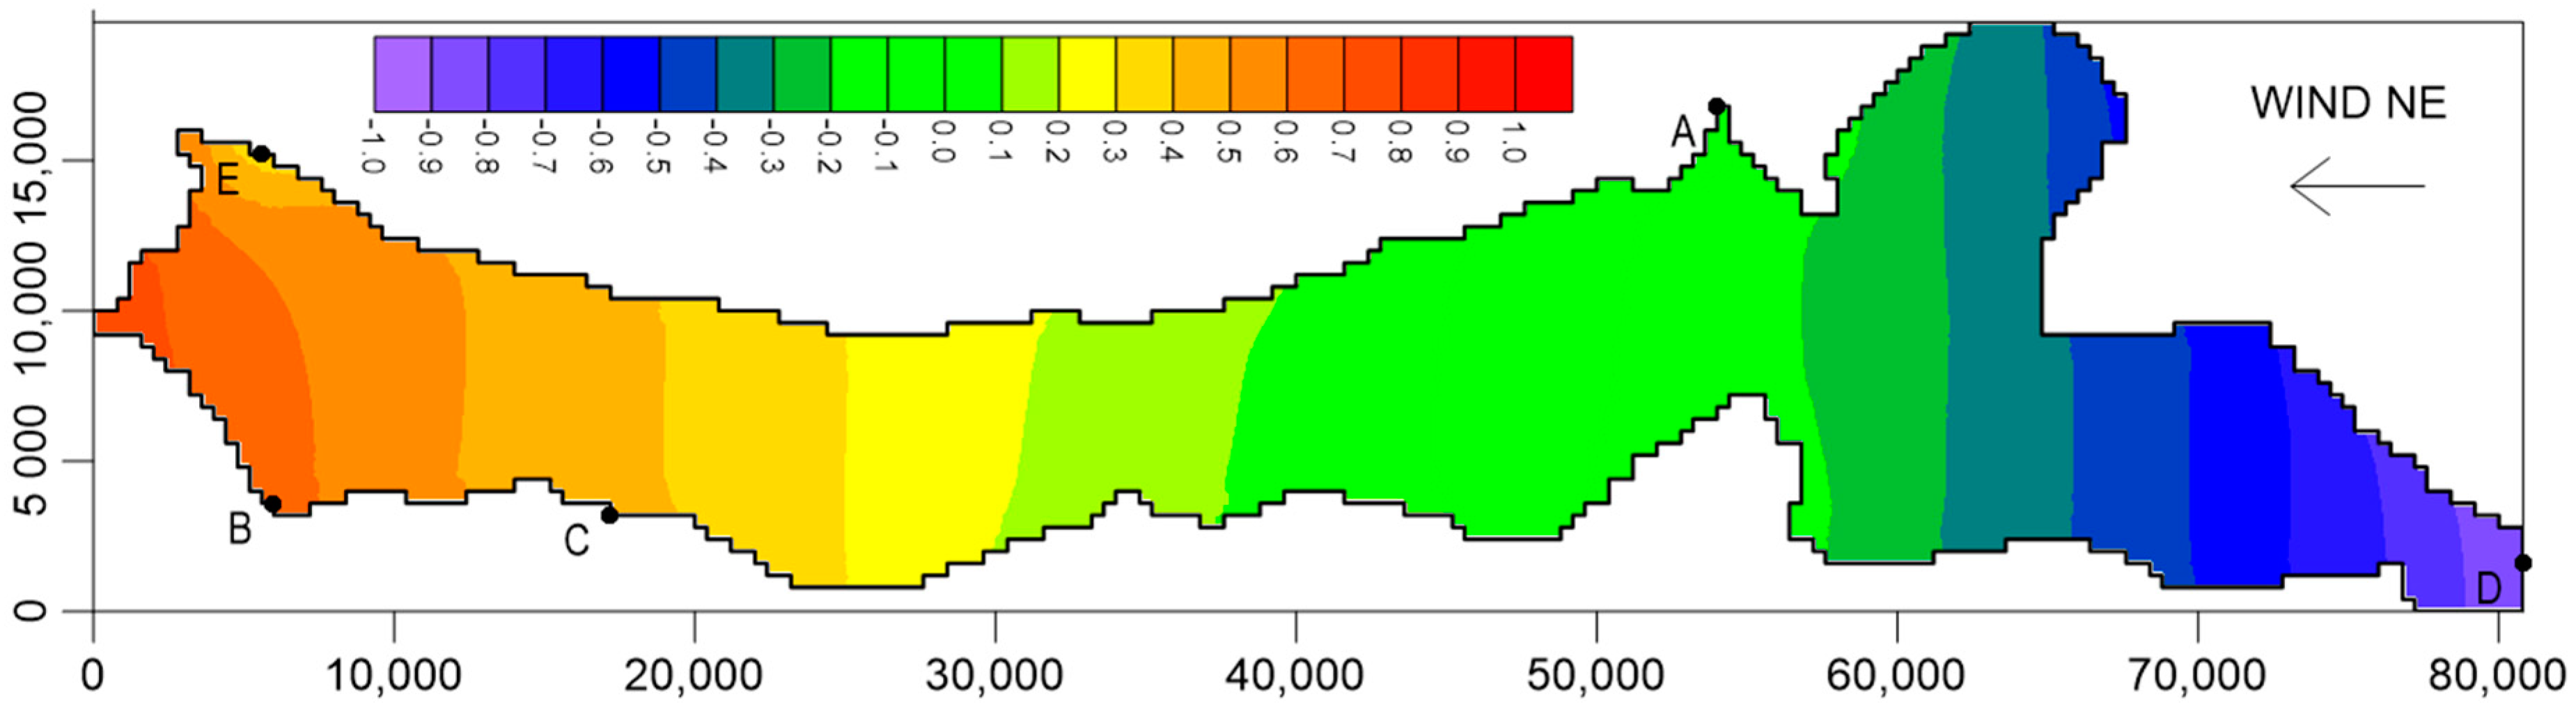
Figure 9 and Figure 10 present the situation for a NE wind and when considering the new strait (point E). If the additional connection between the sea and lagoon is implemented, the hydrodynamic conditions of the Vistula Lagoon are changed. Again, the regular shape of the water surface can be observed, but the damming of water at the Polish side of the lagoon is less than previously. However, the lowering of the water table in the Russian part (point D) is greater. The new strait results in a local water surface depression around point E and a significant modification of the flow circulation. In this new situation, the lagoon has become open, with the possibility of water inflow through the Strait of Baltiysk (point A) and outflow through the new canal (point E). Moreover, there is no water stagnation in the lagoon and flow velocities are higher.
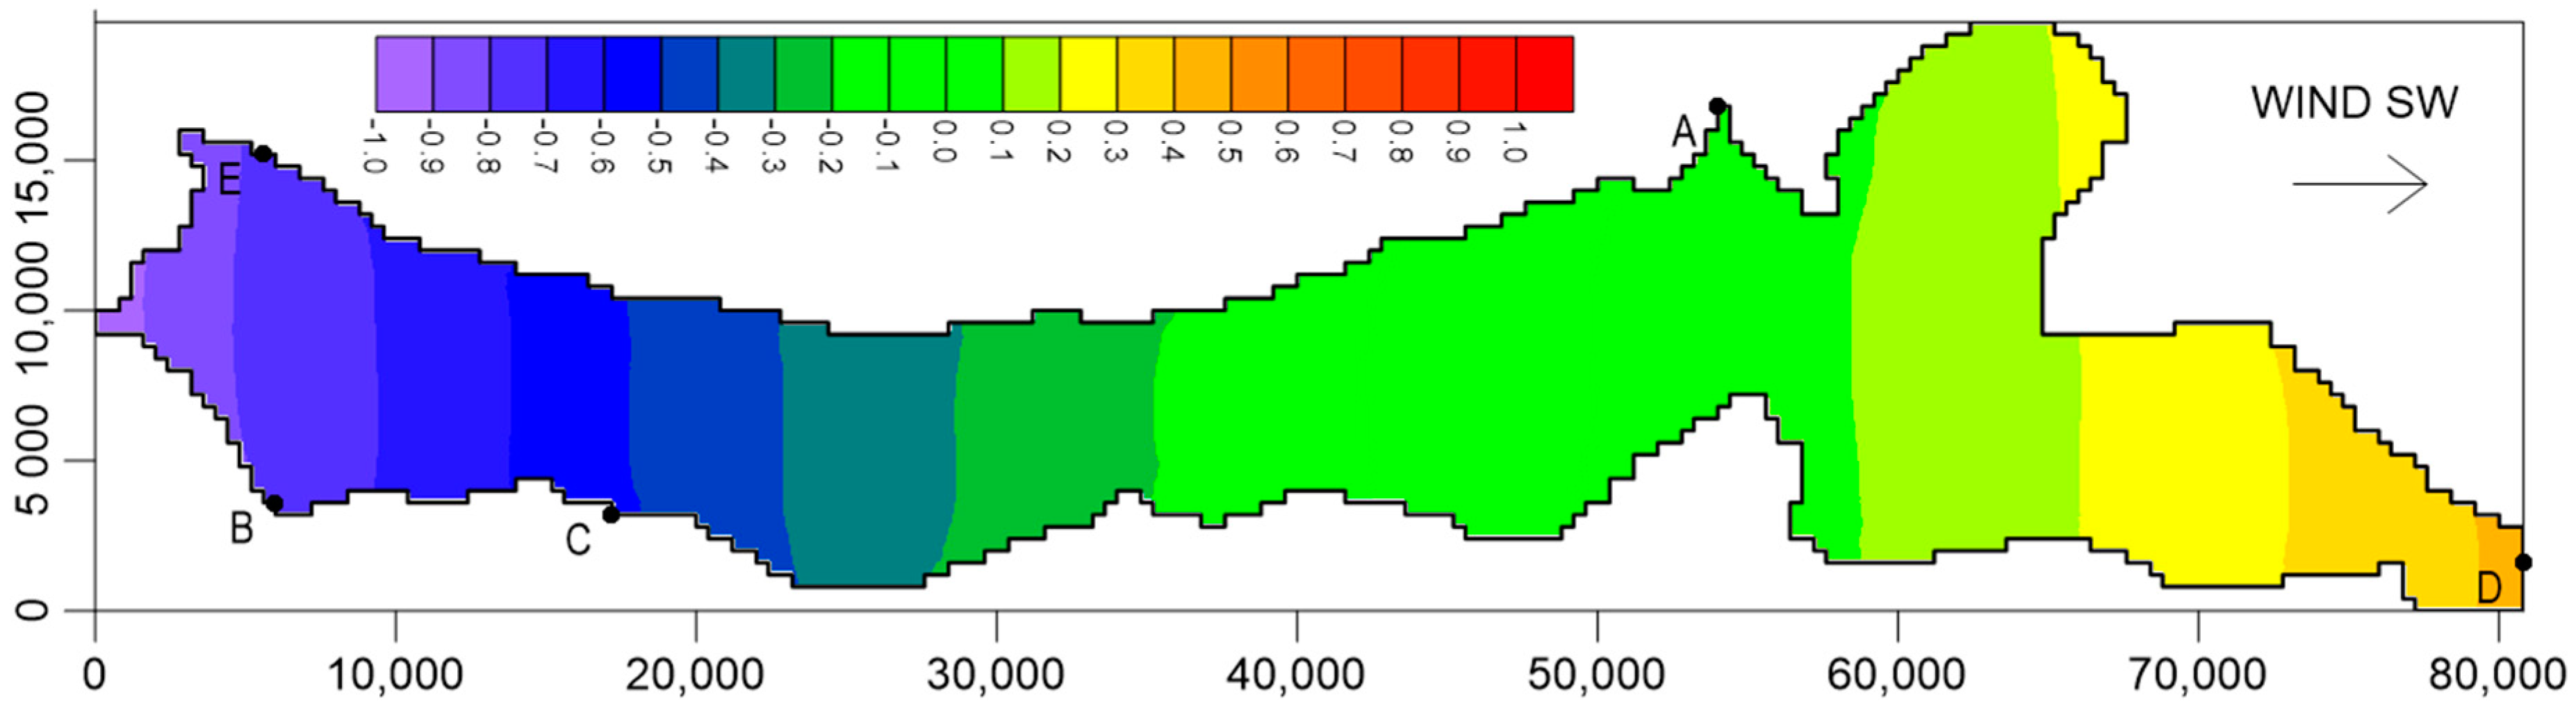
In Figure 11 and Figure 12, the calculated water level and flow velocity fields for a SW wind without the new strait are presented. Similar to the results obtained for the NE wind, the shape of the water free surface (Figure 11) is regular, but for the assumed meteorological conditions, the highest water level (above 0.4 m a.s.l.) is calculated at the Russian (NE) part of the lagoon (point D), while the lowest one (below −0.9 m a.s.l.) is observed at the Polish (SW) side of the lagoon (points B and E). The outflow of water into the sea through the Strait of Baltiysk (point A) was simulated for the given situation (Figure 8). Again, the area of water flow stagnation can be seen at the Polish end of the lagoon (points B, C, E).
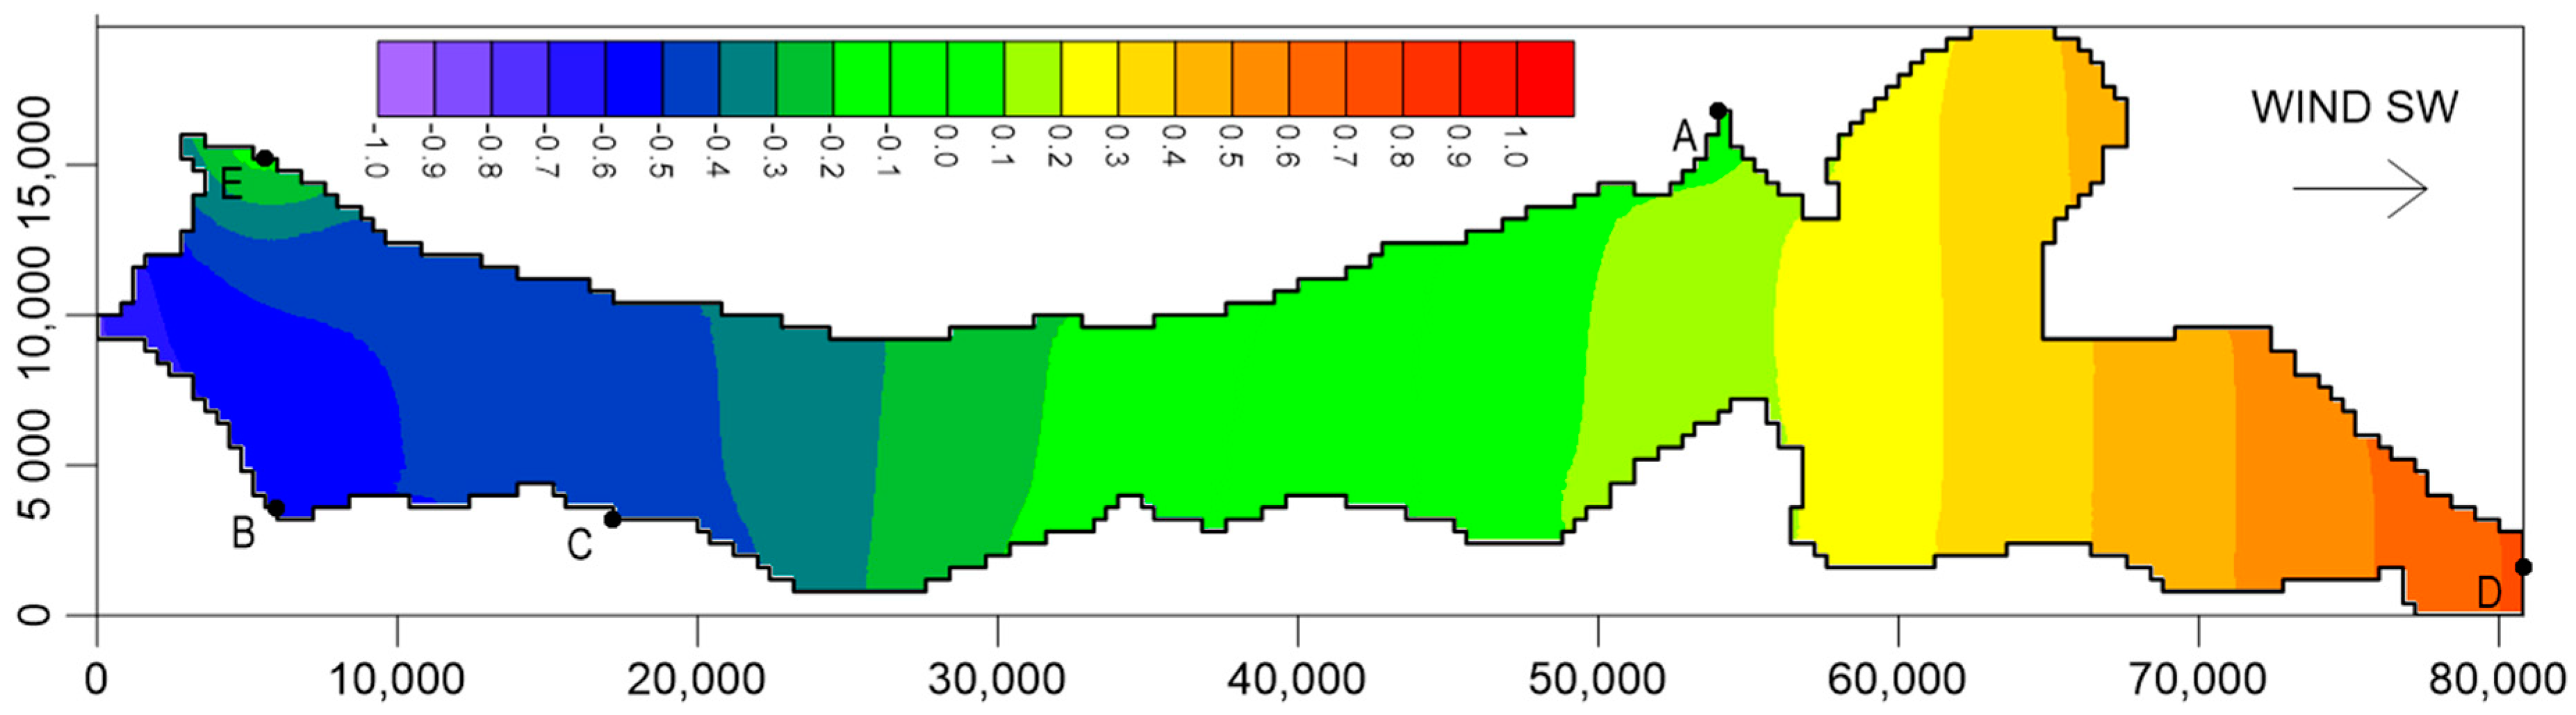
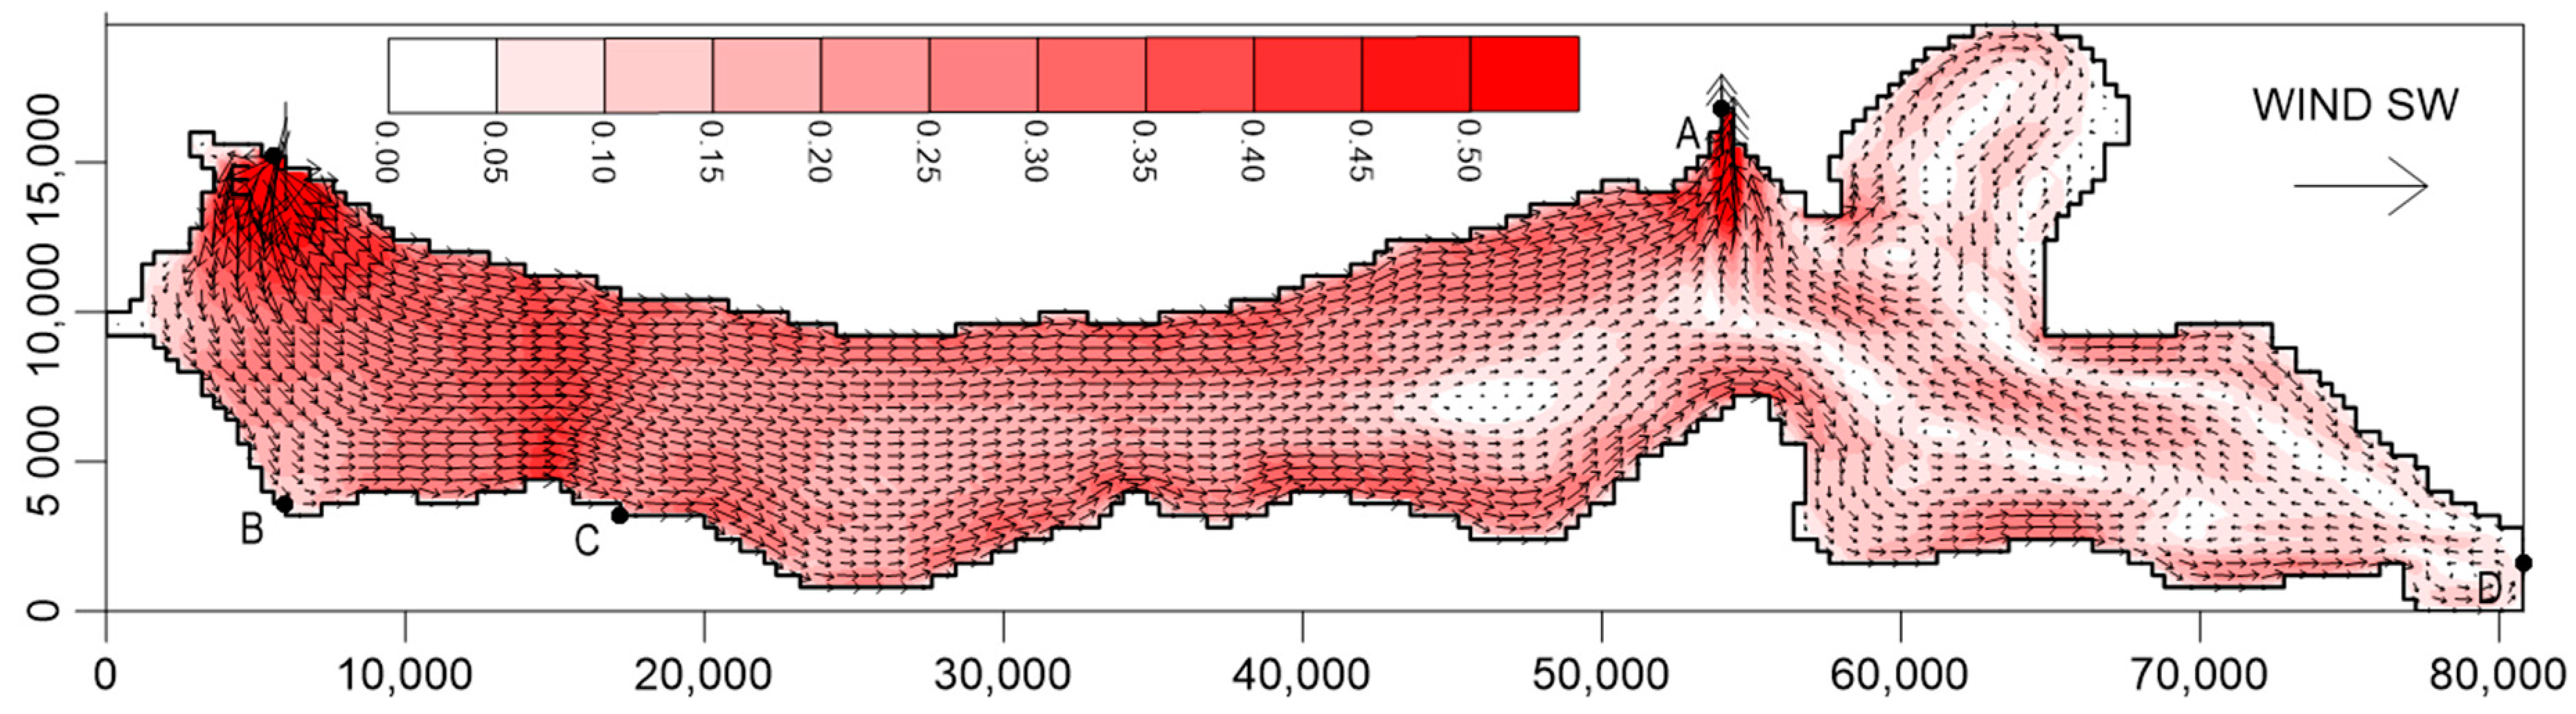
The results obtained for the same wind conditions, but with the consideration of both straits in the spit are shown in Figure 13 and Figure 14. As in the previous case, after connecting the Vistula Lagoon to the Gulf of Gdańsk with two openings to the sea, the hydrodynamic conditions of the lagoon are strongly modified. First, the water table increases, reaching 0.7 m a.s.l. in the Russian part of the lagoon. At the same time, the water level is raised to about −0.7 m a.s.l. in the vicinity of Elbląg (point B). Near the new strait (point E), the water table is higher due to the inflow of sea water through the open canal. The transformation of the velocity field is also significant. In contrast to the case of only one connection, one can observe the inflow and outflow of water through the new and existing straits, respectively. Such a situation allows the lagoon to be filled with fresh sea water and avoid water stagnation.
The variation of the water level in time at the Polish side of the Vistula Lagoon in the area of Elbląg (point B) is presented in Figure 15. It can be seen that the new opening between the sea and the lagoon reduces the amplitude of the water stages at this location. The maximum water level observed for the NE wind is decreased by about 0.1 m for the assumed conditions, while the minimum water stage in this area is increased by about 0.2 m for the SW wind. The lowering of the water level during a storm surge is particularly important at this location due to the reduction of the flood risk in the polders on Żuławy Elbląskie.
Żuławy is a substantial part of the Vistula Delta. It is a lowland area, including a depression reaching almost 2 m below sea level. The lowest point, 1.8 m below the surface, is located by Drużno Lake (Figure 1), making that terrain the lowest point in Poland. Nearly one third of the overall delta area lies below sea level. The Żuławy depression is the most important polder complex in Poland, consisting of 122 polders measuring 1200 km2, a large number of embankments, 125 automatic pumping stations, as well as irrigation and drainage facilities [30]. The Żuławy polders comprise one of two regions of the Polish coast considered to face the greatest threat of partial or full land loss and associated material and social costs. Therefore, these areas require intensive care and protection efforts.
In order to investigate and discuss the potential impact of the new strait (point E) in the Vistula Spit on the reduction of high water levels in the lagoon, two numerical simulations were carried out for real (observed) data. These two episodes differ from each other regarding wind parameters and, what is important, the range of sea level changes. In the first case, the sea level changes slightly and remains below the mean sea level, while in the second case, the sea level of the Gulf of Gdańsk rises to over 1.0 m a.s.l. In both cases, storm surges were simulated without taking into account tides that are negligibly small.
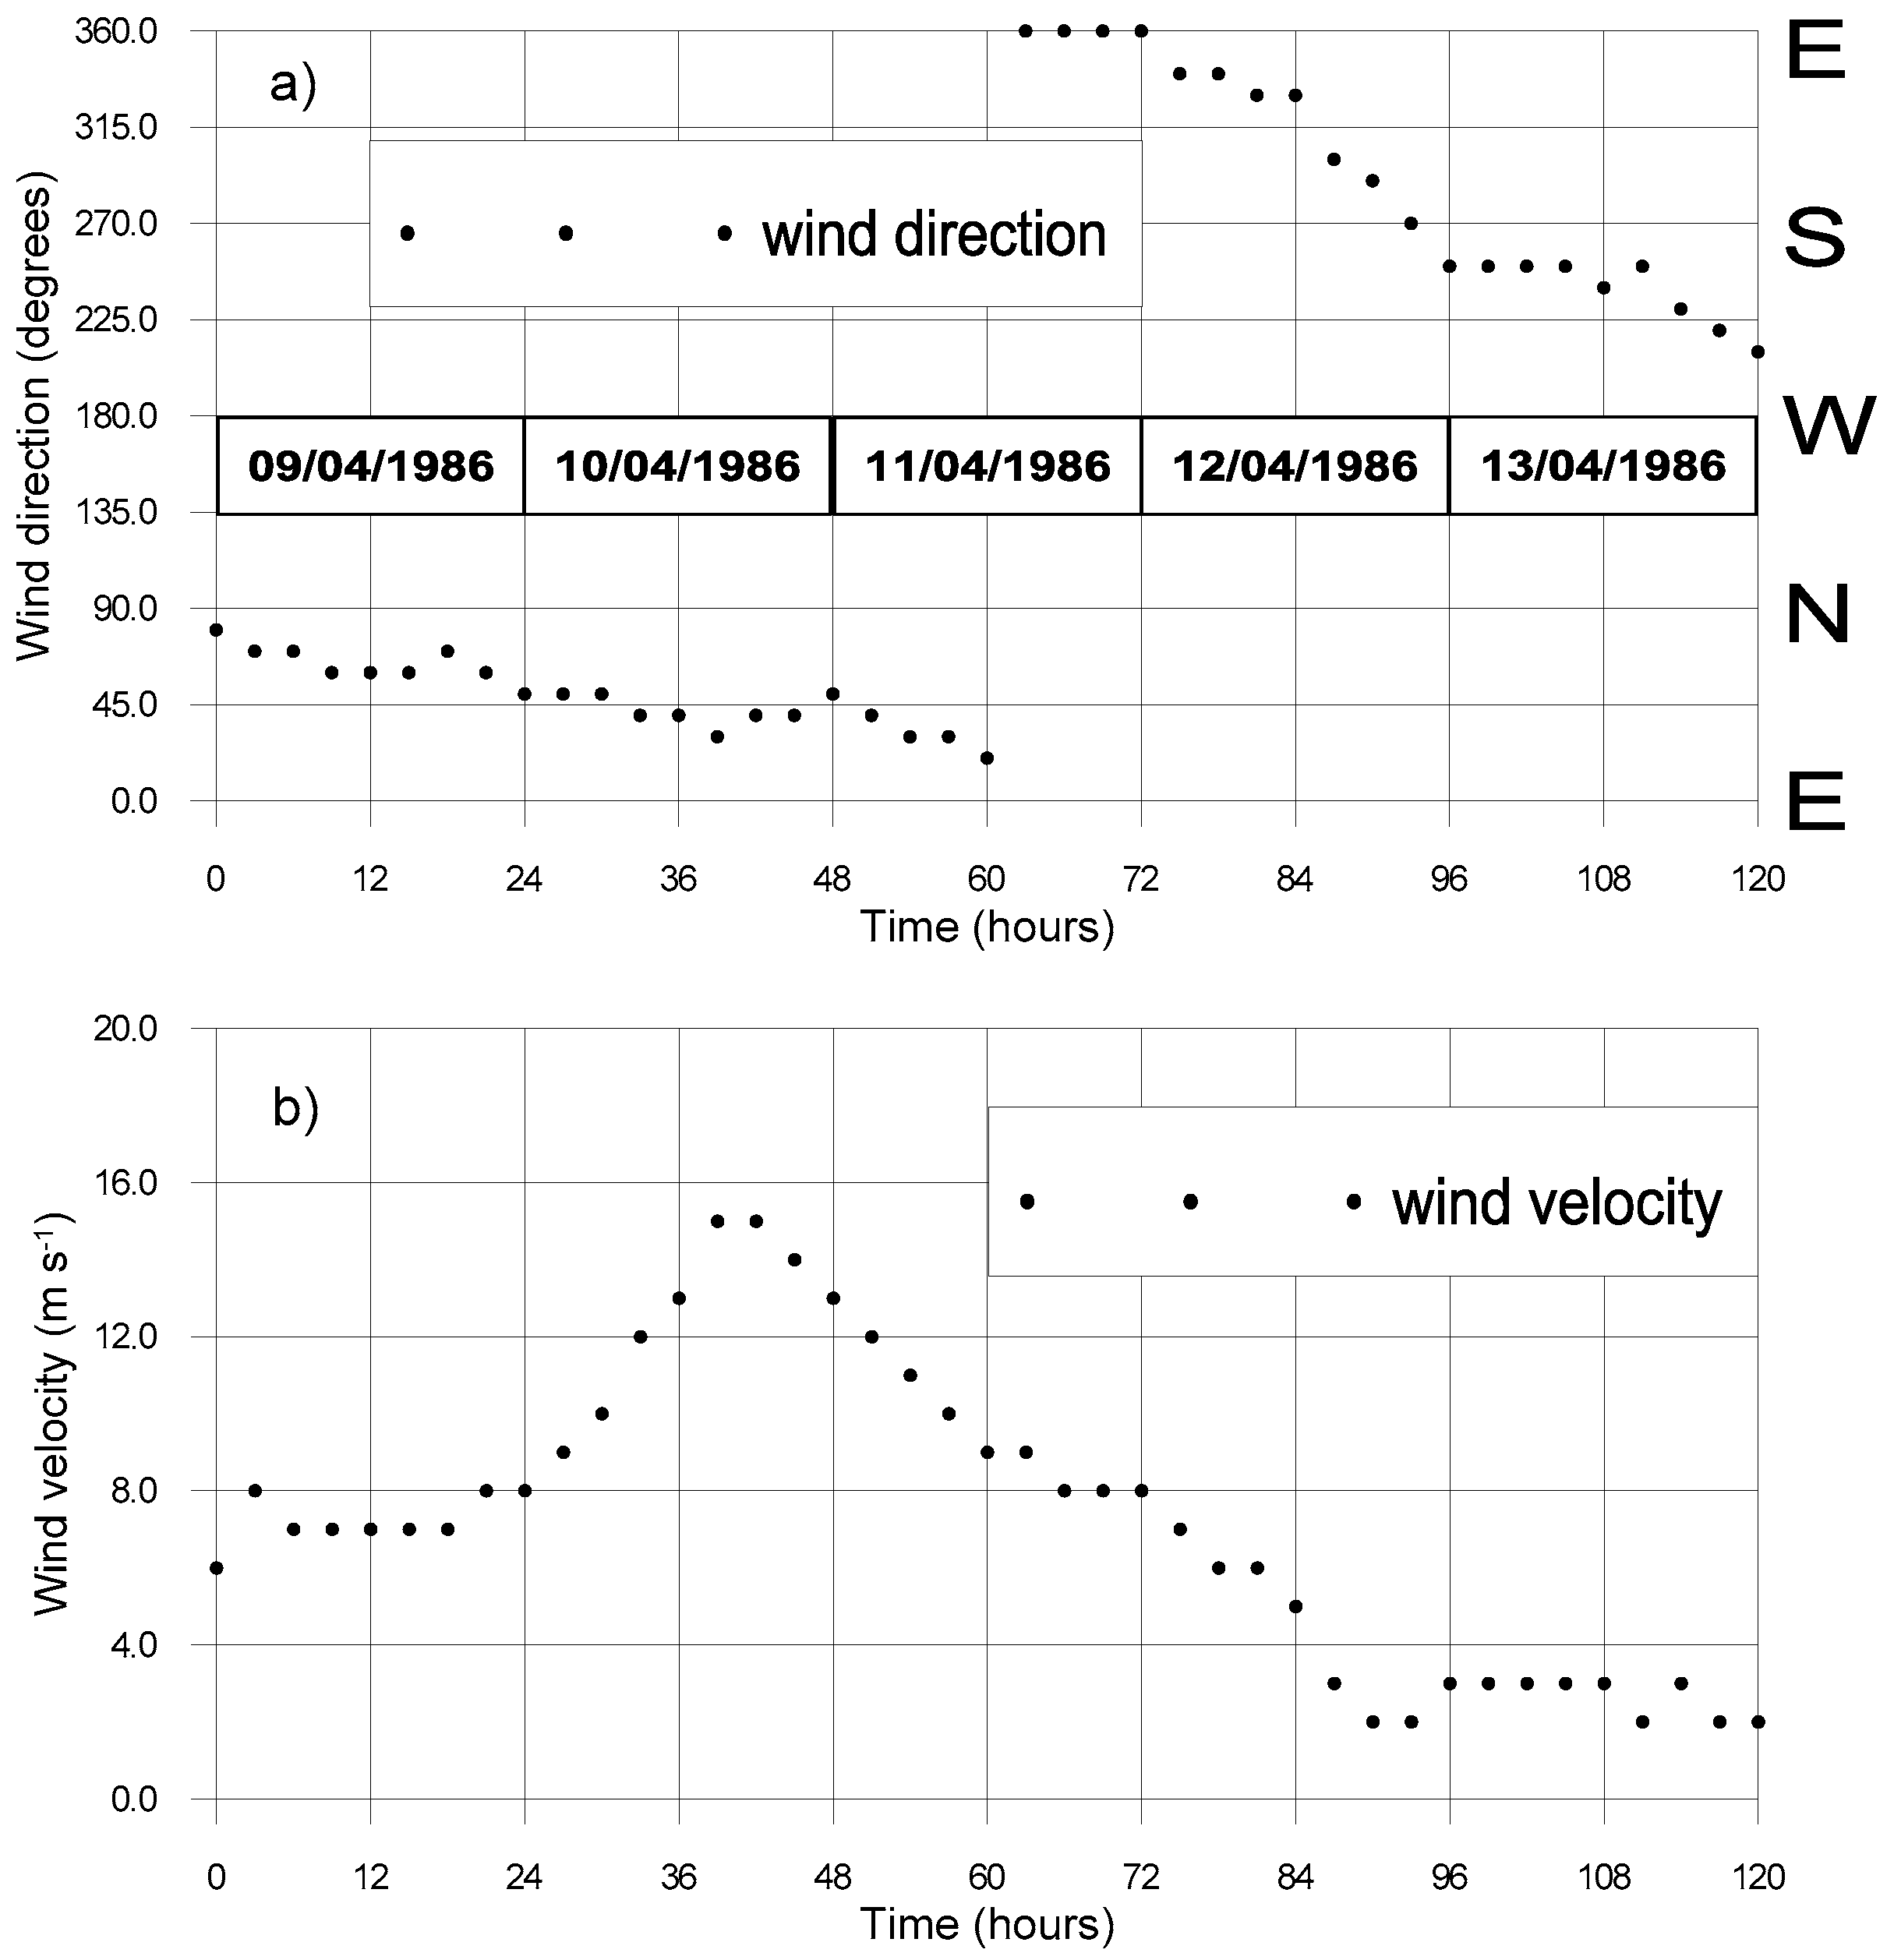
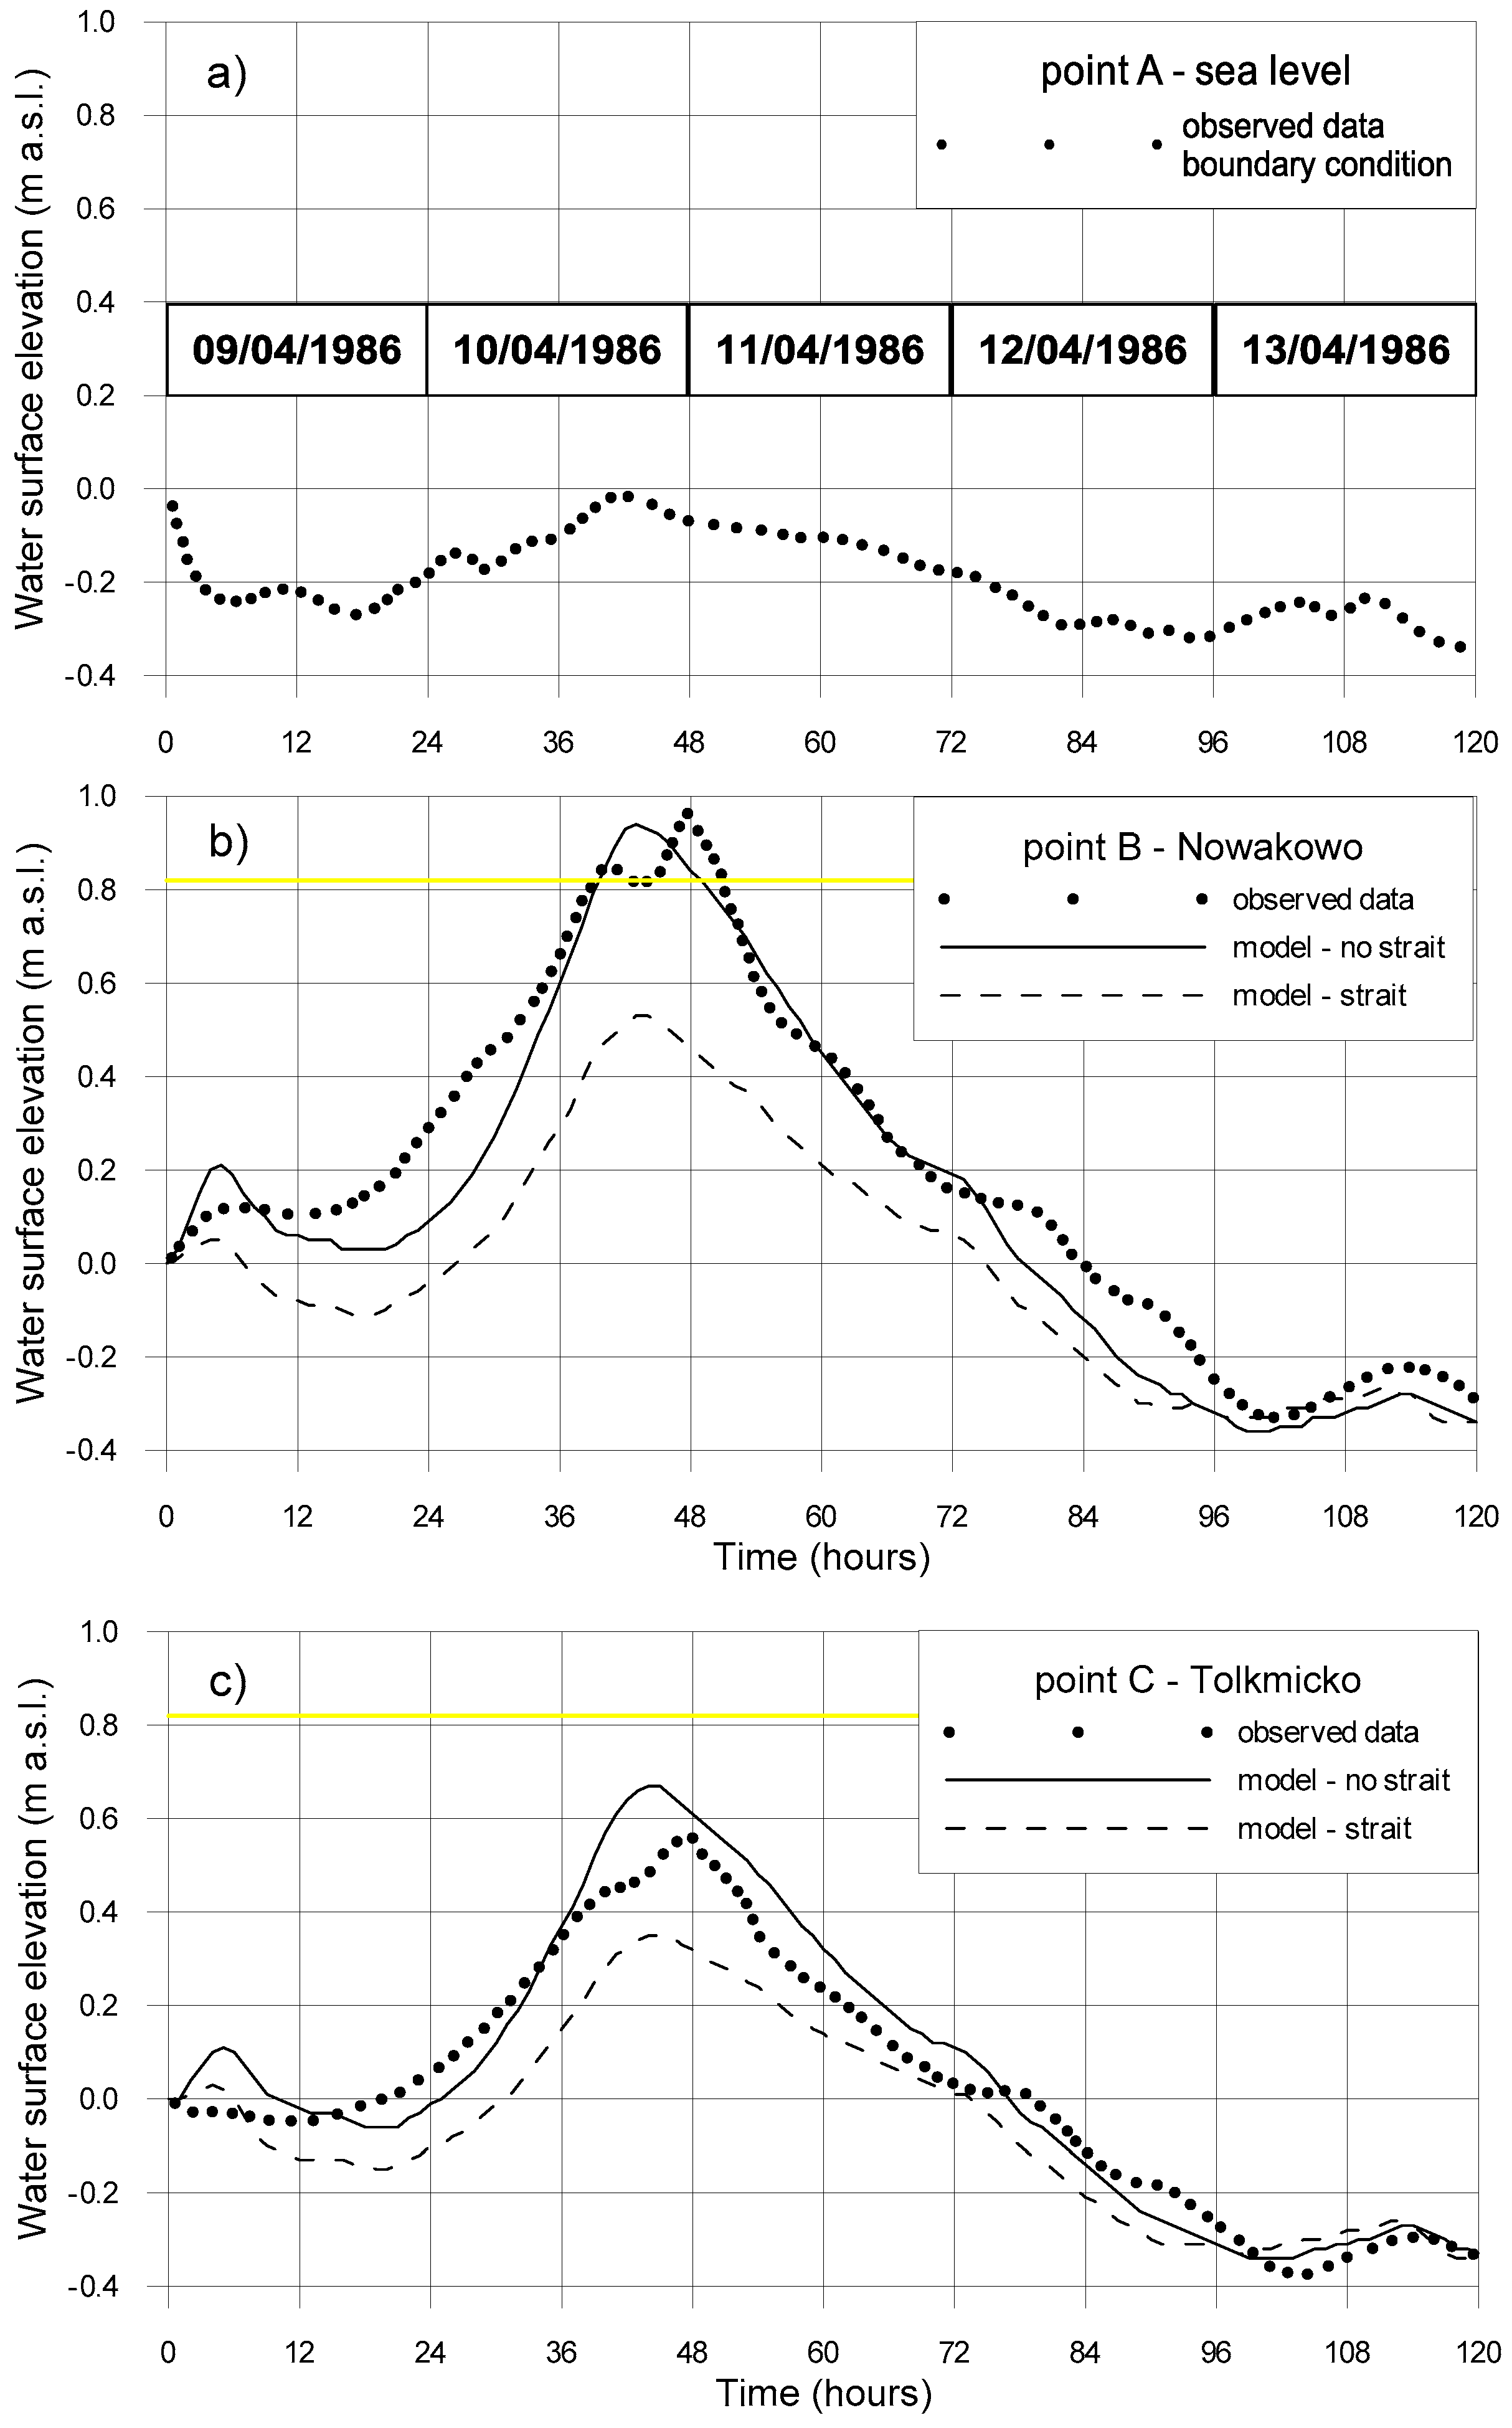
The first example concerns the simulation of the water level variation in the Vistula Lagoon for the period from 9 April to 13 April 1986. This event was numerically investigated in [14] and can be used to verify the mathematical model presented in this paper. The observed wind direction and velocity (Figure 16a,b) measured at the Nowa Pasłęka (Figure 1) meteorological station and water level variation at point A (Figure 17a) were used as the input data for the simulation. A uniform wind field over the whole surface of the Vistula Lagoon was assumed. The E direction wind is represented by 0 and 360 degrees, N wind 90 degrees, W wind 180 degrees, and S wind 270 degrees, respectively. It can be seen that wind from the N, NE, and E sectors was observed for the first 72 h. The maximum wind velocities, reaching 15 m s−1, were measured during this period. After 3 days, the wind direction changed to the SE, and finally the S sector. Such a specific meteorological situation was the reason for the storm surge in the Vistula Lagoon and the rising of the water surface in the southern (Polish) part of the lagoon. The water level was observed to reach almost 1.0 m a.s.l. in the vicinity of Elbląg (Figure 17b).
Two variants of the lagoon configuration were considered (without and with the new strait in the Vistula Spit) and simulated for the described meteorological situation. The results of the computations of the water level variation at the southern part of the lagoon are shown in Figure 17b,c.
The comparison between the observed data and the results of the computations obtained for the current state of the lagoon (without the new opening in the spit) confirms that the proposed mathematical model provides reliable results of simulations of storm surges in the Vistula Lagoon. If the new connection of the lagoon with the Gulf of Gdańsk is considered, the water level at the southern part of the lagoon is significantly lower. The extreme water level at point B (Nowakowo, near Elbląg) is reduced from 0.94 m a.s.l. (over the alarm level) to 0.53 m a.s.l. (below the alarm level) (0.41 m decrease). At point C (Tolkmicko), it is reduced from 0.67 m a.s.l. to 0.35 m a.s.l. (0.32 m decrease). Such a significant decrease in the water surface level could limit the flood risk at the polders adjacent to the lagoon in this region. The alarm and warning water levels in Nowakowo and Tolkmicko are equal to 0.82 m a.s.l. and 1.22 m a.s.l., respectively.
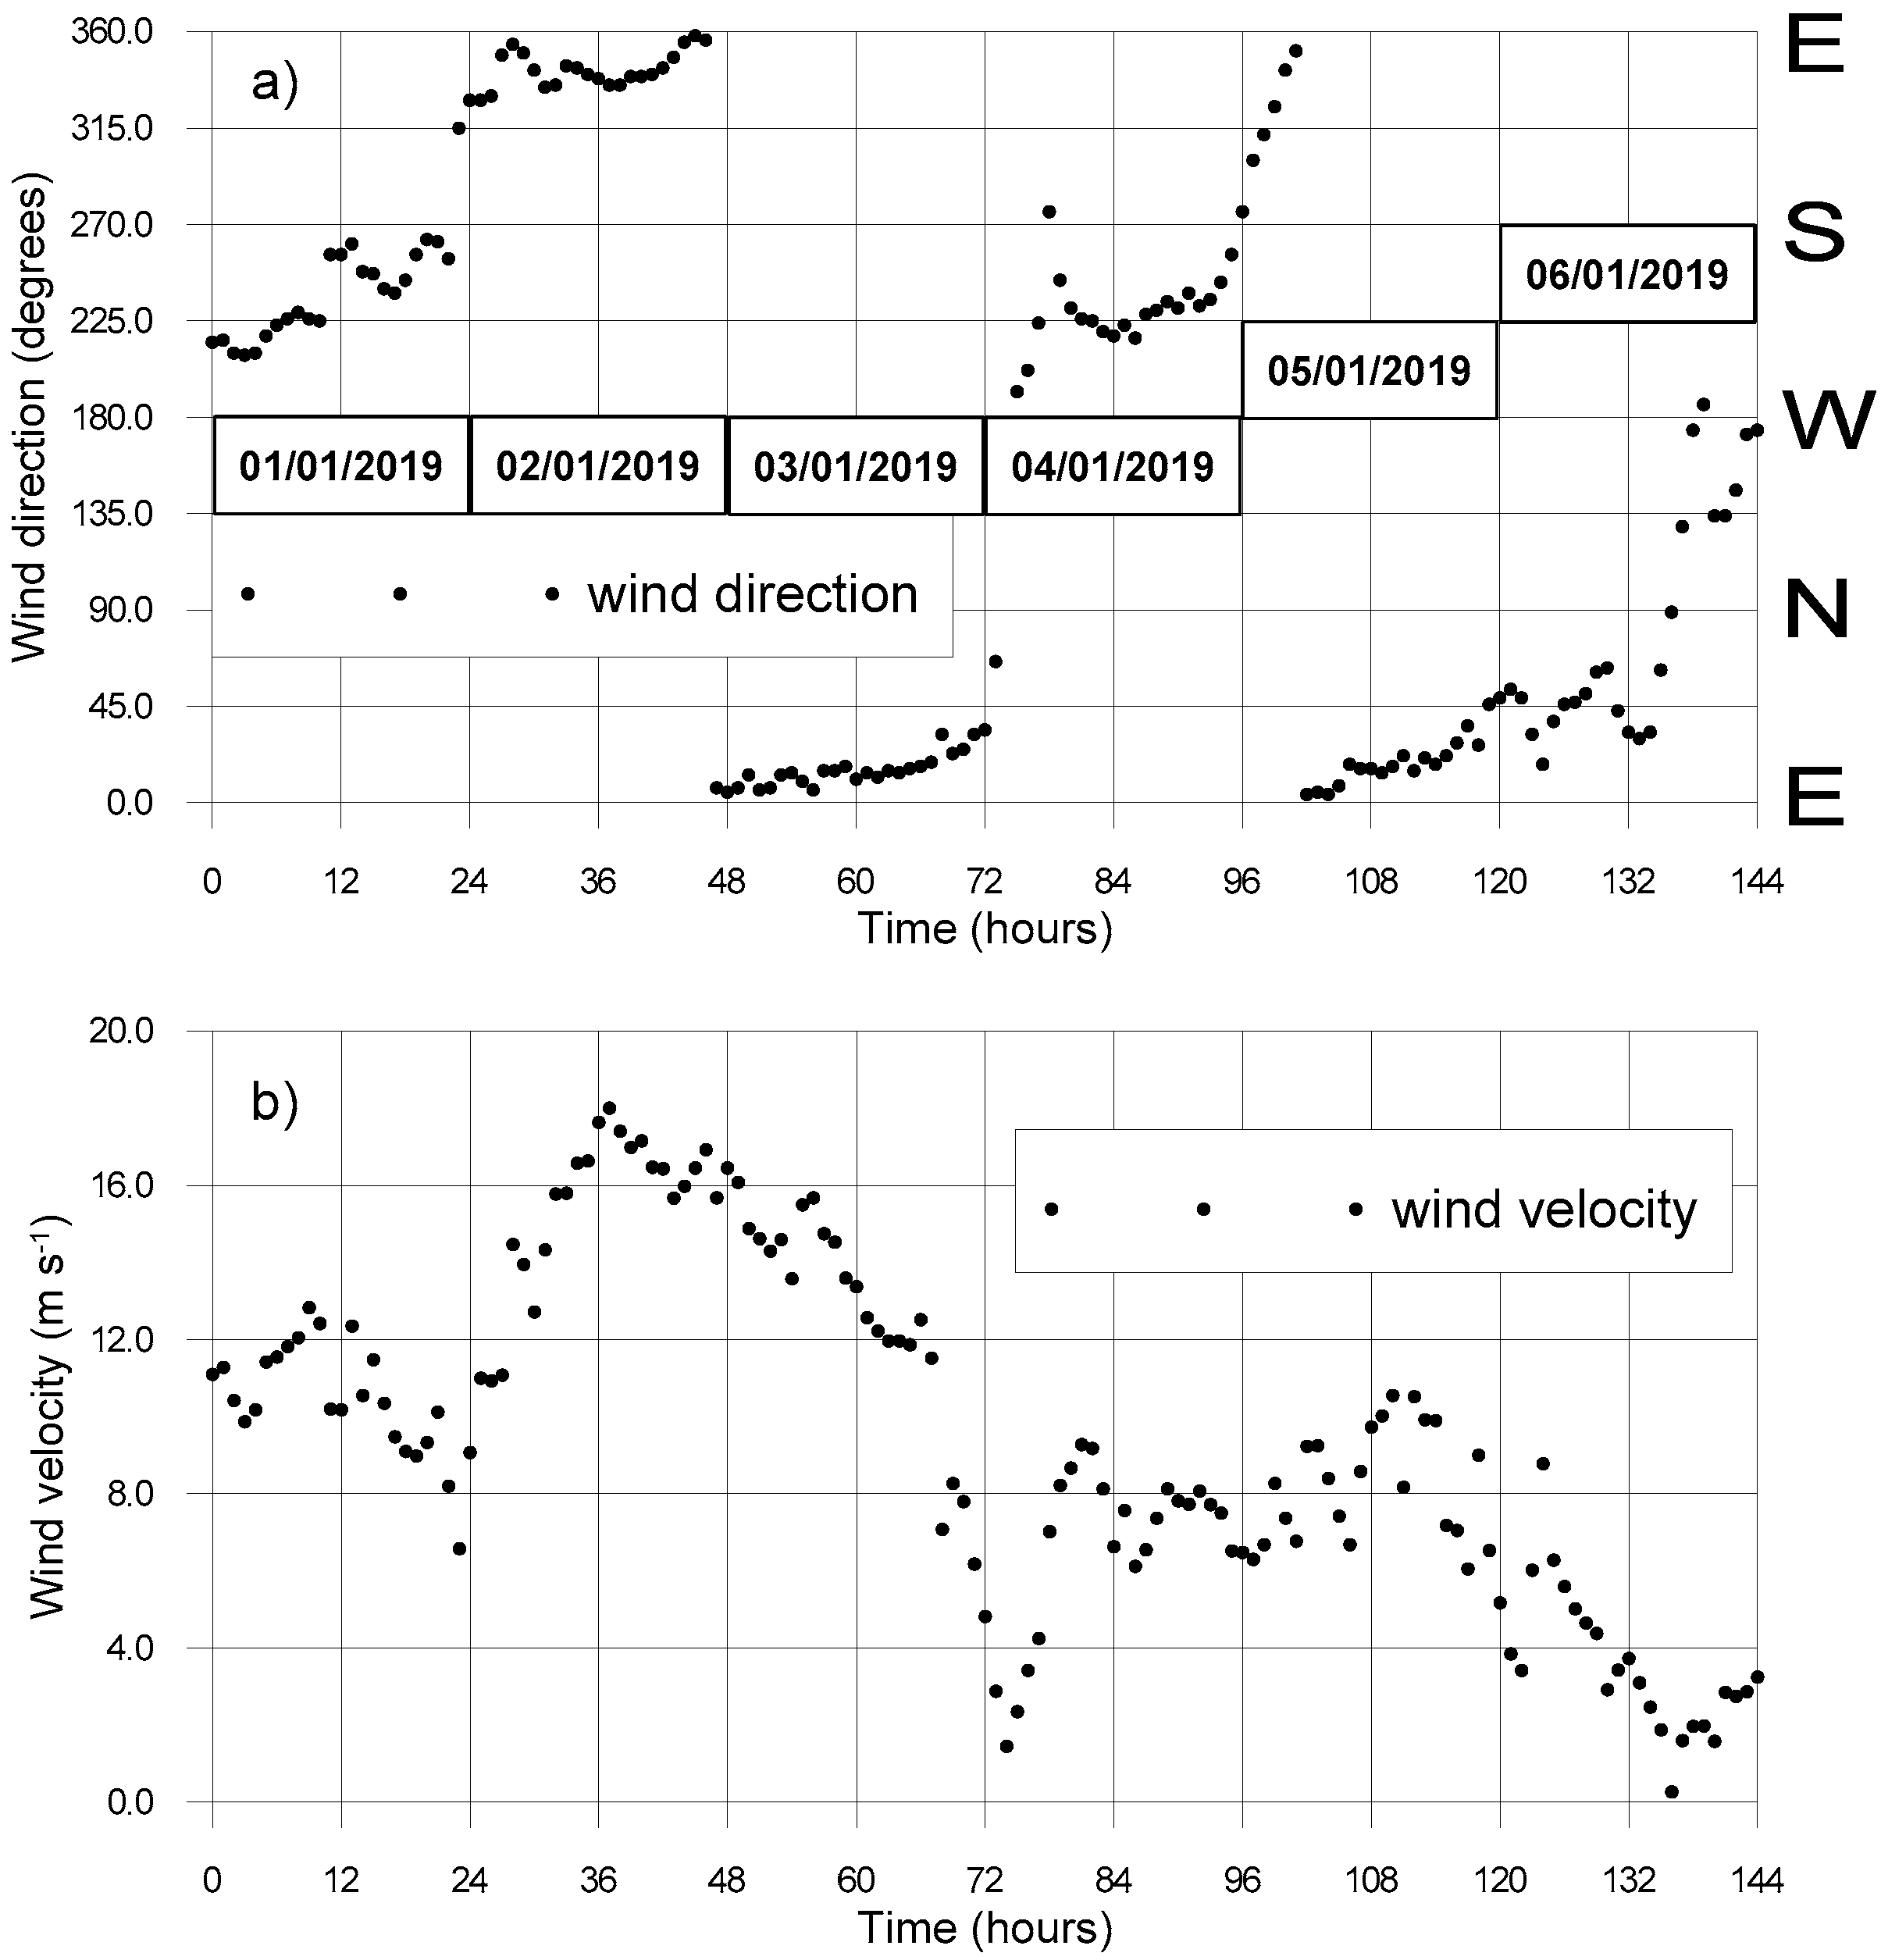
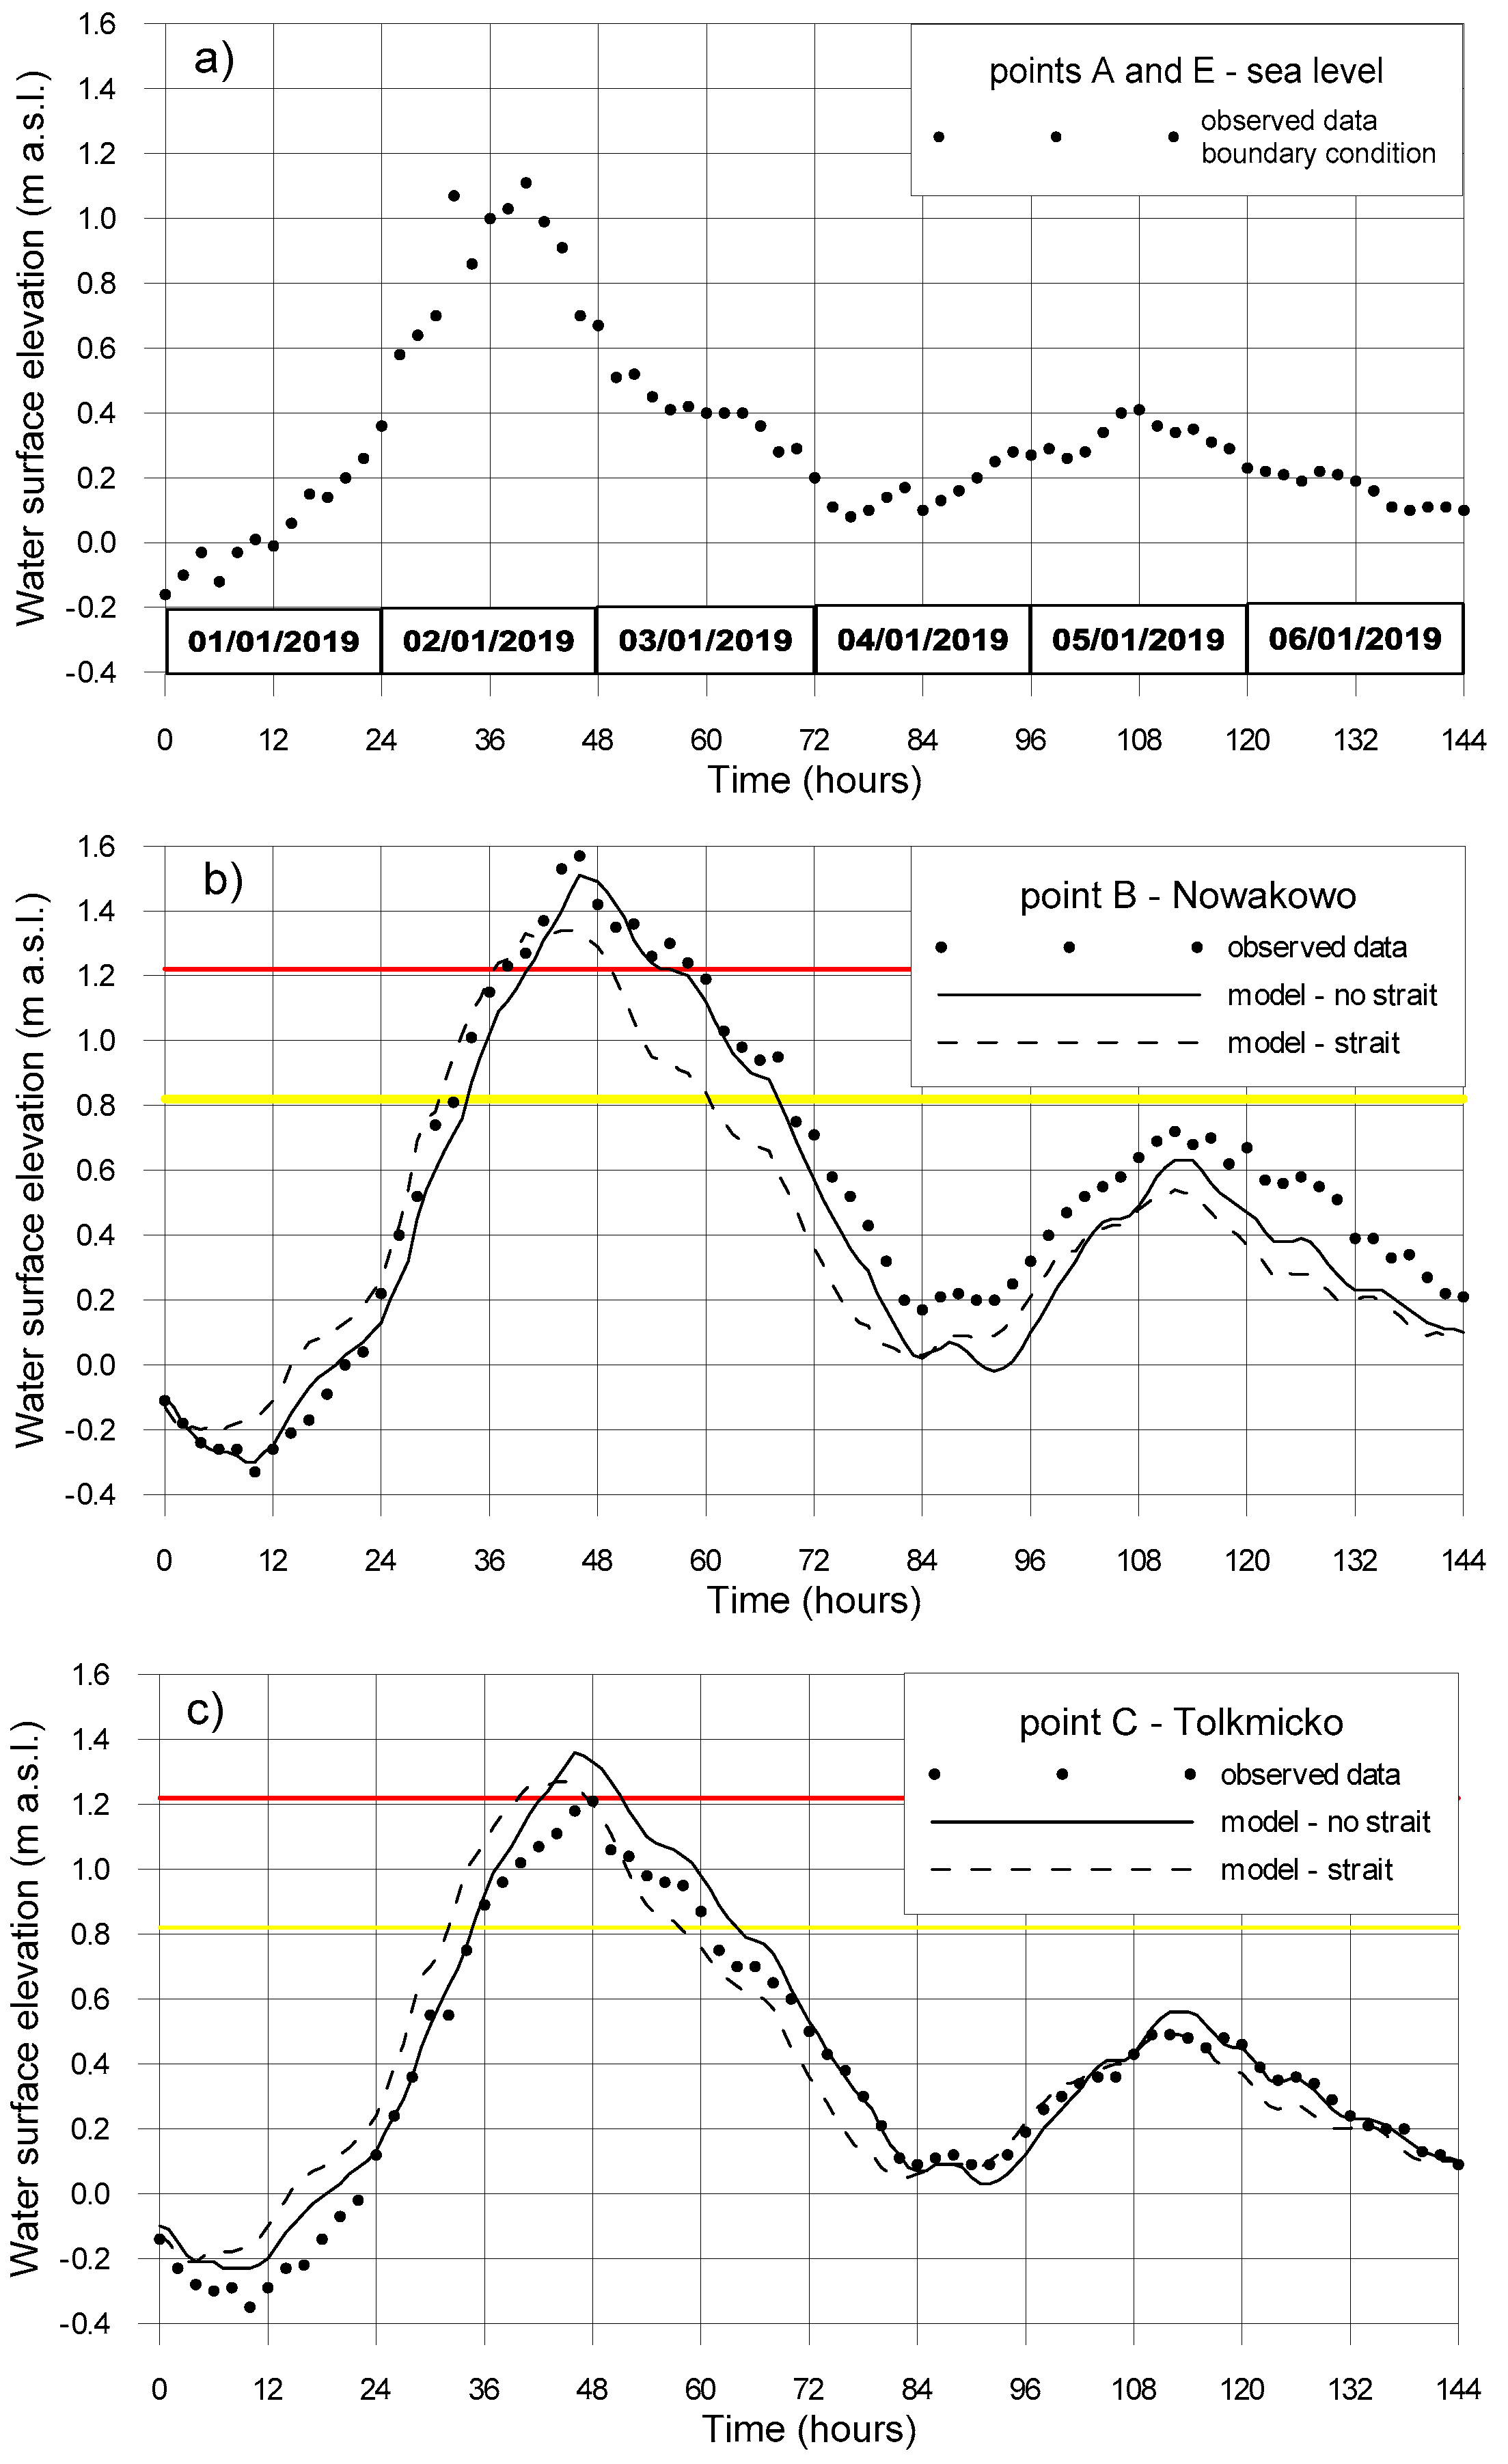
The second numerical simulation was carried out for the storm surge event observed in the Vistula Lagoon at the beginning of the year 2019. All the hydro-meteorological data used in this case were published online by the Polish Institute of Meteorology and Water Resources (IMGW) on the website, http://monitor.pogodynka.pl/. Again, the observed wind direction and velocity (Figure 18a,b) measured at the Nowa Pasłęka (Figure 1) meteorological station and water level variation at point A (Figure 19a) were used as the input data for the simulation. At the turn of the year, wind from the S and SW sectors with a velocity reaching 10 m s−1 was observed. Starting from 2 January 2019 (t = 24 h), the wind direction changed to the E sector. This situation lasted about 48 h. During this period, the wind velocity reached over 18 m s−1. From 4 January 2019 (t = 72 h) to 5 January 2019 (t = 96 h), the wind direction changed to the SW sector and blew with a velocity in the range of 6 to 10 m s−1. At the beginning of 5 January 2019 (t = 96 h), again, the wind direction changed to the E-NE sectors, but the observed wind velocity was lower than 10 m s−1. Finally, during the last day of the analyzed period (6 January 2019) the wind velocity dropped below 4 m s−1 and the wind direction changed to the W sector. This moment (t = 144 h) was assumed as the finish time of the surge simulation.
The significant storm surge in the Gulf of Gdańsk (water level 1.11 m a.s.l. close to the maximum level of probability, 10%, Figure 19a, Table 1), and the complex meteorological situation with long periods of strong winds from the E and NE sectors caused visible effects in the form of water accumulation in the southern part of the lagoon (Figure 19b,c). It must be underlined that such a coincidence of a very high sea level and NE winds is a rather unique situation in this area [9] (Figure 2 and Figure 3). The variation of the direction and velocity of the wind resulted in a sequence of two damming periods in days 2 and 3, and day 5 of the storm event. The former was longer and higher with the water level exceeding the alarm and warning water levels in the vicinity of Elbląg and Tolkmicko, causing a real flood risk for the neighboring polders. The observations and results of the numerical simulations of the water level variation in this region are presented in Figure 19b,c. The computations fit the measurements quite well. However, the simulated water level at point B is significantly lower than the measurements in the period after t = 72 h. It is a result of the specific landform in the vicinity of point B (Nowakowo), which is located in a sheltered area for SW and S winds. It means that assuming a uniform wind field over the whole lagoon surface is appropriate only for winds from the N, NE, and NS sectors, while it results in an underestimation of the calculated water levels in the southern part of the lagoon for winds from the S and SW sectors. This phenomenon was described in [9], but it was not considered in this work. Such an underestimation is not visible at point C (Tolkmicko), which is located outside the sheltered area for winds blowing from the SW and S sectors. The results obtained for the current conditions (without the new strait) have confirmed that the model of storm surges was validated and can be used as a numerical tool for the forecasting of the hydrological situation in the Vistula Lagoon during storm surges and periods of strong winds.
The model was also used to analyze the impact of the new strait in the Vistula Spit on the flood risk at the polder area of Żuławy Elbląskie during the occurrence of a high sea water level. When the hypothetical scenario with an open canal connecting the Gulf of Gdańsk and the lagoon is considered, the results of simulations differ in a noticeable way. It can be found that the maximum water levels at points B and C calculated for the concept (future) state (with the new strait) are lower during damming periods than for the current state (without the new strait). Such a situation is a consequence of water exchange through the new opening in the spit. However, due to the high water level in the sea, this impact is limited. In the example presented in Figure 19, the highest water levels at points B and C were reduced from 1.51 m a.s.l. to 1.34 m a.s.l. (0.17 m decrease) and from 1.38 m a.s.l. to 1.27 m a.s.l. (0.11 m decrease), respectively. Therefore, for this extreme hydro-meteorological event, the water levels in the southern part of the Vistula Lagoon could not be decreased below the warning or the alarm levels.
Discussing the two presented numerical simulations of real storm events, it can be found that the impact of the new artificial canal on the hydrodynamics of the Vistula Lagoon, and on flood risk mitigation can be significant. However, the possible decrease in the water level in the southern part of the Vistula Lagoon, in the vicinity of the Żuławy Wiślane polders, strongly depends on the actual water level in the Gulf of Gdańsk. The effective operation of a new connection of the lagoon with the sea, as a flood protection channel during NE winds, will be possible only for low storm surges. At this moment, the influence of the new strait can be analyzed only when the water gate (lock) in the new canal is considered open. There is no information regarding the construction details of the canal and lock.
4. Conclusions
The results of the two-dimensional numerical simulations of the hydrodynamics of the Vistula Lagoon induced by storms and strong winds allow the following conclusions:
- A comparison of the calculated and observed water levels in the lagoon shows that the applied mathematical model and its numerical solution ensure the satisfactory accuracy of the results.
- The hydrodynamic conditions of the Vistula Lagoon are often driven by strong winds and storm sea surges.
- Long-lasting N or NE winds can result in water accumulation in the southern part of the lagoon, causing a flood risk for Żuławy Elbląskie.
- The new artificial connection of the Gulf of Gdańsk with the Vistula Lagoon can change the hydrodynamics of the lagoon, but only if the lock is open during the surge event and a difference exists between water levels in the lagoon and the sea.
- The new opening can intensify the water exchange between the sea and the lagoon, reducing water stagnation in the southern part of the lagoon.
- The new canal in the Vistula Spit can be helpful to limit the flood risk at the polder area near Elbląg by the reduction of extreme water levels in the southern part of the lagoon during damming driven by N and NE winds; a significant (below the warning and alarm levels) decrease of the water surface level in the lagoon will be possible only when high sea water levels in the Gulf of Gdańsk do not occur.
Author Contributions
Conceptualization, methodology, software, validation M.S.; formal analysis, investigation M.S, P.Z. and T.K.; resources, T.K.; data curation, M.S., P.Z.; writing—original draft preparation, M.S.; writing—review and editing, T.K.; visualization, M.S., T.K.
Funding
This research received no external funding.
Conflicts of Interest
The authors declare no conflict of interest.
References
- Kjerfve, B. Coastal Lagoons. In Elsevier Oceanography Series; Kjerfve, B., Ed.; Elsevier: Amsterdam, The Netherlands, 1994; Volume 60, pp. 1–8. [Google Scholar]
- Bird, E.C.F. Coastal Geomorphology: An Introduction; John Wiley & Sons: Hoboken, NJ, USA, 2011; ISBN 978-1-119-96435-3. [Google Scholar]
- Kolerski, T.; Shen, H.T.; Kioka, S. A Numerical Model Study on Ice Boom in a Coastal Lake. J. Coast. Res. 2013, 291, 177–186. [Google Scholar] [CrossRef]
- Otubusin, S.O. Modern aquaculture practices for increased fish production in Nigeria. In Proceedings of the 3rd Annual Conference of the Fisheries Society of Nigeria (FISON), Maiduguri, Nigeria, 22–25 February 1983; pp. 89–104. [Google Scholar]
- Bird, E.C.F. Potential effects of sea level rise on the coasts of Australia, Africa, and Asia. In Effects of Changes in Stratospheric Ozone and Global Climate; Volume 4 Sea Level Rise; U.S. Environmental Protection Agency: Washington, DC, USA, 1986; pp. 83–98. [Google Scholar]
- Szpakowski, W.; Szydlowski, M. Probable Rainfall in Gdańsk in view of Climate Change. Acta Sci. Pol. Form. Circumiectus 2018, 3, 175–183. [Google Scholar] [CrossRef]
- Cieśliński, R. Hydrochemical variability of the ecosystem of the Gulf of Elbląg (north-eastern Poland). Baltica 2016, 29, 121–132. [Google Scholar] [CrossRef]
- Chubarenko, B.V.; Leitsina, L.V.; Esiukova, E.E.; Kurennoy, D.N. Model analysis of the currents and wind waves in the Vistula Lagoon of the Baltic Sea. Oceanology 2012, 52, 748–753. [Google Scholar] [CrossRef]
- Szymkiewicz, R. Hydrodynamics of Vistula Lagoon; Polish Academy of Sciences: Warsaw, Poland, 1992. (In Polish) [Google Scholar]
- Wroblewski, A. Occurrence probability of maximum yearly levels of Baltic Sea in Gdańsk Nowy Port, Kolobrzeg and Świnoujście. Oceanology 1975, 6, 37–53. [Google Scholar]
- Cieśliński, R.; Lewandowski, A. Hydrological regime of the Vistula Lagoon and the possible changes due to the construction of the waterway connecting the Vistula Bay with the Gulf of Gdansk. Inżynieria Morska i Geotechnika 2013, 1, 69–78. (In Polish) [Google Scholar]
- Dubrawski, R.; Zachowicz, J. Navigation channel in the Vistula Spit - positives and negatives for the marine environment. Inżynieria Morska i Geotechnika 1997, 5, 301–307. (In Polish) [Google Scholar]
- Dembicki, E.; Jednorał, T.; Sedler, B.; Jaśkowski, J.; Zadroga, B. Navigation channel in Polish part of Vistula Sandbar. Inżynieria Morska i Geotechnika 2006, 5, 275–286. (In Polish) [Google Scholar]
- Szymkiewicz, R. A mathematical model of storm surge in the Vistula Lagoon, Poland. Coast. Eng. 1992, 16, 181–203. [Google Scholar] [CrossRef]
- Catewicz, Z.; Jankowski, A. Model H-N of stationary flows in Vistula Lagoon. Podstawy Gospodarki w Środowisku Morskim III. Studia i Materiały Oceanologiczne 1983, 40, 223–249. (In Polish) [Google Scholar]
- Chubarenko, B.V.; Chubarenko, I.P. Regionalization of river Pregel estuary and Russian part of Vistula Lagoon on hydrophysical parameters. In Proceedings of the International Conference on Regionalization in Hydrology, Braunschweig, Germany, 10–14 March 1997; pp. 41–44. [Google Scholar]
- Kwiatkowski, J.; Rasmussen, E.K.; Ezhova, E.; Chubarenko, B. The eutrophication model of the Vistula Lagoon. Oceanol. Stud. 1997, 26, 5–33. [Google Scholar]
- Chubarenko, I.; Tchepikova, I. Modelling of man-made contribution to salinity increase into the Vistula Lagoon (Baltic Sea). Ecol. Model. 2001, 138, 87–100. [Google Scholar] [CrossRef]
- Ołdakowski, B.; Kwiatkowski, J. Forecast model of water quality of Vistula Lagoon. Inżynieria Morska i Geotechnika 1995, 6, 258–266. (In Polish) [Google Scholar]
- Bielecka, M.; Kazmierski, J. A 3D mathematical model of Vistula Lagoon hydrodynamics-general assumptions and results of preliminary calculations. Groundwater 2003, 80, 2–4. [Google Scholar]
- Kruk, M.; Kempa, M.; Tjomsland, T.; Durand, D. The use of mathematical models to predict changes in the environment of the Vistula Lagoon. In Vistula Lagoon—Natural Environment and Modern Methods of His Research Project on the Example of Visla; Publishing PWSZ: Elbląg, Poland, 2011; pp. 165–180. [Google Scholar]
- García-Oliva, M.; Pérez-Ruzafa, Á.; Umgiesser, G.; McKiver, W.; Ghezzo, M.; De Pascalis, F.; Marcos, C. Assessing the hydrodynamic response of the Mar Menor lagoon to dredging inlets interventions through numerical modelling. Water 2018, 10, 959. [Google Scholar] [CrossRef]
- Szymkiewicz, R. Analysis of a concept of changing the hydrodynamic conditions of the Vistula Lagoon. Inżynieria Morska i Geotechnika 1984, 6, 258–260. (In Polish) [Google Scholar]
- Szymkiewicz, R. Oscillation-free solution of shallow water equations for nonstaggered grid. J. Hydraul. Eng. 1993, 119, 1118–1137. [Google Scholar] [CrossRef]
- Zima, P. Modeling of the Two-Dimensional Flow Caused by Sea Conditions and Wind Stresses on the Example of Dead Vistula. Pol. Marit. Res. 2018, 25, 166–171. [Google Scholar] [CrossRef]
- Stelling, G.S. On the Construction of Computational Methods for Shallow Water Flow Problems; Delft University of Technology: Delft, The Netherlands, 1983. [Google Scholar]
- Hervouet, J.-M.; Petitjean, A. Malpasset dam-break revisited with two-dimensional computations. J. Hydraul. Res. 1999, 37, 777–788. [Google Scholar] [CrossRef]
- Szydłowski, M. Mathematical modelling of flash floods in natural and urban areas. In Transboundary Floods: Reducing Risks through Flood Management; Springer: Dordrecht, The Netherlands, 2006; pp. 143–153. [Google Scholar]
- Szymkiewicz, R. Method to solve 1D unsteady transport and flow equations. J. Hydraul. Eng. 1995, 121, 396–403. [Google Scholar] [CrossRef]
- Pruszak, Z.; Zawadzka, E. Vulnerability of Poland’s Coast to Sea-Level Rise. Coast. Eng. J. 2005, 47, 131–155. [Google Scholar] [CrossRef]
Figure 1.
Location of the Vistula Lagoon.

Figure 2.
Monthly distribution of the percentage of SW (225°–285°) and NE (15°–75°) winds [9].
Figure 2.
Monthly distribution of the percentage of SW (225°–285°) and NE (15°–75°) winds [9].

Figure 3.
Monthly mean sea level measured at the Hel station (Gulf of Gdańsk) [9].
Figure 3.
Monthly mean sea level measured at the Hel station (Gulf of Gdańsk) [9].

Figure 4.
Bathymetry of the Vistula Lagoon (dimensions in meters), point A—Strait of Baltiysk, point B—Nowakowo, point C—Tolkmicko, point D—Kaliningrad, point E—Nowy Świat.
Figure 4.
Bathymetry of the Vistula Lagoon (dimensions in meters), point A—Strait of Baltiysk, point B—Nowakowo, point C—Tolkmicko, point D—Kaliningrad, point E—Nowy Świat.

Figure 5.
(a) Imposed boundary condition (point A–Baltiysk), and calculated (points B–Nowakowo and D–Kaliningrad) water levels and (b) calculated water discharge at point A in the Strait of Baltiysk.
Figure 5.
(a) Imposed boundary condition (point A–Baltiysk), and calculated (points B–Nowakowo and D–Kaliningrad) water levels and (b) calculated water discharge at point A in the Strait of Baltiysk.

Figure 6.
(a) Imposed boundary conditions (points A–Baltiysk and E–Nowy Świat), and calculated water levels (points B–Nowakowo and D–Kaliningrad) and (b) calculated water discharges at point A in the Strait of Baltiysk and at point E in the new canal (Nowy Świat).
Figure 6.
(a) Imposed boundary conditions (points A–Baltiysk and E–Nowy Świat), and calculated water levels (points B–Nowakowo and D–Kaliningrad) and (b) calculated water discharges at point A in the Strait of Baltiysk and at point E in the new canal (Nowy Świat).

Figure 7.
Water surface elevation (m a.s.l.) after 12 h of a NE wind at a speed of 12 m s−1 and without the new artificial strait at point E (dimensions in meters).
Figure 7.
Water surface elevation (m a.s.l.) after 12 h of a NE wind at a speed of 12 m s−1 and without the new artificial strait at point E (dimensions in meters).

Figure 8.
Water flow velocity (m s−1) after 12 h of a NE wind at a speed of 12 m s−1 and without the new artificial strait at point E (dimensions in meters).
Figure 8.
Water flow velocity (m s−1) after 12 h of a NE wind at a speed of 12 m s−1 and without the new artificial strait at point E (dimensions in meters).

Figure 9.
Water surface elevation (m a.s.l.) after 12 h of a NE wind at a speed of 12 m s−1 and with the new artificial strait at point E (dimensions in meters).
Figure 9.
Water surface elevation (m a.s.l.) after 12 h of a NE wind at a speed of 12 m s−1 and with the new artificial strait at point E (dimensions in meters).

Figure 10.
Water flow velocity (m s−1) after 12 h of a NE wind at a speed of 12 m s−1 and with the new artificial strait at point E (dimensions in meters).
Figure 10.
Water flow velocity (m s−1) after 12 h of a NE wind at a speed of 12 m s−1 and with the new artificial strait at point E (dimensions in meters).

Figure 11.
Water surface elevation (m a.s.l.) after 12 h of a SW wind at a speed of 12 m s−1 and without the new artificial strait at point E (dimensions in meters).
Figure 11.
Water surface elevation (m a.s.l.) after 12 h of a SW wind at a speed of 12 m s−1 and without the new artificial strait at point E (dimensions in meters).

Figure 12.
Water flow velocity (m s−1) after 12 h of a SW wind at a speed of 12 m s−1 and without the new artificial strait at point E (dimensions in meters).
Figure 12.
Water flow velocity (m s−1) after 12 h of a SW wind at a speed of 12 m s−1 and without the new artificial strait at point E (dimensions in meters).

Figure 13.
Water surface elevation (m a.s.l.) after 12 h of a SW wind at a speed of 12 m s−1 and with the new artificial strait at point E (dimensions in meters).
Figure 13.
Water surface elevation (m a.s.l.) after 12 h of a SW wind at a speed of 12 m s−1 and with the new artificial strait at point E (dimensions in meters).

Figure 14.
Water flow velocity (m s−1) after 12 h of a SW wind at a speed of 12 m s−1 and with the new artificial strait at point E (dimensions in meters).
Figure 14.
Water flow velocity (m s−1) after 12 h of a SW wind at a speed of 12 m s−1 and with the new artificial strait at point E (dimensions in meters).

Figure 15.
Water stage variation at point B (Nowakowo) and for NE and SW winds at a speed of 12 m s−1 and without and with the new artificial strait at point E (Nowy Świat).
Figure 15.
Water stage variation at point B (Nowakowo) and for NE and SW winds at a speed of 12 m s−1 and without and with the new artificial strait at point E (Nowy Świat).

Figure 16.
Wind parameters observed at Nowa Pasłęka (9 April–13 April 1986), (a) direction, (b) velocity.
Figure 16.
Wind parameters observed at Nowa Pasłęka (9 April–13 April 1986), (a) direction, (b) velocity.

Figure 17.
Observed and calculated water level at (a) point A, (b) point B and (c) point C (9 April–13 April 1986). The yellow line represents the alarm water surface level.
Figure 17.
Observed and calculated water level at (a) point A, (b) point B and (c) point C (9 April–13 April 1986). The yellow line represents the alarm water surface level.

Figure 18.
Wind parameters observed at Nowa Pasłęka (1 January–6 January 2019), (a) direction, (b) velocity.
Figure 18.
Wind parameters observed at Nowa Pasłęka (1 January–6 January 2019), (a) direction, (b) velocity.

Figure 19.
Observed and calculated water level at (a) points A and E, (b) point B and (c) point C (1 January–6 January 2019). The yellow and red lines represent the alarm and warning water surface levels, respectively.
Figure 19.
Observed and calculated water level at (a) points A and E, (b) point B and (c) point C (1 January–6 January 2019). The yellow and red lines represent the alarm and warning water surface levels, respectively.


Table 1.
Probability of the maximum sea levels in the Gulf of Gdańsk [10].
Table 1.
Probability of the maximum sea levels in the Gulf of Gdańsk [10].
| Probability (%) | Level (m a.s.l.) |
|---|---|
| 99 | 0.41 |
| 95 | 0.49 |
| 90 | 0.55 |
| 80 | 0.62 |
| 70 | 0.67 |
| 50 | 0.78 |
| 30 | 0.91 |
| 20 | 0.99 |
| 10 | 1.12 |
| 5 | 1.23 |
| 2 | 1.37 |
| 1 | 1.47 |
| 0.1 | 1.78 |
Table 2.
Numerical simulations of storm surges in the Vistula Lagoon.
| Number | Sea Level | Wind | New Strait (Point E) | Simulation Time |
|---|---|---|---|---|
| 1 | hypothetical 0.0–0.6 m a.s.l. | No | No | 72 h |
| 2 | hypothetical 0.0–0.6 m a.s.l. | No | Yes | 72 h |
| 3 | hypothetical const. 0.0 a.s.l. | hypothetical from NE/12 m s−1 | No | 24 h |
| 4 | hypothetical const. 0.0 a.s.l | hypothetical from NE/12 m s−1 | Yes | 24 h |
| 5 | hypothetical const. 0.0 a.s.l. | hypothetical from SW/12 m s−1 | No | 24 h |
| 6 | hypothetical const. 0.0 a.s.l | hypothetical from SW/12 m s−1 | Yes | 24 h |
| 7 | observed 9 April–13 April 1986 | observed 9 April–13 April 1986 | No | 120 h |
| 8 | observed 9 April–13 April 1986 | observed 9 April–13 April 1986 | Yes | 120 h |
| 9 | observed 1 January–6 January 2019 | observed 1 January–6 January 2019 | No | 144 h |
| 10 | observed 1 January–6 January 2019 | observed 1 January–6 January 2019 | Yes | 144 h |
© 2019 by the authors. Licensee MDPI, Basel, Switzerland. This article is an open access article distributed under the terms and conditions of the Creative Commons Attribution (CC BY) license (http://creativecommons.org/licenses/by/4.0/).
Share and Cite
MDPI and ACS Style
Szydłowski, M.; Kolerski, T.; Zima, P. Impact of the Artificial Strait in the Vistula Spit on the Hydrodynamics of the Vistula Lagoon (Baltic Sea). Water 2019, 11, 990. https://doi.org/10.3390/w11050990
AMA Style
Szydłowski M, Kolerski T, Zima P. Impact of the Artificial Strait in the Vistula Spit on the Hydrodynamics of the Vistula Lagoon (Baltic Sea). Water. 2019; 11(5):990. https://doi.org/10.3390/w11050990
Chicago/Turabian StyleSzydłowski, Michał, Tomasz Kolerski, and Piotr Zima. 2019. "Impact of the Artificial Strait in the Vistula Spit on the Hydrodynamics of the Vistula Lagoon (Baltic Sea)" Water 11, no. 5: 990. https://doi.org/10.3390/w11050990
Note that from the first issue of 2016, this journal uses article numbers instead of page numbers. See further details here.