Response of Water Chemistry to Long-Term Human Activities in the Nested Catchments System of Subtropical Northeast India


1
Department of Geoenvironmental Research, Institute of Geography and Spatial Organization, Polish Academy of Sciences, Jana 22, 31-018 Kraków, Poland
2
Department of Geography, North-Eastern Hill University, Shillong, Meghalaya 793022, India
3
Department of Environment Protection and Modelling, Jan Kochanowski University, Świętokrzyska 15, 25-406 Kielce, Poland
*
Author to whom correspondence should be addressed.
Water 2019, 11(5), 988; https://doi.org/10.3390/w11050988
Submission received: 25 April 2019
/
Revised: 3 May 2019
/
Accepted: 8 May 2019
/
Published: 10 May 2019
(This article belongs to the Section Water Quality and Contamination)
Abstract
:The subtropics within the monsoonal range are distinguished by intensive human activity, which affects stream water chemistry. This paper aims to determine spatio-temporal variations and flowpaths of stream water chemical elements in a long-term anthropogenically-modified landscape, as well as to verify whether the water chemistry of a subtropical elevated shield has distinct features compared to other headwater areas in the tropics. It was hypothesized that small catchments with homogenous environmental conditions could assist in investigating the changes in ions and trace metals in various populations and land uses. Numerous physico-chemical parameters were measured, including temperature, pH, electrical conductivity (EC), dissolved organic carbon (DOC), major ions, and trace metals. Chemical element concentrations were found to be low, with a total dissolved load (TDS) below 52 mg L−1. Statistical tests indicated an increase with significant differences in the chemical element concentration between sites and seasons along with increases of anthropogenic impact. Human influence was clearly visible in the case of cations (Ca2+, K+, Mg2+, Na+) and anions (Cl−, HCO3−, NO3−, SO42−), compared to trace metals. The order of most abundant metals Fe > Zn > Al > Sr was the same in springs and streams, regardless of population density, land use, and season. Principal component analysis (PCA) demonstrated that major ion concentrations in stream water followed the pattern forest < cultivated land < grassland < built-up area. Surface water chemistry of the subtropical elevated shield has mixed features of tropical and temperate zones. Low concentrations of chemical elements; small seasonal differences in headwater streams; and increased concentrations of NO3−, SO42−, DOC, and Zn in the wet monsoon season are similar to those observed in the tropics. The role of long-term cultivation without chemical fertilizers in ions supply to streams is less than in other headwater areas of the tropical zone. Strong control of water chemistry in densely populated built-up areas is analogous to both tropical and temperate regions. Population density or a built-up area may be used as a proxy for the reconstruction or prediction of the anthropogenic impact on stream water chemistry in similar subtropical elevated shields.
1. Introduction
The subtropics comprise the transit areas between tropical and temperate zones [1]. They are distinguished not only by the distinct seasonality of the climate, particularly visible within the monsoonal range, but also by long-term human activity. The result of the anthropogenic impact is a shift from natural to human-dominated landscapes through old deforestation for agriculture, the extraction and processing of minerals, and settlement development [2,3]. Recent decades of accelerated population growth in many subtropical areas have caused further intensification of agriculture, including the introduction of commercial monocropping and expansion of built-up areas with artificial infrastructure in the catchment [4,5,6]. In effect, within a small area, there are often significant contrasts in population density and mosaics of land use and land cover (LULC) types affecting hydrological processes and stream water chemistry [7,8,9,10]. However, the complexity of natural and anthropogenic interactions, such as nonlinear processes, the separation of present-day from historical activity, or catchment scale, complicate the detection of the human impact on water properties [11].
In general, anthropogenic changes are first reflected in the chemistry of streams in small headwater catchments. Such streams have a greater contribution in catchments compared with larger rivers; therefore, they may experience greater chemical inputs, shorter response times, and more effective processing and transporting of elements compared to larger rivers [12,13]. Thus, the effects of various human activities on water chemistry can more easily be identified in small catchments than in larger basins with complex disturbance regimes or geology. Water quality research encompasses different approaches, including measurements in paired catchments [5,7,10] or nested catchment systems [4,9].
Most of the studies on water chemistry in the tropics have concerned the impact of rapid deforestation for agriculture and accompanying settlement development on water quality. Forests are recognized as playing a regulating role in streamflow and water chemistry [14,15,16]. Significant deforestation and burning of biomass for agriculture usually lead to the leaching of nutrients stored in the above ground vegetation and soil with increased surface runoff and erosion, causing an elevated export of solids and solutes [17,18]. Such increases of N, P, K, and dissolved organic carbon have continued even 50 years following forest cutting [19]. In deforested agricultural areas, chemical concentrations generally follow the pattern of cultivation intensity (i.e., natural forest < smallholder agriculture < plantations) [5,7,20]. While cultivation strongly affects stream conditions, the influence of grasslands may be less pronounced and probably depends on the intensity of their use as pastures [21,22].
As the human population increases, settled areas become important sources of water chemistry alteration [4,17]. Unique stream chemistries in built-up areas result from the conversion of natural landscapes to impermeable surfaces, the production of waste and its more direct hydrologic pathways to surface waters via drainage systems, the reduction in the capacity of the landscape to retain and transform nutrient and organic matter inputs due to loss of vegetative cover, and the alteration of streambed sediments and bank erosion by increased peak flows [10,23,24,25]. Thus, despite a low percentage of densely populated built-up areas in catchments, the impact of settlement on water chemistry frequently exerts effects of agricultural land use.
A review of the literature illustrates that only a few studies have been conducted in small catchments of the subtropics [5,7,10]. McKee et al. [4] indicated that responses of the subtropical river chemistry to anthropogenic changes are similar to those of temperate zones, while the seasonal patterns appear to be typical for the tropics. However, it is still not clear to what extent the progressing intensification of cultivation, and accompanying settlement development in rural areas deforested a substantial time ago, affect the physico-chemical properties of stream water in the subtropics.
The North-Eastern extension of the Indian Peninsular Shield with the Meghalaya Plateau, where the present study was conducted, is an area where thousands of years of human activity in the monsoonal rainfall conditions have caused almost complete deforestation and accelerated soil degradation [26]. In recent decades, the rapid increase in population has generated the intensification of farming systems and settlements [27], which are mirroring similar tendencies throughout the tropics [28]. The implications of human impact for water chemistry in subtropical regions can therefore be investigated and predicted on the basis of observations from the Meghalaya Plateau, where population pressure has already changed environmental conditions at various catchment scales.
It was hypothesized that the low ion pool previously observed in old and highly weathered soils of this region [29,30] should be reflected in natural low ion concentrations in stream water. It was further suggested that changes in dissolved solute loads under the anthropogenic impact (i.e., various population densities and different LULCs) would be readily observed in small catchments with homogenous climates, geologies, topographies, and soils, as well as similar atmospheric deposition due to their small geographical area.
The aim of the present paper is to (i) investigate spatial and temporal variations in water physico-chemical properties within a subtropical nested catchments system; (ii) elucidate the sources of ions and trace metals, as well as the flowpaths of water, in a long-term anthropogenically-modified landscape; and (iii) verify that stream water chemistry within such a subtropical elevated shield has distinct features compared to other headwater areas in the tropical zone.
2. Materials and Methods
2.1. Study Area
The study area is located in the Meghalaya Plateau between the Bengal Plain and Brahmaputra valley in Northeast India at an elevation of nearly 2000 m (Figure 1 and Table 1). Detailed measurements were carried out in the upper part of the Umiew catchment, with the nested Nongkrem catchment draining the southern slope of the plateau. The catchment system is representative of the climate, geology, topography, soils, and effects of long-term human activity for higher elevations of the Meghalaya Plateau [27].
The climate is classified as Cwb, subtropical, and monsoonal with a dry winter according to the Köppen system. Mean annual air temperature is 14 °C, with a rare fall of minimum temperatures below 0 °C during the winter. Mean annual rainfall reaches 2400 mm at Shillong, with 80% of rainfall concentrated during the South-West monsoon between June and September [31]. The maximum river discharge occurs during the rainy monsoon season, while the minimum discharge is observed during the dry winter (December–February).
The Nongkrem catchment is underlain by Precambrian granites that form one of many intrusions in quartzites of the plateau basement [32]. Granites have 69.4 wt.% SiO2, 14.4 wt.% Al2O3, 4.6 wt.% K2O, 3.8 wt.% Fe2O3, 2.4 wt.% NaO, 1.6 wt.% CaO, and 1.2 wt.% MgO [33]. Phosphorus, manganese, and titanium contents are generally below 1%. The average mineralogical composition of the porphyritic granite is dominated by K-feldspar (36%), plagioclase (26%), and quartz (23%). An important constituent of the granite is also biotite (10%), while chlorite, apatite, sphene, muscovite, and magnetite occurs sporadically [33,34]. In the upper Umiew catchment, quartzites surrounding granites mainly consist of quartz (81%–94%) and a sericitic matrix [32]. Local man-made excavations show that granites are more deeply weathered (15–20 m) than quartzites (2–3 m). Within granites, big boulders are abundant both at the surface and in the subsurface [35].
The topography of the study area is hilly, with flattened peaks rising to a general height of 1950 m a.s.l. and 1850 m a.s.l. within quartzites and granites, respectively [35]. The valley floors are up to 150 m below hilltops. The limited altitudinal range has caused relatively steep slopes with a dominant gradient of 20° to develop.
The soils developed over granites and quartzites have been classified as silty-loam Ultisols and silty-loam Inceptisols, respectively [36] (Table 2). Similar to soils found in other geologically old landscapes with intense weathering in a tropical and subtropical climate, they are acidic and strongly leached [29].
2.2. Long-term Anthropogenic Activity in the Studied Catchments System
The most pronounced effects of long-term anthropogenic activity in the studied catchments system are LULC changes [27]. Permanent deforestation was initiated at least 2000 years ago due to the charcoal production used in iron smelting [37]. Iron ore was extracted from granite-containing magnetite. The iron processing was abandoned in the mid-19th century. The effects of the smelting are still visible in the form of almost total deforestation; the iron slag scattered over a large area and sand deposits in the bottoms of valleys and streams can be observed [38]. Sand and granite boulders are extracted locally along rivers for construction purposes [39].
Pressure on land resources again intensified in the second half of the 20th century due to population growth. In effect, the population density reached an average of 400 inhabitants km−2 in the studied region, and almost 1500 inhabitants km−2 locally in small catchments [40]. Old deforestation and demographic explosion meant that present-day vegetation is restricted to the mosaic of natural semi-evergreen deciduous forest, secondary pine forest, and grassland interspersed with settlement and cultivated land (Figure 1C
A shortage of agricultural land due to population growth caused the development of intensive agriculture, combining elements of traditional shifting cultivation with sedentary intensive cultivation [30]. This approach is based on natural soil fertilization (without the use of chemical fertilizers) by burning biomass under soil cover and tillage twice a year. Potato is the dominant crop cultivated within irregularly terraced slopes. Monocropp production is complemented by a small amount of pig, goat, and poultry farming for the requirements of farmers’ families.
As the population increased, the built-up areas expanded. The village centres have compact buildings resembling urban housing estates. Almost all buildings are made of concrete (the most popular and cheapest construction material) and covered with sheet metal. In the centre of the villages, the streams are regulated by concrete bands. The roads in the villages are asphalt or concrete. The built-up areas do not have a sewage treatment system. Waste is frequently burned on site. Charcoal and coal are used for cooking and heating houses, respectively. It is common to use streams on the outskirts of built-up areas for washing clothes, while the main river is used for car washing.
2.3. Sampling Design and Collection
We used a nested sampling approach, with a total of 16 sampling sites in 12 sub-catchments (Figure 1 and Table 1). The sites were chosen according to the environmental homogeneity of the catchments (geology, soil, topography, climate) and their anthropogenic transformation (population density, LULC structure). The detailed sampling was conducted in the Nongkrem catchment (4 km2) in four selected springs (S1–S4), two first-order forest sub-catchments (F1–F2), two first-order cultivated sub-catchments (C1–C2), and two third-order and three fourth-order populated with mixed land use (forest, grassland, cultivated land and built up) sub-catchments.(M1–M2 and M3–M5). It was assumed that the inclusion of springs would help to explain the transformation of water chemistry downstream. The Nongkrem catchment is nested in the Umiew catchment (~60 km2), where we sampled three fifth–order populated with mixed land use sub-catchments (M6–M8). Sampling, which consisted of measurements of the physico-chemical parameters of water and collecting samples for chemical analysis, was conducted four times (i.e., twice during the dry winter season (December 2014 and 2015) and twice during the monsoon season (August 2014 and 2015)). The samples were collected in 250 mL pre-cleaned high-density polyethylene bottles and stored in a cooler box with ice. All samples were analysed in the laboratory within one week after collection.
2.4. Chemical Analysis
Water temperature (T), pH, and EC were measured in the field. Analyses of the main ions and trace metals were conducted in a laboratory. Prior to analysis, samples were filtered through a Whatman glass microfiber GF/D with a filter size of 25 mm and pore size of 0.45 µm. Cations (Ca2+, Mg2+, K+, Na+, NH4+) and anions (Cl−, SO42−, NO3−, PO43−, F−) were determined by ion chromatography ICS3000 DIONEX, including 3 × 250 mm IonPac CS16 and 2 × 250 mm IonPac AS18 analytical columns for cations and anions, respectively. Limits of detection were: Ca2+—0.4 mg L−1; Mg2+, Na+, and NH4+—0.2 mg L−1; and, SO42−, NO3−, PO43−, Cl−, F−, and K+—0.1 mg L−1. Trace metals (Al, Cd, Co, Cr, Cu, Fe, Mn, Ni, Pb, Sr, and Zn) were determined using an ICP MS TOF (Coupled Plasma Mass Spectrometer Time-of-Flight) spectrometer (OptiMass 9500, GBC Scientific Equipment, Melbourne, Australia). The limit of detection was 0.01 μg L−1. A multi-element standard (CLMS-2AN) working solution with the elements to be analyzed at a concentration of 10 μg L−1 was prepared in stock solutions. All solutions were 1% v/v in nitric acid. For calibration, multi-element solutions were prepared with the following concentrations: 0 (blank), 1, 10, 50, 100, and 1000 μg L−1. The values of the highest concentrations of the models used for calibration were approved as linear limits of signal dependence on concentration. Bicarbonates (HCO3−) were determined using titration. Dissolved organic carbon was measured with the IL 550 TOC-TN by HACH. The limit of detection was 0.1 mg L−1.
Ionic (charge) balance error was expressed as the difference between cation and anion charges divided by their sum and multiplied by 100%, not exceeding 10%. The certified reference materials ERM CA713 and KEIJM-02 prepared by the Institute of Reference Materials and Measurements, Belgium and by Environment Canada, respectively, were used to verify the quality of the obtained results. Among analyzed elements, NH4+, PO43−, F−, Cd, Co, Mn, and Pb were not detected, because their concentrations were below the detection limit.
2.5. Statistics
Data were checked for a normal distribution using the Shapiro–Wilk test (p < 0.05). Despite attempting several transformations, some chemical elements did not follow normal distributions. Therefore, a non-parametric Mann–Whitney test was applied to investigate which physico-chemical parameters differed between the two sampling seasons. In addition, a non-parametric Kruskal–Wallis one-way analysis of variance by ranks was performed to evaluate whether physico-chemical variables differed between the springs, forest, cultivated, and mixed land use catchments. If the analysis showed significant differences in water properties between the catchments, ranks were compared with a post hoc Dunn’s significant difference test at p < 0.05.
Principal component analysis (PCA) was conducted to reduce the dimensionality of the data sets and define major factors explaining variation in the physico-chemical properties of stream water. PCA was only applied for the Nongkrem catchment (sub-catchments F1–F2, C1–C2, M1–M2, M3–M5) with the highest homogenous geology, topography, climate, and soils, but a different population density and LULC (Figure 1 and Table 1). The springs were not included in the PCA because they are not related to a particular land use. Analysis with anthropogenic variables (i.e., population density and LULC) was performed for the winter and monsoon seasons separately [41,42]. Data were standardized with a standard deviation of 1. Varimax rotation of the factors was used for each of the PCAs to maximize the variation explained by the factors and to produce independent factors [43]. The maximum number of factors to be extracted was determined using the Kaiser Criterion, which only takes into account factors having eigenvalues higher than 1. Relationships between variables were interpreted as strong (>0.75) and moderate (≥ 0.5 ≤ 0.75) [44,45]. SYSTAT software was used to perform statistical analysis.
3. Results and Discussion
3.1. Spatial and Seasonal Variation of Physico-chemical Properties of Stream Water
3.1.1. Physical Variables and Major Elements
The Mann-Whitney test indicated that most of the variables did not show statistically significant seasonal differences in springs (S1–S4) and first-order sub-catchments (F1–F2, C1–C2) (Table 3). In contrast, almost all variables differed in the higher-order densely populated sub-catchments with mixed LULC (M1–M2, M3–M5), and to some extent (M6–M8), between winter and monsoon seasons.
Major element concentrations and stream discharge were usually negatively correlated, except NO3−, SO42−, and DOC (Figure 2). Temperature was the only variable increasing almost progressively downstream in both seasons. Generally, stream water was found to be alkaline during winter and acidic during the monsoon season. Seasonal variations in pH did not exceed 1.5 pH, with a lack of a clear acidic trend downstream.
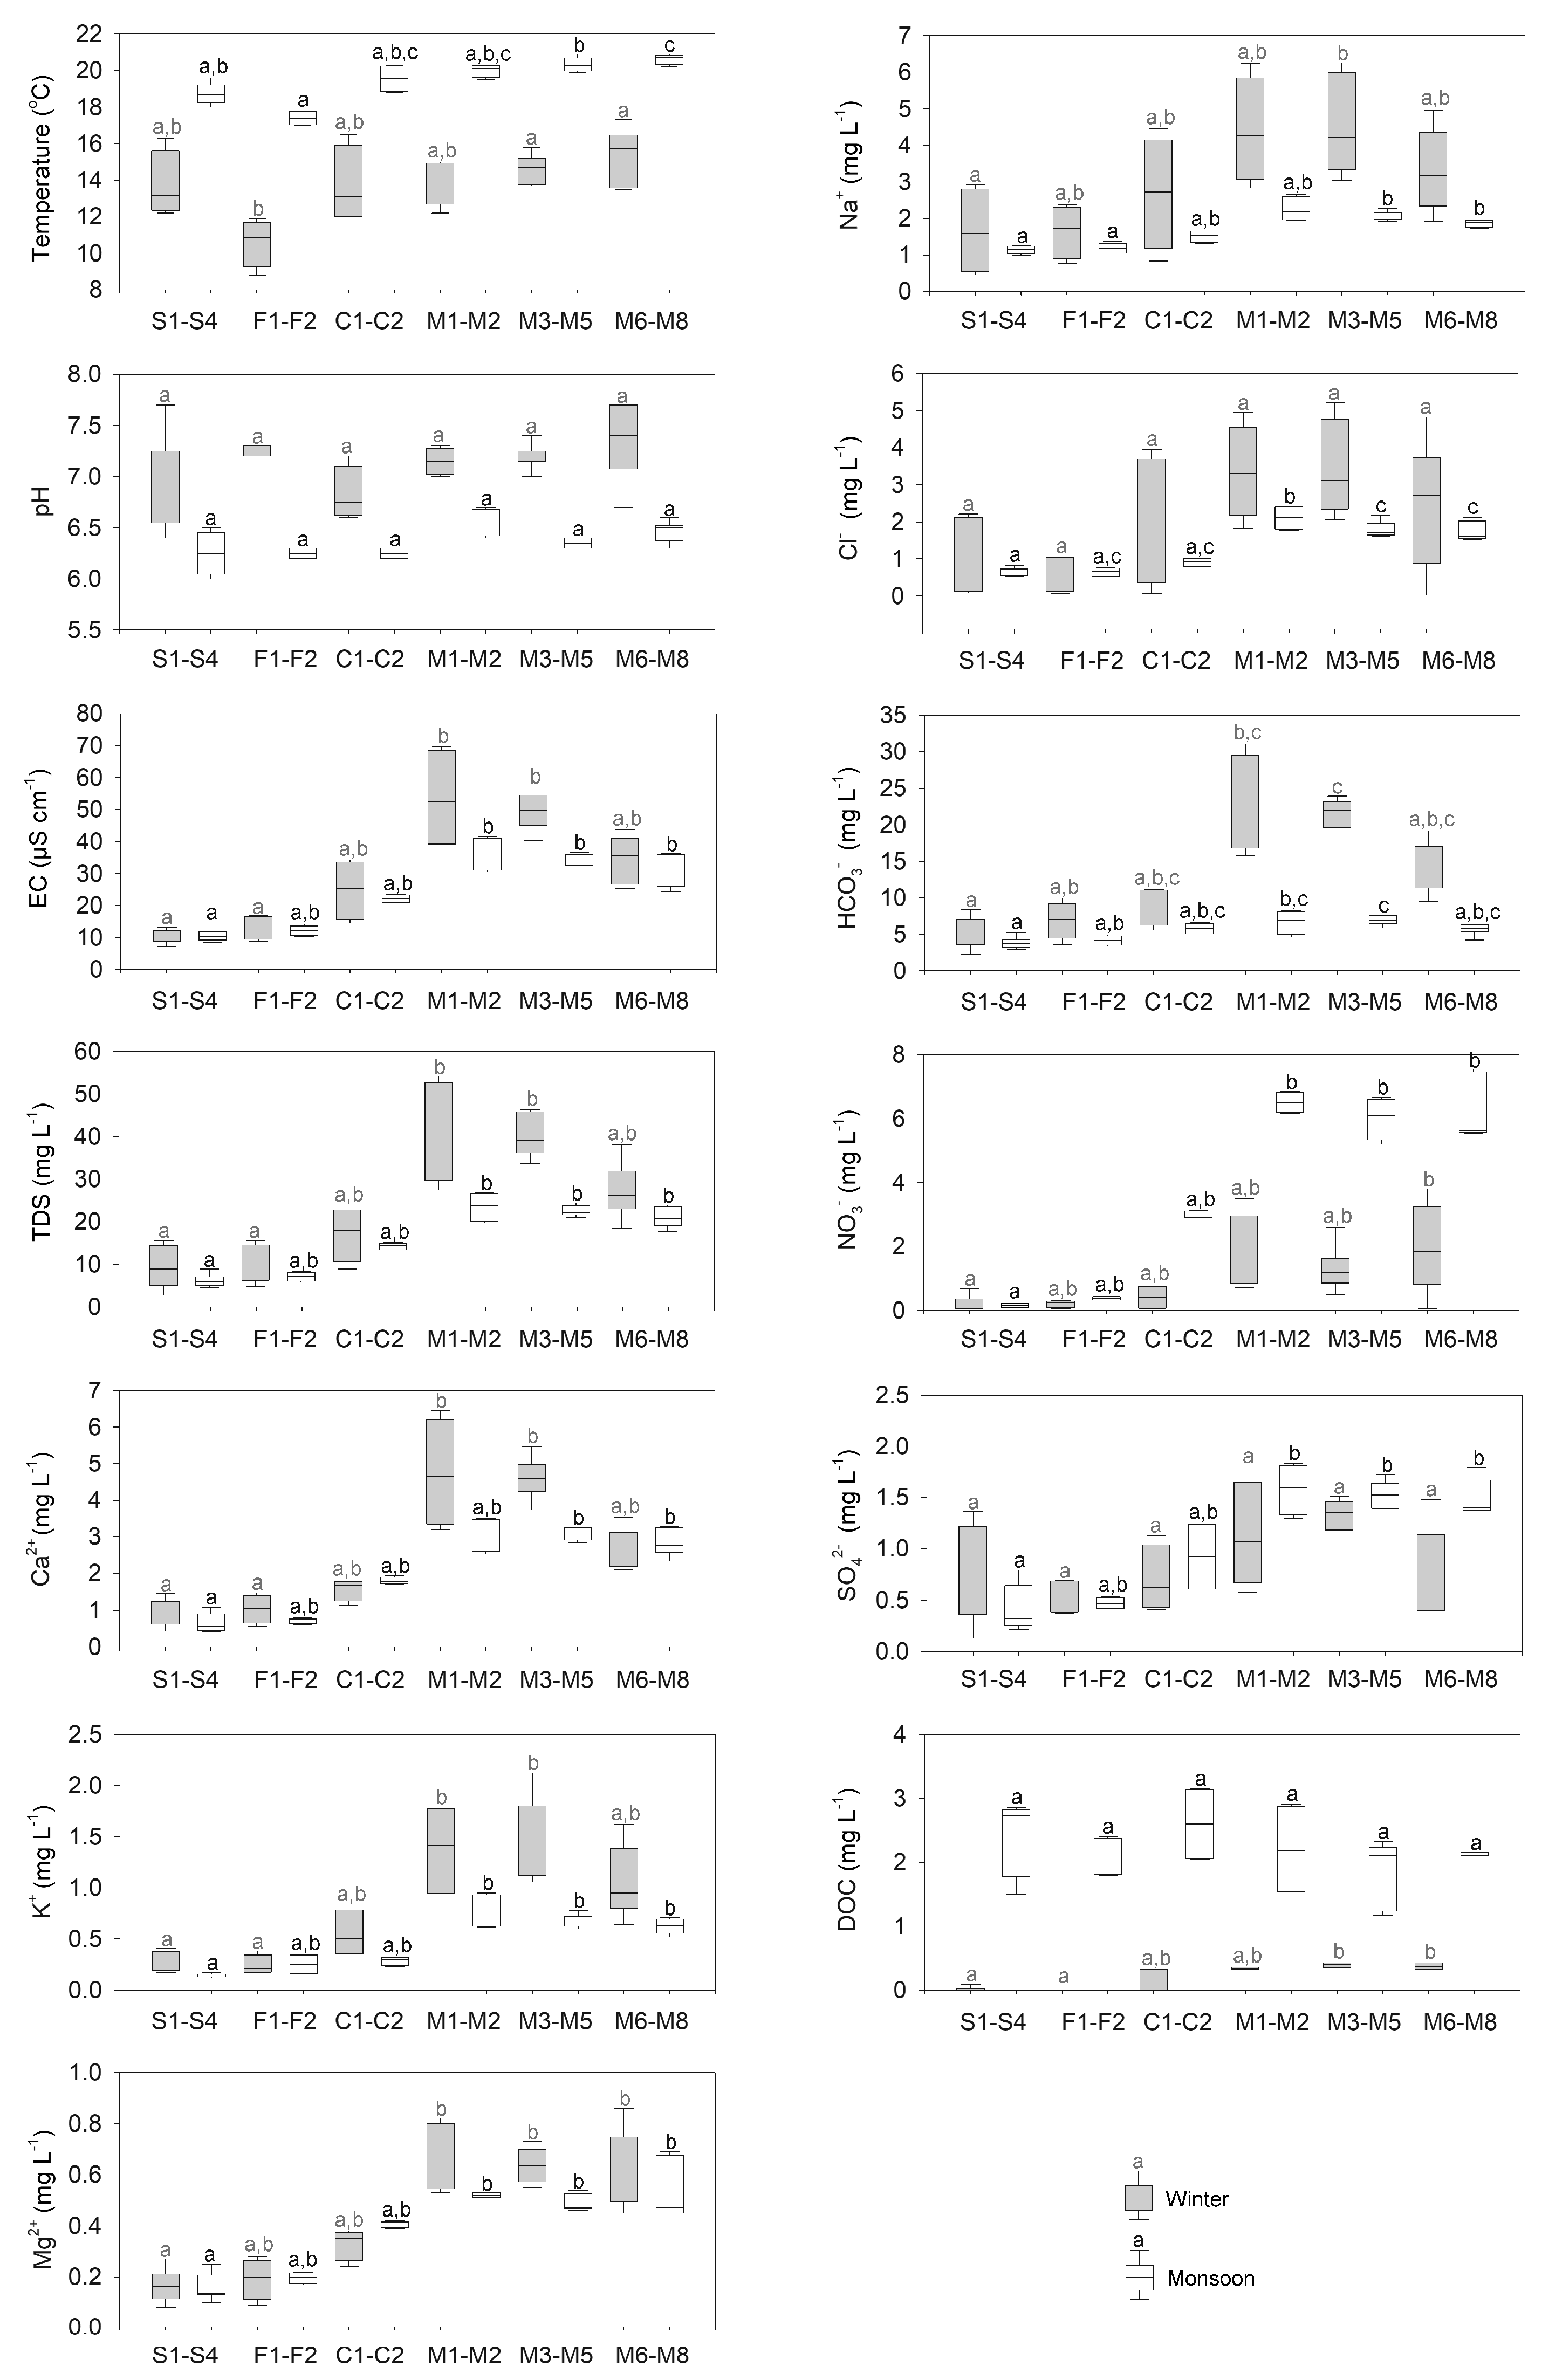
Concentrations of major ions were low, as reflected in the TDS and EC, both of which ranged from 4 to 52 mg L−1 and from 7 to 70 µS cm−1, respectively. Despite low concentrations, significant spatial differences between sampled sites were apparent in both seasons. Values were observed to increase downstream, but irregularly as tributaries that traverse different population densities and LULCs with various dissolved loads. Therefore, TDS and EC did not show a strong positive effect of the catchment area. A similar pattern was exhibited by most major ions.
The Kruskall–Wallis test indicated that, generally, spatial differences between springs (S1–S4) and first-order sub-catchments (F1–F2, C1–C2) were statistically insignificant in terms of their ion concentration in both seasons, and were usually smaller in the case of forest catchments compared to cultivated catchments (Figure 2 and Table 3). The highest concentrations of ions were observed in streams passing through areas with the highest human population densities. In effect, most significant differences were observed between headwater areas (S1-S4, F1–F2, C1–C2) and third–fourth-order densely populated sub-catchments with mixed LULC (M1–M2, M3–M5). The water chemistry of the latter was already similar to fifth-order sub-catchments of the Umiew river (M6–M8).
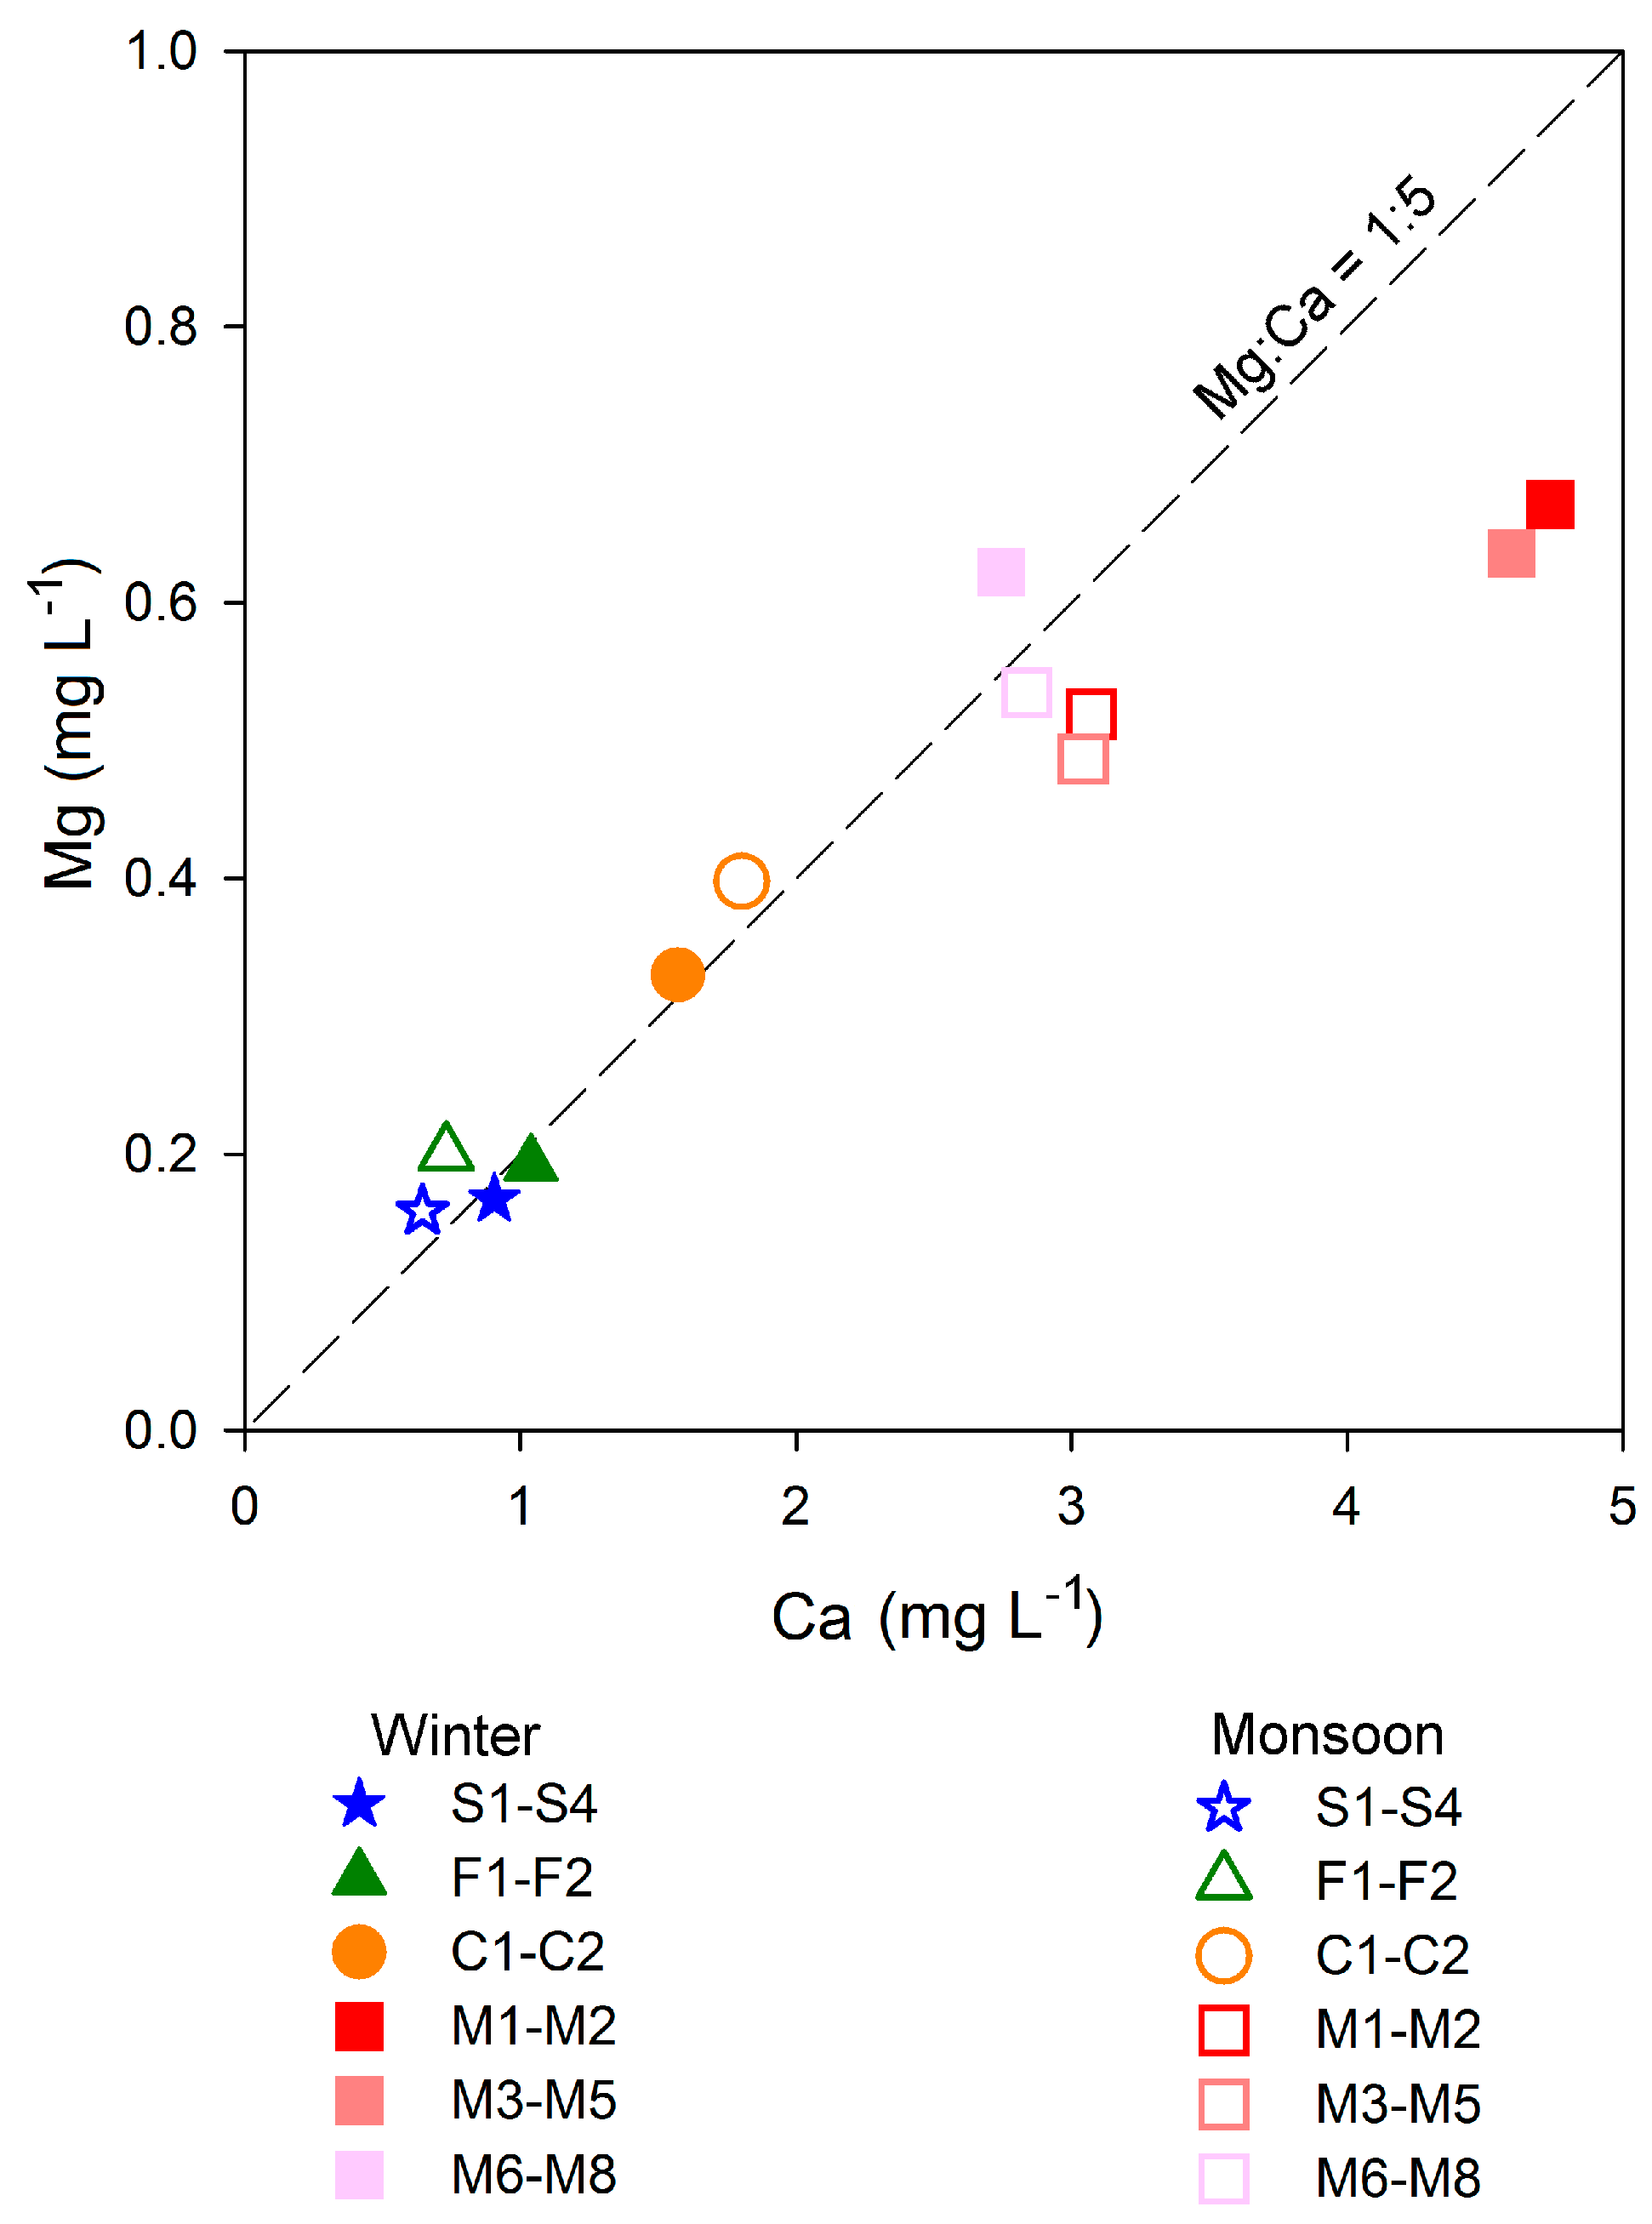
The relation of Mg and Ca can be an indicator of the anthropogenic impact, such as concrete weathering [45]. Concrete is the main material used for the construction of buildings and stream control in the studied nested catchments system. Usually, natural Mg2+ and Ca2+ comes from biotite and plagioclase feldspar occurring in granites [34,46,47]. Calcium concentration was approximately five times higher than that of Mg2+ in springs and the first-order catchments (Figure 3). Downstream, Mg2+ increased until it approached 0.6–0.7 mg L−1, while Ca2+ continued to rise, and was eight to ten times higher than Mg2+ in sub-catchments with mixed LULC (M1–M2, M3–M5). This enrichment is high relative to that expected from natural waters [48] and can be attributed to the concrete weathering of anthropogenic infrastructure [49].
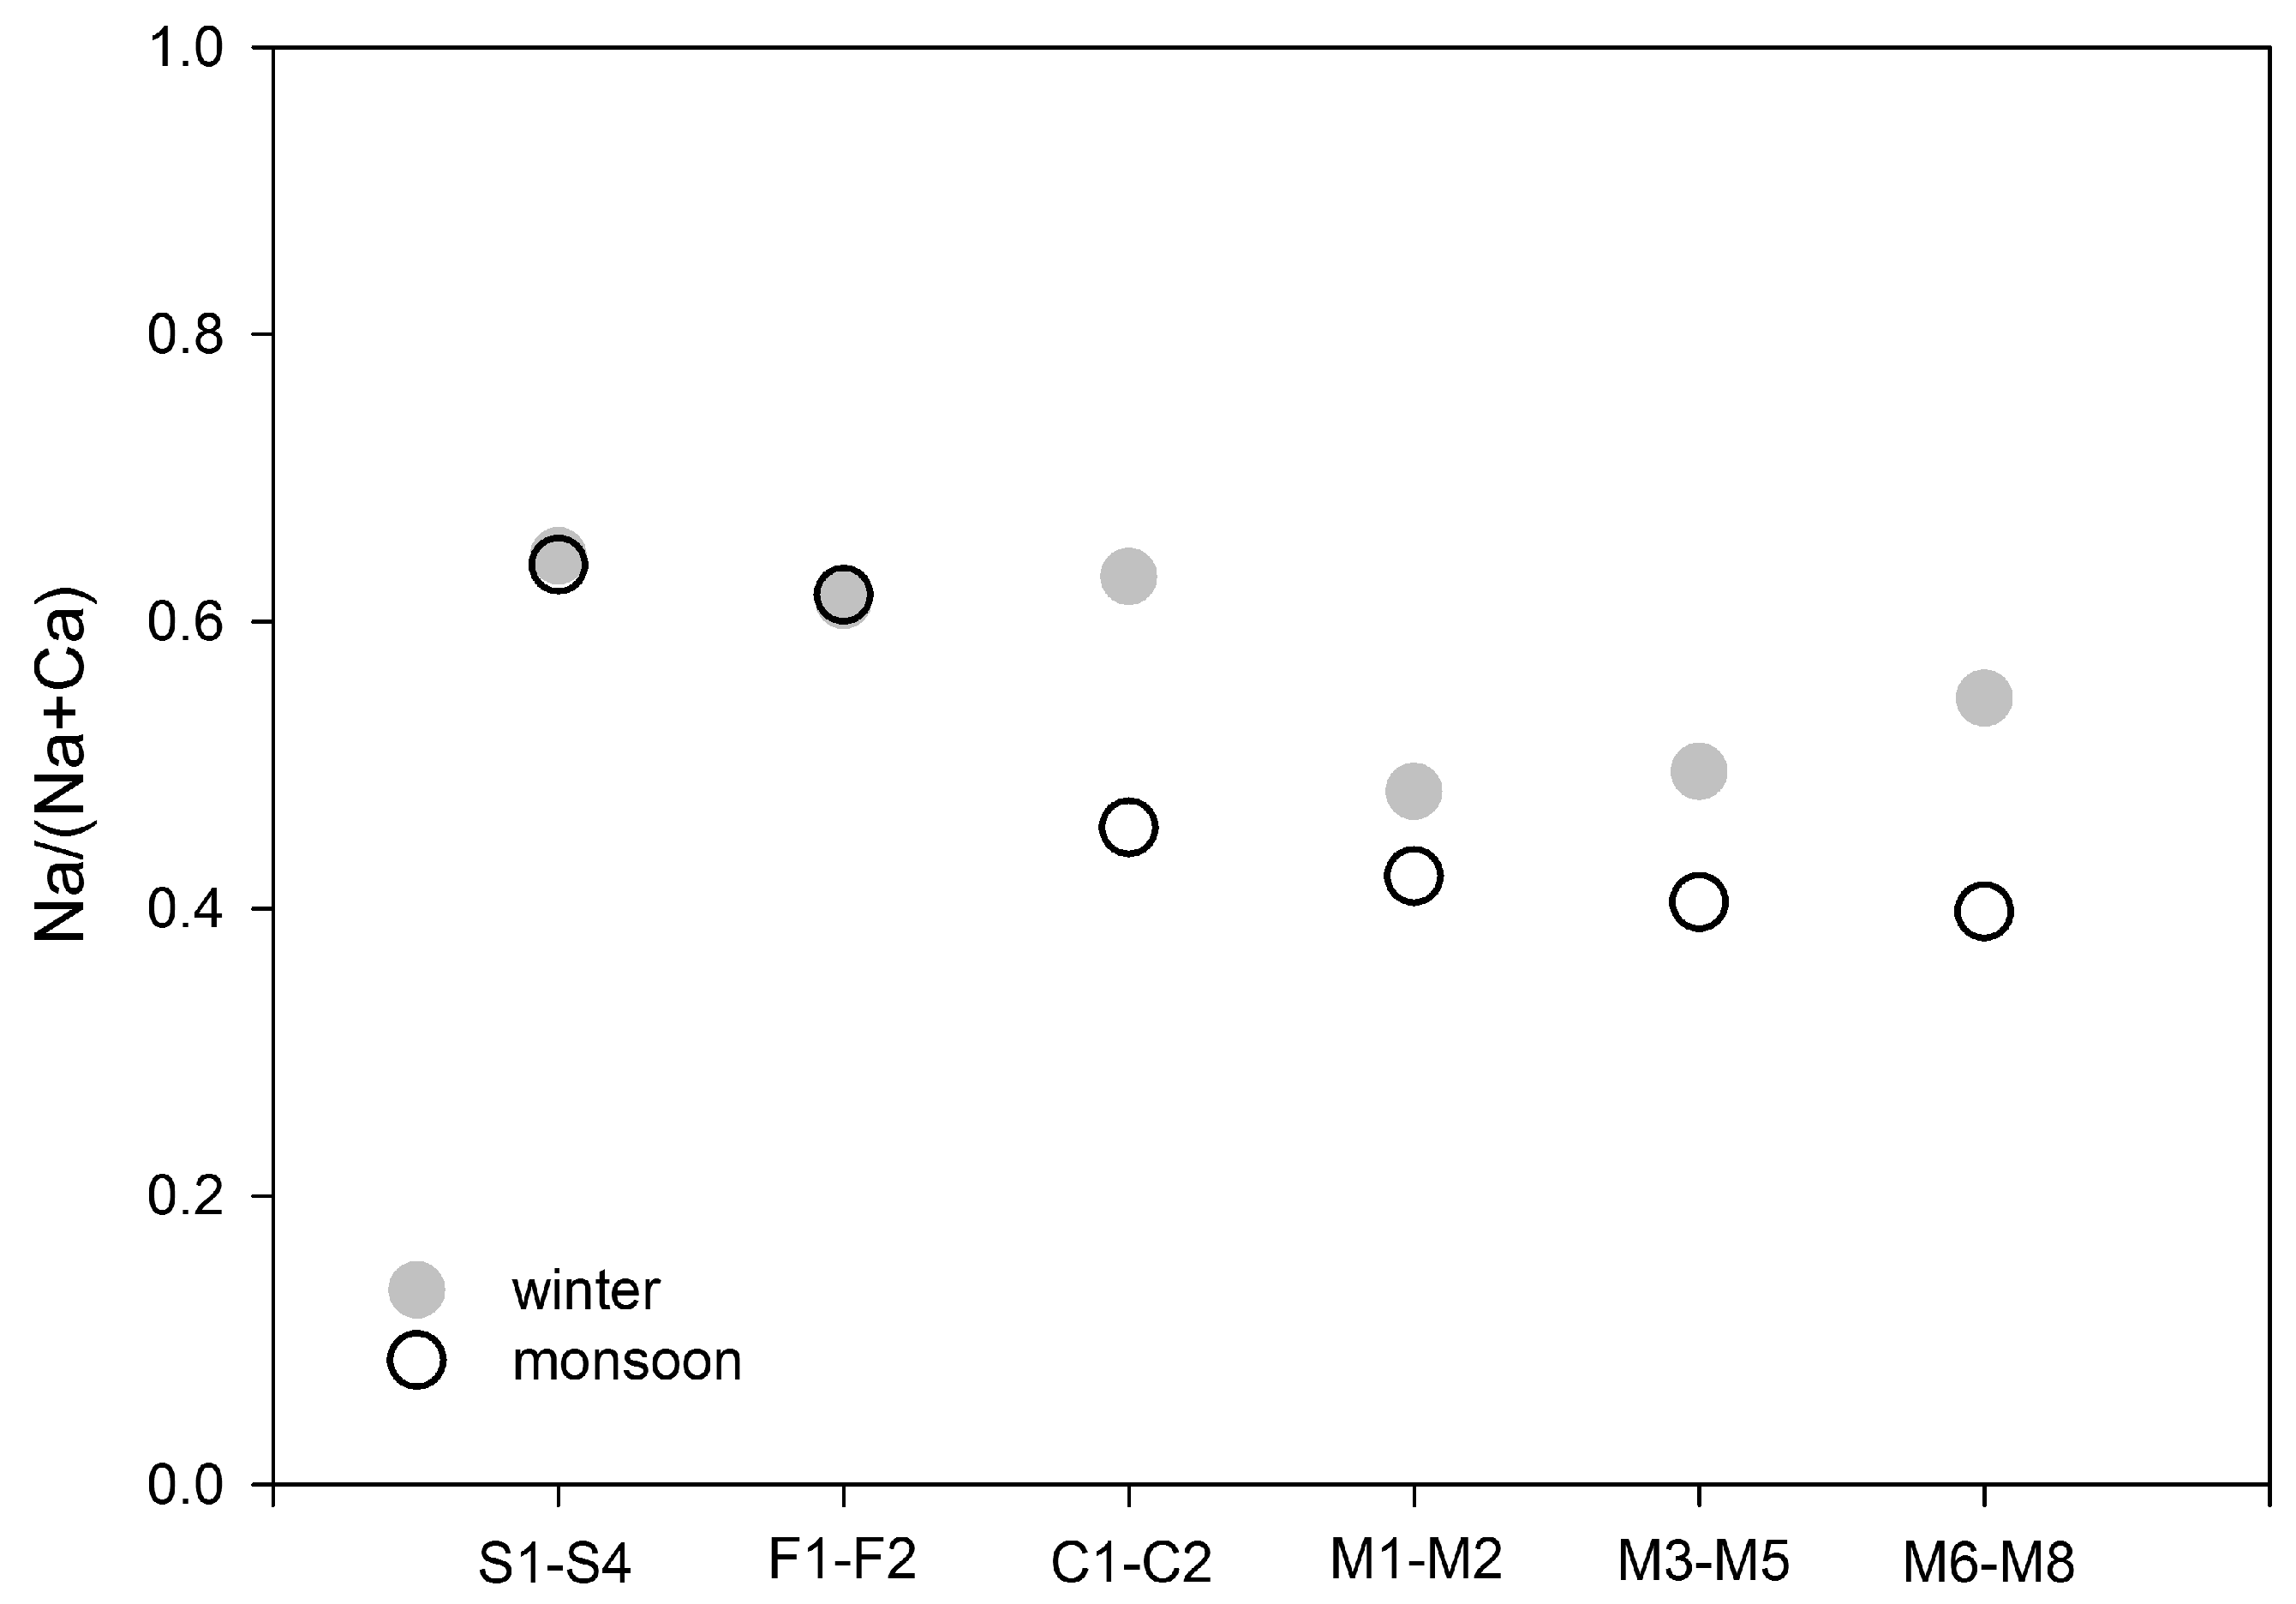
The important role of weathering in the supply of ions confirms the Na/(Na + Ca) ratio [50,51] (Figure 4). The Na/(Na + Ca) ratio was used as an indicator of cation inputs to stream water due to rainfall (ratio approaching 1) or weathering (ratio significantly below 1). The water from springs had a similar ratio of 0.64–0.65 in both seasons. It was only slightly lower in the first-order forest sub-catchments (0.62). The largest seasonal contrasts appeared in the first-order cultivated sub-catchments with values of 0.63 during winter and only 0.46 during the monsoon. In the densely populated third–fourth-order sub-catchments with mixed LULC, the Na/(Na + Ca) ratio was higher during winter (0.40–0.50) than in the monsoon (0.40–0.42). These values do not significantly differ from those found in fifth-order Umiew sub-catchments. The lowest values (even lower in the rainy season compared to the dry winter period) suggest the important role of anthropogenic input in densely populated sub-catchments with mixed LULC.
3.1.2. Trace Metals
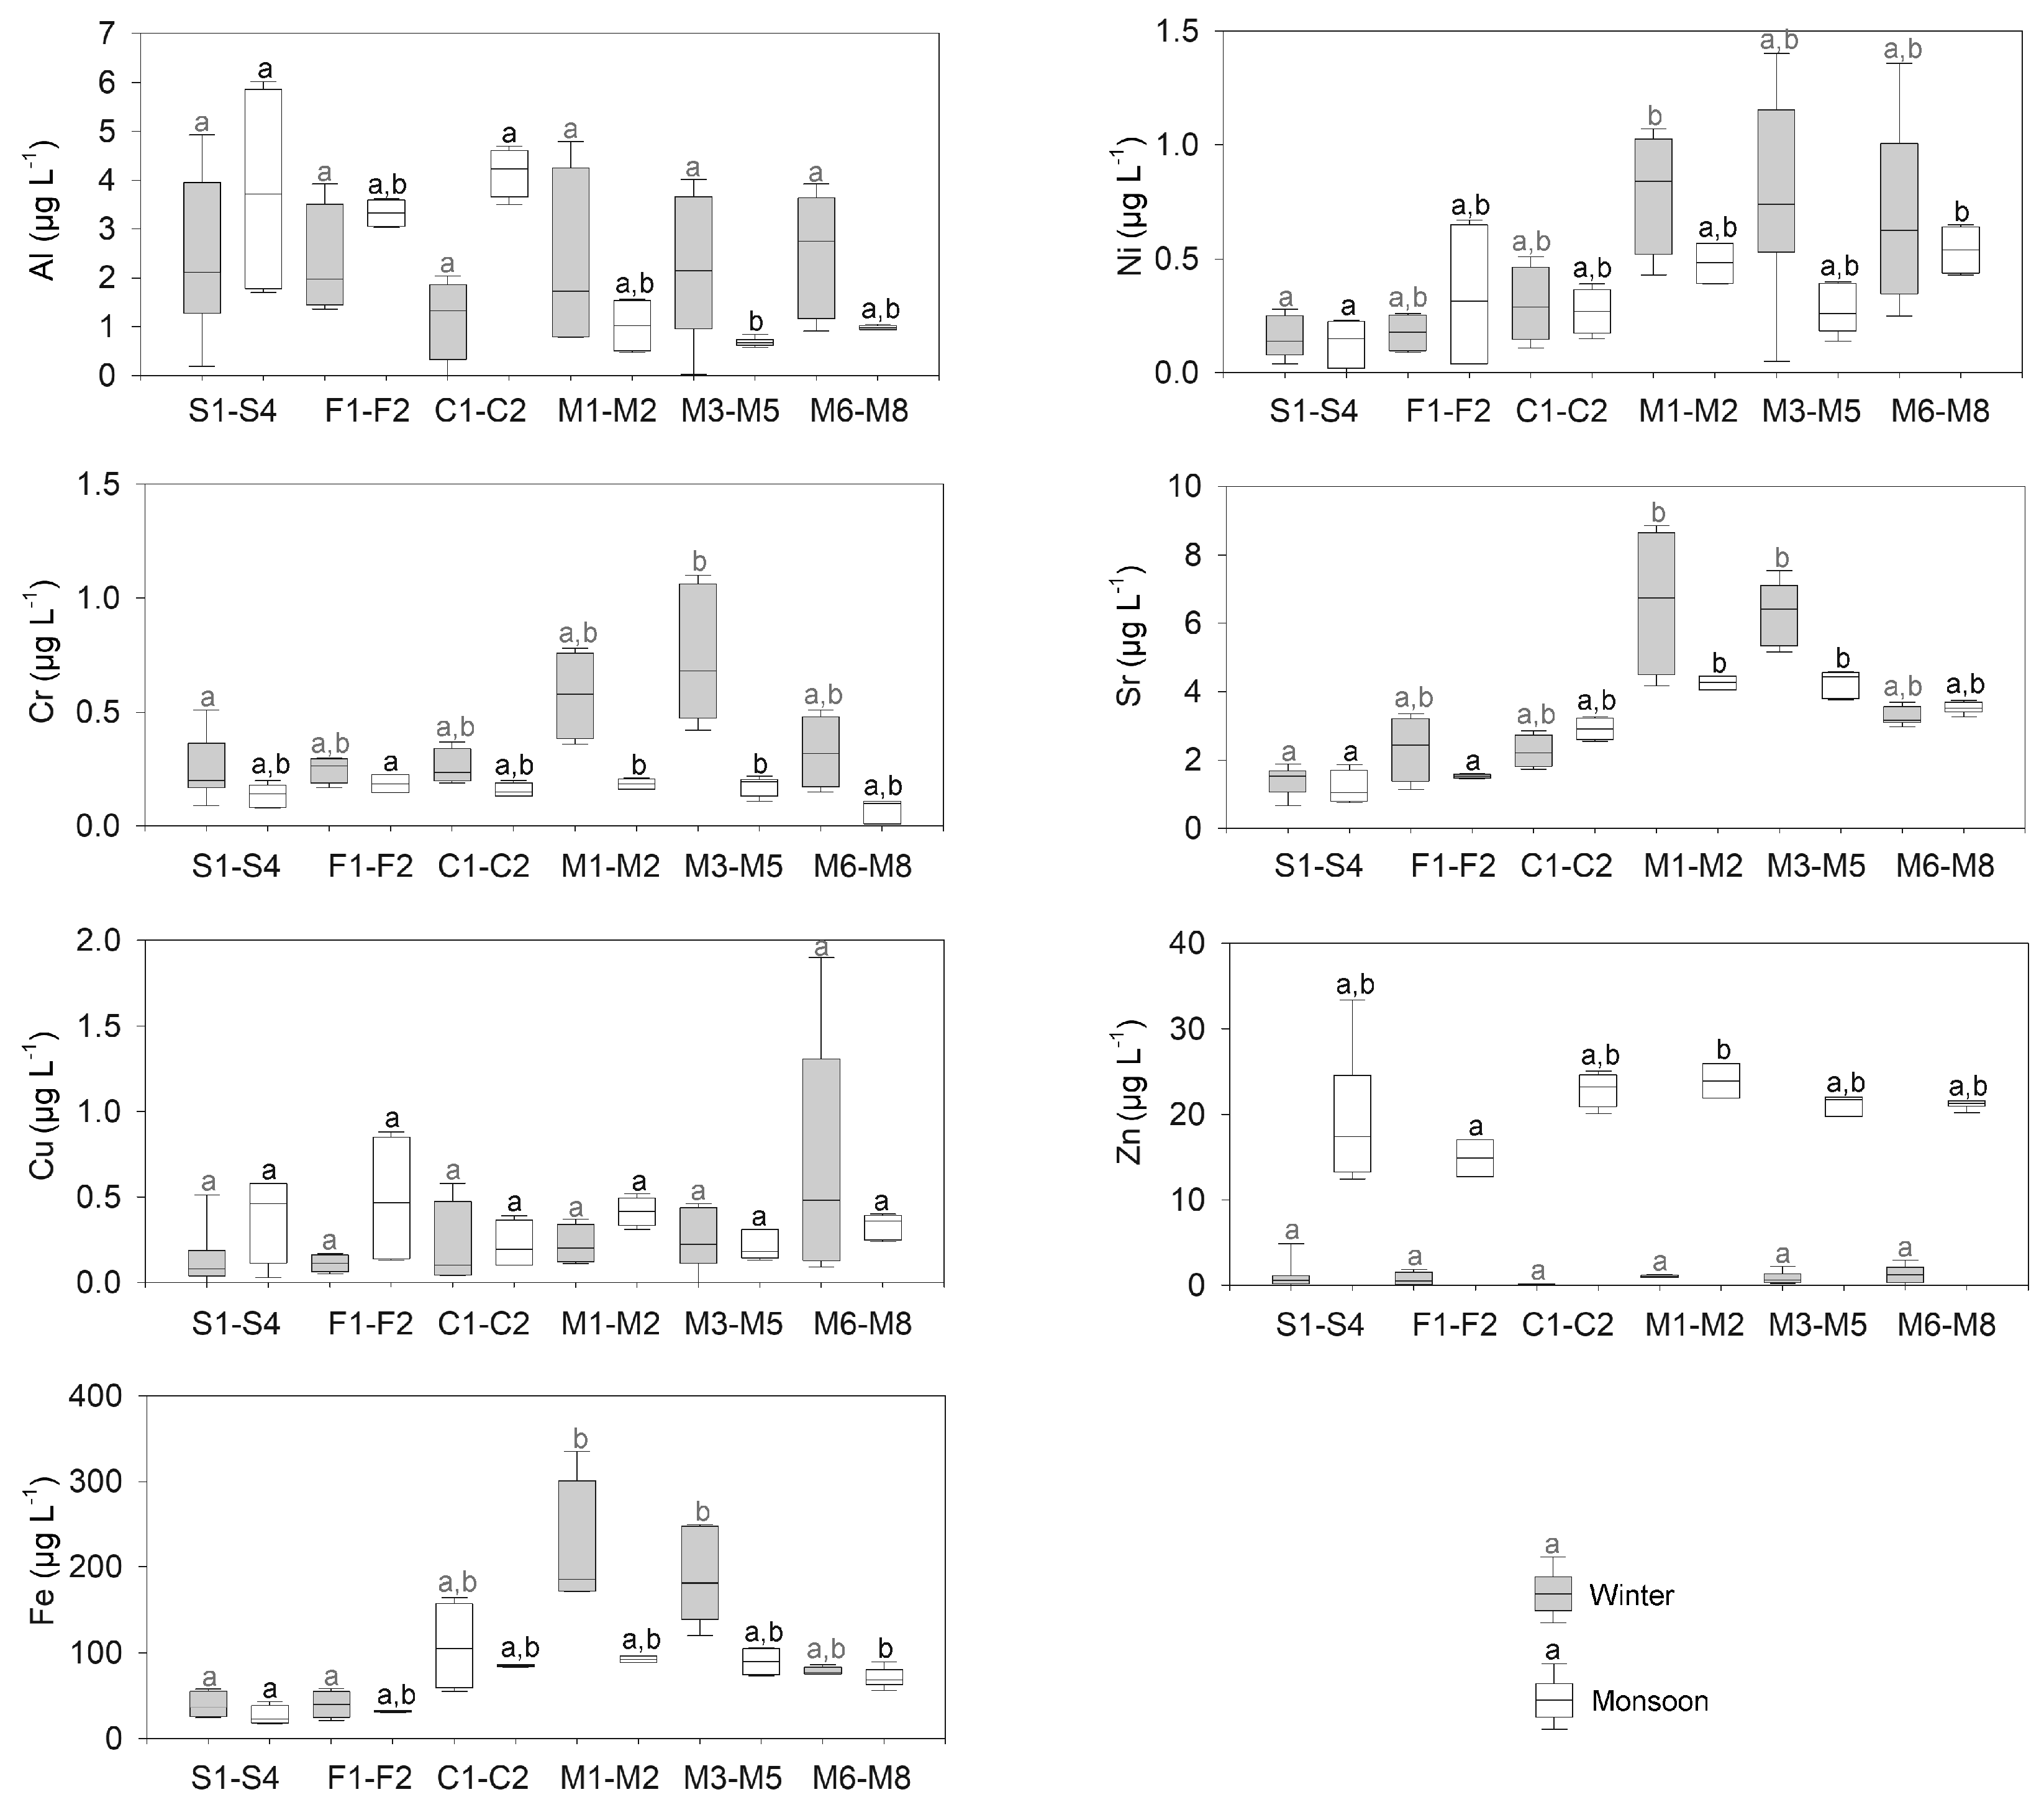
Almost all trace metals had concentrations lower than those rarely measured in other headwater areas of the tropical zone [51,52]. The exception was Zn, with a higher concentration and positive correlations with discharge. Zinc correlation with high discharge, as well as NO3−, SO42−, and DOC, during the monsoon season was probably the effect of metal mobilization from both, topsoil, and anthropogenic infrastructure (sheet metal roofs, metal gutters) [25,52]. The Mann-Whitney test indicated statistically significant seasonal differences in trace metal concentrations, mainly in densely populated sub-catchments with mixed LULC (Figure 5, Table 3). Nickel and Cu were the only metals that did not show statistically significant differences between winter and monsoon seasons. The concentrations of Cr, Cu, and Ni were lowest between trace metals and were generally below 2.0 µg L−1. The low natural content of such metals in soil meant that even long-term anthropogenic activity was not able to significantly increase their concentrations in stream water of the densely populated higher-order sub-catchments.
The Kruskall–Wallis test showed less pronounced spatial differences in the concentration of trace metals compared to the ions (Figure 5). Metal values usually increased, but rather irregularly downstream. The order of most abundant metals Fe > Zn > Al > Sr was the same in all sub-catchments and in both seasons. Aluminium was the only metal usually having a higher concentration in springs and the first-order sub-catchments compared to higher-order sub-catchments. Increased Al concentrations in the headwater area of the Nongkrem catchment might be attributed to the naturally high saturation of subtropical soils with Al [29,51] (Table 2). Especially during the monsoon, Al became more soluble as an effect of the rainfall impact with a low pH and could be supplied to the river network [48]. At the same time, a large proportion of anthropogenic impermeable surfaces in the higher-order sub-catchments (M1–M2, M3–M5, M6–M8) could reduce the Al washout from topsoil.
3.1.3. Hydrochemical Facies
A Piper diagram is a standard approach of examining the structure of hydrochemical facies and for exploring hydrological processes in catchments [48]. The facies pattern for the studied catchments system is typical for rivers draining granites [46,47] and modified by human activity [45] (Figure 6). Chemistry of groundwater in granite areas first depends on the mineral composition of underlying granite and soil that changes with depth. With increasing depth, the values of pH and the concentrations of Na+ and HCO3− tend to be progressively increased, while the concentrations of Ca2+ and Mg2+ are decreased [53]. Thus, springs (S1–S4) in the Nongkrem catchment are probably controlled by shallow groundwater of the Na+–Ca2+–HCO3− type in both seasons. These facies also occurred in the first-order catchments with the dominance of forest (F1–F2) and cultivation (C1–C2). Anthropogenic activities and human infrastructure were additional sources of Ca2+ and NO3− ions [45] that changed the water type to Ca2+–Na+–HCO3− and Ca2+–Na+–NO3−–HCO3− downstream (M1–M2, M3–M5) during winter and monsoon seasons respectively. Similar facies dominated in the fifth-order sub-catchments of the Umiew river (M6–M8). The seasonal enrichment of springs and forest stream facies with Cl− during the monsoon was small. At the same time, streams with mixed LULC (M1–M2, M3–M5, M6–M8) received a higher input of Ca2+ and SO42−. This can be interpreted as evidence for a relatively low input of chemical elements from rainfall (sea spray) compared to the bedrock, soils, and anthropogenic infrastructure in the investigated catchments [47,48,51].
3.2. Sources of Solutes and Their Pathways in Light of PCA in the Nongkrem Catchment
3.2.1. Impact of Population Density and Land Use on Water Chemistry
PCA reduced the winter and monsoon datasets with anthropogenic variables (population density and LULC) to five and four factors, respectively (Table 4 and Table 5). The first factors of the PCA in both seasons reflect the elevation of chemicals mainly associated with population density, built-up areas, and grassland in the Nongkrem catchment (Table 4 and Table 5). Population density has a strong correlation with built-up area (R2 = 0.967), but a weaker one with grassland (R2 = 0.489). Therefore, anthropogenic sources of chemical elements and their environmental pathways should differ between the above-mentioned LULC types.
Even in the lightly developed built-up areas, such as suburban or rural ones, the weathering of anthropogenic infrastructure can increase most of the major ions, which is an effect termed the ‘urban stream syndrome’ [44,54,55]. The increase of EC, pH, Ca2+, Na+, K+, Mg2+, HCO3−, SO42−, and Sr in sub-catchments with mixed LULC (M1–M2, M3–M5) suggests the dissolution of concrete observed in many densely settled landscapes [45,56,57]. Sources of chemicals from concrete in the Nongkrem catchment include reinforced embankments of channelized streams (bridgeheads, walls, gabions); concrete pipes and gutters in both seasons; and concrete roofs, walls of buildings, bridges, and roads, mainly in the monsoon season. The strong association of Sr with anthropogenic variables can be additionally related to the observed supply of domestic sewage, paved roads, alloy elements of infrastructure, ashes of coal used for heating houses, and locally scattered garbage incinerators [57].
Usually, the low values of NO3− and SO42− are associated with weathered granites [46]. Such concentrations are also visible in the first-order sub-catchments in both seasons (Figure 2 and Table 3). Downstream, nitrate levels suggest anthropogenic influences because they exceed 1.0 mg L−1 [58]. Elevated concentrations of NO3− and SO42− may reflect the effects of domestic sewage supply [9,55,59,60]. In addition, some households presumably led to a higher NO3− and SO42− input of farm manure from pigs, goats, and poultry kept by farmers, as observed in other tropical regions [19].
Several chemical elements were only seasonally associated with anthropogenic variables in the first factors of the PCA. Concentrations of DOC and Ni showed moderate relationships with population density and built-up areas during winter (Table 4). It was found that the large input of wastewater creates anoxic conditions by consuming dissolved oxygen and can release higher concentrations of DOC and some trace metals, including Ni [25].
In contrast, Cl− and Na+ were only associated with anthropogenic variables in the monsoon season. Concentrations of these ions can rise due to a flushing effect of domestic sewage effluents [23,59] (Table 5). Anthropogenic sources of Cl− may also affect the polyvinyl chloride (PVC) gutters and pipes used as part of building infrastructure [49]. Similarly, Fe concentration appeared to only have a positive association with anthropogenic variables in the monsoon season and probably reflected the additional supply of this element used for building construction. The negative relationship of Al with the first factor at the same time suggests that, in the built-up area, impermeable surfaces reduced the potential supply of Al from soil and rocks during monsoonal rainfall [57] (Table 5). This reduction was not balanced by the supply of Al from domestic sewage.
The first factor of PCA showed that grasslands have moderate and strong associations with stream water chemistry during winter and monsoon seasons, respectively (Table 4 and Table 5). Within grasslands, vegetation biomass with dense roots is sufficiently high to increase the ion pool in the topsoil more than in forest or cultivated land (Table 2). In the Nongkrem catchment, grasslands are used as pastures and for the collection of biomass for burning on cultivated fields [30]. Grasslands are also densely covered by granite outcrops (boulders). It was found that impermeable rock surfaces and increased soil compaction due to grazing reduce rainwater infiltration and facilitate ion transfer to streams through increasing Hortonian overland flow [21] and shallow subsurface flow [50,51]. Moreover, it is probable that observed sand and granite extraction for construction purposes in and along channels passing through grasslands in the Nongkrem catchment [35,39] were the cause of increased chemical concentrations in stream water [61].
Factor 2 during winter and factor 3 during the monsoon deciphered the impact of forest and cultivation on stream water chemistry in the Nongkrem catchment. Forest was not associated with chemical elements in either season. Forest soils of the Nongkrem catchment are poor in chemicals [30] Table 2). Fast litter decomposition and nutrient uptake lead to the ion stock being held mainly in living biomass [62]. In addition, old deforestation meant that, except for small first-order sub-catchments (F1–F2), where average forest cover exceeded 90%, the share of forest in other sub-catchments was reduced to only 3%–34% (Table 1).
In contrast, cultivated land was positively, but moderately, associated with temperature in both seasons, as well as with some ions and trace elements during the monsoon. Increased cultivated areas led to a rise in water temperatures owing to the loss of riparian vegetation and warming of surface runoff on exposed surfaces [11]. Seasonality of the correlation between cultivated land and some chemical elements reflected features of the sedentary cultivation system in the monsoonal climate of Meghalaya [63]. During the dry winter, soil was not cultivated and there was a lack of runoff linkages between slopes with cultivated fields and the drainage network in the valley bottoms. During the rainy monsoon, multiple soil overturning took place due to tillage, sowing, and harvesting combined with runoff that probably increased weathering rates and the chemical supply to rivers, as observed in other agricultural regions [64]. On the other hand, the use of only natural fertilizers such as charcoal, as an effect of biomass combustion [63], probably induced a liming effect in the soil (i.e., increase of pH). This effect could locally reduce the mobilization of metals [65]. As a result, cultivated land was a less important source of chemical elements in the Nongkrem catchment.
3.2.2. Role of Groundwater in Modification of Water Chemistry
No particular anthropogenic variables showed any significant association with factor 3, which only appears during the dry winter (Table 4). Therefore, this factor may represent a groundwater signature. Groundwater flow can be rich in chemicals due to the dissolution of feldspars, plagioclase, and biotite included in granites or cation exchange reactions [34,46,53]. Dissolution of Na-bearing silicates increases Na+. An example of this process is the plagioclase feldspar albite (NaAlSiO3O8), which is easy weathered. The incongruent reaction of albite to kaolinite releases Na+ into solution. Such associations were more easily observed during baseflow in the dry season. Most of the ions occurring in this factor during winter were included in the first factor during the rainy monsoon (Table 5). This result suggests that the anthropogenic impact overwhelms ions supplied by groundwater in the monsoon season.
3.2.3. Trace Metal Sources
The only variables that load on factor 4 are pH and Al during winter (Table 4). This result suggests that Al was mainly controlled by pH in the dry season. Most naturally occurring Al resides in feldspar, chlorite, and biotite of granites in the Nongkrem catchment [33,34]. Their weathering and alteration products lead to a high content of Al in soils [29,30] (Table 2). Additional anthropogenic sources of Al include remnants of iron smelting slag [37]. None of those are associated with a particular LULC in the Nonkgrem catchment. Factor 4 has no analogue in the monsoon season and both pH and Al were included in factor 1 (Table 5).
Factor 5 distinguished the trace elements Cr and Zn during winter (Table 4). Its content was similar to factor 2 that also covered only trace metals Cr, Cu, and Ni in the monsoon (Table 5). Trace metals tend to be high in old and highly weathered rocks, such as those in the Nongkrem catchment. This phenomenon is attributed to enhanced trace elements leaching from rocks due to larger solid surface areas and the increased weathering of secondary minerals in granites such as chlorite, biotite, garnet, and magnetite [66,67,68]. It was also found that the controlling processes of some concentrations of trace elements in stream water are mainly pH, as well as leaching and runoff of organic matter from the soil, which varied seasonally with water flow depth in soil [52,69]. Usually, the most mobile fractions of trace metals occur at a lower range of pH and at a lower redox potential of soils [70]. In effect, it is likely that Cr and Zn were mainly supplied from the lower soil depth during winter, while low-pH rainfall and near-surface runoff from topsoil were responsible for the delivery of, Cr, Cu, Ni, and Zn to streams during the monsoon.
3.2.4. DOC Concentrations
DOC is the only variable that loaded on factor 4 in the monsoon season (Table 5). This result suggests that DOC is an independent variable controlling stream chemistry or more likely, so many processes influence the relationship between DOC and other elements that they have no strong loadings on factor 4 [71].
DOC concentrations appear to depend on different processes and pathways within LULC types in the Nongkrem catchment. The highest DOC concentration in springs (S1–S4) might be an effect of the water table rising in the rainy season (Figure 2 and Table 3), resulting from increasing macropore flow as soil moisture increases, giving rise to a hydrologic flushing of DOC from the topsoil to springs [72]. The increase in DOC concentrations in forest catchments due to runoff has been documented in numerous studies from the tropical zone [15,20]. High DOC concentrations in cultivated land reflect soil management practices that stimulate the mobilization of the organic C pool in the soil during monsoonal rainfall [5,20]. Simultaneously elevated values of DOC were observed in densely populated built-up areas with a lack of sanitation infrastructure, similar to the Nongkrem catchment, and in many other tropical and subtropical regions [7,10,23,25].
3.3. Comparison of Selected Chemical Element Concentrations in Headwater Areas of Tropical Zone
The molar ratio of Na:Cl in the study area was approximately 2.0–4.0 for both seasons, results which are higher than the sea water value of 0.86. The low concentration of Cl− indicated limited atmospheric contribution, typical for this part of Northeast India [73]. It is likely that the southern slope of Meghalaya, elevated to 1300–1500 m a.s.l. over the Bengal Plain, acts as a natural barrier for atmospheric inputs from the Bay of Bengal during the south-west monsoon [31] (Figure 1A). Additionally, highly weathered Ultisols in the forest sub-catchments (F1–F2) have a lower ion pool and nutrient reserves (Table 2) compared to Andisols and Luvisols in Kenya [19,74,75], as well as Inceptisols in Brazil [76] (Table 6). The chemical element concentrations in first-order forest sub-catchments (F1–F2) were similar to those measured in tropical forest headwater areas in Ecuador’s Andes [51,77] and semi-evergreen forest in Brazil [76],. Despite the similarity, major ions and DOC concentrations in our forest sub-catchments (F1–F2) were lower than that reported in tropical forest in Kenya and Mexico and ombrophilus forest in Brazil [19,74,75,76]. This difference could be a consequence of less ion input into forest sub-catchments (F1–F2) from rainfall and/or soil.
In contrast, first-order cultivated sub-catchments (C1–C2) exhibited much lower major ion concentrations than cultivated headwater areas in tropical Kenya, Brazil, and Mexico [5,19,75,76], (Table 6). Only SO42− and DOC concentrations in studied first-order streams are similar to those observed in Brazil with sugar cane crop [78]. Apart from low atmospheric deposition and infertile soils in the Nongkrem catchment, this difference seems be a consequence of old deforestation and a long-term cultivation period without the use of fertilizers.
The higher order sub-catchments with mixed land use (M1–M2) also have lower ion concentrations than other tropical areas with naturally low fertility Oxisols [36] (Table 6). The only exceptions were higher values of NO3− and SO42−. They were the effect of a different land use structure, encompassing a large share of built-up area within the sub-catchments (M1–M2). Despite a significant human impact, chemical concentrations in the studied catchments system did not exceed the desirable limits set by the WHO [79].
4. Conclusions
The analyses conducted confirmed the hypothesis that naturally low chemical element concentrations in stream water caused its high sensitivity to contributions of ion-rich water draining long-term anthropogenically-modified landscapes. In the studied area, major ion concentrations generally followed the pattern forest < cultivated land < grassland < built-up area. Forest was not found to play an important role in regulating stream flow and water chemistry due to its small proportion in the catchment. Ion concentrations in the first-order forest catchments are mainly a result of the underlying geochemistry associated with granite bedrock and vegetation. Such an ion pattern may be closely related to natural environmental conditions in the investigated subtropical region. The relatively low impact of cultivation on water chemistry can be related to old deforestation and a long-term cultivation period without the use of chemical fertilizers. Grasslands with the most abundant ion pool in soils were an important source of chemical element supply to stream water, particularly during the monsoon season. Built-up area and population density exhibited the strongest control on stream water chemistry in both seasons.
Surface water chemistry of the subtropical elevated shield within the monsoonal range exhibited mixed features of tropical and temperate zones. Generally, with low concentrations of chemical elements, very small seasonal differences in the headwater area and increased concentrations of NO3−, SO42−, DOC, and Zn in the wet monsoon season are similar to those observed in the tropics. In contrast, the role of long-term cultivation is less than in other headwater areas of the tropical zone. Strong control of water chemistry by densely populated built-up areas is analogous to both tropical and temperate regions. Population density or a built-up area may be used as a proxy for the reconstruction or prediction of the anthropogenic impact on stream water chemistry in similar subtropical elevated shields.
Author Contributions
All authors contributed equally to the paper. Conceptualization, P.P., Ł.W., H.J.S., R.K.; Methodology, P.P., Ł.W., H.J.S., R.K.; Software, P.P., Ł.W., H.J.S., R.K.; Validation, P.P., Ł.W., H.J.S., R.K.; Formal Analysis, P.P., Ł.W., H.J.S., R.K.; Investigation, P.P., Ł.W., H.J.S., R.K.; Resources, P.P., Ł.W., H.J.S., R.K.; Data Curation, P.P., Ł.W., H.J.S., R.K.; Writing-Original Draft Preparation, P.P., Ł.W., H.J.S., R.K.; Writing-Review & Editing, P.P., Ł.W., H.J.S., R.K.; Visualization, P.P., Ł.W., H.J.S., R.K.; Supervision, P.P., Ł.W., H.J.S., R.K.; Project Administration, P.P., Ł.W., H.J.S., R.K.; Funding P.P., Ł.W., H.J.S., R.K.
Funding
This research received no external funding.
Acknowledgments
This paper is the outcome of the cooperation between the Indian National Science Academy and Polish Academy of Sciences. Authors would like to thank Jane E. Warjri, who helped with sample collection.
Conflicts of Interest
The authors declare no conflict of interest.
References
- Corlett, R.T. Where are the Subtropics? Biotropica 2013, 45, 273–275. [Google Scholar] [CrossRef]
- Pongratz, J.; Reick, C.; Raddatz, T.; Claussen, M.A. Reconstruction of global agricultural areas and land cover for the last millennium. Glob. Biogeochem. Cycles 2008, 22. [Google Scholar] [CrossRef]
- Hansen, M.C.; Potapov, P.V.; Moore, R.; Hancher, M.; Turubanova, S.A.; Tyukavina, A.; Thau, D.; Stehman, S.V.; Goetz, S.J.; Loveland, T.R.; Kommareddy, A. High-resolution global maps of 21st-century forest cover change. Science 2013, 342, 850–853. [Google Scholar] [CrossRef]
- McKee, L.J.; Eyre, B.D.; Hossain, S.; Pepperell, P.R. Impacts of climate, geology and humans on spatial and temporal variability in nutrient geochemistry in the subtropical Richmond River catchment. Mar. Fresh Res. 2001, 52, 235–248. [Google Scholar] [CrossRef]
- Da Silva, D.M.L.; Ometto, J.P.H.B.; de Lobo, G.A.; de Lima, W.P.; Scaranello, M.A.; Mazzi, E.; da Rocha, H.R. Can land use changes alter carbon, nitrogen and major ion transport in subtropical Brazilian streams? Sci. Agric. 2007, 64, 317–324. [Google Scholar] [CrossRef]
- Wiejaczka, Ł.; Prokop, P.; Kozłowski, R.; Sarkar, S. Reservoir’s Impact on the Water Chemistry of the Teesta River Mountain Course (Darjeeling Himalaya). Ecol. Chem. Eng. S 2018, 25, 73–88. [Google Scholar] [CrossRef]
- Ometo, J.P.H.B.; Martinelli, L.A.; Ballester, M.V.; Gessner, A.; Krusche, A.V.; Victoria, R.L.; Williams, M. Effects of land use on water chemistry and macroinvertebrates in two streams of the Piracicaba river basin, South-East Brazil. Freshw. Biol. 2000, 44, 327–337. [Google Scholar] [CrossRef]
- Subramanian, V. Water quality in South Asia. Asian J. Water Environ. Pollut. 2004, 1, 41–54. [Google Scholar]
- Girija, T.R.; Mahanta, C.; Chandramouli, V. Water quality assessment of an untreated effluent impacted urban stream: The Bharalu tributary of the Brahmaputra River, India. Environ. Monit. Assess. 2007, 130, 221–236. [Google Scholar] [CrossRef]
- Silva, J.S.O.; da Cunha Bustamante, M.M.; Markewitz, D.; Krusche, A.V.; Ferreira, L.G. Effects of land cover on chemical characteristics of streams in the Cerrado region of Brazil. Biogeochemistry 2011, 105, 75–88. [Google Scholar] [CrossRef]
- Allan, J.D. Landscapes and riverscapes: The influence of land use on stream ecosystems. Annu. Rev. Ecol. Evol. Syst. 2004, 35, 257–284. [Google Scholar] [CrossRef]
- Likens, G.E. Some perspectives on long term biogeochemical research from the Hubbarb Brook ecosystem study. Ecology 2004, 85, 2355–2362. [Google Scholar] [CrossRef]
- Pradhan, U.K.; Wu, Y.; Shirodkar, P.V.; Zhang, J. Seasonal nutrient chemistry in mountainous river systems of tropical Western Peninsular India. Chem. Ecol. 2015, 31, 199–216. [Google Scholar] [CrossRef]
- Bruijnzeel, L.A. Hydrological functions of tropical forests: Not seeing the soil for the trees? Agric. Ecosyst. Environ. 2004, 104, 185–228. [Google Scholar] [CrossRef]
- Goller, R.; Wilcke, W.; Fleischbein, K.; Valarezo, C.; Zech, W. Dissolved nitrogen, phosphorus, and sulfur forms in the ecosystemfluxes of amontane forest in Ecuador. Biogeochemistry 2006, 77, 57–89. [Google Scholar] [CrossRef]
- Saunders, T.J.; McClain, M.E.; Llerena, C.A. The biogeochemistry of dissolved nitrogen, phosphorus, and organic carbon along terrestrial-aquatic flowpaths of a montane headwater catchment in the Peruvian Amazon. Hydrol. Process. 2006, 20, 2549–2562. [Google Scholar] [CrossRef]
- Biggs, T.W.; Dunne, T.; Domingues, T.F.; Martinelli, L.A. The relative influence of natural watershed properties and human disturbance on stream solute concentrations in the Southwestern Brazilian Amazon basin. Water. Resour. Res. 2002, 38. [Google Scholar] [CrossRef]
- Singh, S.; Mishra, A. Spatiotemporal analysis of the effects of forest covers on stream water quality in Western Ghats of peninsular India. J. Hydrol. 2014, 519, 214–224. [Google Scholar] [CrossRef]
- Recha, J.W.; Lehmann, J.; Walter, M.T.; Pell, A.; Verchot, L.; Johnson, M. Stream water nutrient and organic carbon exports from tropical headwater catchments at a soil degradation gradient. Nutr. Cycl. Agroecosyst. 2013, 95, 145–158. [Google Scholar] [CrossRef]
- Jacobs, S.R.; Breuer, L.; Butterbach-Bahl, K.; Pelster, D.E.; Rufino, M.C. Land use affects total dissolved nitrogen and nitrate concentrations in tropical montane streams in Kenya. Sci. Total Environ. 2017, 603, 519–532. [Google Scholar] [CrossRef] [PubMed]
- Biggs, T.W.; Dunne, T.; Muraoka, T. Transport of water, solutes and nutrients from a pasture hillslope, southwestern Brazilian Amazon. Hydrol. Process. 2006, 20, 2527–2547. [Google Scholar] [CrossRef]
- Germer, S.; Neill, C.; Vetter, T.; Chaves, J.; Krusche, A.V.; Elsenbeer, H. Implications of long-term landuse change for the hydrology and solute budgets of small catchments in Amazonia. J. Hydrol. 2009, 364, 349–363. [Google Scholar] [CrossRef]
- Martinelli, L.A.; Krusche, A.V.; Victoria, R.L.; Camargo, P.B.D.; Bernardes, M.; Ferraz, E.S.; Moraes, J.M.D.; Ballester, M.V. Effects of sewage on the chemical composition of Piracicaba River, Brazil. Water Air Soil Pollut. 1999, 110, 67–79. [Google Scholar] [CrossRef]
- Daniel, M.H.; Montebelo, A.A.; Bernardes, M.C.; Ometto, J.P.; De Camargo, P.B.; Krusche, A.V.; Ballester, M.V.; Victoria, R.L.; Martinelli, L.A. Effects of urban sewage on dissolved oxygen, dissolved inorganic and organic carbon, and electrical conductivity of small streams along a gradient of urbanization in the Piracicaba river basin. Water Air Soil Pollut. 2002, 136, 189–206. [Google Scholar] [CrossRef]
- Bhatt, M.P.; Gardner, K.H. Variation in DOC and trace metal concentration along the heavily urbanized basin in Kathmandu Valley, Nepal. Environ. Geol. 2009, 58, 867–876. [Google Scholar] [CrossRef]
- Ramakrishnan, P.S. Shifting Agriculture and Sustainable Development: An Interdisciplinary Study from North-Eastern India; Parthenon Publications: Carnforth, UK, 1992; pp. 1–424. ISBN 1850703833. [Google Scholar]
- Prokop, P. Land use and land cover changes in the area with the highest rainfall in the world (Meghalaya Plateau, India): Causes and implications. In Environmental Geography of South Asia; Singh, R.B., Prokop, P., Eds.; Springer: Tokyo, Japan, 2016; pp. 143–159. ISBN 978-4-431-55741-8. [Google Scholar]
- Vliet, V.N.; Mertz, O.; Heinimann, A.; Langanke, T.; Pascual, U.; Schmook, B.; Adams, C.; Schmidt-Vogt, D.; Messerli, P.; Leisz, S.; et al. Trends, drivers and impacts of changes in swidden cultivation in tropical forest-agriculture frontiers: A global assessment. Glob. Environ. Chang. 2012, 22, 418–429. [Google Scholar] [CrossRef]
- Bhaskar, B.P.; Saxena, R.K.; Vadivelu, S.; Baruah, U.; Butte, P.S.; Dutta, D.P. Pedogenesis in high altitude soils of Meghalaya plateau. Agropedology 2004, 14, 9–23. [Google Scholar]
- Prokop, P.; Kruczkowska, B.; Syiemlieh, H.J.; Bucała-Hrabia, A. Impact of topography and sedentary swidden cultivation on soils in the hilly uplands of North-East India. Land Degrad. Dev. 2018, 29, 2760–2770. [Google Scholar] [CrossRef]
- Prokop, P.; Walanus, A. Variation in the orographic extreme rain events over the Meghalaya Hills in northeast India in the two halves of the twentieth century. Theor. Appl. Climatol. 2015, 121, 389–399. [Google Scholar] [CrossRef]
- Mazumder, S.K. The Precambrian framework of part of the Khasi Hills, Meghalaya. Rec. Geol. Survey India 1986, 117, 1–59. [Google Scholar]
- Ray, J.; Saha, A.; Ganguly, S.; Balaram, V.; Krishna, A.K.; Hazra, S. Geochemistry and petrogenesis of Neoproterozoic Mylliem granitoids, Meghalaya Plateau, Northeastern India. J. Earth Syst. Sci. 2011, 120, 459–473. [Google Scholar] [CrossRef]
- Hazra, S.; Saha, P.; Ray, J.; Polder, A. Simple statistical and mineralogical studies as petrogenetic indicator for Neoproterozoic Mylliem porphyritic granites of East Khasi Hills, Meghalaya, Northeastern India. J. Geol. Soc. India 2010, 75, 760–768. [Google Scholar] [CrossRef]
- Migoń, P.; Prokop, P. Landforms and landscape evolution in the Mylliem granite area, Meghalaya Plateau, Northeast India. Singap. J. Trop. Geogr. 2013, 34, 206–228. [Google Scholar] [CrossRef]
- Soil Survey Staff. Keys to Soil Taxonomy, 12th ed.; USDA-Natural Resources Conservation Service: Washington, DC, USA, 2014; pp. 1–361. [Google Scholar]
- Prokop, P.; Suliga, I. Two thousand years of iron smelting in the Khasi Hills, Meghalaya, North East India. Curr. Sci. India 2013, 104, 761–768. [Google Scholar]
- Prokop, P.; Bhattacharyya, A. Reconnaissance of quaternary sediments from Khasi Hills, Meghalaya. J. Geol. Soc. India 2011, 78, 258–262. [Google Scholar] [CrossRef]
- Rączkowska, Z.; Bucała-Hrabia, A.; Prokop, P. Geomorphological and sedimentological indicators of land degradation (Meghalaya Plateau, NE India). Land Degrad. Dev. 2018, 29, 2746–2759. [Google Scholar] [CrossRef]
- Directorate of Census Operations, Meghalaya. District Census Handbook, East Khasi Hills. Village and Town Wise Primary Census Abstract (PCA); Part XII-B, Series 18; Directorate of Census Operations: Shillong, India, 2011; pp. 1–240. [Google Scholar]
- Christophersen, N.; Hooper, R.P. Multivariate analysis of stream water chemical data: The use of principal component analysis for the end-member mixing problem. Water. Resour. Res. 1992, 28, 99–107. [Google Scholar] [CrossRef]
- Wayland, K.G.; Long, D.T.; Hyndman, D.W.; Pijanowski, B.C.; Woodhams, S.M.; Haack, S.K. Identifying relationships between baseflow geochemistry and land use with synoptic sampling and R-mode factor analysis. J. Environ. Qual. 2003, 31, 180–190. [Google Scholar] [CrossRef]
- Reimann, C.; Filzmoser, P.; Garrett, R.G. Factor analysis applied to regional geochemical data: Problems and possibilities. Appl. Geochem. 2002, 17, 185–206. [Google Scholar] [CrossRef]
- Fitzpatrick, M.L.; Long, D.T.; Pijanowski, B.C. Exploring the effects of urban and agricultural land use on surface water chemistry, across a regional watershed, using multivariate statistics. Appl. Geochem. 2007, 22, 1825–1840. [Google Scholar] [CrossRef]
- Connor, N.P.; Sarraino, S.; Frantz, D.E.; Bushaw-Newton, K.; MacAvoy, S.E. Geochemical characteristics of an urban river: Influences of an anthropogenic landscape. Appl. Geochem. 2014, 47, 209–216. [Google Scholar] [CrossRef]
- Olivia, P.; Viers, J.; Dupré, B. Chemical weathering in granitic environments. Chem. Geol. 2003, 202, 225–256. [Google Scholar] [CrossRef]
- Harmon, R.S.; Lyons, W.B.; Long, D.T.; Ogden, F.L.; Mitasova, H.; Gardner, C.B.; Welch, K.A.; Witherow, R.A. Geochemistry of four tropical montane watersheds, Central Panama. Appl. Geochem. 2009, 24, 624–640. [Google Scholar] [CrossRef]
- Hem, J.D. Study and Interpretation of the Chemical Characteristics of Natural Water; Department of the Interior, US Geological Survey: Alexandria, VA, USA, 1985; pp. 1–263. [Google Scholar]
- Davies, P.J.; Wright, I.A.; Jonasson, O.J.; Findlay, S.J. Impact of concrete and PVC pipes on urban water chemistry. Urban Water J. 2010, 7, 233–241. [Google Scholar] [CrossRef]
- Markewitz, D.; Davidson, E.A.; Figueiredo, R.D.O.; Victoria, R.L.; Krusche, A.V. Control of cation concentrations in stream waters by surface soil processes in an Amazonian watershed. Nature 2001, 410, 802–805. [Google Scholar] [CrossRef]
- Bücker, A.; Crespo, P.; Frede, H.G.; Vaché, K.; Cisneros, F.; Breuer, L. Identifying controls on water chemistry of tropical cloud forest catchments: Combining descriptive approaches and multivariate analysis. Aquat. Geochem. 2010, 16, 127–149. [Google Scholar] [CrossRef]
- Boy, J.; Valarezo, C.; Wilcke, W. Water flow paths in soil control element exports in an Andean tropical montane forest. Eur. J. Soil. Sci. 2008, 59, 1209–1227. [Google Scholar] [CrossRef]
- Sung, K.Y.; Yun, S.T.; Park, M.E.; Koh, Y.K.; Choi, B.Y.; Hutcheon, I.; Kim, K.H. Reaction path modeling of hydrogeochemical evolution of groundwater in granitic bedrocks, South Korea. J. Geochem. Explor. 2012, 118, 90–97. [Google Scholar] [CrossRef]
- Meyer, J.; Paul, M.; Taulbee, W. Stream ecosystem function in urbanizing landscapes. J. N. Am. Benthol. Soc. 2005, 24, 602–612. [Google Scholar] [CrossRef]
- Halstead, J.A.; Kliman, S.; Berheide, C.W.; Chaucer, A.; Cock-Esteb, A. Urban stream syndrome in a small, lightly developed watershed: A statistical analysis of water chemistry parameters, land use patterns, and natural sources. Environ. Monit. Assess. 2014, 186, 3391–3414. [Google Scholar] [CrossRef]
- Wright, I.A.; Davies, P.J.; Findlay, S.J.; Jonasson, O.J. A new type of water pollution: Concrete drainage infrastructure and geochemical contamination of urban waters. Mar. Freshwater Res. 2011, 62, 1355–1361. [Google Scholar] [CrossRef]
- Christian, L.N.; Banner, J.L.; Mack, L.E. Sr isotopes as tracers of anthropogenic influences on stream water in the Austin, Texas, area. Chem. Geol. 2011, 282, 84–97. [Google Scholar] [CrossRef]
- Morgan, R.P.; Kline, K.M. Nutrient concentrations in Maryland non-tidal streams. Environ. Monit. Assess. 2011, 178, 221–235. [Google Scholar] [CrossRef]
- Singh, A.K.; Mondal, G.C.; Kumar, S.; Singh, T.B.; Tewary, B.K.; Sinha, A. Major ion chemistry, weathering processes and water quality assessment in upper catchment of Damodar River basin, India. Environ. Geol. 2008, 54, 745–758. [Google Scholar] [CrossRef]
- Zhu, B.; Yang, X.; Rioual, P.; Qin, X.; Liu, Z.; Xiong, H.; Yu, J. Hydrogeochemistry of three watersheds (the Erlqis, Zhungarer and Yili) in northern Xinjiang, NW China. Appl. Geochem. 2011, 26, 1535–1548. [Google Scholar] [CrossRef]
- Salomons, W. Environmental impact of metals derived from mining activities: Processes, predictions, prevention. J. Geochem. Explor. 1995, 52, 5–23. [Google Scholar] [CrossRef]
- Singh, J.; Ramakrishnan, P.S. Structure and function of a sub-tropical humid forest of Meghalaya I. Vegetation, biomass and its nutrients. Proc. Indian Acad. Sci. Plant Sci. 1982, 91, 241–253. [Google Scholar]
- Prokop, P.; Poręba, G.J. Soil erosion associated with an upland farming system under population pressure in Northeast India. Land Degrad. Dev. 2012, 23, 310–321. [Google Scholar] [CrossRef]
- Collins, R.; Jenkins, A. The impact of agricultural land on stream chemistry in the Middle Hills of the Himalayas, Nepal. J. Hydrol. 1996, 185, 71–86. [Google Scholar] [CrossRef]
- Ahmad, M.; Rajapaksha, A.U.; Lim, J.E.; Zhang, M.; Bolan, N.; Mohan, D.; Vithanage, M.; Lee, S.S.; Ok, Y.S. Biochar as a sorbent for contaminant management in soil and water: A review. Chemosphere 2014, 99, 19–33. [Google Scholar] [CrossRef]
- Viers, J.; Dupré, B.; Braun, J.J.; Deberdt, S.; Angeletti, B.; Ndam Ngoupayou, J.; Michard, A. Major and trace element abundances, and strontium isotopes in the Nyong basin rivers (Cameroon): Constraints on chemical weathering processes and elements transport mechanisms in humid tropical environments. Chem. Geol. 2000, 169, 211–214. [Google Scholar] [CrossRef]
- Patino, L.C.; Velbel, M.A.; Price, J.R.; Wade, J.A. Trace element mobility during spheroidal weathering of basalts and andesites in Hawaii and Guatemala. Chem. Geol. 2003, 202, 343–364. [Google Scholar] [CrossRef]
- Nakajima, T.; Terakado, Y. Rare earth elements in stream waters from the Rokko granite area, Japan: Effect of weathering degree of watershed rocks. Geochem. J. 2003, 37, 181–198. [Google Scholar] [CrossRef]
- Lorieri, D.; Elsenbeer, H. Aluminium, iron and manganese in near-surface waters of a tropical rainforest ecosystem. Sci. Total Environ. 1997, 205, 13–23. [Google Scholar] [CrossRef]
- Kabata-Pendias, A. Trace Elements in Soils and Plants; CRC Press: Boca Raton, FL, USA, 2010; pp. 1–403. ISBN 0-8493-1575-1. [Google Scholar]
- Van Gaelen, N.; Verheyen, D.; Ronchi, B.; Struyf, E.; Govers, G.; Vanderborght, J.; Diels, J. Identifying the transport pathways of dissolved organic carbon in contrasting catchments. Vadose Zone J. 2014, 13, 1–14. [Google Scholar] [CrossRef]
- Johnson, M.S.; Lehmann, J.; Selva, E.C.; Abdo, M.; Riha, S.; Couto, E.G. Organic carbon fluxes within and streamwater exports from headwater catchments in the Southern Amazon. Hydrol. Process. 2006, 20, 2599–2614. [Google Scholar] [CrossRef]
- Bhaskar, V.V.; Rao, P.S.P. Annual and decadal variation in chemical composition of rain water at all the ten GAW stations in India. J. Atmos. Chem. 2017, 74, 23–53. [Google Scholar] [CrossRef]
- Masese, F.O.; Kitaka, N.; Kipkemboi, J.; Gettel, G.M.; Irvine, K.; McClain, M.E. Litter processing and shredder distribution as indicators of riparian and catchment influences on ecological health of tropical streams. Ecol. Indic. 2014, 46, 23–37. [Google Scholar] [CrossRef]
- Masese, F.O.; Salcedo-Borda, J.S.; Gettel, G.M.; Irvine, K.; McClain, M.E. Influence of catchment land use and seasonality on dissolved organic matter composition and ecosystem metabolism in headwater streams of a Kenyan river. Biogeochemistry 2017, 132, 1–22. [Google Scholar] [CrossRef]
- Silva, D.M.; Camargo, P.B.; Mcdowell, W.H.; Vieira, I.; Salomão, M.S.; Martinelli, L.A. Influence of land use changes on water chemistry in streams in the State of São Paulo, southeast Brazil. An. Acad. Bras. Ciênc. 2012, 84, 919–930. [Google Scholar] [CrossRef]
- Wilcke, W.; Yasin, S.; Valarezo, C.; Zech, W. Change in water quality during the passage through a tropical montane rain forest in Ecuador. Biogeochemistry 2001, 55, 45–72. [Google Scholar] [CrossRef]
- Martínez, M.L.; Pérez-Maqueo, O.; Vázquez, G.; Castillo-Campos, G.; García-Franco, J.; Mehltreter, K.; Equihua, M.; Landgrave, R. Effects of land use change on biodiversity and ecosystem services in tropical montane cloud forests of Mexico. For. Ecol. Manag. 2009, 258, 1856–1863. [Google Scholar] [CrossRef]
- WHO. Guidelines for Drinking Water Quality; WHO: Geneva, Switzerland, 2011; pp. 1–541. ISBN 92-4-154638-7. [Google Scholar]
Figure 1.
Location of the study area in the Meghalaya Plateau (A), geology and sampled sites (B), and land use (C) in the Nongkrem and Umiew nested catchments system.
Figure 1.
Location of the study area in the Meghalaya Plateau (A), geology and sampled sites (B), and land use (C) in the Nongkrem and Umiew nested catchments system.

Figure 2.
Comparison of surface water physico-chemical properties during winter and monsoon seasons for the Nongkrem and Umiew nested catchments system. Sites and sub-catchments as in Table 1. T—temperature, EC—electrical conductivity, TDS—total dissolved solids, and DOC—dissolved organic carbon. The line within the box represents the median and the inter quartile range, while whiskers show the minimum and maximum values. Variables with the different letters (a, b, c) are significantly different among sites within each season with p < 0.05 (based on the Kruskal-Wallis test).

Figure 3.
Comparison of Mg versus Ca concentrations for the Umiew and Nongkrem nested catchments system.
Figure 3.
Comparison of Mg versus Ca concentrations for the Umiew and Nongkrem nested catchments system.

Figure 4.
Ratio of Na/(Na + Ca) during winter and monsoon seasons for the Nongkrem and Umiew nested catchments system.
Figure 4.
Ratio of Na/(Na + Ca) during winter and monsoon seasons for the Nongkrem and Umiew nested catchments system.

Figure 5.
Comparison of trace metals concentration in surface water during winter and monsoon seasons for the Nongkrem and Umiew nested catchments system. The line within the box represents the median the inter quartile range, while whiskers show the minimum and maximum values. Variables with the different letters (a, b, c) are significantly different among sites within each season with p < 0.05 (based on Kruskal-Wallis test).

Figure 6.
Piper diagram with the water facies for the Nongkrem and Umiew nested catchments system during winter and monsoon seasons.
Figure 6.
Piper diagram with the water facies for the Nongkrem and Umiew nested catchments system during winter and monsoon seasons.


Table 1.
General information on the sampling sites in the Nongkrem and Umiew nested catchments system, Meghalaya Plateau, Northeast India. Nongkrem catchment: S1–S4—springs, F1–F2—forest sub-catchments, C1–C2—cultivated sub-catchments, and M1–M2 and M3–M5—mixed LULC sub-catchments; Umiew catchment: M6–M8—mixed LULC sub-catchments.
| Site/Sub-Catchment | Average Elevation | Area | Discharge Winter-Monsoon | Stream Order | Population Density | Forest | Grassland | Cultivated Land | Built Up | Geology Granite | Geology Quartzite | Soil Type |
|---|---|---|---|---|---|---|---|---|---|---|---|---|
| m a.s.l. | km2 | L s−1 | inhabitants km−2 | % | % | % | % | % | % | |||
| S1–S4 | 1808 | - | 0.2–0.8 | - | - | - | - | - | - | - | - | - |
| F1 | 1800 | 0.20 | 10–20 | 1 | 0 | 90 | 0 | 5 | 0 | 100 | 0 | Ultisol |
| F2 | 1805 | 0.17 | 10–20 | 1 | 0 | 100 | 0 | 0 | 0 | 100 | 0 | Ultisol |
| C1 | 1793 | 0.17 | 10–20 | 1 | 0 | 6 | 6 | 88 | 0 | 100 | 0 | Ultisol |
| C2 | 1778 | 0.14 | 7–15 | 1 | 0 | 0 | 14 | 86 | 0 | 100 | 0 | Ultisol |
| M1 | 1792 | 0.98 | 30–60 | 3 | 651 | 3 | 20 | 70 | 7 | 100 | 0 | Ultisol |
| M2 | 1802 | 1.69 | 40–80 | 3 | 1420 | 34 | 23 | 28 | 15 | 100 | 0 | Ultisol |
| M3 | 1802 | 2.65 | 70–140 | 4 | 1146 | 22 | 22 | 44 | 12 | 100 | 0 | Ultisol |
| M4 | 1795 | 3.34 | 100–200 | 4 | 910 | 12 | 40 | 40 | 8 | 100 | 0 | Ultisol |
| M5 | 1795 | 4.00 | 120–300 | 4 | 760 | 18 | 25 | 47 | 10 | 100 | 0 | Ultisol |
| M6 | 1850 | 10.78 | 490–1200 | 5 | 1031 | 11 | 27 | 47 | 15 | 20 | 80 | Ultisol-Inceptisol |
| M7 | 1830 | 28.96 | 1100–2000 | 5 | 800 | 12 | 25 | 53 | 10 | 52 | 48 | Ultisol-Inceptisol |
| M8 | 1805 | 59.30 | 2950–5300 | 5 | 570 | 16 | 18 | 60 | 6 | 60 | 40 | Ultisol-Inceptisol |
| Variable | Forest | Grassland | Cultivated Land |
|---|---|---|---|
| pH | 4.7 | 4.8 | 4.8 |
| Total C (mg kg−1) | 2608 | 2920 | 2105 |
| Total N (mg kg−1) | 213 | 240 | 195 |
| Total S (mg kg−1) | 100 | 80 | 100 |
| Total P (mg kg−1) | 728 | 580 | 771 |
| Total K (mg kg−1) | 4832 | 7094 | 5864 |
| Exchangeable Al (mg kg−1) | 170 | 182 | 163 |
| Exchangeable K (mg kg−1) | 323 | 374 | 367 |
| Exchangeable Na (mg kg−1) | 112 | 113 | 110 |
| Exchangeable Ca (mg kg−1) | 74 | 130 | 124 |
| Exchangeable Mg (mg kg−1) | 21 | 28 | 27 |
| Cation exchange capacity (cmolc kg−1) | 7.7 | 8.0 | 7.9 |
| Base saturation (%) | 25 | 30 | 29 |
Table 3.
Mean values of the physico-chemical variables during winter and monsoon seasons within the Nongkrem and Umiew nested catchments system. Variables significantly different between winter and monsoon seasons with p < 0.05 are in given bold (based on the Mann–Whitney test). T—temperature, EC—electrical conductivity, TDS—total dissolved solids, and DOC—dissolved organic carbon.
| Site/Sub-Catchment | S1–S4 | F1–F2 | C1–C2 | M1–M2 | M3–M5 | M6–M8 | ||||||
|---|---|---|---|---|---|---|---|---|---|---|---|---|
| Season | Winter | Monsoon | Winter | Monsoon | Winter | Monsoon | Winter | Monsoon | Winter | Monsoon | Winter | Monsoon |
| T (°C) | 13.8 | 18.7 | 10.6 | 17.4 | 13.7 | 19.6 | 14.0 | 20.0 | 14.6 | 20.3 | 15.4 | 20.6 |
| pH | 7.1 | 6.3 | 7.3 | 6.3 | 6.8 | 6.3 | 7.2 | 6.6 | 7.2 | 6.4 | 7.4 | 6.5 |
| EC (μS cm−1) | 10.5 | 10.7 | 13.3 | 12.2 | 24.9 | 22.1 | 53.4 | 36.1 | 49.6 | 33.9 | 34.6 | 31.1 |
| TDS (mg L−1) | 10.38 | 7.33 | 11.48 | 8.26 | 17.68 | 14.92 | 40.61 | 23.75 | 39.43 | 22.76 | 27.21 | 21.34 |
| Ca2+ (mg L−1) | 0.90 | 0.64 | 1.04 | 0.73 | 1.57 | 1.80 | 4.74 | 3.07 | 4.60 | 3.04 | 2.75 | 2.84 |
| K+ (mg L−1) | 0.27 | 0.14 | 0.24 | 0.25 | 0.55 | 0.29 | 1.38 | 0.77 | 1.46 | 0.67 | 1.05 | 0.63 |
| Mg2+ (mg L−1) | 0.17 | 0.16 | 0.19 | 0.20 | 0.33 | 0.40 | 0.67 | 0.52 | 0.64 | 0.49 | 0.62 | 0.53 |
| Na+ (mg L−1) | 1.65 | 1.14 | 1.66 | 1.18 | 2.69 | 1.52 | 4.40 | 2.25 | 4.51 | 2.07 | 3.31 | 1.88 |
| Cl− (mg L−1) | 1.05 | 0.62 | 0.62 | 0.65 | 2.05 | 0.92 | 3.35 | 2.11 | 3.43 | 1.80 | 2.47 | 1.74 |
| HCO3− (mg L−1) | 5.32 | 3.85 | 6.92 | 4.17 | 8.97 | 5.80 | 22.91 | 6.68 | 21.69 | 6.93 | 13.86 | 5.73 |
| NO3− (mg L−1) | 0.22 | 0.17 | 0.21 | 0.38 | 0.41 | 3.00 | 1.71 | 6.51 | 1.29 | 6.00 | 1.94 | 6.23 |
| SO42− (mg L−1) | 0.69 | 0.41 | 0.54 | 0.47 | 0.70 | 0.92 | 1.08 | 1.58 | 1.34 | 1.53 | 0.76 | 1.50 |
| DOC (mg L−1) | 0.01 | 2.43 | 0.00 | 2.10 | 0.16 | 2.60 | 0.34 | 2.20 | 0.39 | 1.86 | 0.37 | 2.13 |
| Al (μg L−1) | 2.41 | 3.79 | 2.31 | 3.33 | 1.18 | 4.17 | 2.26 | 1.02 | 2.19 | 0.69 | 2.52 | 0.99 |
| Cr (μg L−1) | 0.25 | 0.13 | 0.25 | 0.18 | 0.26 | 0.16 | 0.58 | 0.19 | 0.74 | 0.18 | 0.33 | 0.07 |
| Cu (μg L−1) | 0.14 | 0.39 | 0.11 | 0.49 | 0.21 | 0.22 | 0.22 | 0.42 | 0.25 | 0.21 | 0.70 | 0.33 |
| Fe (μg L−1) | 39.40 | 26.28 | 39.61 | 31.66 | 107.25 | 84.61 | 219.64 | 92.39 | 187.60 | 89.66 | 78.66 | 70.82 |
| Ni (μg L−1) | 0.16 | 0.13 | 0.18 | 0.34 | 0.30 | 0.27 | 0.80 | 0.48 | 0.78 | 0.28 | 0.69 | 0.54 |
| Sr (μg L−1) | 1.40 | 1.18 | 2.34 | 1.53 | 2.26 | 2.91 | 6.63 | 4.26 | 6.31 | 4.26 | 3.27 | 3.53 |
| Zn (μg L−1) | 1.05 | 19.40 | 0.71 | 14.87 | 0.07 | 22.91 | 1.03 | 23.91 | 0.85 | 21.18 | 1.28 | 21.18 |
Table 4.
Varimax rotated factor loading matrix from PCA for winter in the Nongkrem catchment (sub-catchments: F1, F2, C1, C2, M1, M2, M3, M4, M5). Strong correlations (≥0.75) are indicated by bold type, and moderate loadings (≥0.50 and <0.75) are shown in normal type.
Table 4.
Varimax rotated factor loading matrix from PCA for winter in the Nongkrem catchment (sub-catchments: F1, F2, C1, C2, M1, M2, M3, M4, M5). Strong correlations (≥0.75) are indicated by bold type, and moderate loadings (≥0.50 and <0.75) are shown in normal type.
| Variable | Factor 1 | Factor 2 | Factor 3 | Factor 4 | Factor 5 |
|---|---|---|---|---|---|
| Population density | 0.912 | ||||
| Forest | −0.932 | ||||
| Grassland | 0.559 | ||||
| Cultivated land | 0.921 | ||||
| Built up | 0.911 | ||||
| T | 0.531 | 0.606 | |||
| pH | 0.637 | ||||
| EC | 0.870 | ||||
| TDS | 0.804 | ||||
| Ca2+ | 0.918 | ||||
| K+ | 0.790 | 0.508 | |||
| Mg2+ | 0.828 | ||||
| Na+ | 0.830 | ||||
| Cl− | 0.809 | ||||
| HCO3− | 0.809 | ||||
| NO3− | 0.923 | ||||
| SO42− | 0.756 | ||||
| DOC | 0.546 | ||||
| Al | 0.938 | ||||
| Cr | 0.700 | ||||
| Cu | 0.911 | ||||
| Fe | |||||
| Ni | 0.653 | 0.706 | |||
| Sr | 0.901 | ||||
| Zn | 0.833 | ||||
| Cumulative variance (%) | 42.0 | 55.2 | 74.5 | 81.0 | 91.6 |
Table 5.
Varimax rotated factor loading matrix from PCA for the monsoon in the Nongkrem catchment (sub-catchments: F1, F2, C1, C2, M1, M2, M3, M4, M5). Strong correlations (≥0.75) are indicated by bold type, and moderate loadings (≥0.50 and <0.75) are shown in normal type.
Table 5.
Varimax rotated factor loading matrix from PCA for the monsoon in the Nongkrem catchment (sub-catchments: F1, F2, C1, C2, M1, M2, M3, M4, M5). Strong correlations (≥0.75) are indicated by bold type, and moderate loadings (≥0.50 and <0.75) are shown in normal type.
| Variable | Factor 1 | Factor 2 | Factor 3 | Factor 4 |
|---|---|---|---|---|
| Population density | 0.964 | |||
| Forest | −0.885 | |||
| Grassland | 0.829 | |||
| Cultivated land | 0.989 | |||
| Built up | 0.961 | |||
| T | 0.710 | 0.520 | ||
| pH | 0.651 | |||
| EC | 0.881 | |||
| TDS | 0.880 | |||
| Ca2+ | 0.884 | |||
| K+ | 0.885 | |||
| Mg2+ | 0.816 | 0.560 | ||
| Na+ | 0.850 | |||
| Cl− | 0.911 | |||
| HCO3− | 0.610 | 0.629 | ||
| NO3− | 0.920 | |||
| SO42− | 0.840 | |||
| DOC | −0.893 | |||
| Al | −0.923 | |||
| Cr | 0.871 | |||
| Cu | 0.839 | |||
| Fe | 0.655 | 0.696 | ||
| Ni | 0.952 | |||
| Sr | 0.878 | |||
| Zn | 0.625 | |||
| Cumulative variance (%) | 53.2 | 64.8 | 85.7 | 92.7 |
Table 6.
Selected chemical element concentrations in tropical headwater catchments with natural forest, cultivation, and mixed land use. Values represent mean (±SD) concentrations or the range for particular land use. a—concentrations during dry season, b—concentrations during wet season, and –—no data.
| Location | Altitude (m a.s.l.) | Area (km2) | Soil Type | Land Use | Ca2+ | Cl− | K+ | Mg2+ | Na+ | NO3− | SO42− | DOC | Source |
|---|---|---|---|---|---|---|---|---|---|---|---|---|---|
| Forest | |||||||||||||
| Nongkrem catchment, India | 1800 | 0.17–0.20 | Ultisol | evergreen forest | 1.04 ± 0.39 a 0.73 ± 0.08 b | 0.62 ± 0.49 a 0.65 ± 0.12 b | 0.24 ± 0.10 a 0.25 ± 0.10 b | 0.19 ± 0.08 a 0.20 ± 0.02 b | 1.66 ± 0.74 a 1.18 ± 0.15 b | 0.21 ± 0.11 a 0.38 ± 0.07 b | 0.54 ± 0.16 a 0.47 ± 0.06 b | 0.00 ± 0.00 a 2.10 ± 0.30 b | Current study (F1–F2) |
| Kapchorva catchment, Kenya | 1800 | 0.13 | Ultisol, Luvisol | tropical forest | 7.23 | – | 0.36 | 3.01 | 2.99 | 0.40 | – | 1.31 | [19] |
| Mara catchment, Kenya | 1900–2300 | 2.07–31.98 | Andisol | tropical forest | 2.70 ± 0.05 | 3.8 ± 0.40 a 1.0 ± 0.80 b | 4.30 ± 0.20 | 0.90 ± 0.20 | 6.20 ± 0.50 | 0.30 ± 0.10 | 3.20 ± 0.70 a 0.50 ± 0.40 b | 2.70 ± 0.40 a 3.50 ± 0.60 b | [74,75] |
| La Antigua catchment, Mexico | 480–4200 | <0.15 | – | tropical forest | 4.10 ± 0.60 | 4.30 ± 0.02 | 1.20 ± 0.07 | 1.10 ± 0.10 | 3.60 ± 0.40 | 1.40 ± 0.20 | – | – | [78] |
| Andes, Equador | 1800–2600 | 1.27 | Inceptisol, Histosol | tropical forest | 0.18 ± 0.03 a | 0.64 ± 0.26 a | 0.22 ± 0.03 a | 0.13 ± 0.02 a | 0.71 ± 0.07 a | 0.64 ± 0.13 a | 0.55 ± 0.14 a | – | [51] |
| Andes, Equador | 1900–2200 | 0.08–0.13 | Inceptisol, Histosol | tropical forest | 0.53–1.03 | 0.28–0.40 | 0.30–0.35 | 0.39–0.45 | 2.77–3.99 | 0.05–0.08 | – | – | [77] |
| Ribeira de Iguape catchment, Brazil | – | – | Inceptisol | ombrophilus forest | 2.45 ± 0.48 | 2.87 ± 0.18 | 0.43 ± 0.16 | 1.41 ± 0.24 | 2.25 ± 0.23 | 1.36 ± 0.19 | 0.87 ± 1.25 | – | [76] |
| Pontal do Paranapanema catchment, Brazil | – | – | Oxisol | semi-evergreen forest | 1.36 ± 0.40 | 0.60 ± 0.21 | 1.33 ± 0.43 | 0.41 ± 0.12 | 0.41 ± 0.11 | 0.37 ± 0.06 | 0.38 ± 0.19 | – | [76] |
| Cultivation | |||||||||||||
| Nongkrem catchment, India | 1790 | 0.14–0.17 | Ultisol | potatoes >100 years, no fertilizers | 1.57 ± 0.30 a 1.80 ± 0.09 b | 2.05 ± 1.73 a 0.92 ± 0.11 b | 0.55 ± 0.23 a 0.29 ± 0.04 b | 0.33 ± 0.06 a 0.40 ± 0.01 b | 2.69 ± 1.53 a 1.52 ± 0.17 b | 0.41 ± 0.39 a 3.00 ± 0.10 b | 0.70 ± 0.32 a 0.92 ± 0.36 b | 0.16 ± 0.18 a 2.60 ± 0.62 b | Current study (C1–C2) |
| Kapchorva catchment, Kenya | 1800 | 0.10 | Ultisol, Luvisol | maize 50 years, nitrogen | 7.16 | – | 1.18 | 2.54 | 5.61 | 4.52 | – | 1.52 | [19] |
| Mara catchment, Kenya | 1900–2300 | 2.02–13.98 | Andisol | maize, beans, potatoes ~40 years, fertilizers | 5.20 ± 0.10 | 5.60 ± 1.40 a 3.90 ± 0.60 b | 9.20 ± 0.80 | 1.30 ± 0.10 | 11.80 ± 1.30 | 6.10 ± 2.60 | 3.80 ± 0.60 a 2.70 ± 0.50 b | 3.60 ± 0.90 a 8.10 ± 0.92 b | [74,75] |
| La Antigua catchment, Mexico | 480–4200 | <0.15 | – | coffe plantation >30 years, potassium chloride, calcium phosphate, nitrogen | 12.00 ± 0.06 | 5.50 ± 0.10 | 2.50 ± 0.10 | 5.40 ± 0.40 | 6.70 ± 0.50 | 3.70 ± 0.60 | – | – | [78] |
| Agua Santa catchment, Brazil | 660–730 | 2.87 | Oxisol | sugar cane, nitrogen, liming | 2.91 ± 0.42 | 4.69 ± 0.92 | 2.87 ± 1.66 | 1.85 ± 0.31 | 1.93 ± 0.38 | 2.43 ± 0.72 | 0.44 ± 0.14 | 2.24 ± 1.62 | [5] |
| Mixed | |||||||||||||
| Nongkrem catchment, India | 1800 | 0.98–1.69 | Ultisol | cultivation 44%, grassland 22%, forest 22%, built-up 12% | 4.74 ± 1.50 a 3.07 ± 0.46 b | 3.35 ± 1.28 a 2.11 ± 0.33 b | 1.38 ± 0.45 a 0.77 ± 0.17 b | 0.67 ± 0.13 a 0.52 ± 0.01 b | 4.40 ± 1.44 a 2.25 ± 0.34 b | 1.71 ± 1.22 a 6.51 ± 0.34 b | 0.99 ± 0.74 a 1.58 ± 0.26 b | 0.34 ± 0.02 a 2.20 ± 0.75 b | Current study (M1–M2) |
| Ribeira de Iguape catchment, Brazil | – | – | Oxisol | pasture 75%, forest 18%, cultivation 4%, settlement 3% | 12.34 ± 3.49 | 4.40 ± 1.49 | 2.58 ± 1.60 | 4.50 ± 0.90 | 6.09 ± 1.56 | 1.30 ± 0.25 | 1.06 ± 0.77 | – | [76] |
© 2019 by the authors. Licensee MDPI, Basel, Switzerland. This article is an open access article distributed under the terms and conditions of the Creative Commons Attribution (CC BY) license (http://creativecommons.org/licenses/by/4.0/).
Share and Cite
MDPI and ACS Style
Prokop, P.; Wiejaczka, Ł.; Syiemlieh, H.J.; Kozłowski, R. Response of Water Chemistry to Long-Term Human Activities in the Nested Catchments System of Subtropical Northeast India. Water 2019, 11, 988. https://doi.org/10.3390/w11050988
AMA Style
Prokop P, Wiejaczka Ł, Syiemlieh HJ, Kozłowski R. Response of Water Chemistry to Long-Term Human Activities in the Nested Catchments System of Subtropical Northeast India. Water. 2019; 11(5):988. https://doi.org/10.3390/w11050988
Chicago/Turabian StyleProkop, Paweł, Łukasz Wiejaczka, Hiambok Jones Syiemlieh, and Rafał Kozłowski. 2019. "Response of Water Chemistry to Long-Term Human Activities in the Nested Catchments System of Subtropical Northeast India" Water 11, no. 5: 988. https://doi.org/10.3390/w11050988
Note that from the first issue of 2016, this journal uses article numbers instead of page numbers. See further details here.