Stable Isotope Composition in Surface Water in the Upper Yellow River in Northwest China

 , , , and
Abstract
:1. Introduction
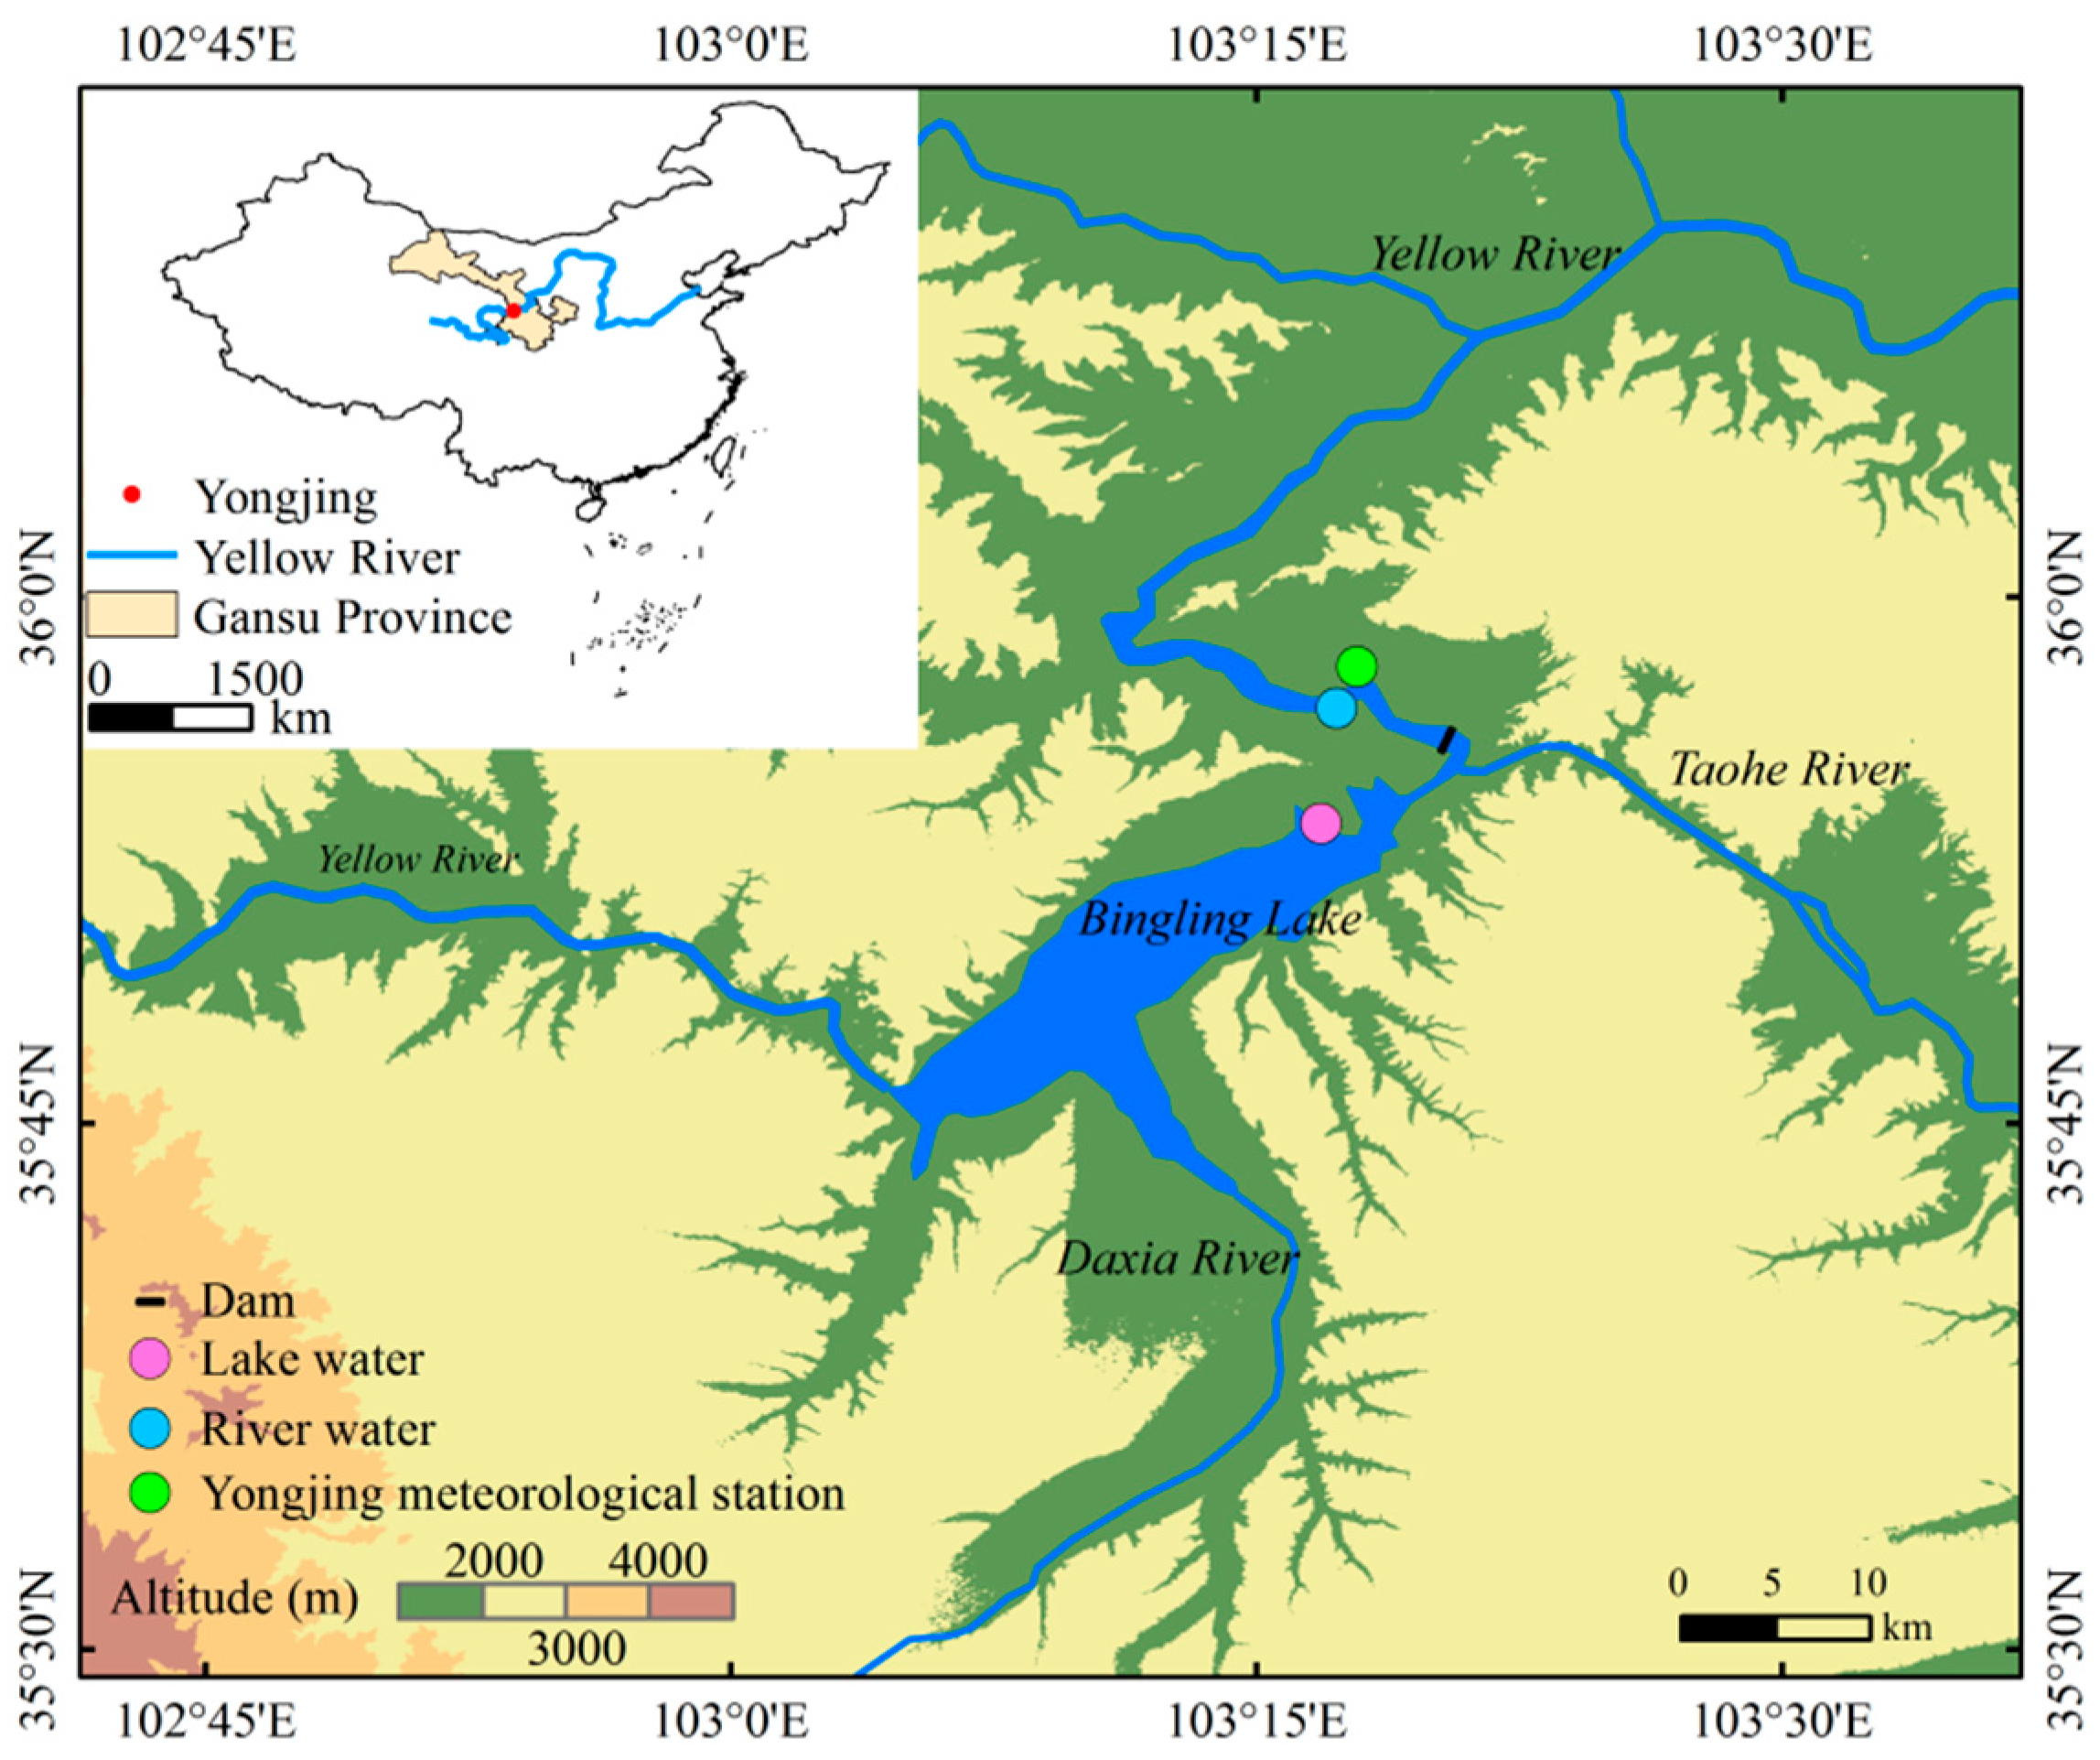
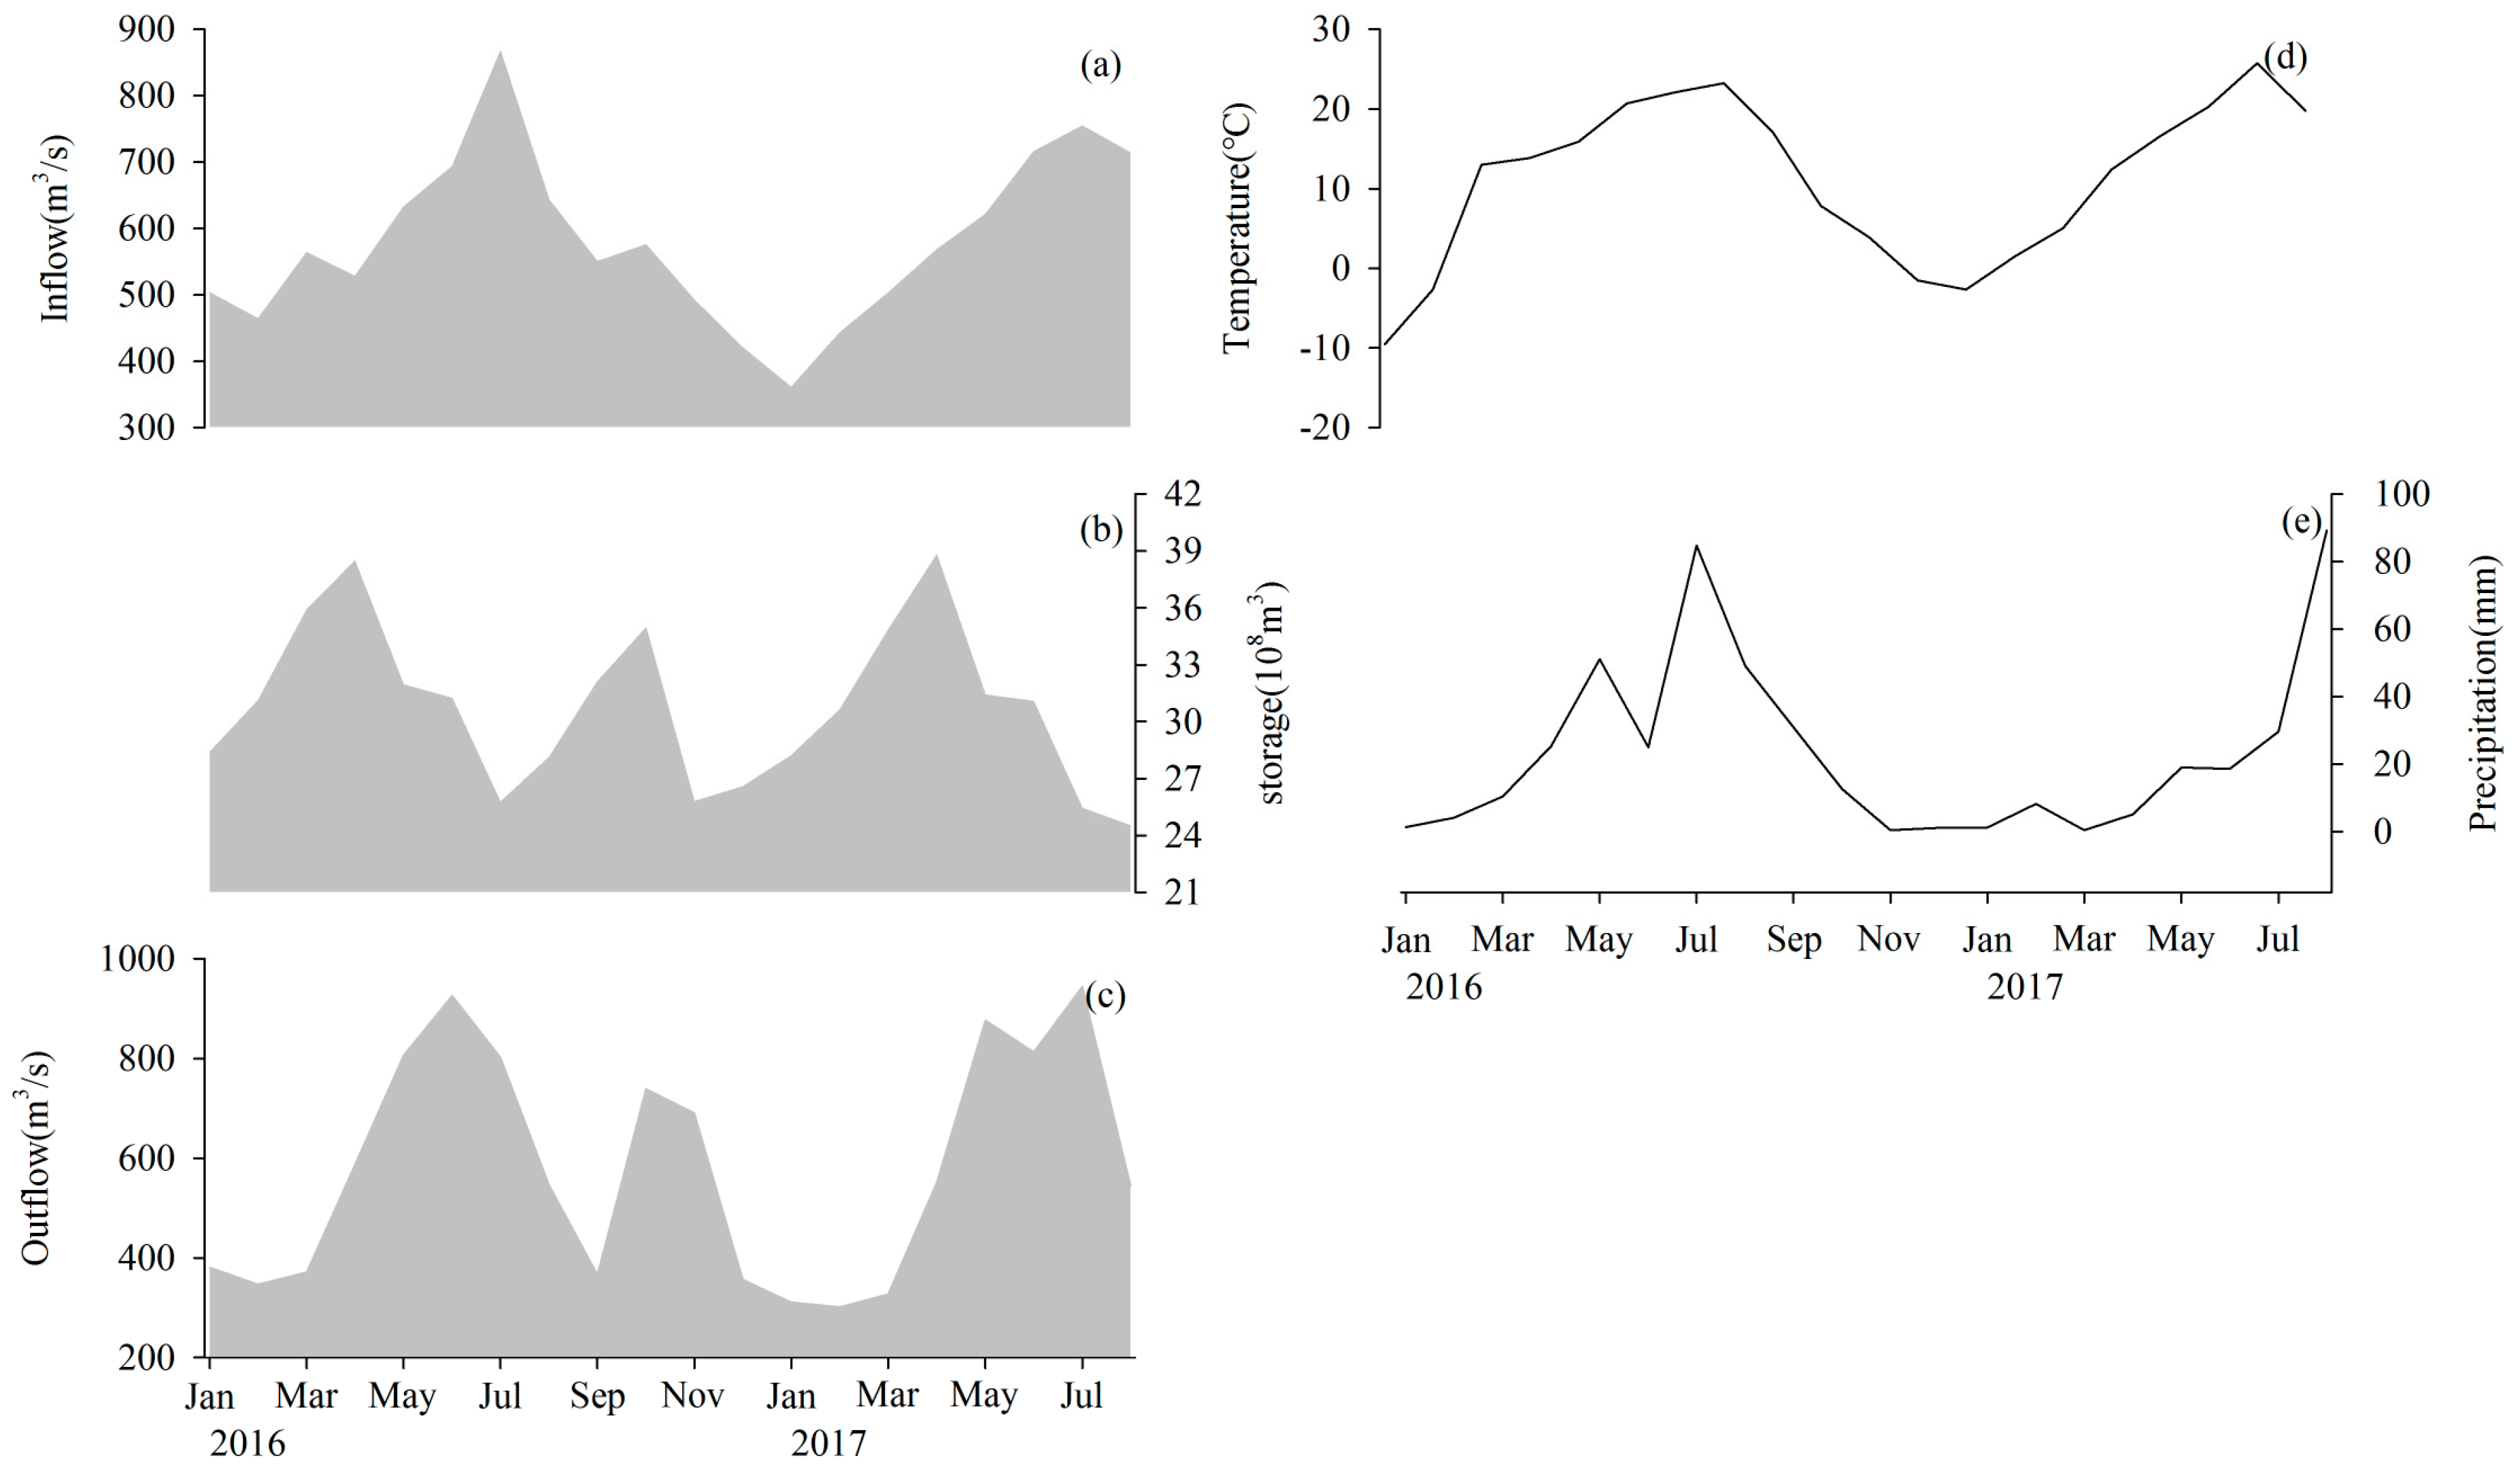
2. Data and Methods
3. Results and Discussion
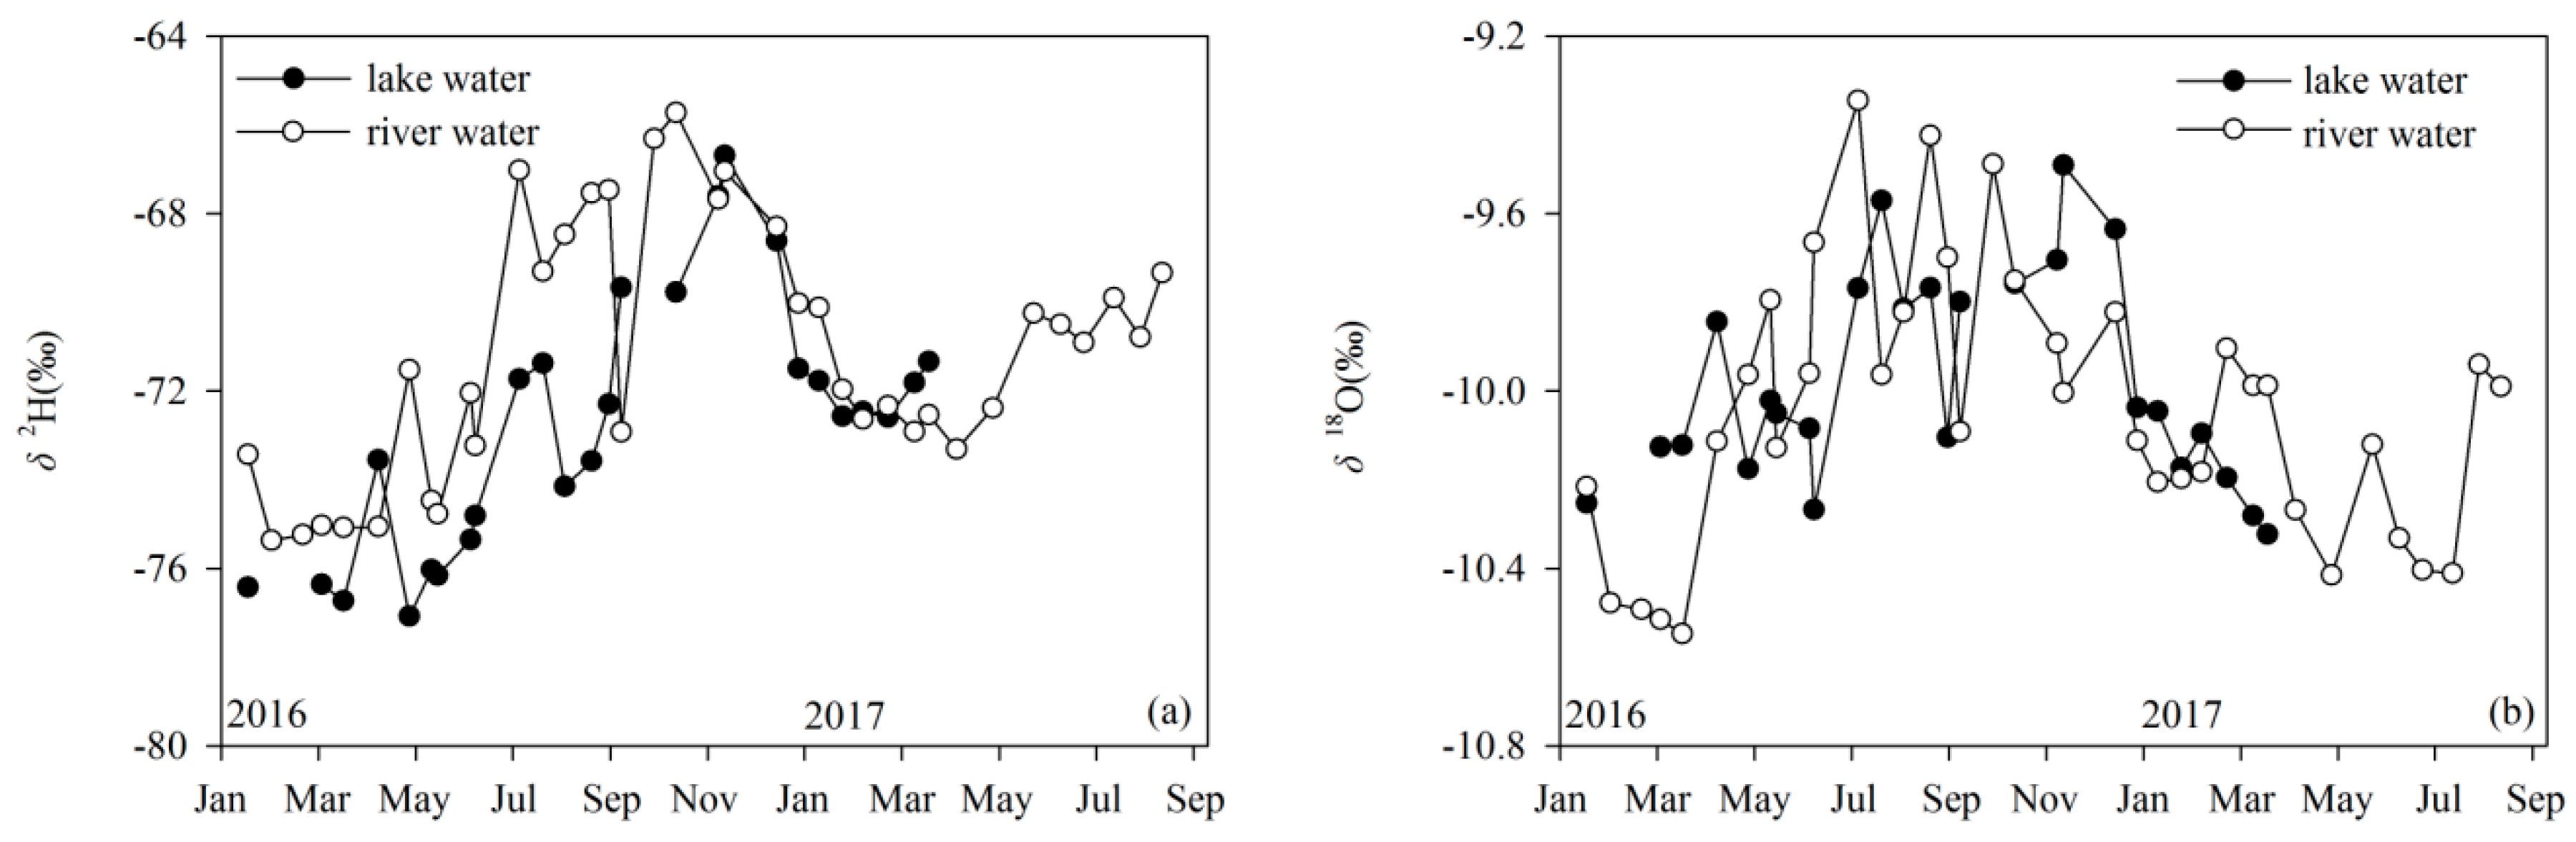
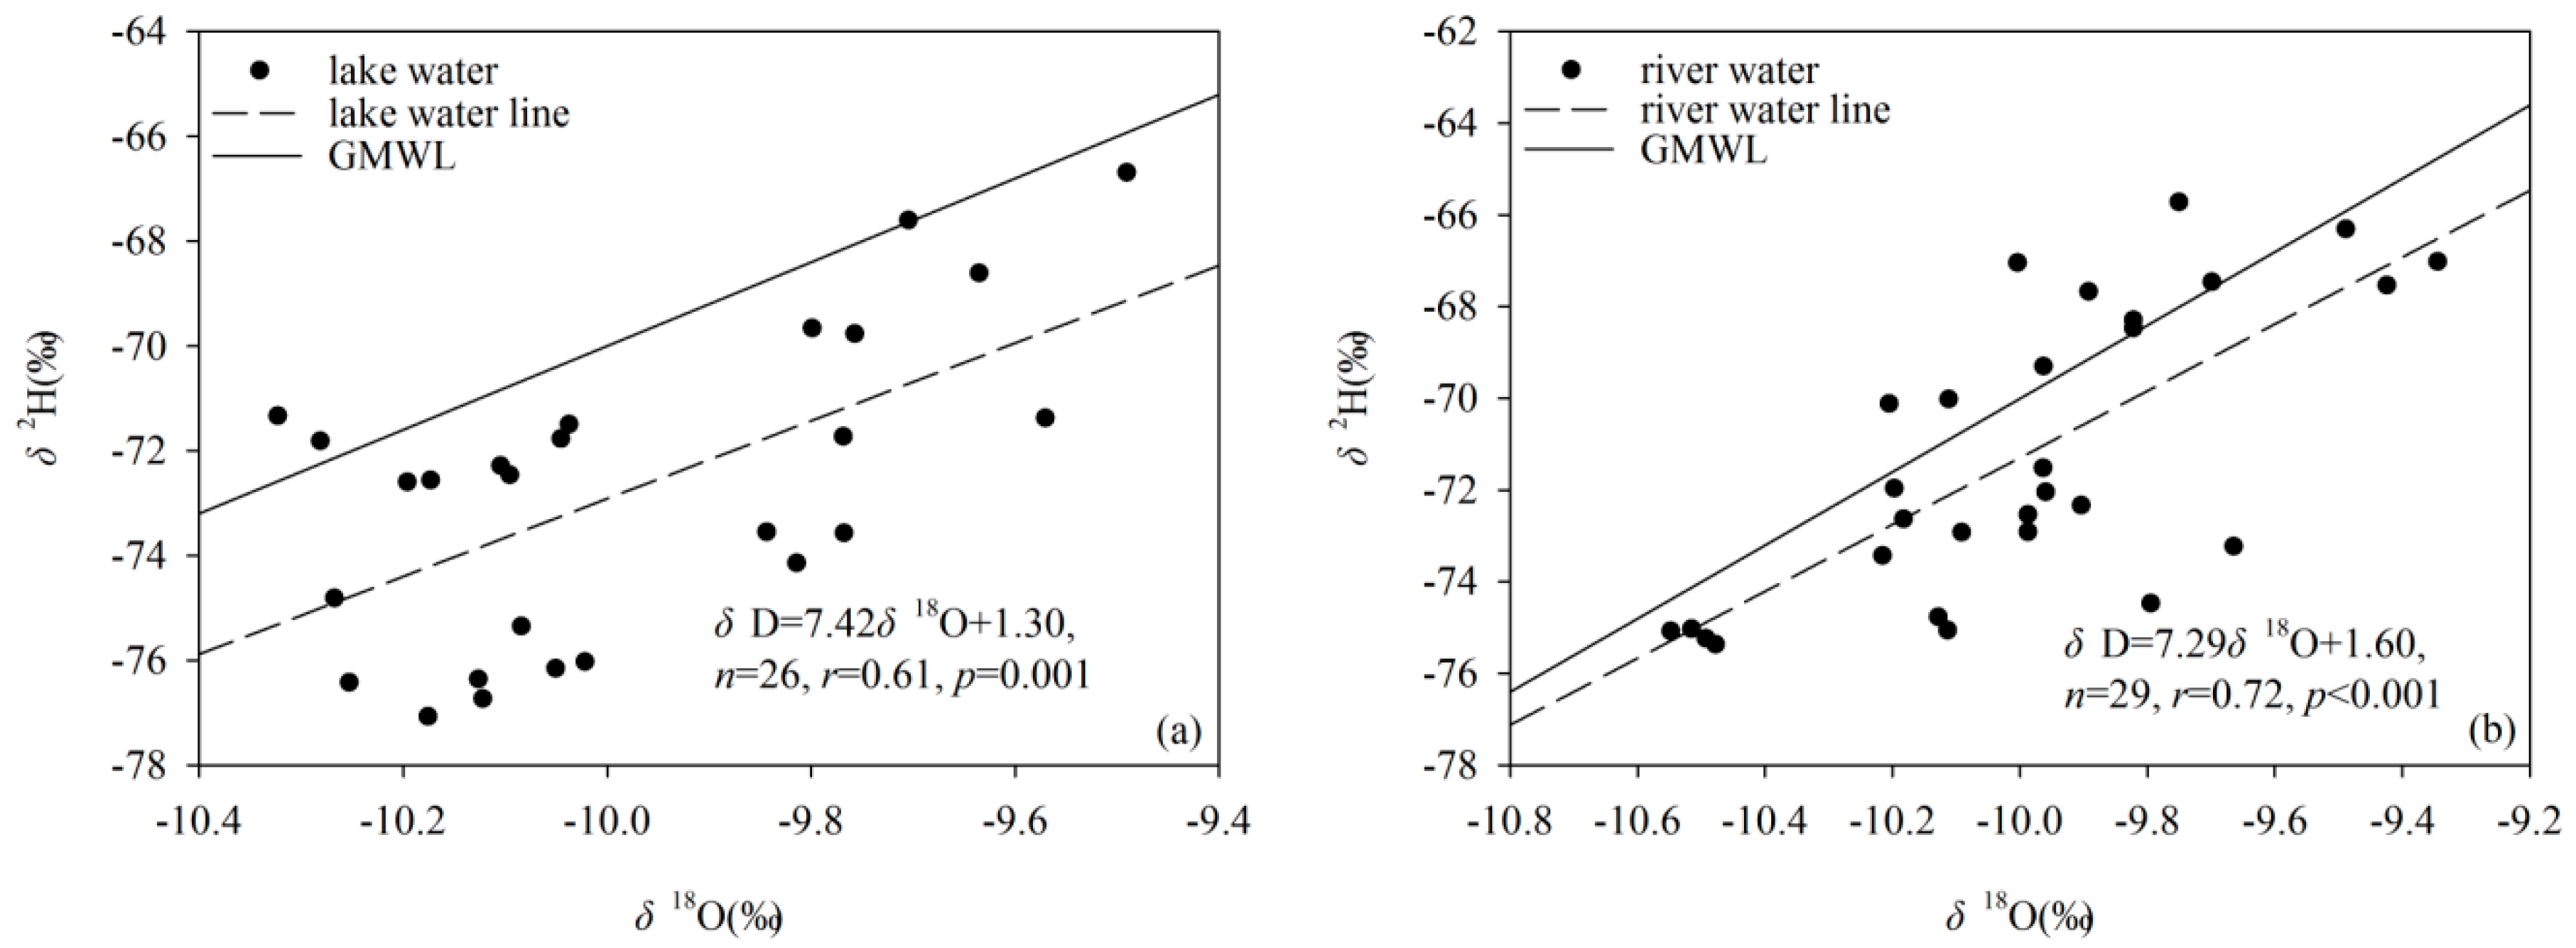
3.1. Stable Isotopes in Surface Water
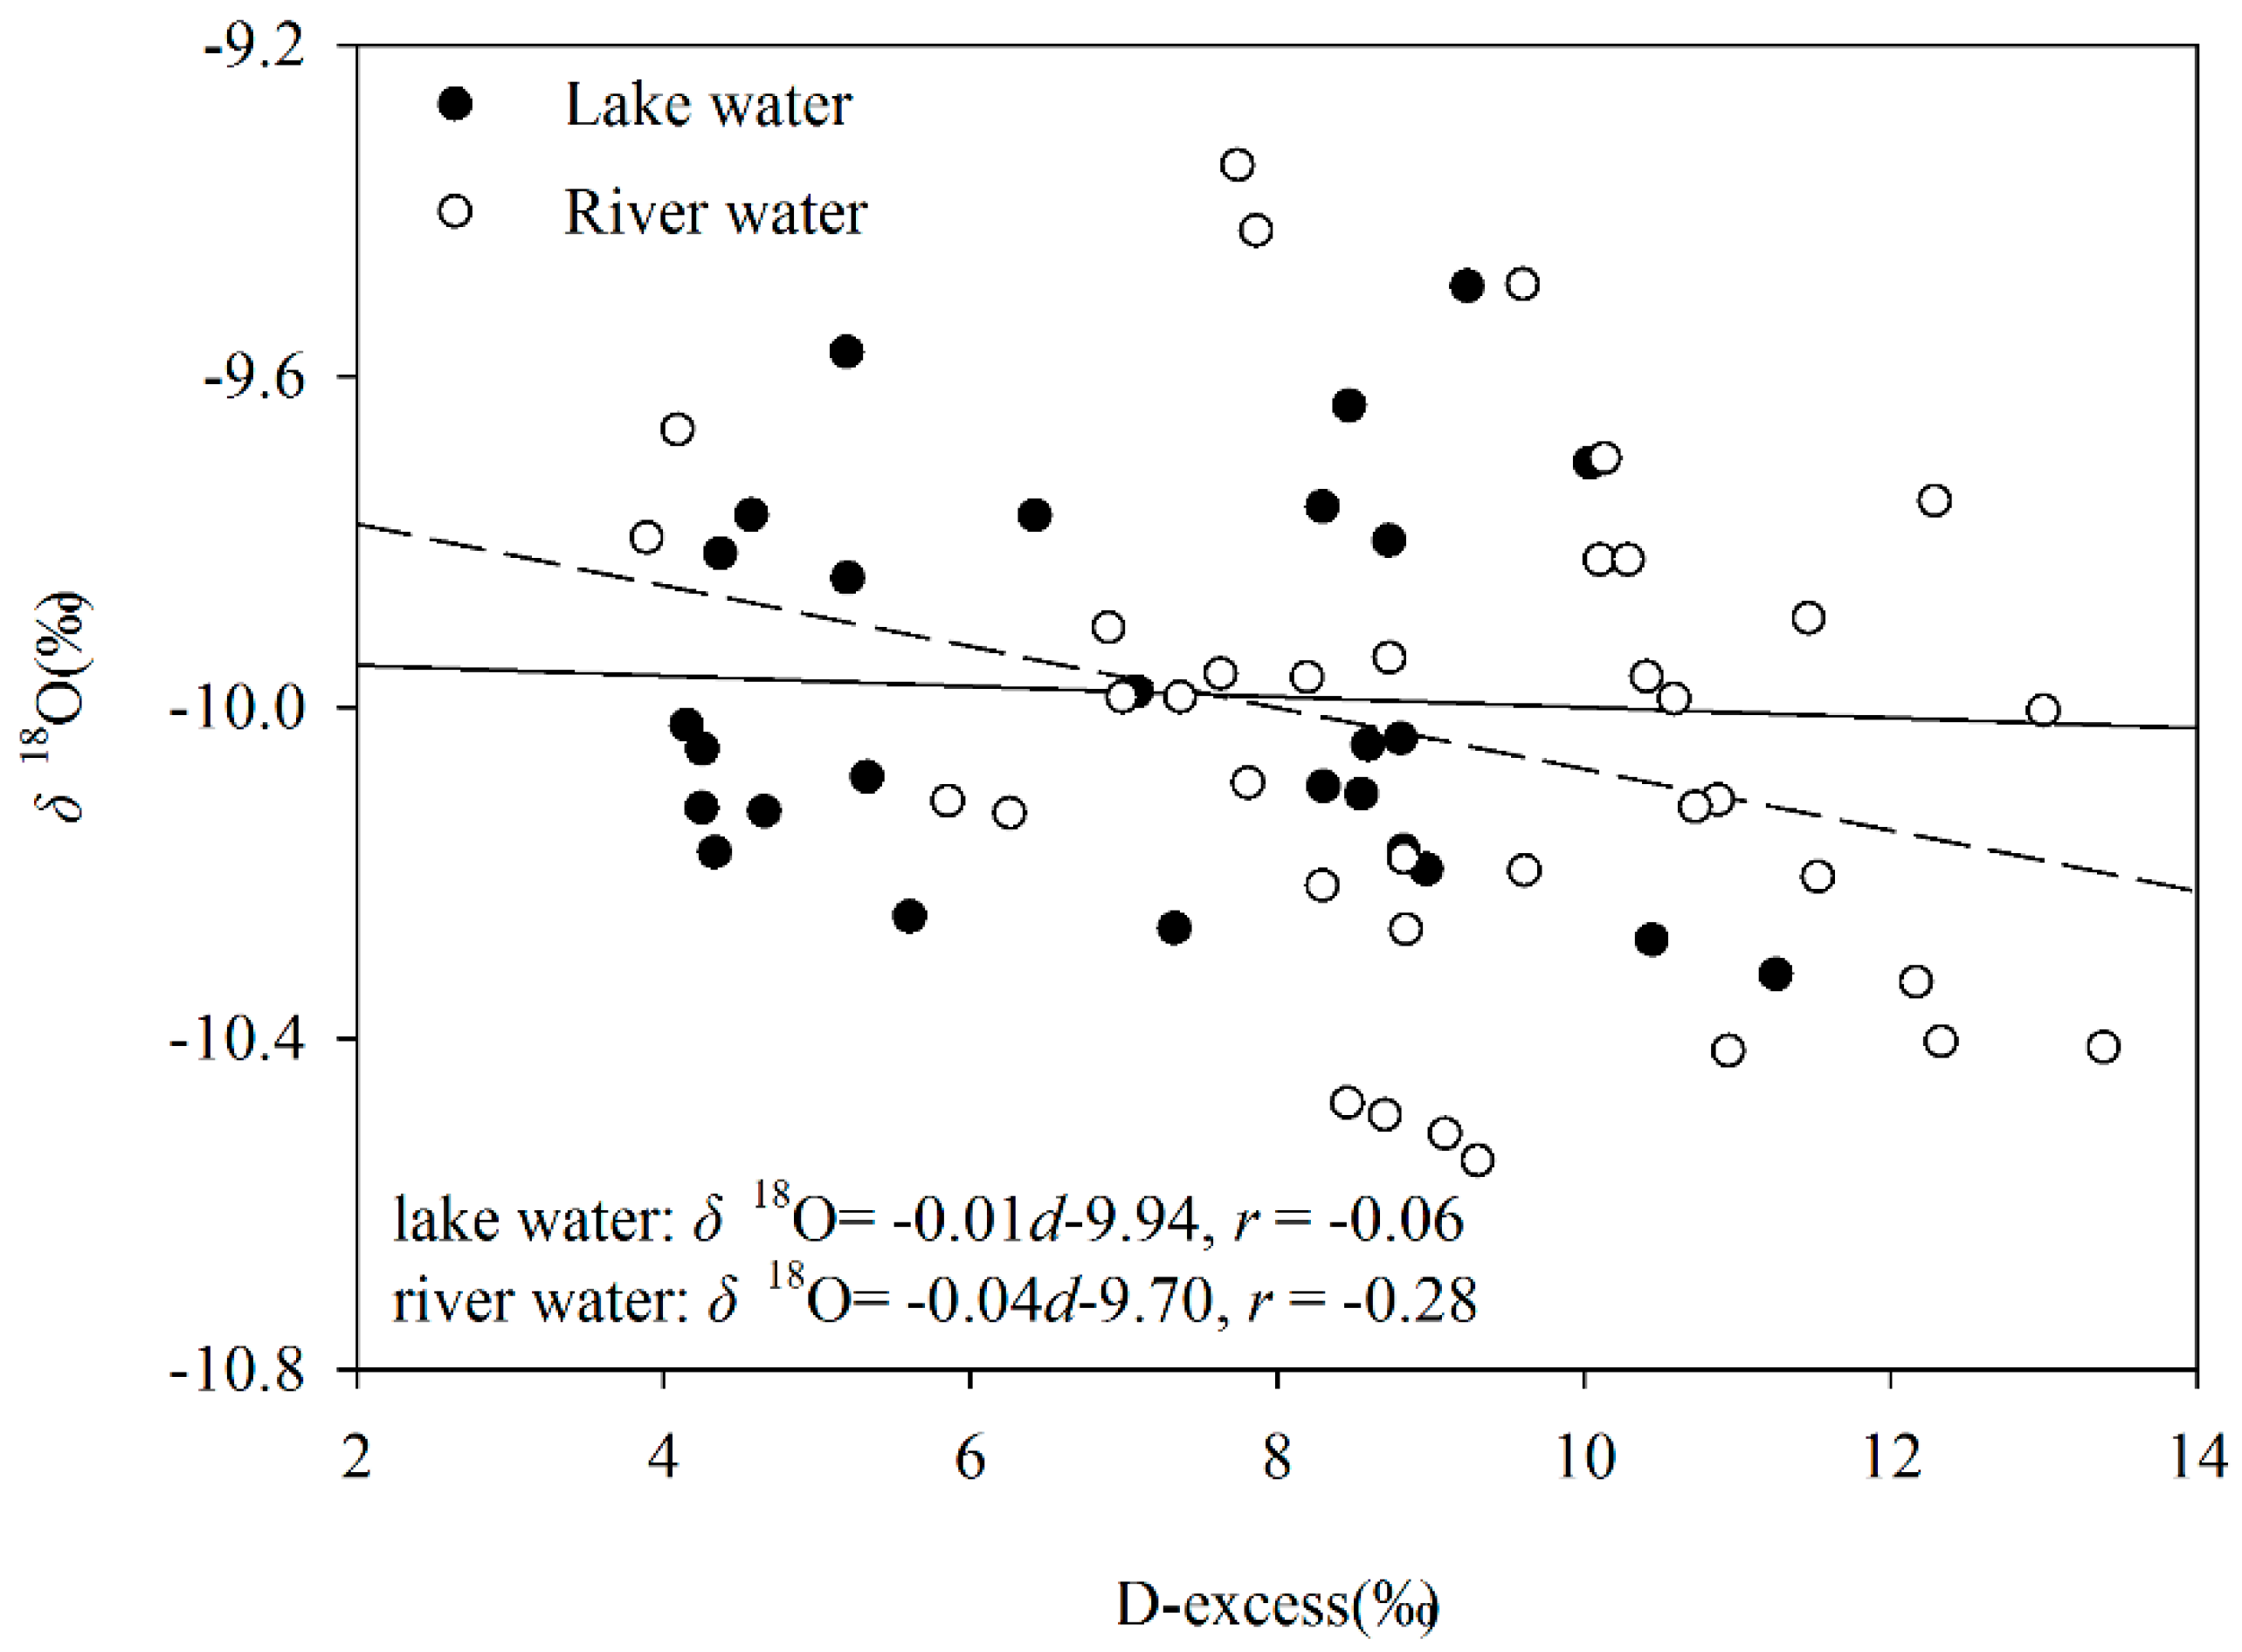
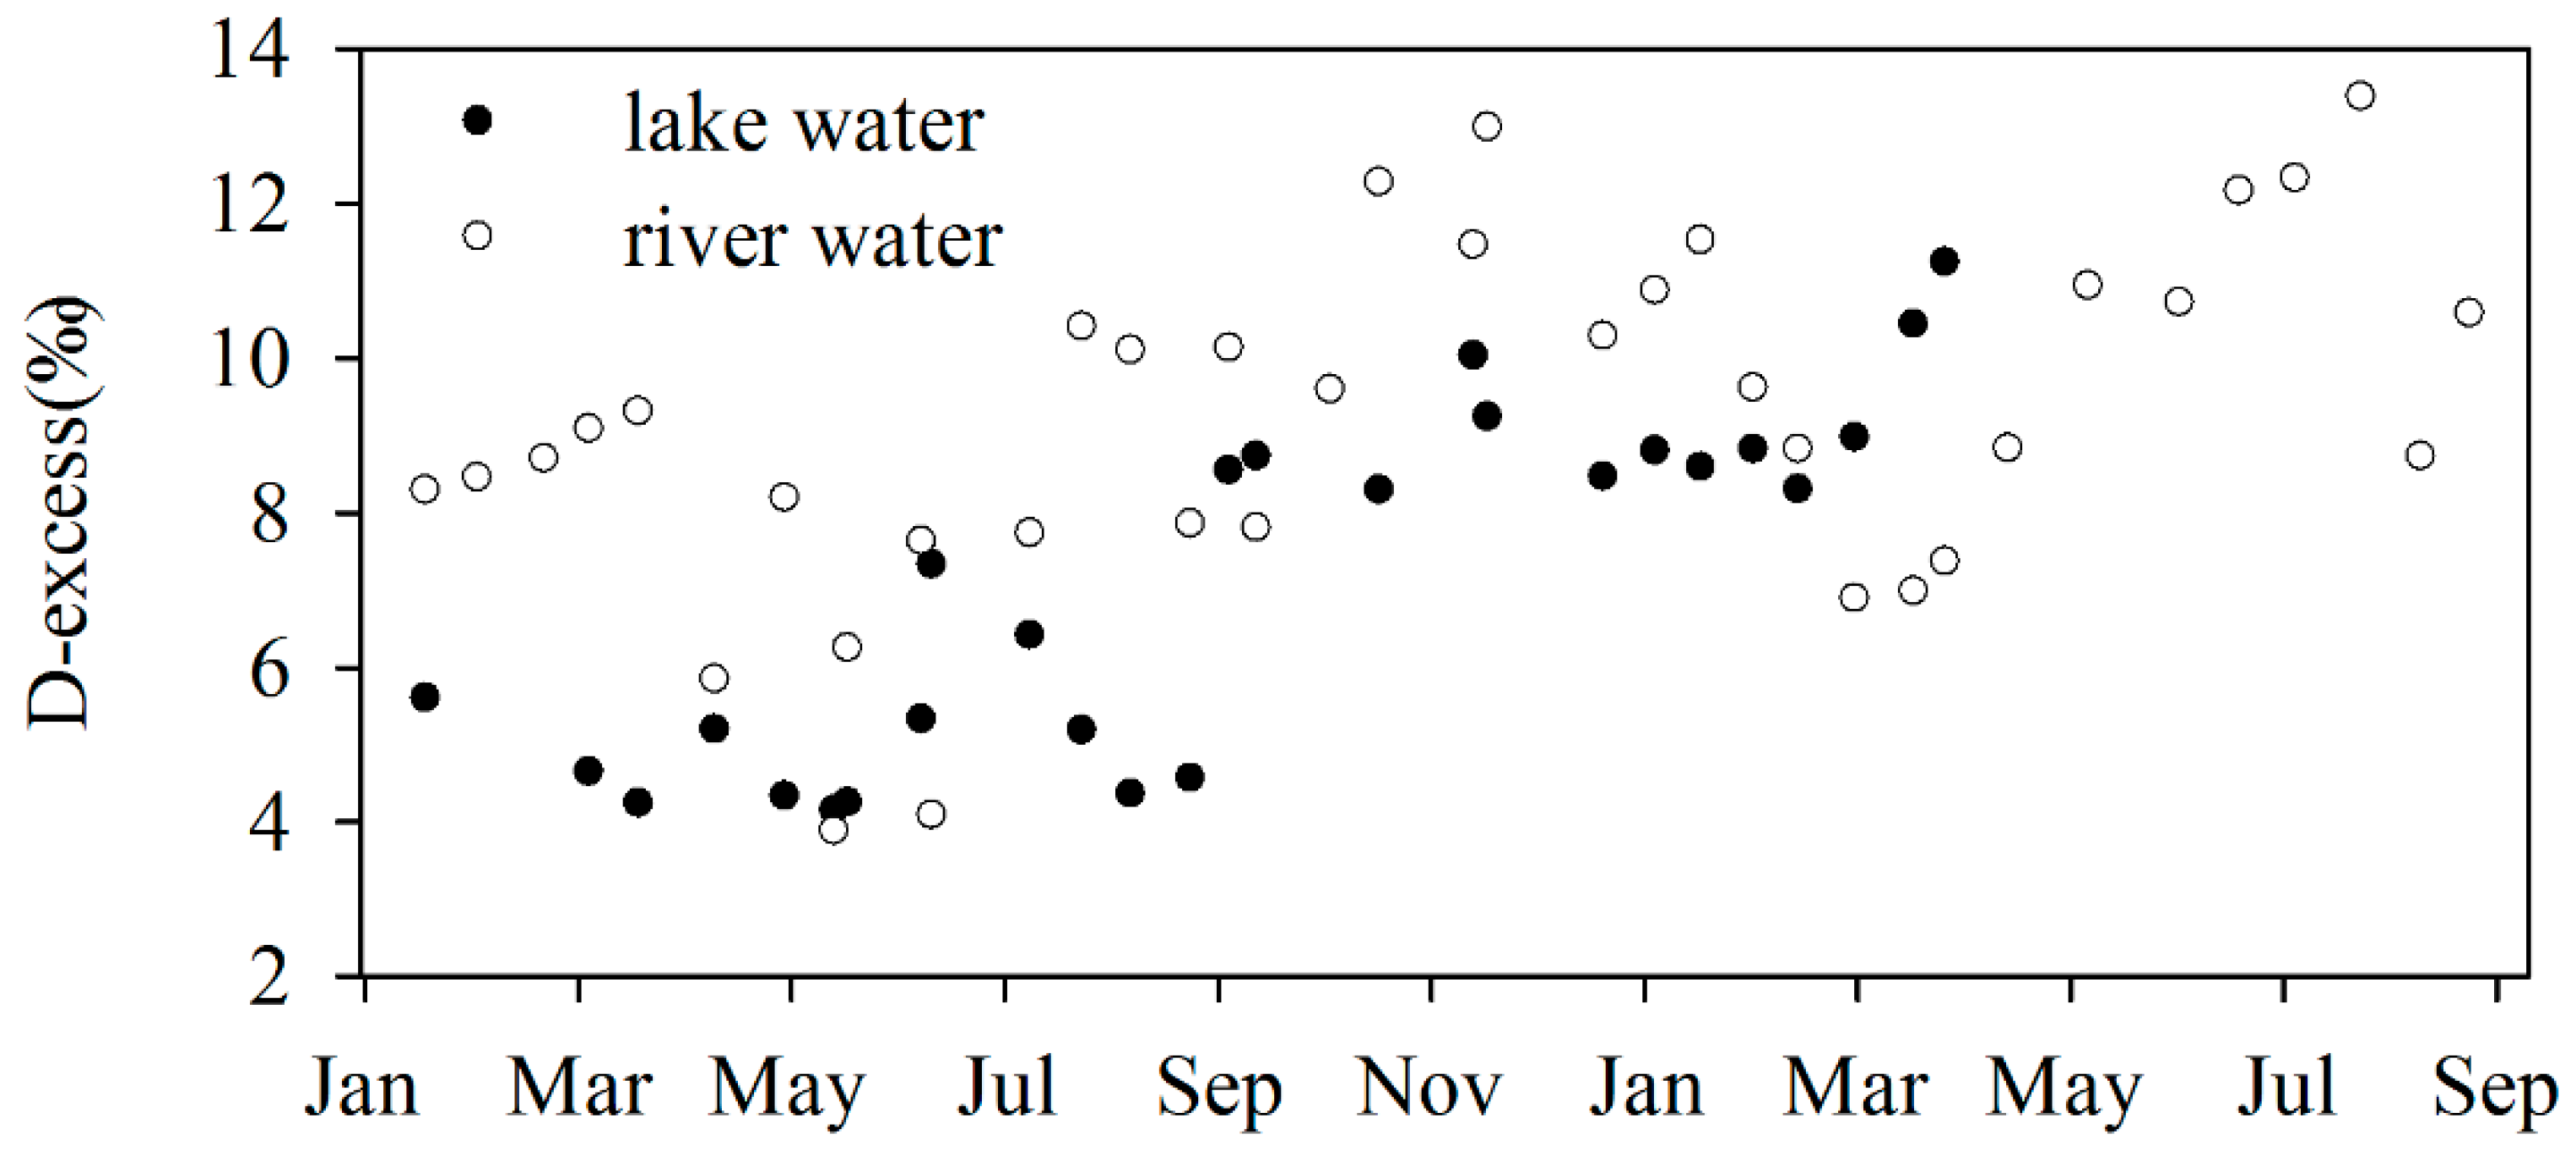
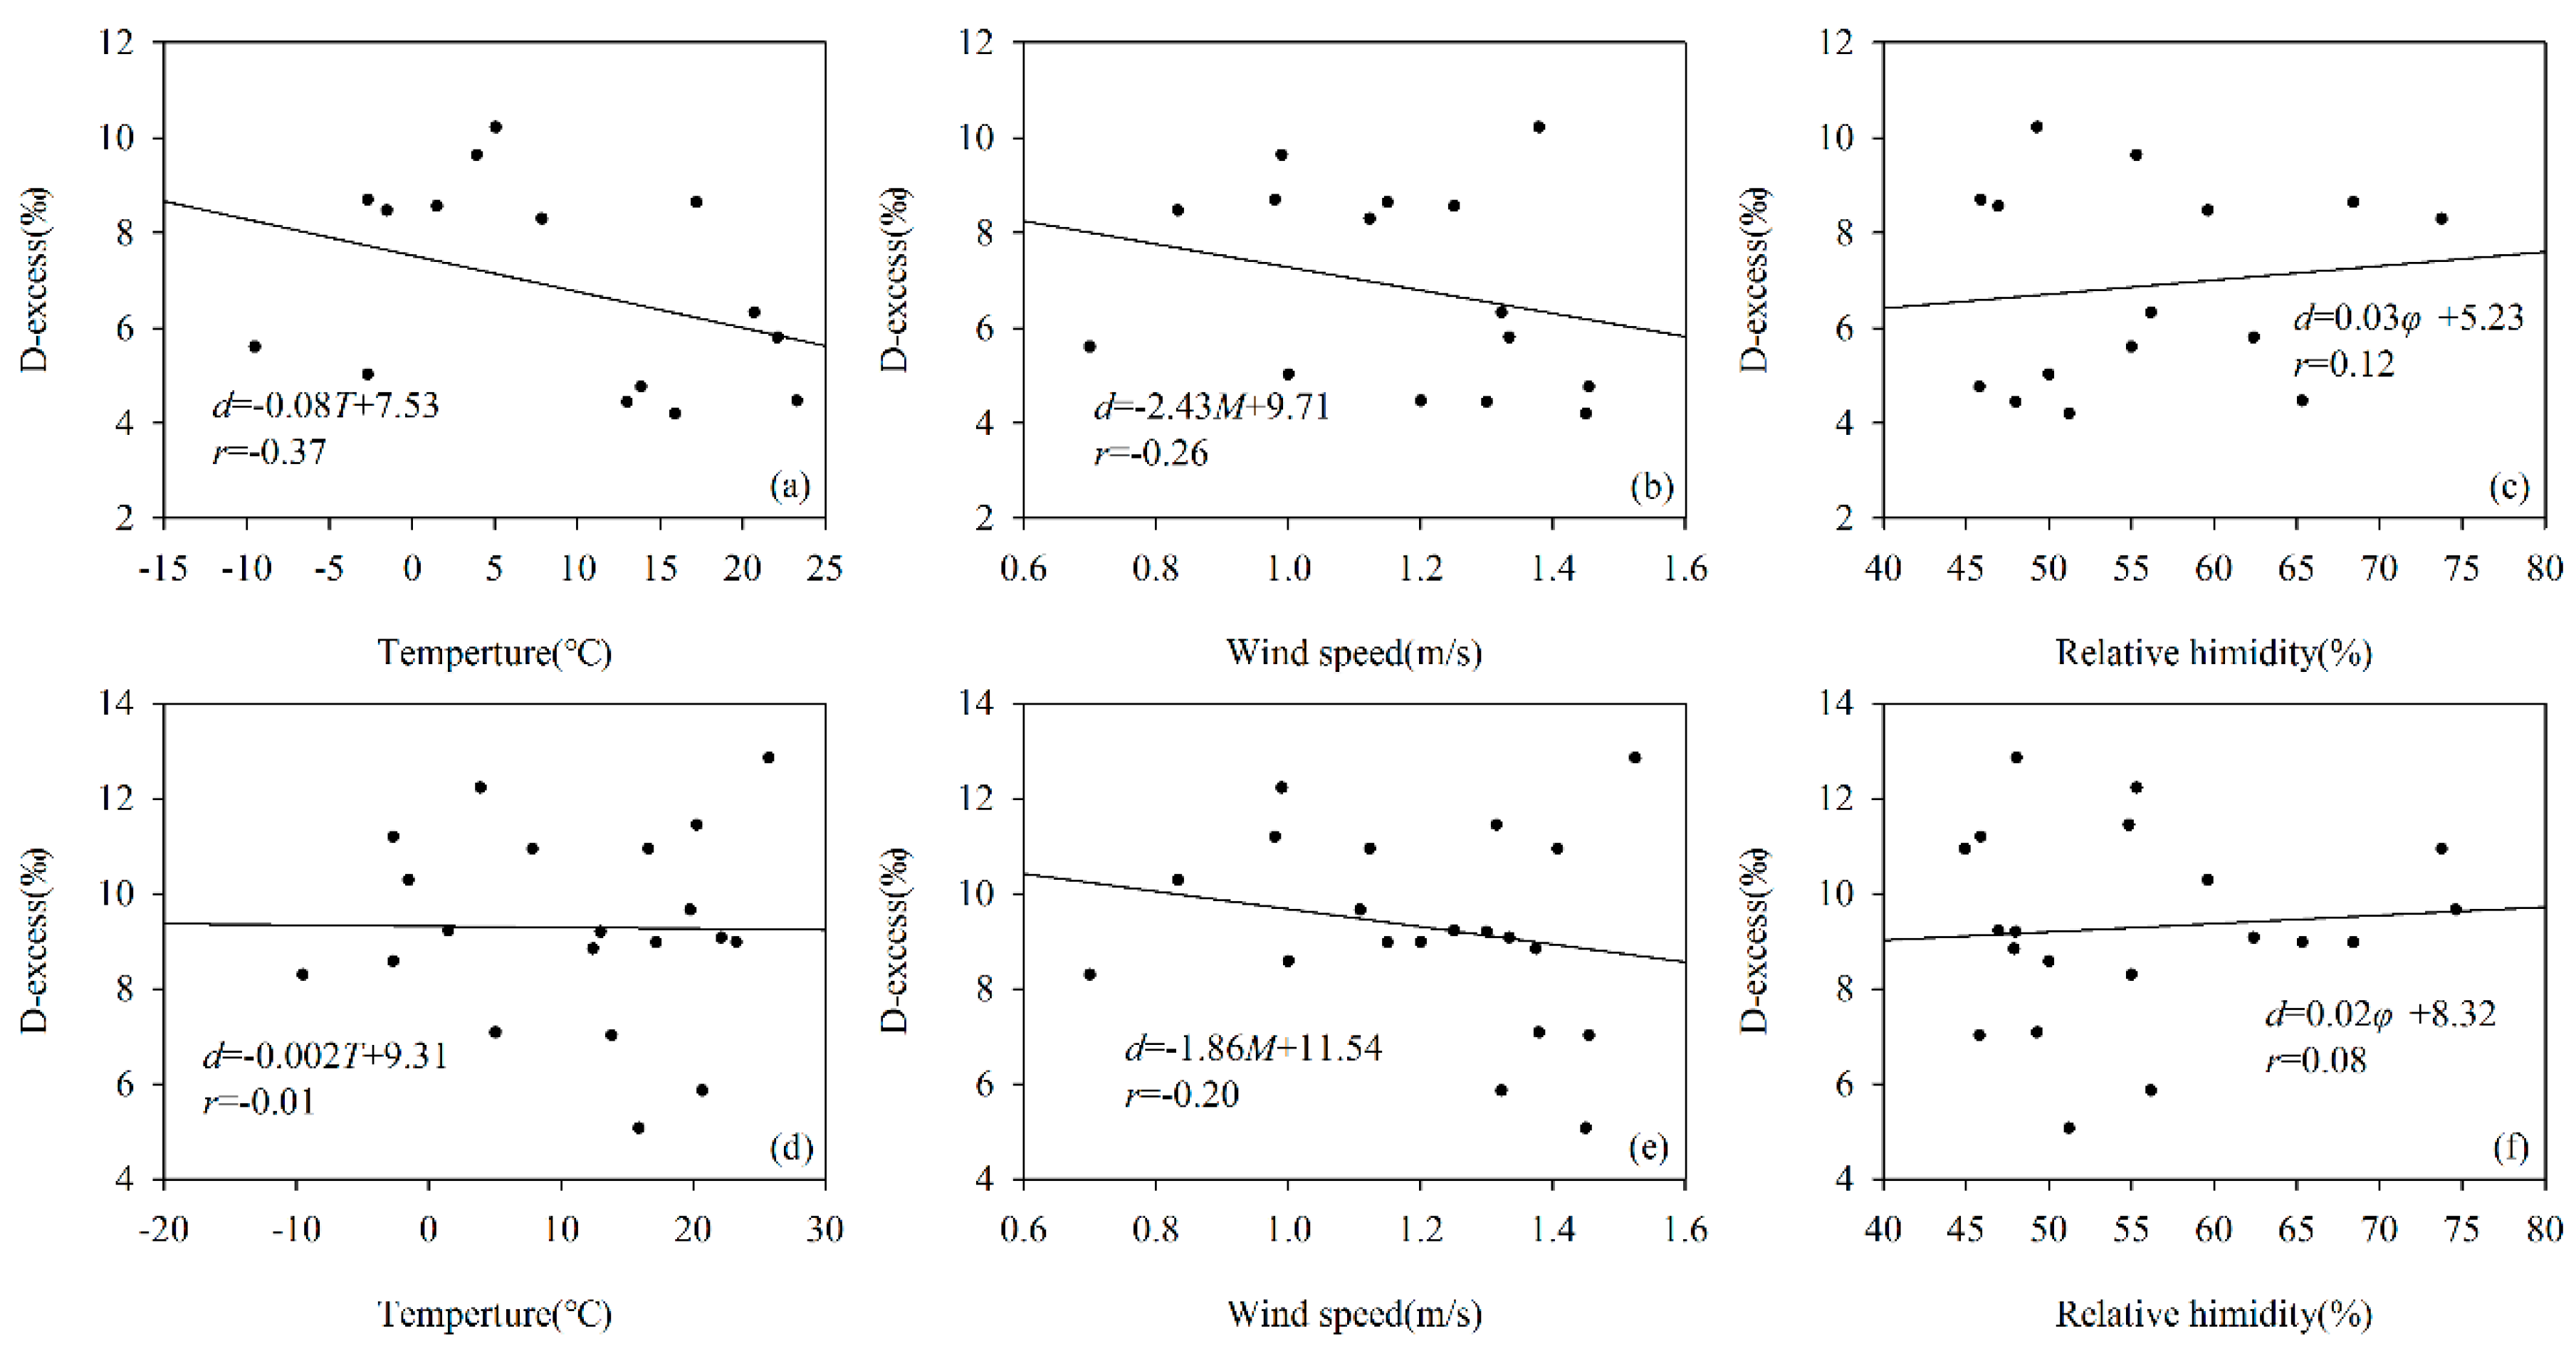
3.2. Deuterium-Excess in Surface Water
4. Conclusion
Supplementary Materials
Author Contributions
Funding
Acknowledgments
Conflicts of Interest
References
- Gat, J.R.; Gonfiantini, R. Stable Isotope Hydrology: Deuterium and Oxygen-18 in the Water Cycle; IAEA Technical Reports Series; International Atomic Energy Agency: Vienna, Austria, 1981; Volume 63, pp. 861–862. [Google Scholar]
- Gat, J.R. Oxygen and hydrogen isotopes in the hydrologic cycle. Annu. Rev. Earth Planet. Sci. 1996, 24, 225–262. [Google Scholar] [CrossRef]
- Ala-aho, P.; Soulsby, C.; Pokrovsky, O.S.; Kirpotin, J.; Serikova, S.; Vorobyev, S.N.; Manasypov, R.M.; Loiko, S.; Tetzlaff, D. Using stable isotopes to assess surface water source dynamics and hydrological connectivity in a high-latitude wetland and permafrost influenced landscape. J. Hydrol. 2018, 556, 279–293. [Google Scholar] [CrossRef]
- Wang, S.J.; Zhang, M.J.; Hughes, C.E.; Zhu, X.F.; Dong, L.; Ren, Z.G.; Chen, F.L. Factors controlling stable isotope composition of precipitation in arid conditions: An observation network in the Tianshan Mountains, central Asia. Tellus B Chem. Phys. Meteorol. 2016, 68, 26206. [Google Scholar] [CrossRef]
- Zhang, M.J.; Wang, S.J. A review of precipitation isotope studies in China: Basic pattern and hydrological process. J. Geogr. Sci. 2016, 26, 921–938. [Google Scholar] [CrossRef]
- Thorburn, P.J.; Hatton, T.J.; Walker, G.R. Combining measurements of transpiration and stable isotopes of water to determine groundwater discharge from forests. J. Hydrol. 1993, 150, 563–587. [Google Scholar] [CrossRef]
- Martinelli, L.A.; Victoria, R.L.; Sternberg, L.S.L.; Ribeiro, A.; Moreira, M.Z. Using stable isotopes to determine sources of evaporated water to the atmosphere in the Amazon basin. J. Hydrol. 1996, 183, 191–204. [Google Scholar] [CrossRef]
- Rosa, E.; Hillaire-Marcel, C.; Hélie, J.F.; Myre, A. Processes governing the stable isotope composition of water in the St. Lawrence river system, Canada. Isot. Environ. Health Stud. 2016, 52, 370–379. [Google Scholar] [CrossRef]
- Liu, Q.; Tian, L.D.; Wang, J.L.; Wen, R.; Weng, Y.B.; Shen, Y.P.; Vladislav, M.; Kanaev, E. A study of longitudinal and altitudinal variations in surface water stable isotopes in West Pamir, Tajikistan. Atmos. Res. 2015, 153, 10–18. [Google Scholar] [CrossRef]
- Zhang, M.J.; Wang, S.J. Precipitation isotopes in the Tianshan Mountains as a key to water cycle in arid central Asia. Sci. Cold Arid. Reg. 2018, 10, 27–37. [Google Scholar]
- Gibson, J.J.; Reid, R. Water balance along a chain of tundra lakes: A 20-year isotopic perspective. J. Hydrol. 2014, 519, 2148–2164. [Google Scholar] [CrossRef]
- Gaj, M.; Beyer, M.; Koeniger, P.; Wanke, H.; Hamutoko, J.; Himmelsbach, T. In situ unsaturated zone water stable isotope (2H and 18O) measurements in semi-arid environments: A soil water balance. Hydrol. Earth Syst. Sci. 2016, 20, 715–731. [Google Scholar] [CrossRef]
- Skrzypek, G.; Mydlowski, A.; Dogramaci, S.; Hedley, P.; Gibson, J.J.; Grierson, P.F. Estimation of evaporative loss based on the stable isotope composition of water using Hydrocalculator. J. Hydrol. 2015, 523, 781–789. [Google Scholar] [CrossRef]
- Boschetti, T.; Awaleh, M.O.; Barbieri, M. Waters from the Djiboutian Afar: A review of strontium isotopic composition and a comparison with Ethiopian waters and Red sea brines. Water 2018, 10, 1700. [Google Scholar] [CrossRef]
- Wassenaar, L.I.; Athanasopoulos, P.; Hendry, M.J. Isotope hydrology of precipitation, surface and ground waters in the Okanagan Valley, British Columbia, Canada. J. Hydrol. 2011, 411, 37–48. [Google Scholar] [CrossRef]
- Yao, Z.; Liu, J.; Huang, H.Q.; Song, X.F.; Dong, X.H.; Liu, X. Characteristics of isotope in precipitation, river water and lake water in the Manasarovar basin of Qinghai–Tibet Plateau. Environ. Geol. 2009, 57, 551–556. [Google Scholar] [CrossRef]
- Darling, W.G.; Bath, A.H.; Talbot, J.C. The O and H stable isotope composition of freshwaters in the British Isles. 2. Surface waters and groundwater. Hydrol. Earth Syst. Sci. 2003, 7, 183–195. [Google Scholar] [CrossRef]
- Porter, T.J.; Froese, D.G.; Feakins, S.J.; Bindeman, I.N.; Mahony, M.E.; Pautler, B.G.; Reichart, G.J.; Sanborn, P.T.; Simpson, M.J.; Weijers, J.W.H. Multiple water isotope proxy reconstruction of extremely low last glacial temperatures in Eastern Beringia (Western Arctic). Quat. Sci. Rev. 2016, 137, 113–125. [Google Scholar] [CrossRef]
- Ma, H.; Yang, Q.; Yin, L.; Wang, X.; Zhang, J.; Li, C.; Dong, J. Paleoclimate interpretation in Northern Ordos Basin: Evidence from isotope records of groundwater. Quat. Int. 2018, 467, 204–209. [Google Scholar] [CrossRef]
- Jeelani, G.; Kumar, U.S.; Kumar, B. Variation of δ18O and δD in precipitation and stream waters across the Kashmir Himalaya (India) to distinguish and estimate the seasonal sources of stream flow. J. Hydrol. 2013, 481, 157–165. [Google Scholar] [CrossRef]
- Corrales, J.L.; Sánchez-Murillo, R.; Esquivel-Hernández, G.; Herrera, E.; Boll, J. Tracking the water fingerprints of Cocos Island: A stable isotope analysis of precipitation, surface water, and groundwater. Rev. Biol. Trop. 2016, 64, 105–120. [Google Scholar] [CrossRef]
- Meng, Y.C.; Liu, G.D. Isotopic characteristics of precipitation, groundwater, and stream water in an alpine region in southwest China. Environ. Earth Sci. 2016, 75, 894. [Google Scholar] [CrossRef]
- Wen, R.; Tian, L.D.; Liu, F.J.; Qu, D.M. Lake water isotope variation linked with the in-lake water cycle of the Alpine Bangong Co, arid western Tibetan Plateau. Arct. Antar. Alp. Res. 2016, 48, 563–580. [Google Scholar] [CrossRef]
- Zhao, W.; Ma, J.Z.; Gu, C.J.; Qi, S.; Zhu, G.F.; He, J.H. Distribution of isotopes and chemicals in precipitation in Shule River Basin, northwest China: An implication for water cycle and groundwater recharge. J. Arid Land 2016, 8, 973–985. [Google Scholar] [CrossRef]
- Kendall, C.; Coplen, T.B. Distribution of oxygen-18 and deuterium in river waters across the United States. Hydrol. Process. 2001, 15, 1363–1393. [Google Scholar] [CrossRef]
- Dansgaard, W. Stable isotopes in precipitation. Tellus 1964, 16, 436–468. [Google Scholar] [CrossRef]
- Merlivat, L.; Jouzel, J. Global climatic interpretation of the Deuterium-Oxygen 18 relationship for precipitation. J. Geophys. Res.-Oceans 1979, 84, 5029–5033. [Google Scholar] [CrossRef]
- Cappa, C.D.; Hendricks, M.B.; DePaolo, D.J.; Cohen, R.C. Isotopic fractionation of water during evaporation. J. Geophys. Res. Atmos. 2003, 108, 4525. [Google Scholar] [CrossRef]
- Qian, H.; Wu, J.H.; Zhou, Y.H.; Li, P.Y. Stable oxygen and hydrogen isotopes as indicators of lake water recharge and evaporation in the lakes of the Yinchuan Plain. Hydrol. Process. 2013, 28, 3554–3562. [Google Scholar] [CrossRef]
- Yang, Q.C.; Mu, H.K.; Wang, H.; Ye, X.Y.; Ma, H.Y.; Martin, J.D. Quantitative evaluation of groundwater recharge and evaporation intensity with stable oxygen and hydrogen isotopes in a semi-arid region, Northwest China. Hydrol. Process. 2018, 32, 1130–1136. [Google Scholar] [CrossRef]
- Li, S.L.; Yue, F.J.; Liu, C.Q.; Ding, H.; Zhao, Z.Q.; Li, X.D. The O and H isotope characteristics of water from major rivers in China. Chin. J. Geochem. 2015, 34, 28–37. [Google Scholar] [CrossRef]
- Su, X.S.; Lin, X.Y.; Liao, Z.S.; Wang, J.S. Variation of isotopes in the Yellow River along the flow path and its affecting factors. Geochimical 2003, 32, 349–357. (In Chinese) [Google Scholar]
- Yi, P.; Wan, C.W.; Jin, H.J.; Luo, D.L.; Yang, Y.Z.; Wang, Q.F.; Yu, Z.B.; Aldahan, A. Hydrological insights from hydrogen and oxygen isotopes in Source Area of the Yellow River, East-Northern part of Qinghai-Tibet Plateau. J. Radioanal. Nucl. Chem. 2018, 317, 131–144. [Google Scholar] [CrossRef]
- Ren, D.Y.; Xu, X.; Hao, Y.; Huang, G.H. Modeling and assessing field irrigation water use in a canal system of Hetao, upper Yellow River basin: Application to maize, sunflower and watermelon. J. Hydrol. 2016, 532, 122–139. [Google Scholar] [CrossRef]
- Xue, S. Yellow River Water Resources Bulletin; Yellow River Conservancy Commission of Ministry of Water Resources: Zhengzhou, China, 2017. (In Chinese) [Google Scholar]
- Yellow River Conservancy Commission of the Ministry of Water Resources. Available online: http://www.yrcc.gov.cn/ (accessed on 12 August 2018).
- Chen, F.L.; Zhang, M.J.; Wang, S.J.; Ma, Q.; Zhu, X.F.; Dong, L. Relationship between sub-cloud secondary evaporation and stable isotopes in precipitation of Lanzhou and surrounding area. Quat. Int. 2015, 380–381, 68–74. [Google Scholar] [CrossRef]
- Gibson, J.J.; Edwards, T.W.D.; Bursey, G.G.; Prowse, T.D. Estimating Evaporation Using Stable Isotopes: Quantitative Results and Sensitivity Analysis for Two Catchments in Northern Canada. Hydrol. Res. 1993, 24, 79–94. [Google Scholar] [CrossRef]
- Craig, H. Isotope variations in meteoric waters. Science 1961, 133, 1702–1703. [Google Scholar] [CrossRef]
- Leslie, D.; Welch, K.A.; Berry, L.W. A temporal stable isotopic (δ18O, δD, d-excess) comparison in glacier meltwater streams, Taylor Valley, Antarctica. Hydrol. Process. 2017, 31, 3069–3083. [Google Scholar] [CrossRef]
- Fan, Y.T.; Chen, Y.N.; Li, X.G.; Li, W.H.; Li, Q.H. Characteristics of water isotopes and ice-snowmelt quantification in the Tizinafu River, north Kunlun Mountains, Central Asia. Quat. Int. 2015, 380–381, 116–122. [Google Scholar] [CrossRef]
- Wang, S.J.; Zhang, M.J.; Che, Y.J.; Zhu, X.F.; Liu, X.M. Influence of below-cloud evaporation on deuterium excess in precipitation of arid central Asia and its meteorological controls. J. Hydrometeorol. 2016, 17, 1973–1984. [Google Scholar] [CrossRef]
- Jouzel, J.; Merlivat, L. Deuterium and oxygen 18 in precipitation: Modeling of the isotopic effects during snow formation. J. Geophys. Res. Atmos. 1984, 89, 11749–11757. [Google Scholar] [CrossRef]
- Huang, T.M.; Pang, Z.H. The role of deuterium excess in determining the water salinization mechanism: A case study of the arid Tarim river basin, NW China. Appl. Geochem. 2012, 27, 2382–2388. [Google Scholar] [CrossRef]
- Deshpande, R.D.; Bhattacharya, S.K.; Jani, R.A.; Gupta, S.K. Distribution of oxygen and hydrogen isotopes in shallow groundwaters from Southern India: Influence of a dual monsoon system. J. Hydrol. 2003, 271, 226–239. [Google Scholar] [CrossRef]
- Gammons, C.H.; Poulson, S.R.; Pellicori, D.A.; Reed, P.J.; Roesler, A.J.; Petrescu, E.M. The hydrogen and oxygen isotopic composition of precipitation, evaporated mine water, and river water in Montana, USA. J. Hydrol. 2006, 328, 319–330. [Google Scholar] [CrossRef]
- Gu, W.Z. Isotope Hydrology; Science Press: Beijing, China, 2011; pp. 173–177. [Google Scholar]
- Gat, J.R.; Carmi, I. Evolution of the isotopic composition of atmospheric waters in the Mediterranean Sea area. J. Geophys. Res. 1970, 75, 3039–3048. [Google Scholar] [CrossRef]
- Wang, B.L.; Zhang, H.T.; Liang, X.; Li, X.D.; Wang, F.S. Cumulative effects of cascade dams on river water cycle: Evidence from hydrogen and oxygen isotopes. J. Hydrol. 2019, 568, 604–610. [Google Scholar] [CrossRef]
- Gat, J.R.; Bowser, C.J.; Kendall, C. The contribution of evaporation from the Great Lakes to the continental atmosphere: Estimate based on stable isotope data. Geophys. Res. Lett. 1994, 21, 557–560. [Google Scholar] [CrossRef]
- Guo, X.Y.; Tian, L.D.; Wang, L.; Yu, W.S.; Qu, D.M. River recharge sources and the partitioning of catchment evapotranspiration fluxes as revealed by stable isotope signals in a typical high-elevation arid catchment. J. Hydrol. 2017, 549, 616–630. [Google Scholar] [CrossRef]


| Sample | δ Value | Mean (‰) | SD (‰) | Max (‰) | Min (‰) | n | Period |
|---|---|---|---|---|---|---|---|
| Lake water | δ18O | −10.0 | 0.2 | −9.49 | −10.32 | 26 | January 2016–April 2017 |
| δ2H | −73 | 3.0 | −66.69 | −77.07 | |||
| River water | δ18O | −10.0 | 0.3 | −9.35 | −10.55 | 37 | January 2016–August 2017 |
| δ2H | −71 | 3.0 | −65.72 | −75.37 |
© 2019 by the authors. Licensee MDPI, Basel, Switzerland. This article is an open access article distributed under the terms and conditions of the Creative Commons Attribution (CC BY) license (http://creativecommons.org/licenses/by/4.0/).
Share and Cite
Shi, M.; Wang, S.; Argiriou, A.A.; Zhang, M.; Guo, R.; Jiao, R.; Kong, J.; Zhang, Y.; Qiu, X.; Zhou, S. Stable Isotope Composition in Surface Water in the Upper Yellow River in Northwest China. Water 2019, 11, 967. https://doi.org/10.3390/w11050967
Shi M, Wang S, Argiriou AA, Zhang M, Guo R, Jiao R, Kong J, Zhang Y, Qiu X, Zhou S. Stable Isotope Composition in Surface Water in the Upper Yellow River in Northwest China. Water. 2019; 11(5):967. https://doi.org/10.3390/w11050967
Chicago/Turabian StyleShi, Mengyu, Shengjie Wang, Athanassios A. Argiriou, Mingjun Zhang, Rong Guo, Rong Jiao, Jingjing Kong, Yaning Zhang, Xue Qiu, and Su’e Zhou. 2019. "Stable Isotope Composition in Surface Water in the Upper Yellow River in Northwest China" Water 11, no. 5: 967. https://doi.org/10.3390/w11050967