The Effect of Climatic and Non-climatic Factors on Groundwater Levels in the Jinghuiqu Irrigation District of the Shaanxi Province, China


1
School of Environmental Science and Engineering, Chang’an University, Xi’an 710054, China
2
Key Laboratory of Subsurface Hydrology and Ecological Effects in Arid Region, Ministry of Education, Chang’an University, Xi’an 710054, China
3
Institute of Water and Development, Chang’an University, Xi’an 710054, China
4
River Engineering Technology Research Center of Shaanxi Province, Xi’an 710000, China
*
Author to whom correspondence should be addressed.
Water 2019, 11(5), 956; https://doi.org/10.3390/w11050956
Submission received: 17 March 2019
/
Revised: 19 April 2019
/
Accepted: 5 May 2019
/
Published: 7 May 2019
(This article belongs to the Section Water Resources Management, Policy and Governance)
Abstract
:A chronic decline of the groundwater levels has become one of the hot issues affecting groundwater resources management. The rising global temperature, the high frequency of extreme weather (higher temperature and stronger evaporation, heavy or less rainfall), and unreasonable management policies have become important driving factors, causing a dynamic change in groundwater levels, in many regions. This study aims to explore the impact of climate and non-climate factors on groundwater levels in the Jinghuiqu irrigation district. The climatic phases were defined by rainfall anomalies, and the Mann–Kendall trend test statistic (M–K test) and Sen’s slope method were used to statistically analyze the influence of temperature (1950–2017) and rainfall (1980–2017) on the groundwater level. The results showed that: (1) Dry, normal, and wet phases occurred alternately, including two normal, two wet, and one dry periods (Wet 1980–1984; Normal 1985–1996; Dry 1997–2002; Wet 2003–2011; Normal 2012–2017). (2) The groundwater levels in the dry phase, decreased significantly by 0.62 m/year (p < 0.05), and the groundwater levels in the wet phases did not have a complete recovery, due to the excessive extraction of groundwater. Meanwhile, extreme weather became an important signal to reflect the change of groundwater levels. (3) The groundwater levels decreased significantly in the west and northwest (p < 0.05), but not in the southeast, due to the regional difference of groundwater extraction, which is the primary factor resulting in a chronic decline of groundwater levels. (4) Besides human activities, temperature had a higher correlation with groundwater levels (p < 0.05), which indicated that the potential impact of climate change on groundwater levels should not be ignored while setting groundwater resource management policies for a sustainable cycle of atmosphere–land–water.
1. Introduction
The dynamic change of groundwater levels is affected by climate change, which is the general agreement reached by academics and governments [1,2,3,4]. At present, a large number of studies have shown that climate change has become an important factor affecting groundwater resources with a complicated process [5]. According to relevant research reports, groundwater recharge is easily affected by climate change, and especially climate warming and the reduction of rainfall have been non-negligible factors causing declining groundwater levels [6]. As the climate warms, the frequency of wet seasons has been decreasing in many places, particularly in arid and semi-arid regions [7,8], which aggravates groundwater resource shortage, due to lesser groundwater recharge. Many regions of the world are faced with groundwater recharge imbalances [9,10,11]. Under ideal conditions (stable climatic conditions, sustainable exploitation rate), the recharge and discharge of groundwater can reach a balance. If not, whether the balance can be maintained is also a concern of many regions in the world. For example, groundwater provides more than 30% of Australia’s total water consumption, and the potential increased dependency on groundwater for agriculture, has increased the importance of understanding the trends in groundwater decline and recharge, in relation to climate [12]. Furthermore, the extraction of groundwater has become the main reason causing the decline in groundwater levels. Overexploitation of groundwater resources have caused a decline of groundwater levels, resulting in saltwater intrusion in the eastern plains of the Urmia Lake, Iran [13]. The main reason for groundwater depletion is its extraction, and the lesser rainfall has caused groundwater levels to decrease in the Kandivalasa River Sub Basin in India [14]. Therefore, it is necessary to study the groundwater level dynamics.
At present, the relationship between climate change and the dynamic change of groundwater levels has been studied by many scholars in different regions. Hofmann et al. (2000) found that the groundwater levels were particularly impacted by extreme weather (heavy rainfall and strong evaporation) [15]. Chen et al. (2004) concluded that temperature had a stronger effect on groundwater levels than rainfall, in shallow aquifers [16]. Zektser et al. (2005) informed that climate change caused frequent droughts in the region, leading to severe groundwater overdraft and a significant decline in groundwater levels [17]. Panda et al. (2007) indicated that the deficit of groundwater recharge in dry years, did not recover completely in wet years [18]. Almedeij and Al-Ruwaih (2006) investigated that the groundwater levels were negatively correlated with temperature and positively correlated with rainfall [19]. Other research showed that the chronic climate change, and human activities have a significant impact on groundwater dynamics [20,21,22]. More studies have focused on regions with a strong climate change, but there are a few studies on arid and semi-arid regions located in temperate climate zones (away from the coast), where some important granaries of the world are located. Furthermore, the groundwater resources are the guarantee of food production, especially in the agricultural irrigation areas of arid and semi-arid regions. Therefore, it is necessary to explore the impact of climate variables on groundwater resources, in such regions.
The Jinghuiqu irrigation district located in arid and semi-arid areas was built in 1932. From 1932 to 2017, groundwater management policies had undergone major changes. By the 1950s and 1960s, the canal was the major irrigation mode, and the groundwater depths of two-fifths of the area kept 1–3 m below surface, due to a large irrigation water quota. In the early 1980s, the groundwater management policy of well irrigation has been strongly implemented with 14,729 pumping wells, and the area of shallow groundwater depths area have decreased significantly, which have led to a chronic decrease in groundwater levels. In the last ten years, the groundwater management policy preferred canal irrigation to well irrigation, in order to restore the groundwater levels. The canal irrigation infrastructures and groundwater management policies were further improved, but the groundwater levels have still kept a chronic declining trend. Detailed studies on the effects of long-term climate change and groundwater extraction on groundwater levels, have still not been conducted in the Jinghuiqu irrigation district.
Many studies on groundwater decline have been carried out in the Jinghuiqu irrigation district. Huang et al. (2014) indicated that groundwater extraction and hydrogeological parameters had obvious influences on the variation of groundwater levels, using the MODFLOW model [23]. Jing et al. (2014) showed that climate change had become non-negligible factors affecting the groundwater levels, using the principal component analysis [24]. Due to the short-term data and subjective influence of humans, their results had obvious differences. The model methods could make up for the absence of long time-series data, but the simulation accuracy was significantly affected by the scale, precision error standard, the boundary conditions, and the uncertainty of parameters, resulting in simulation results that showed obvious differences with the actual results [25,26,27]. Due to the absence of data from long-term in situ observation, the relationship between climate change and groundwater dynamics have not effectively been established [28,29]. Although different models were used by the above scholars to analyze the factors affecting the groundwater levels in the Jinghuiqu irrigation district, more insightful information about the groundwater systems response to climate change cannot be exhibited by these models.
The M–K test has become one of the most popular methods to detect the trend of climate change [30], and it has been widely used in meteorology and hydrology. The M–K test was used to analyze the change trends of groundwater levels, in multi-year climatic phases in West Africa [31]. Tabari et al. (2012) found similar trends in groundwater levels in Northern Iran, in distinct annual and seasonal time periods, using the M–K test and the Sen’s slope method [32]. Abdullahi et al. (2015) identified both significant positive and negative trends for the northeastern region of Peninsular Malaysia, within distinct climatic phases, using the M–K test and the Sen’s slope [33]. These studies suggest that the approach might provide a more insightful information about potentially stressed groundwater systems, but the validity of the test results will be reduced if the effective data were less than 40% [34]. In this study, the effective data reached 71%. Therefore, the M–K test and Sen’s slope methods were used in this paper to analyze the trend of time series of climate change, in the study area.
The Jinghuiqu irrigation district was taken as the research object in this paper, and the meteorological data, including temperature (1950–2017) and rainfall (1980–2017), were statistically analyzed by the M–K test and Sen’s slope. The influence of climate factors and non-climate factors on groundwater levels was discussed, to provide a reference for the establishment of groundwater management policy and to ensure a sustainable utilization of groundwater resources.
2. Materials and Method
2.1. Study Area
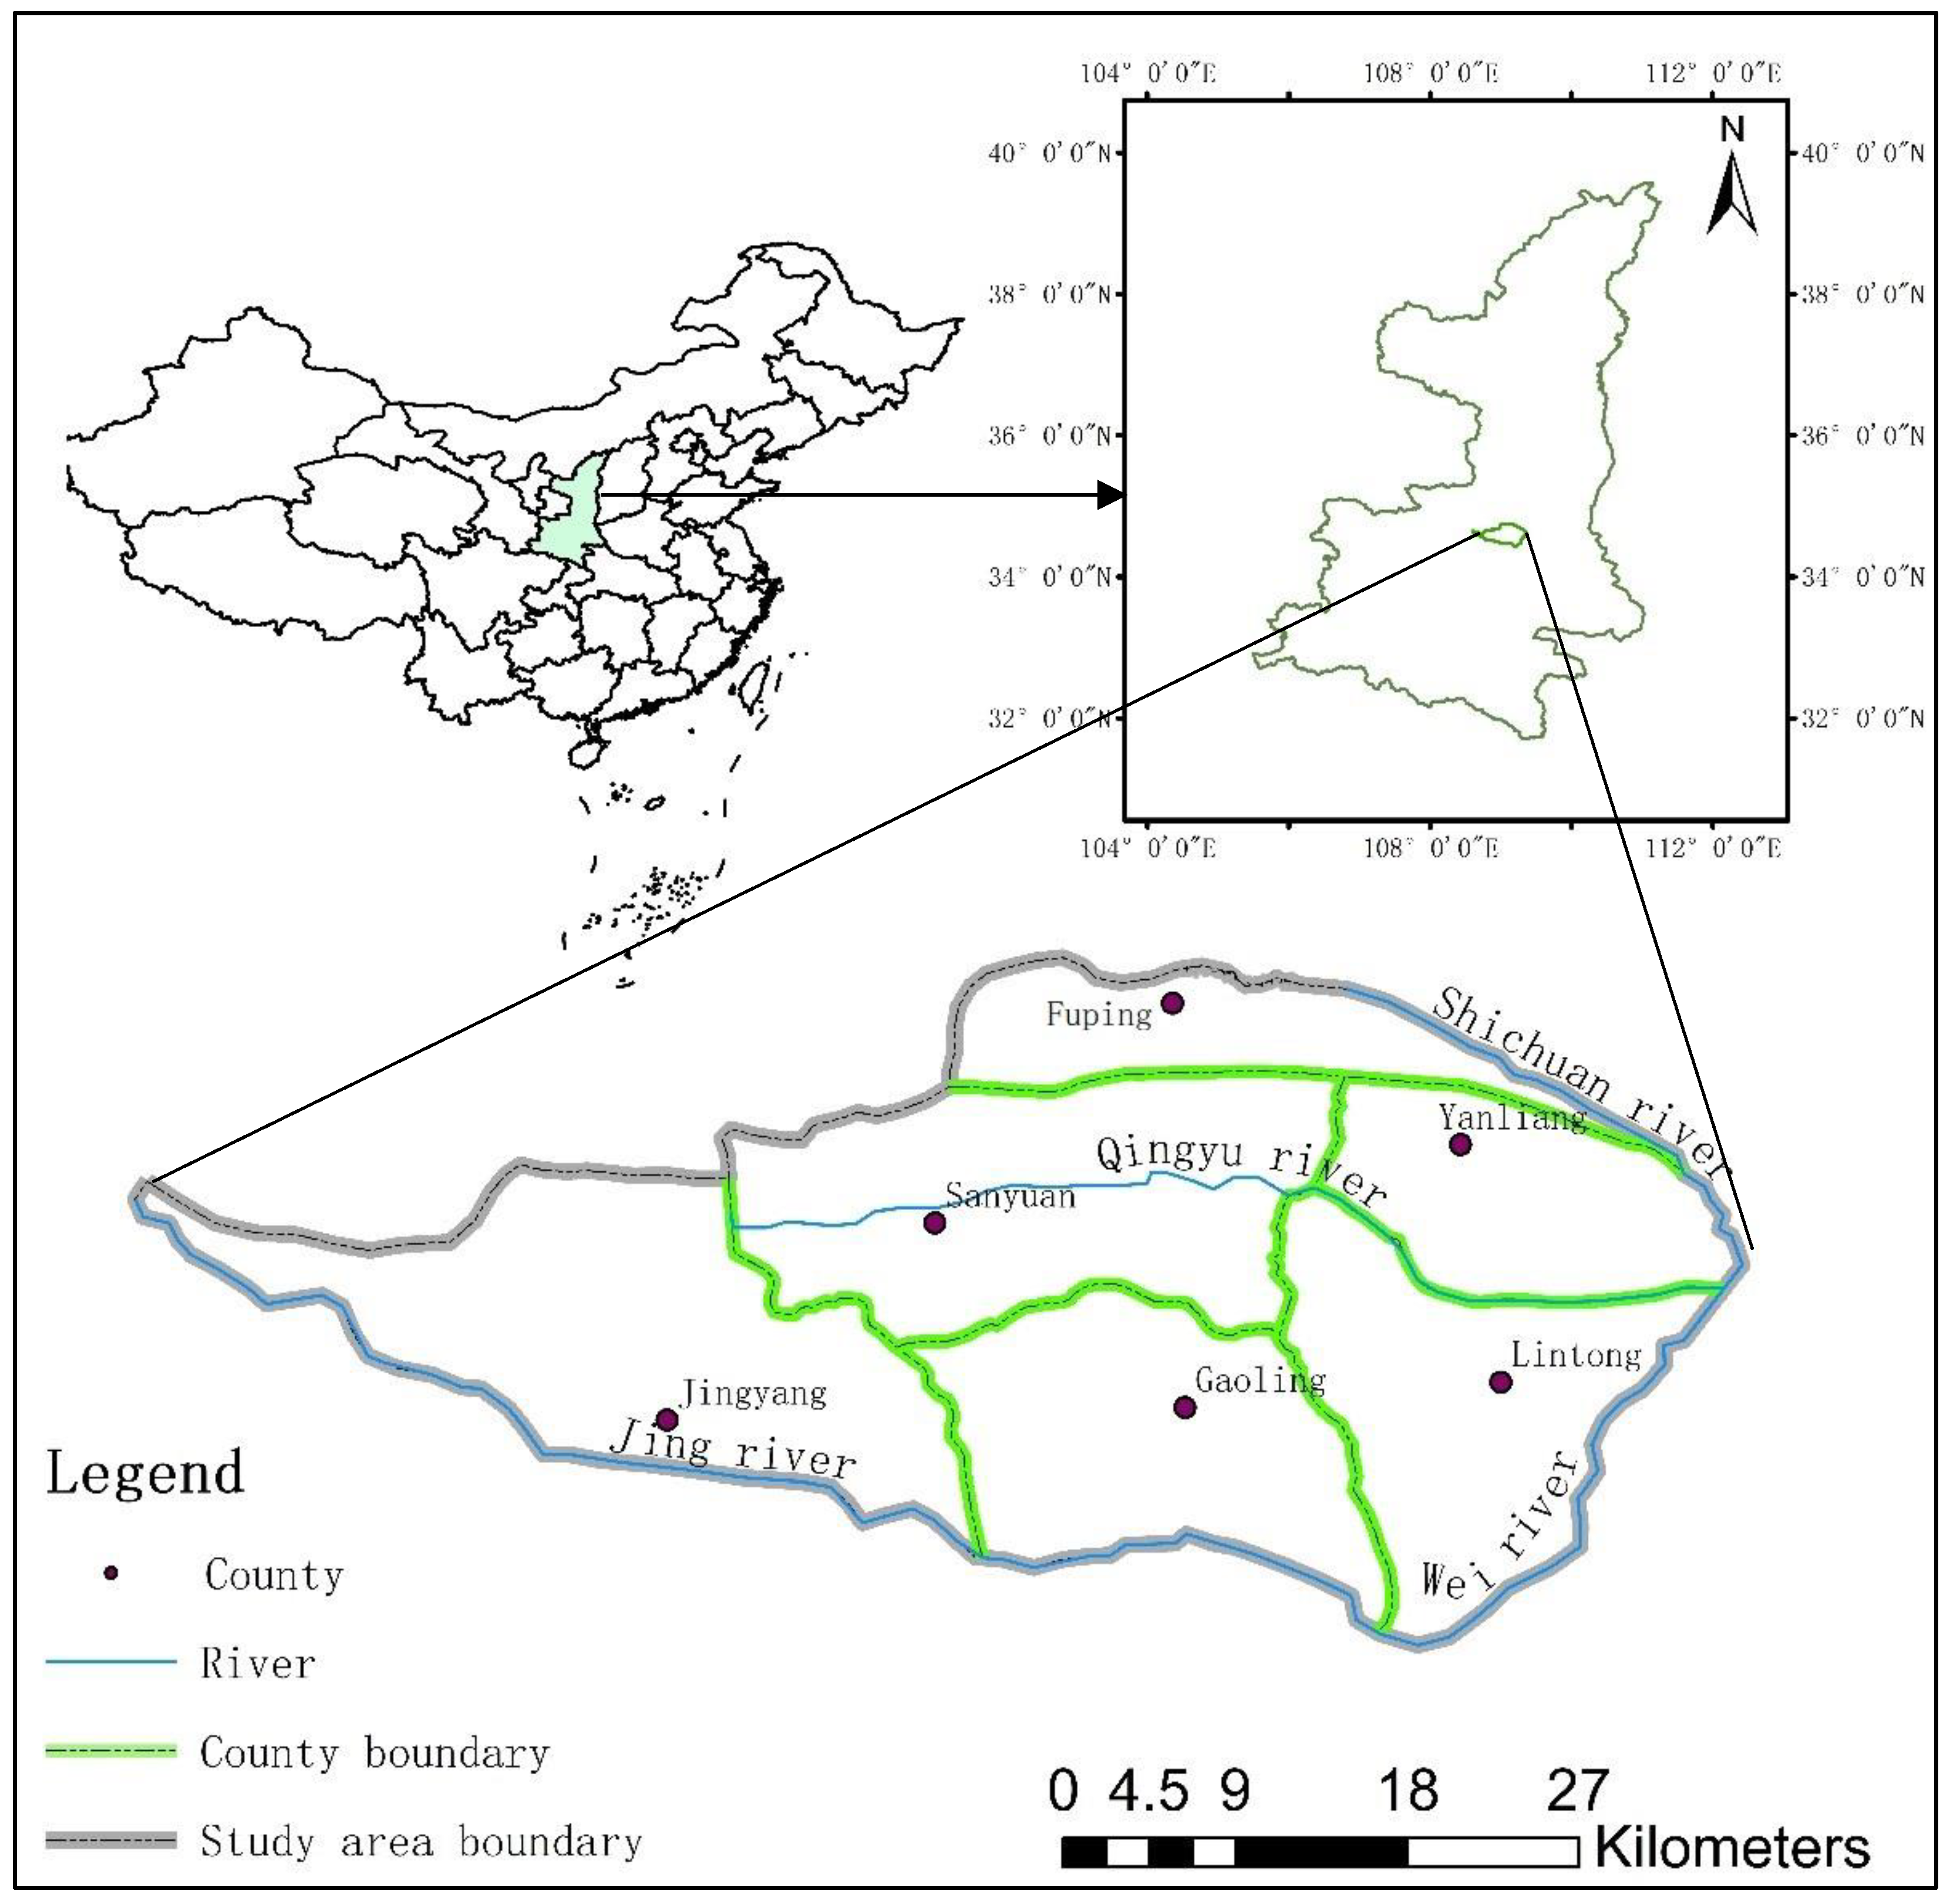
Climatologically, The Jinghuiqu irrigation district covers an area of approximately 1182 km2, located in the middle of the Guanzhong plain in the Shaanxi province of China (elevation 350–450 m above sea level), which is in a warm temperate climate zone (Figure 1). The mean annual temperature is 13.6 °C, with a maximum ever recorded value of 42 °C, in July, and a minimum of −24 °C in January [35]. This region has a mean annual precipitation of 533 mm, with about 50% of annual rainfall concentrated in July, August, and September. The average annual potential evapotranspiration is 1212 mm, which is 2.3 times that of rainfall [35]. The depth of the shallow groundwater table varied between 5 to 70 m below the soil surface in 2009 [36].
More than 80% of the groundwater vertical recharge was from irrigation return water and rainfall infiltration, and lateral recharge from the Weihe, Shichuanhe, Qingyuhe, and Jinghe rivers. Irrigation return water accounted for 52.3%, and rainfall infiltration accounted for 32.4% of vertical recharge. The major drainage of the groundwater aquifer included groundwater extraction and lateral drainage to the rivers. About 80% of the water used for industry and daily life came from the groundwater, and more than 40% of the water used for irrigation was from groundwater. Urban water use in the study area was surface water diverted from the Jinghe River. Most of the urban waste water was discharged into the Jinghe and Weihe rivers. The local cropping system was wheat in winter and rotated to corn in summer. Crops were irrigated 3–5 times a year, depending on the amount of precipitation. The average total irrigation amount was approximately 500 mm per year [36].
Hydrologically, the study area was located in the Weihe Graben structural zone, a Cenozoic fault-block basin, which is dominated by Tertiary fluviatile deposits, Quaternary fluviatile deposits, and Quaternary sedimentary loess. The east-west fault is located in the north. The upper layer of sediments is mainly Quaternary river sediments. Consequently, an alluvial aquifer forms with more than 6000 m thickness [37]. The groundwater extraction is mainly from confined aquifers of more than 100 m thickness below surface. According to the geological structure of the study area, the topography inclined from northwest to southeast, and the groundwater flowed primarily from north to south.
2.2. Research Method
2.2.1. Climatic Phases Defined by Rainfall Anomalies
The rainfall anomaly meant the difference between the rainfall of an individual year (month) and the average of many years (month). The rainfall anomaly was calculated on the basis of the annual average rainfall from 1980 to 2017. Due to the lag effect of rainfall on the groundwater levels, the rainfall anomaly value was converted to the weighted anomaly value, defined as the addition of rainfall anomalies over the past four years to current rainfall anomalies [38]. The weighted rainfall anomaly values for each meteorological station were defined as follows:
where P(5yr, wtd) is the weighted rainfall anomaly value of 5 years, yi is the year i, P(yi) is the annual rainfall anomaly value of year i, and i − 1 is the rainfall anomaly value of the previous year.
Aggregated annual anomalies (j) across the five recording stations (n) were then calculated as:
2.2.2. Mann–Kendall Test
(1) Trend analysis
In the M–K test, the null hypothesis H0 referred to the time series data (x1, x2, …, xn) with n independent samples with the same distribution of random variables; and the alternative hypothesis H1 was a bilateral test. For all i, j ≤ n, i ≠ j; xi and xj had different distributions. The statistic S was defined as follows:
where S is normally distributed with a mean of 0 and a variance of S (V(S)), expressed as follows:
The statistic Z was defined as follows:
where Z > 0 indicates an increasing trend, Z = 0 indicates no trend, and Z < 0 represents a declining trend. When the absolute value of Z was greater than or equal to 1.28, 1.64, and 2.32, the test had passed the significance test of 90%, 95%, and 99% reliability, respectively [39].
(2) Abrupt change analysis
The climate sequence was arranged as x1, x2, …, xn, Sk referred to the cumulative number of the sample i (xi > xj, 1 ≤ j ≤ i), defining the statistic [40,41]:
Under the assumption of random independence of time series, the mean and variance of Sk were expressed respectively as follows:
UFk and UBk were expressed, respectively, as follows:
where, UF refers to the statistical value of the standard normal distribution, based on the change trend of climate variables (rainfall, temperature). UF > 0 showed an increasing trend; UF < 0 showed a downward trend, and the larger the absolute value of UF, the more obvious the change trend. UB was the reverse order of −UF as an auxiliary line, in order to detect the abrupt change range of climatic variables in a long-time series. When the two curves (UF and UB) intersected, the time corresponding to the intersection point was the period of the start of the abrupt change.
2.2.3. The Optimized Well–Canal Irrigation Ratio
The well–canal irrigation ratio was defined as the ratio of irrigation water between groundwater extraction and canal diversion from the Jinghe River, in this study. For a lesser change in rainfall, the amount of water diverted from Jinghe River affected the groundwater extraction indirectly, based on the standardized irrigation quota. A higher water diversion could reduce the groundwater extraction, while a lower water diversion could increase the groundwater extraction in the agricultural irrigation area. The impact of well–canal irrigation ratios on the balance of groundwater recharge and discharge was variable. In this study, the optimized well–canal irrigation ratios by Dai et al (2012) have been referenced in the study area [42], as shown in Table 1.
2.2.4. Data Standardization
In order to conduct statistical analysis on data of different dimensions or orders of magnitude, the Min–Max standardization was used in this paper, and the formula was expressed as follows [43,44,45]:
where Std is the standardized data, X is the original data, Max is the maximum value in the data sequence, and Min is the minimum value in the data sequence.
2.3. The Data Source
The data of groundwater levels, including 119 monitoring wells (MWS) from 1980 to 2017 were collected by the Chang’an University Water and Development Research Institute and Jinghuiqu Management Bureau, and meteorological data (rainfall, temperature) were obtained from the five meteorological stations in Sanyuan, Jingyang, Fuping, Gaoling county, and the Lintong district (Table 2), covering the whole study area. Some of the data came from the statistical yearbook of the Shaanxi province and the Chinese scientific meteorological data sharing network. The meteorological data in this study were all annual data.
2.4. Data Pre-Analysis
2.4.1. Meteorological Data
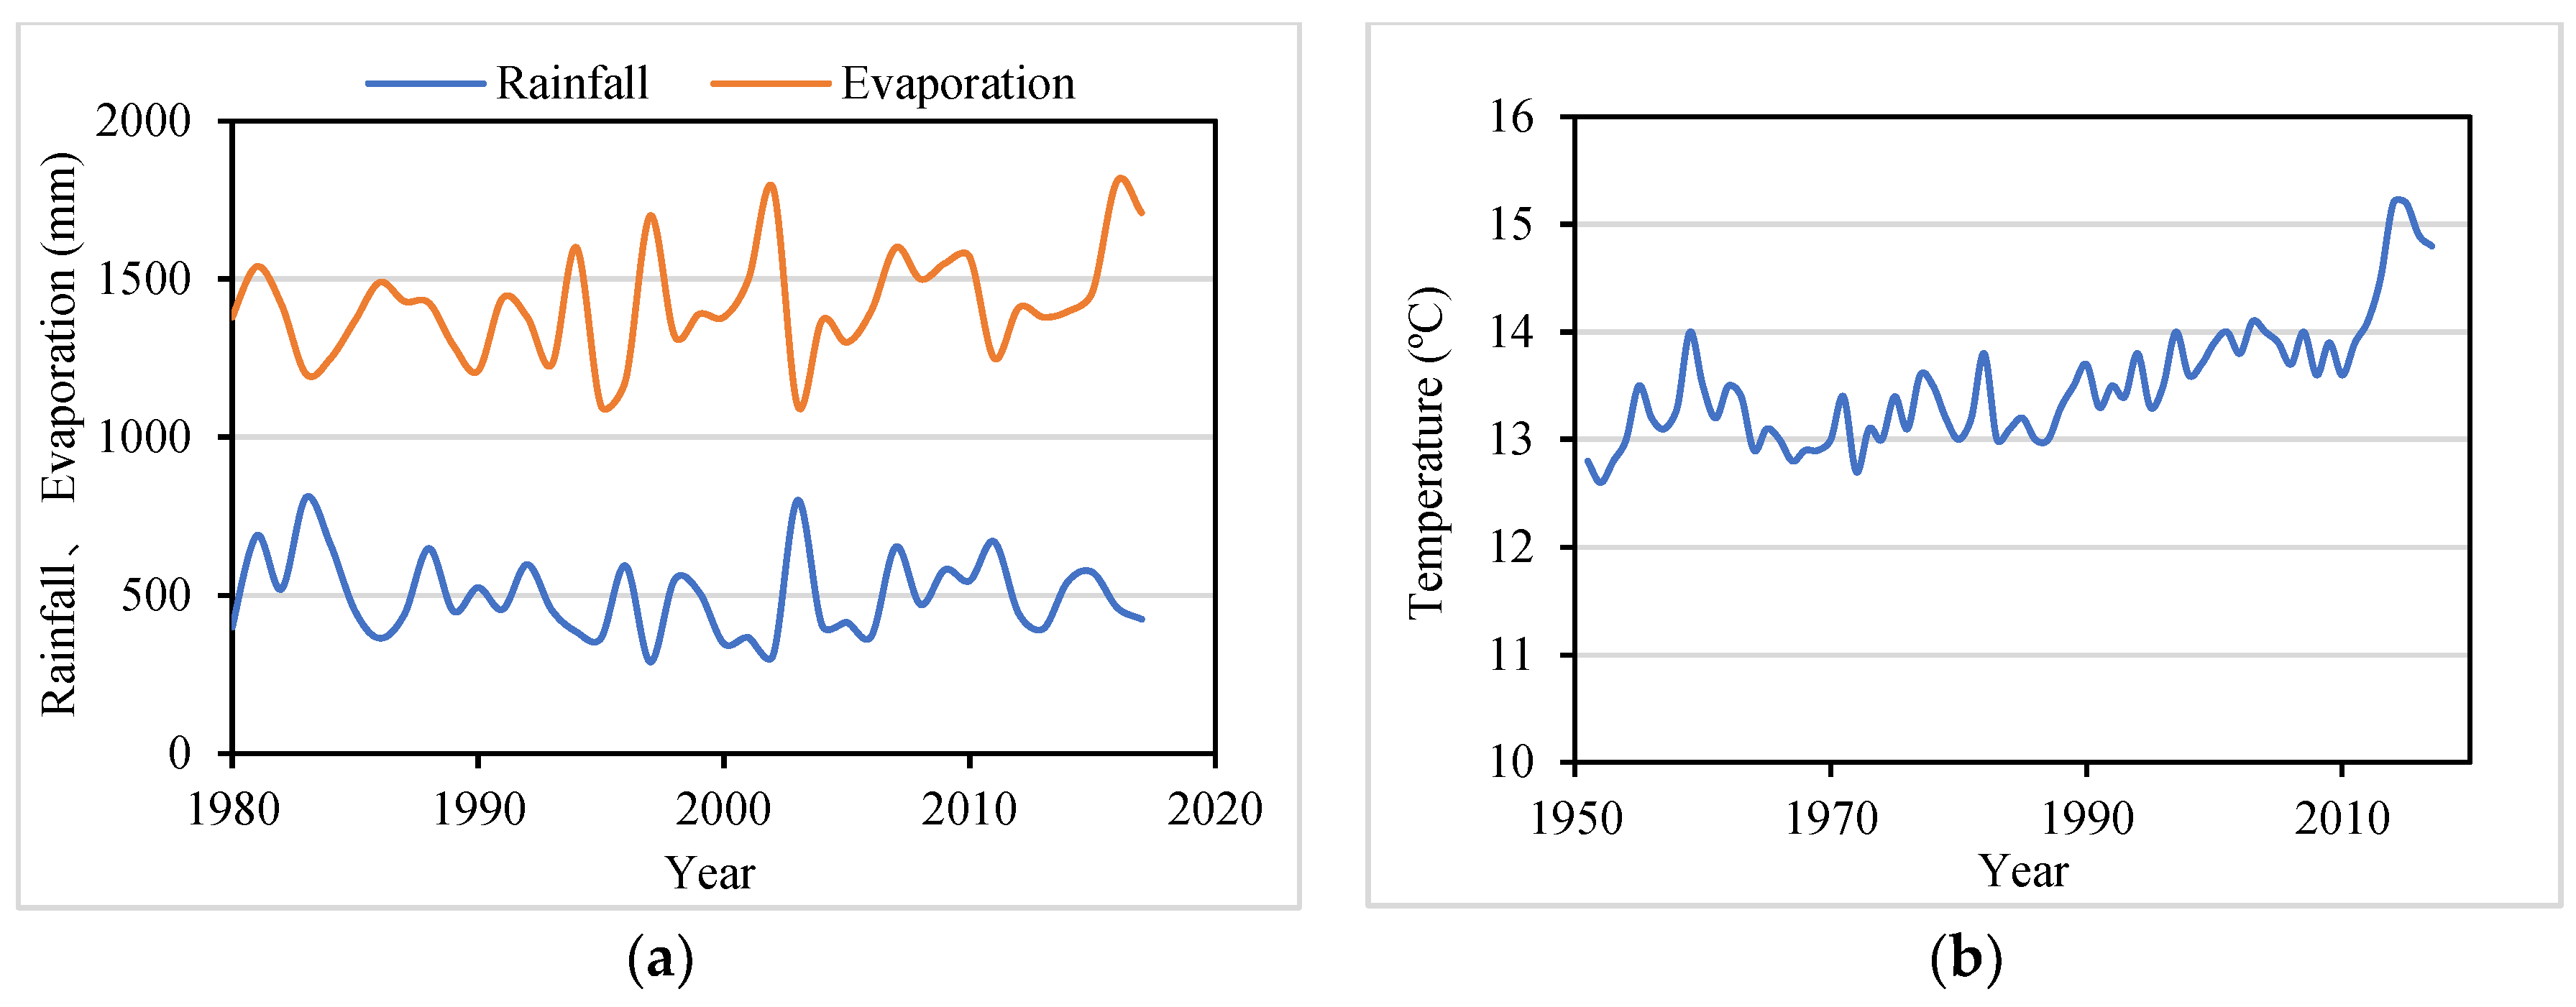
Meteorological data were integrated by Thiessen polygons, to obtain the annual rainfall, evaporation from the evaporating dish (E601) (1980–2017), and the annual temperature (1950–2017), as shown in Figure 2.
2.4.2. Climatic Phases Defined
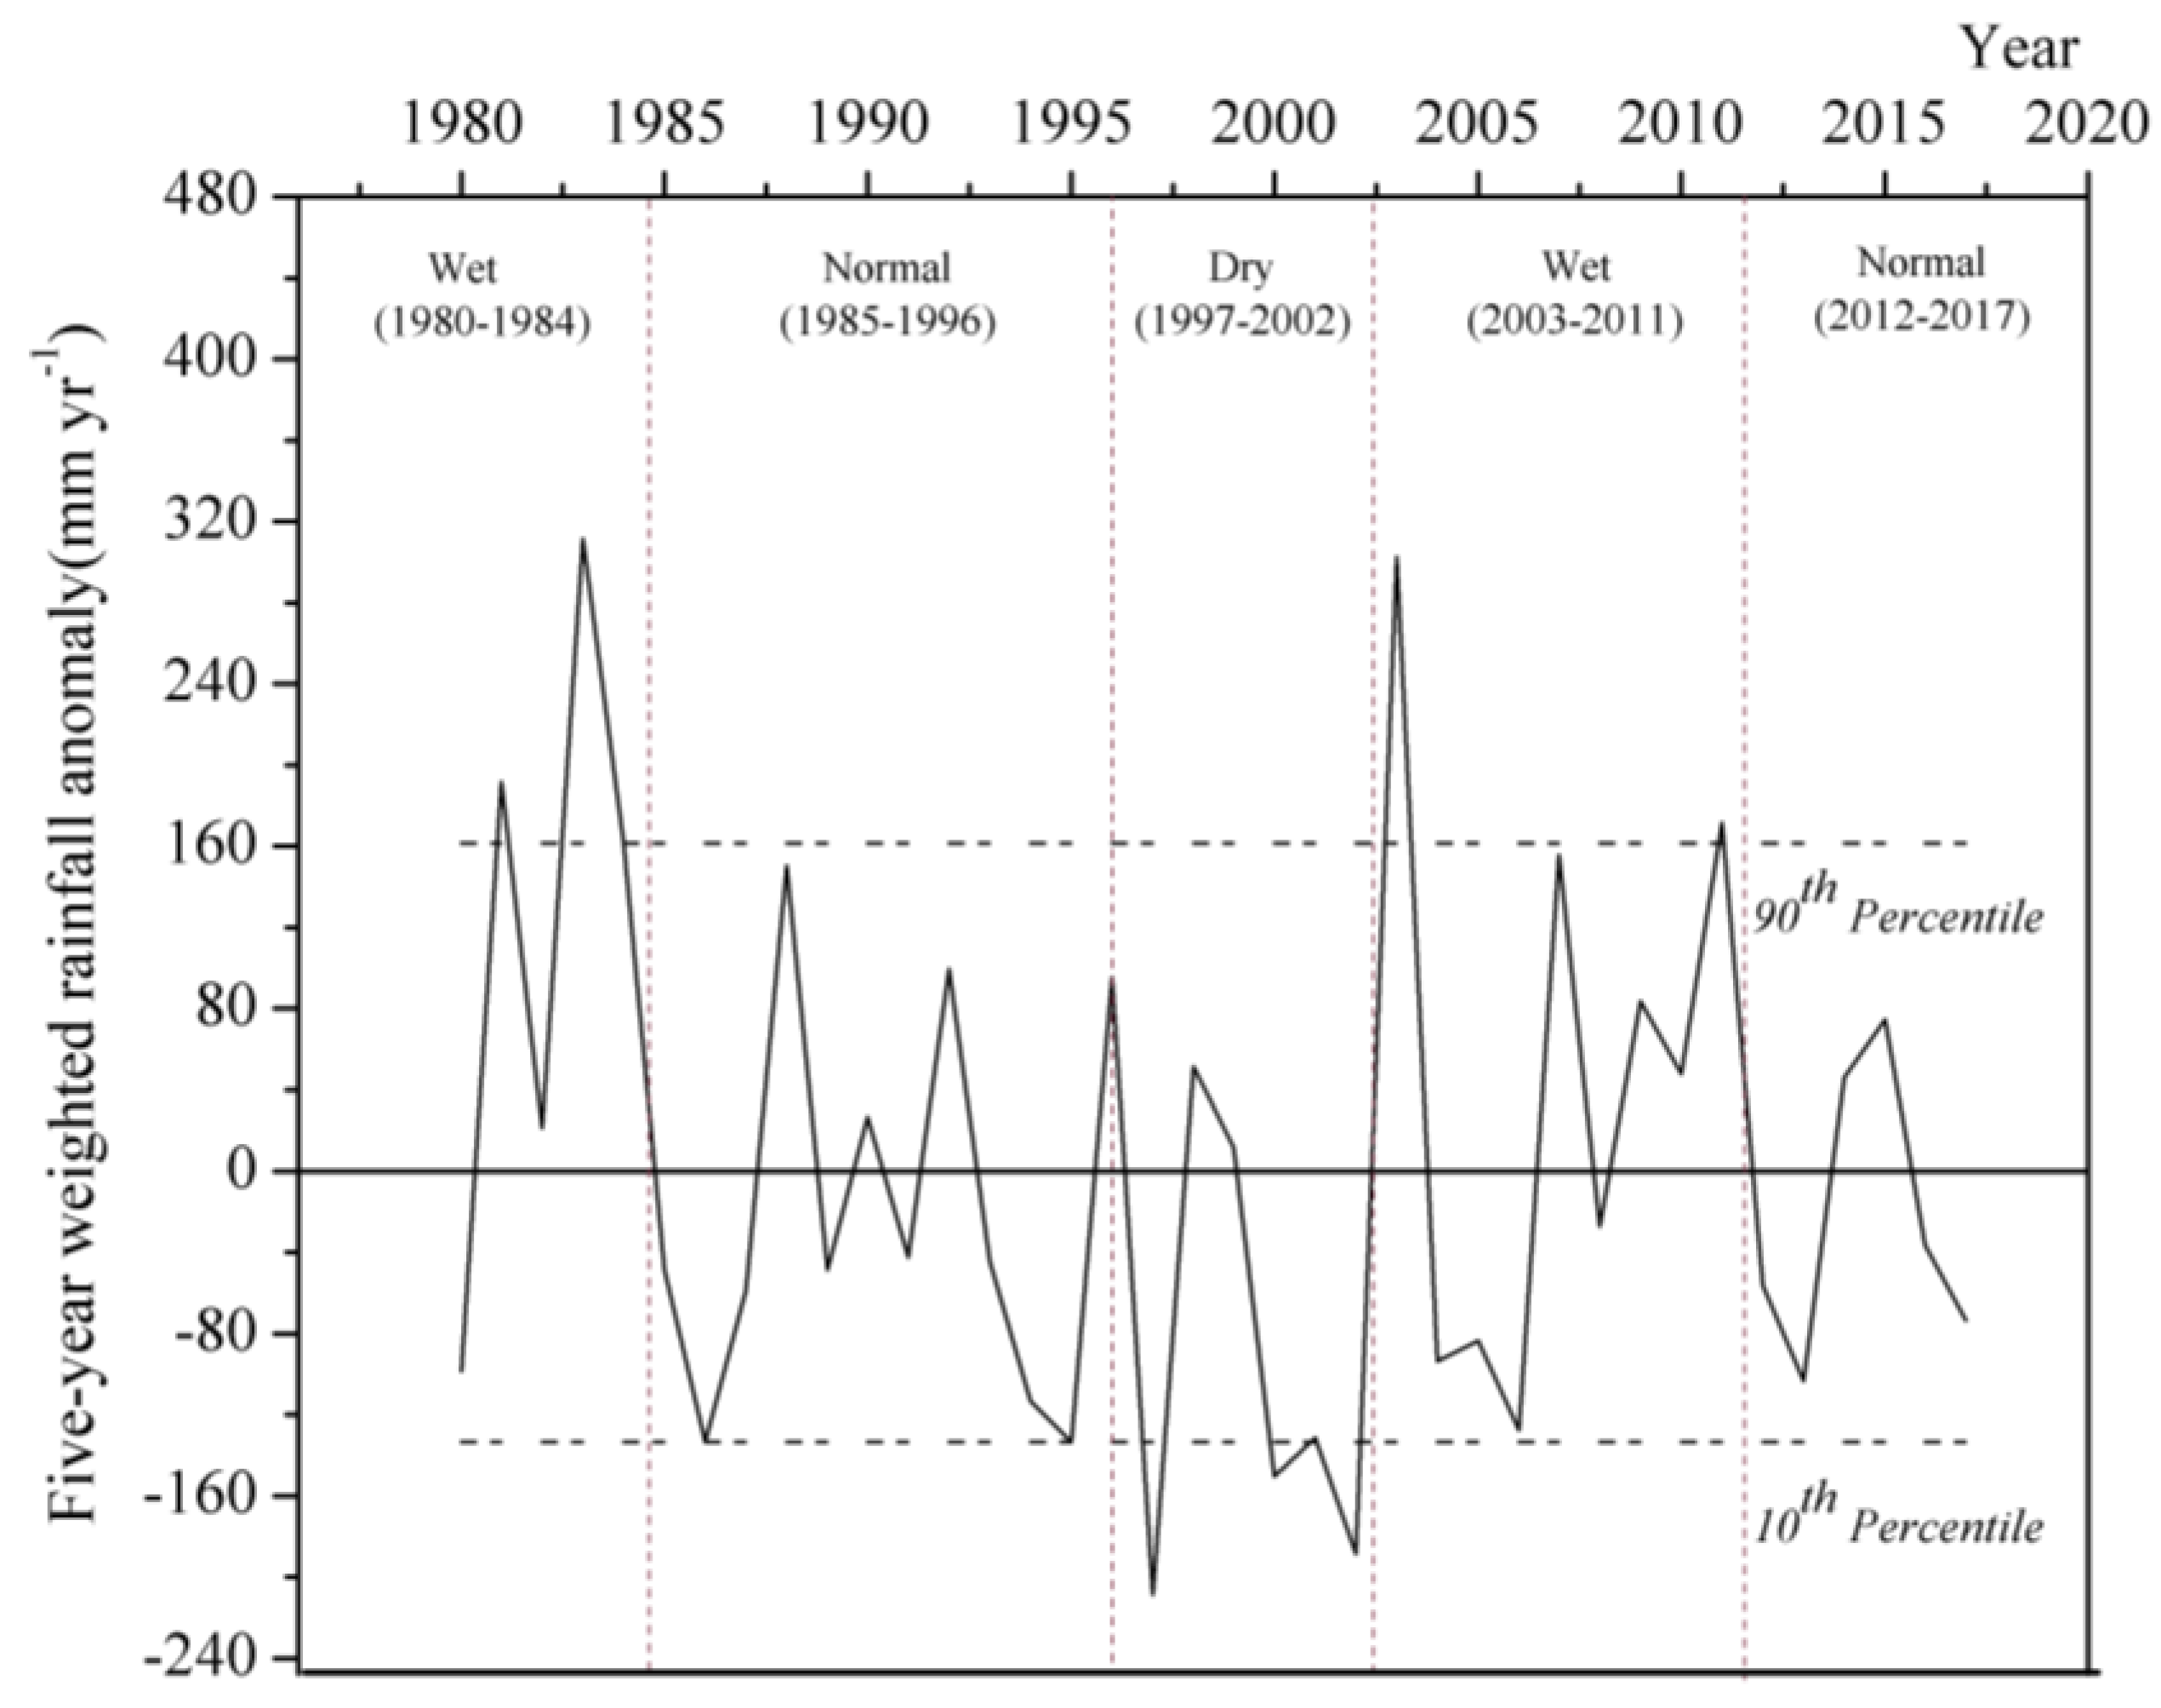
In this study, climate phases were defined on the basis of some extreme rainfall events. The dry phase was defined as rainfall anomaly in below the 10th percentile of the long-term 1980–2017 anomaly. Wet phase was defined as rainfall anomaly above the 90th percentile of the long-term 1980–2017 anomaly [46]. Normal phase referred to rainfall anomaly without extreme rainfall events. Climatic phases were divided into three climate types (wet, dry, and normal) and five climate phases (1980–1984, 1985–1996, 1997–2002, 2003–2011, and 2012–2017) (Figure 3).
3. Result
3.1. Climate Change and Abrupt Change Detection
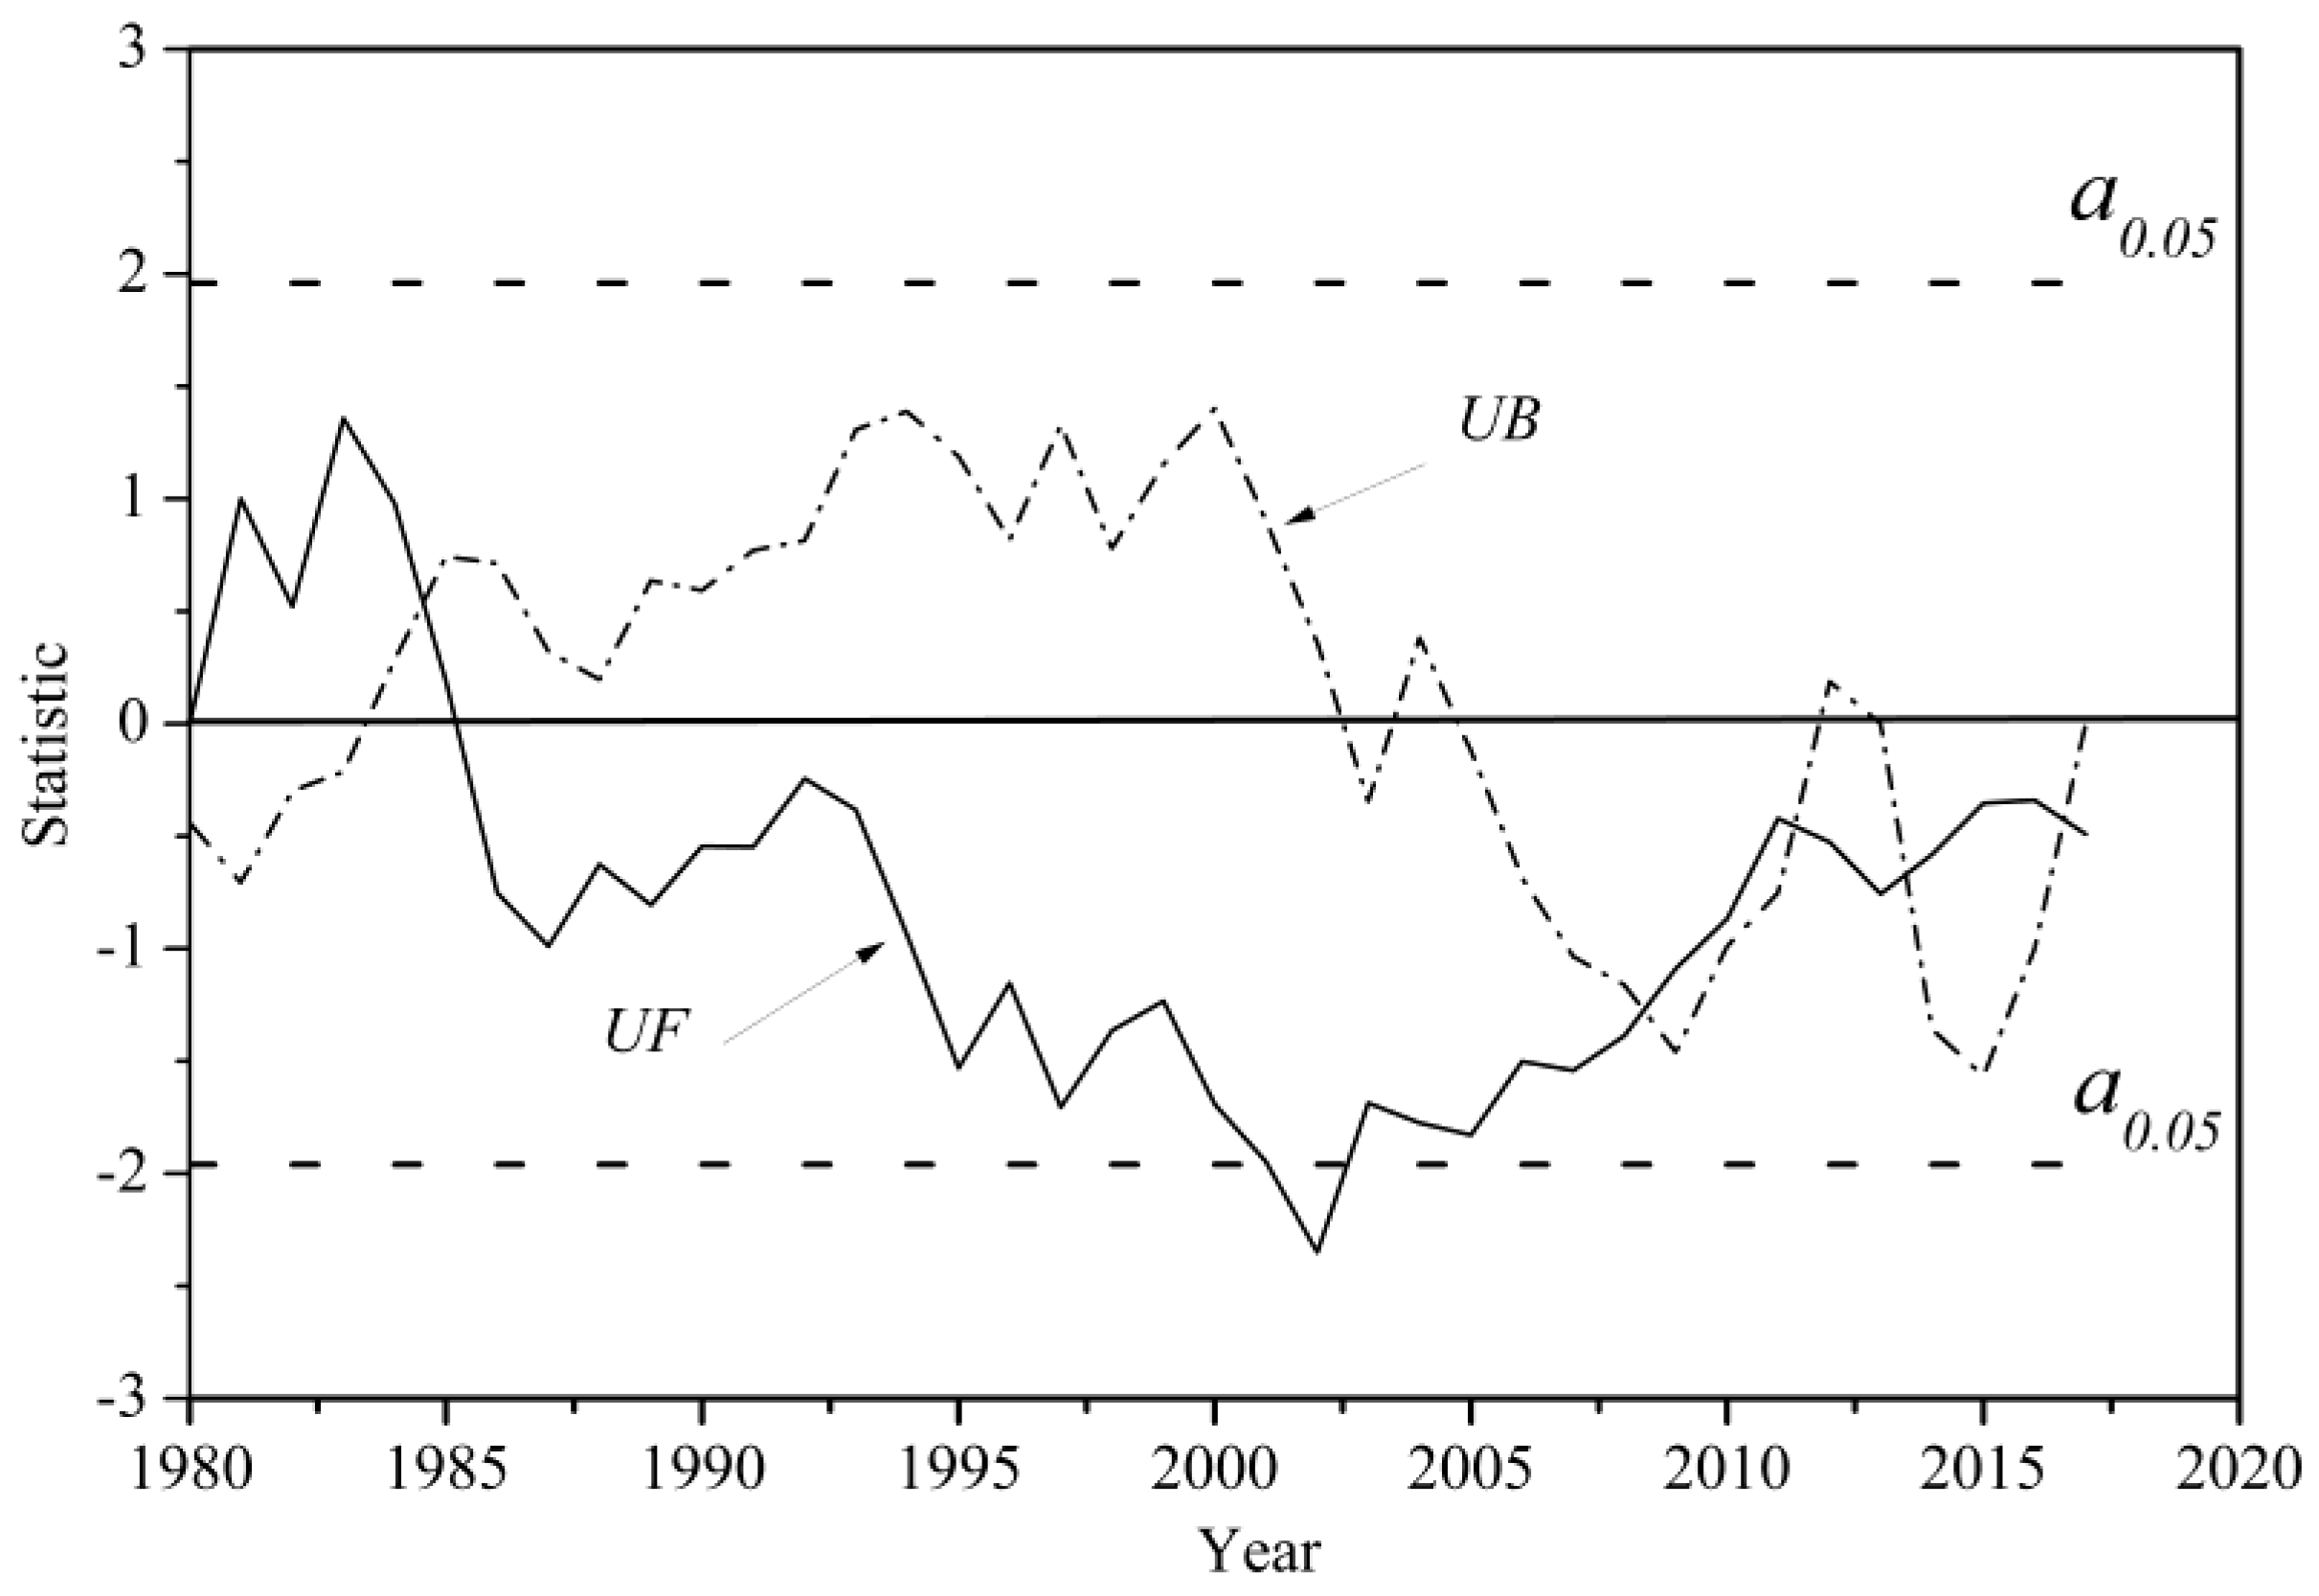
From 1980 to 2017, the rainfall decreased mildly with a Z value of −0.45, which had no significant trend. However, the declining trend was significant in some periods, especially between 2001 and 2003 (p < 0.05) (Figure 4). From the M–K abrupt change test, five abrupt rainfall change points were found in total, respectively, in 1985, 2008, 2010, 2012, and 2016. Finally, abrupt change points of rainfall were determined to be around 1984 and 2012, through sliding t-test for detection (p < 0.05). The rainfall changed from high to low, around 1984 and 2012. Moreover, the rainfall decreased significantly around 2002 (p < 0.05). The rainfall changes in the study area were better reflected.
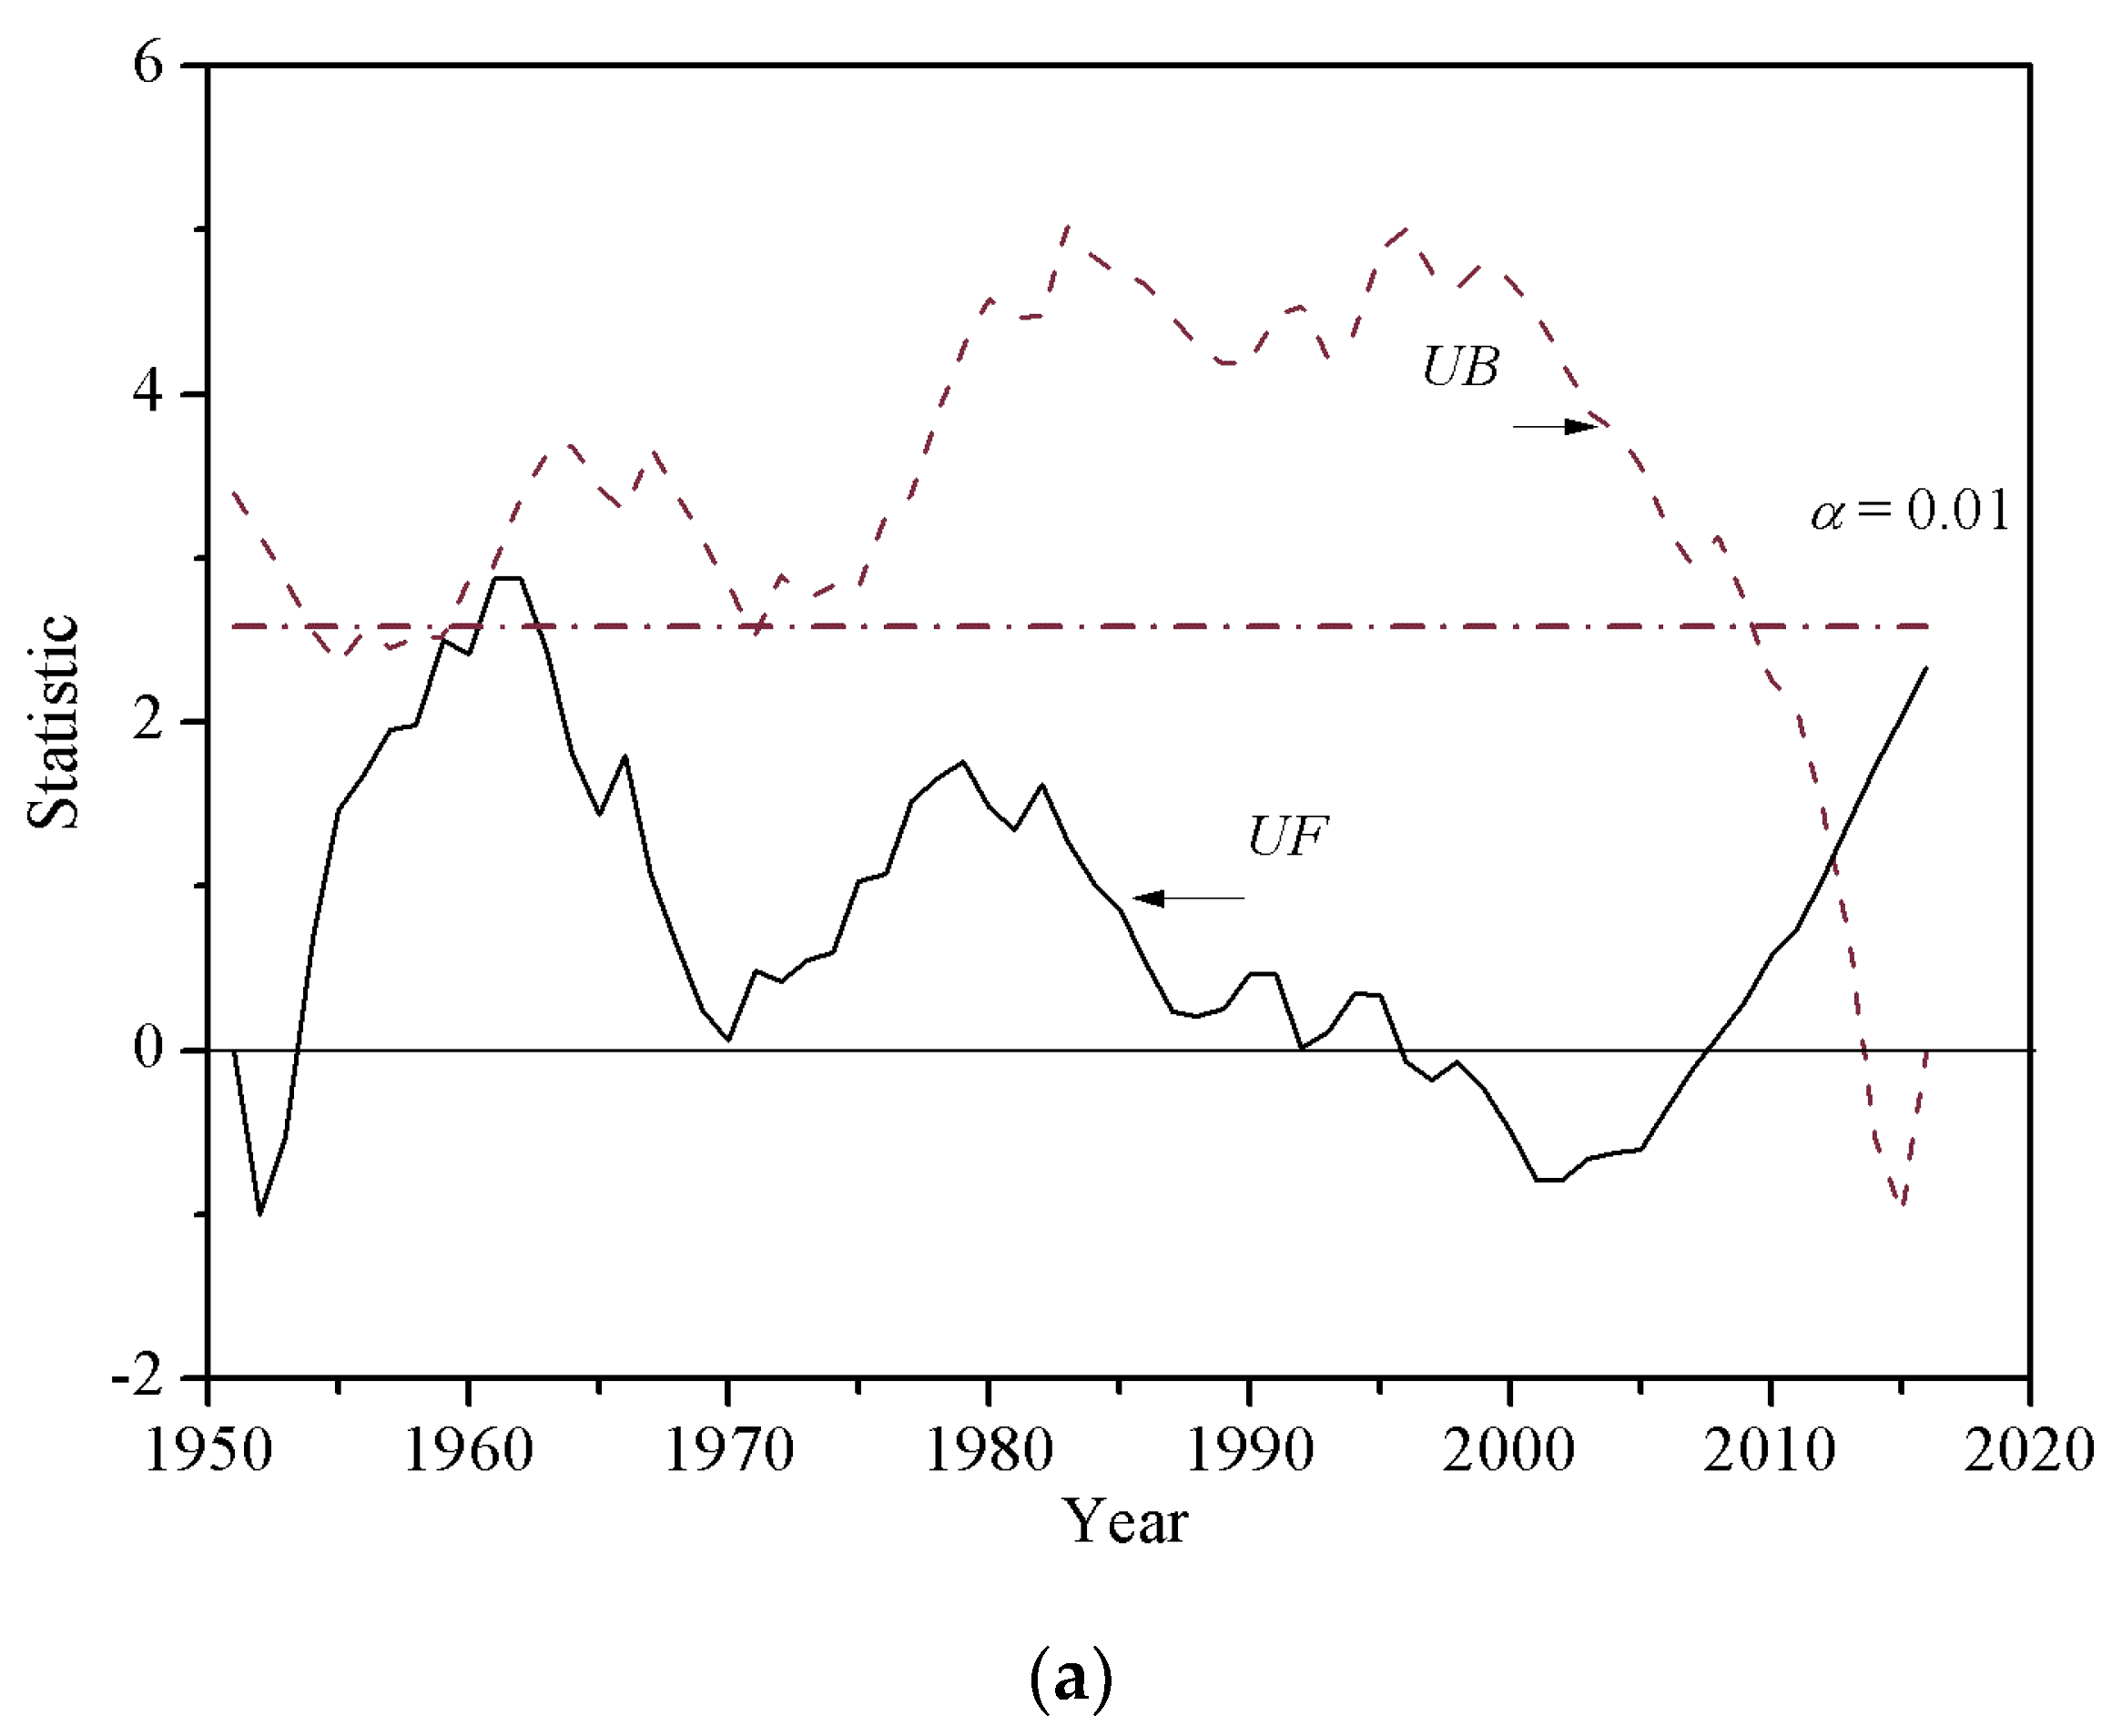
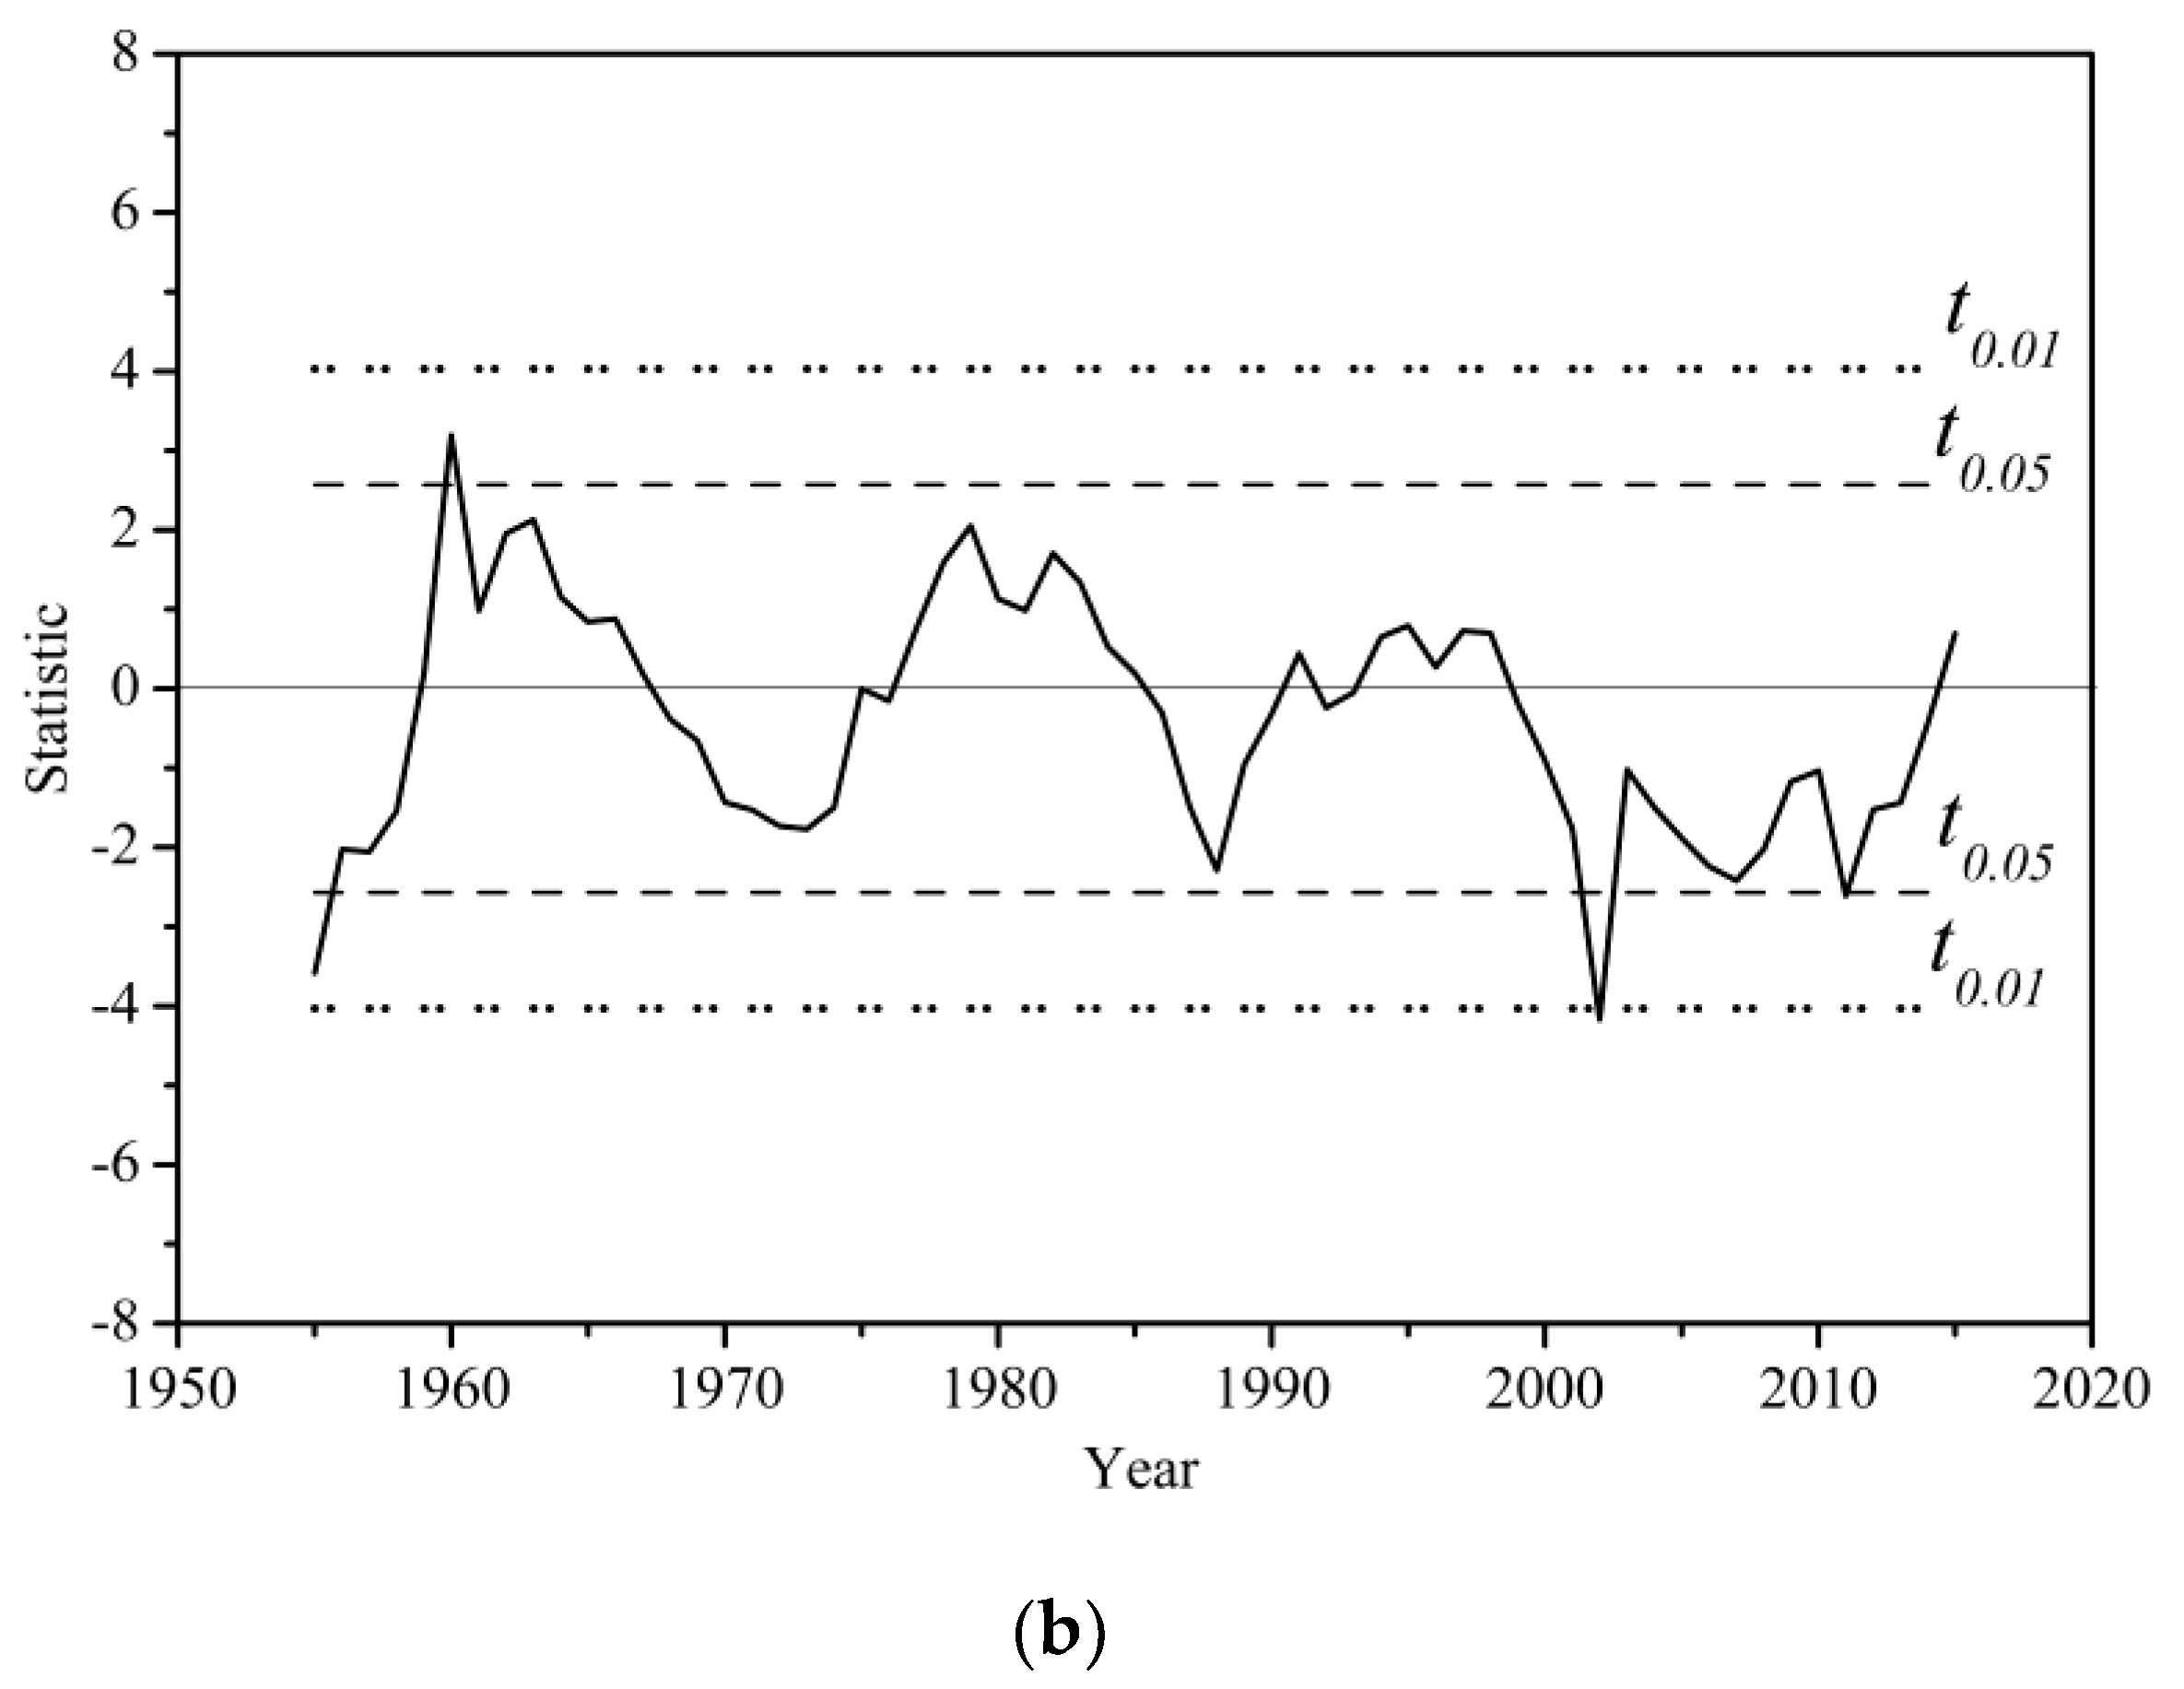
The temperature showed an extremely significant increasing trend with Z value of 2.86 (1950–2017), particularly between 1959 and 1960 (p < 0.01) (Figure 5a). However, there was a decreasing trend from 1995 to 2007 (UF < 0), then an increasing trend after 2007 (UF > 0). The trend increased significantly around 2012 (p < 0.05). The abrupt change points of temperature were also confirmed in 1959 and 2012, by the sliding t-test, which exhibited a significant increasing trend (p < 0.05) (Figure 5b). The temperature changes were also well-reflected.
3.2. Variation Trend of Groundwater Levels in Distinct Climatic Phases
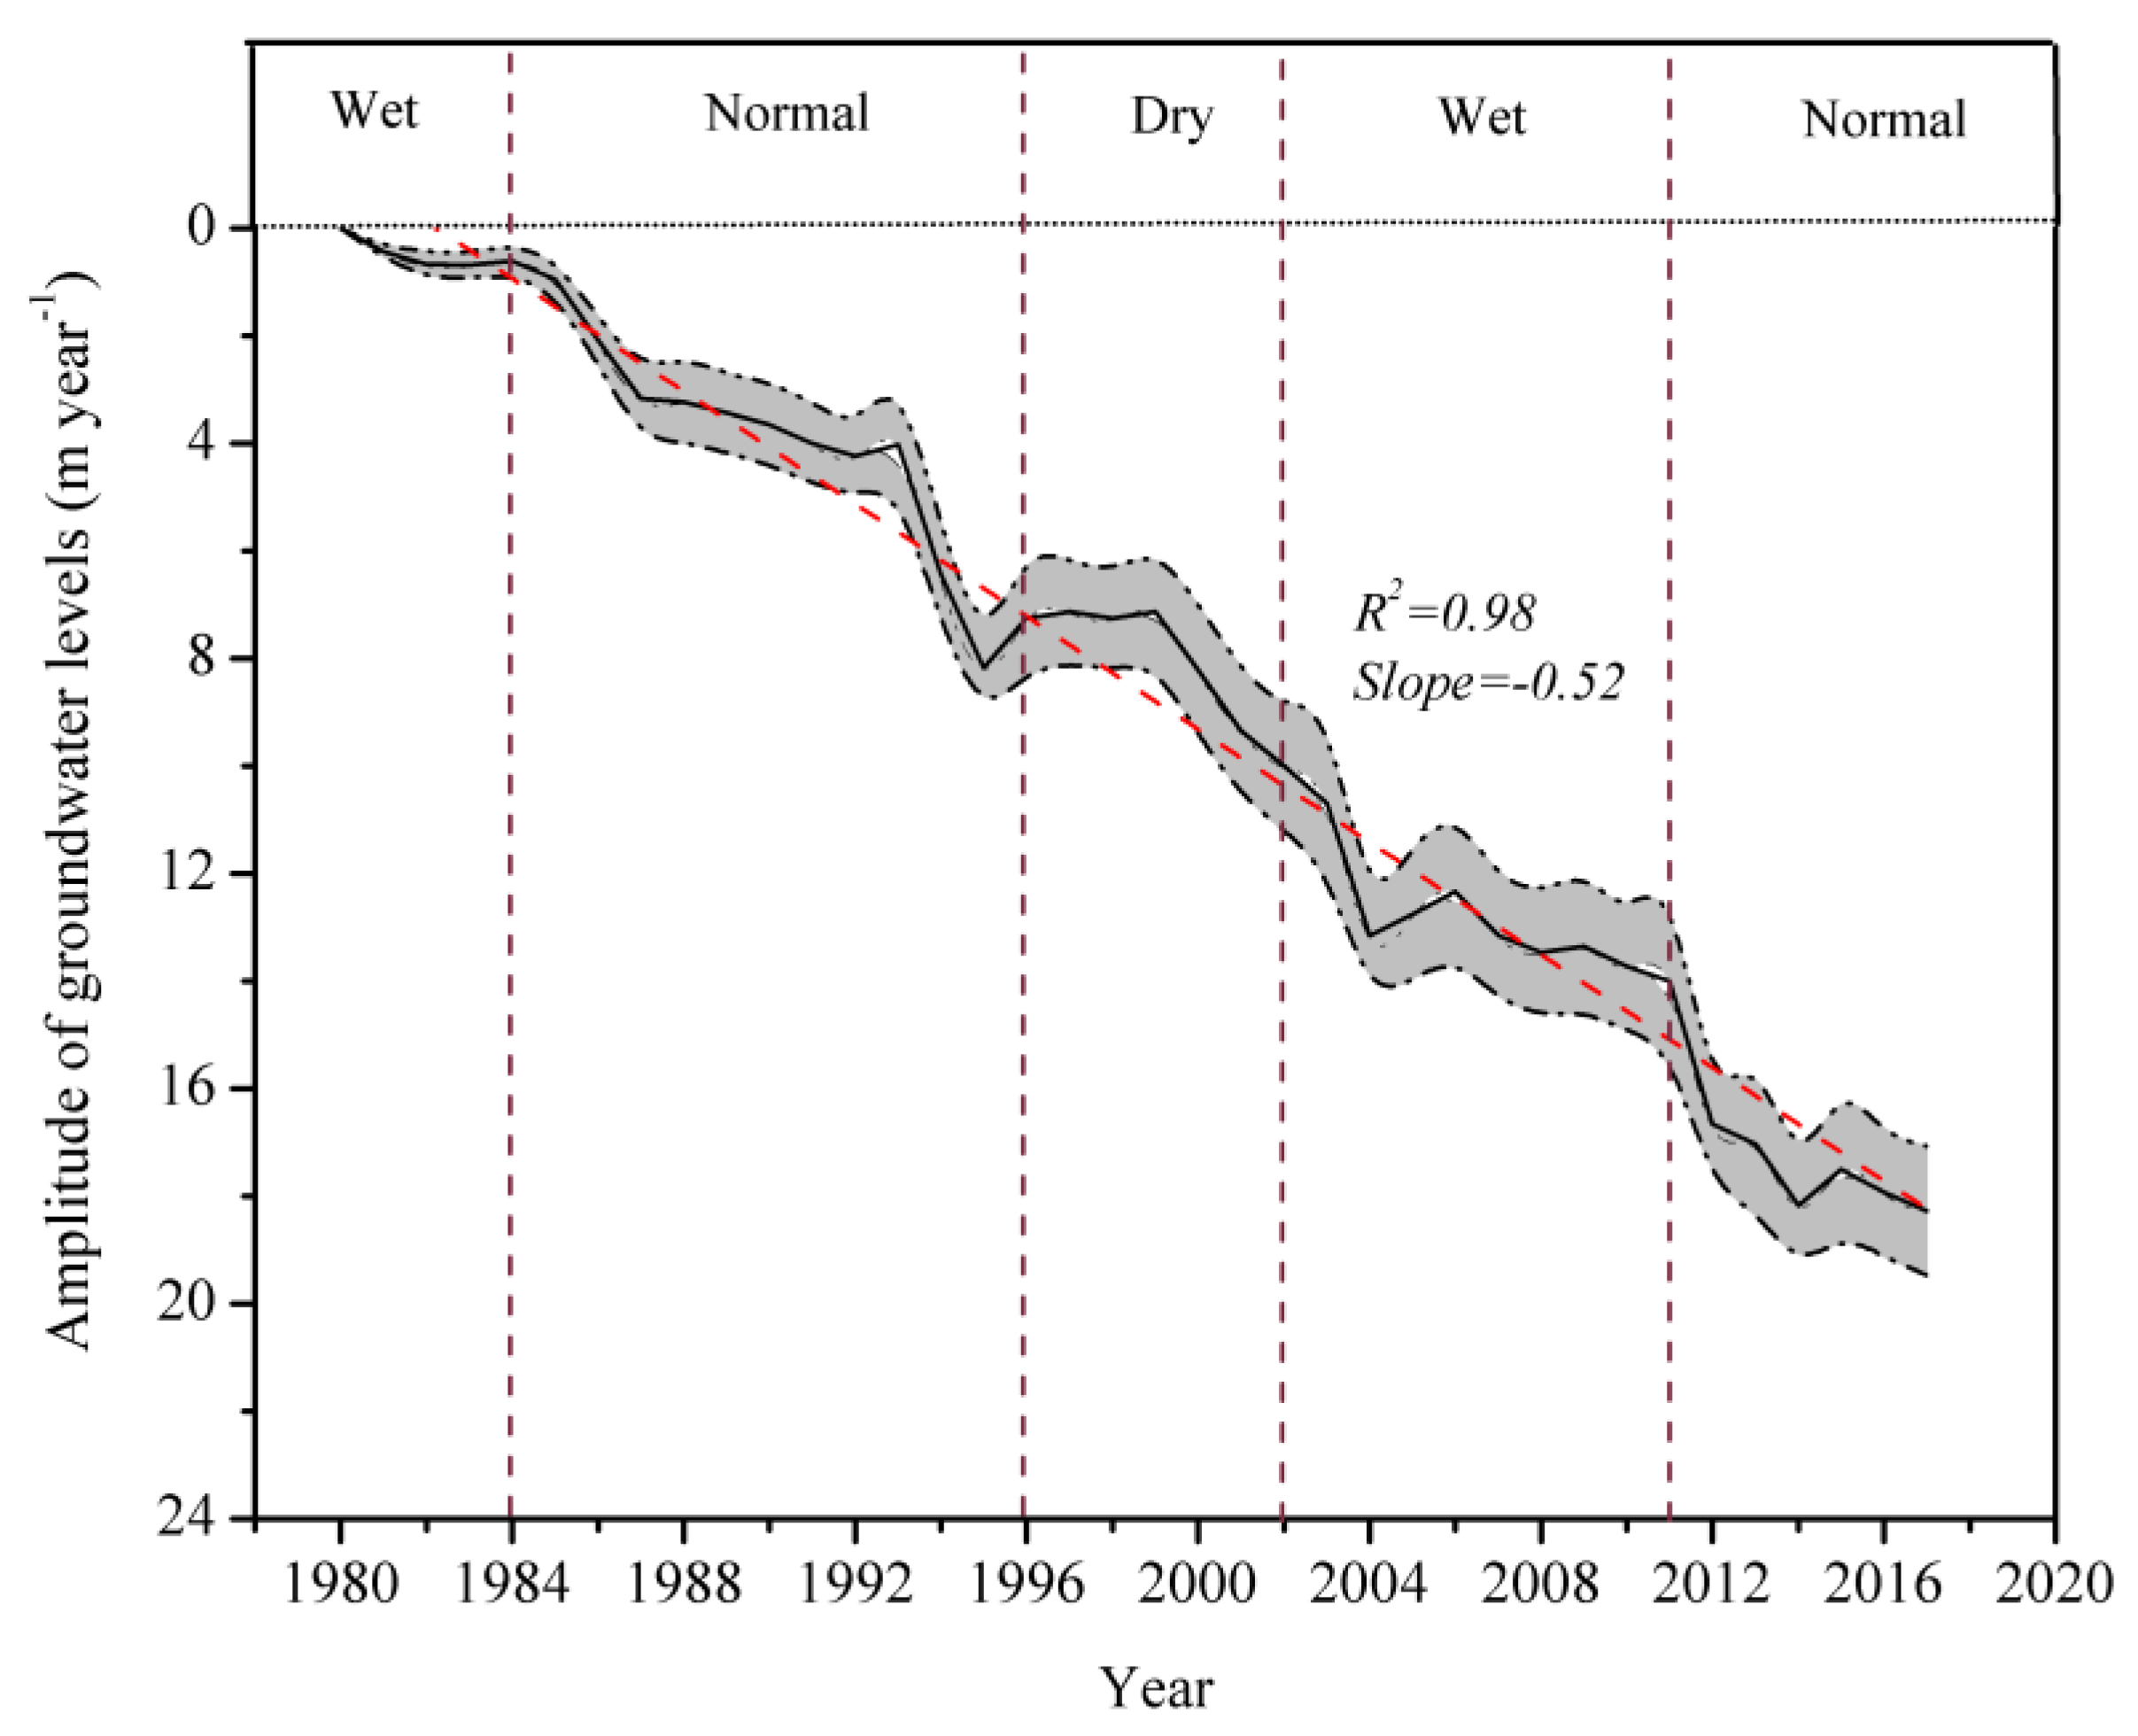
Overall, the declining groundwater level was significant in the study period (p < 0.05) (Figure 6). In the alternating climate phases (wet, dry, and normal), the groundwater levels exhibited different responses to the climate variables. In the dry phase, the MWS (60%) manifested a significant declining trend (p < 0.05), showed a rising trend (13%), and showed a relatively stable trend (27%). However, in the wet phases, compared with dry, the MWS (41%) showed a declining trend, an increasing trend of 27%, and a stable trend of 32%. In the normal phases, the MWS (55%) exhibited a significant declining trend, showed an upward trend (10%), and a stable trend of 35% (Table 3).
The groundwater levels were obviously affected by climate change. In the wet phase (1980–1984), the MWS (40%) showed a modestly declining trend with an average of 0.15 m/year, and showed no significant decline (60%). In the normal phase (1985–1996), the MWS (53%) showed significant declining groundwater levels, with an average of 0.54 m/year. The MWS (76%) showed declining groundwater levels with an average of 1.02 m/year (p < 0.05) (1992–1996). In the dry phase (1997–2002), including a significant rainfall decreasing event around 2002 (p < 0.05), the MWS (60%) showed that the groundwater levels declined by 0.62 m/year, and exhibited an increasing trend (13%). In the wet phase (2003–2011), the MWS (42%) exhibited a significant declining trend. However, it was noted that the MWS (51%) exhibited rising groundwater levels between 2004 and 2005. In the normal phase (2012–2017), the MWS (58%) showed a significant declining trend (p < 0.05), with an average of 0.69 m/year. The magnitude reached to 1.52 m/year around 2012 (rainfall decreasing abrupt). Moreover, the temperature showed a significant increase (p < 0.05) around 2012, which exhibited extreme climate events may be an important signal indicating the change of groundwater levels.
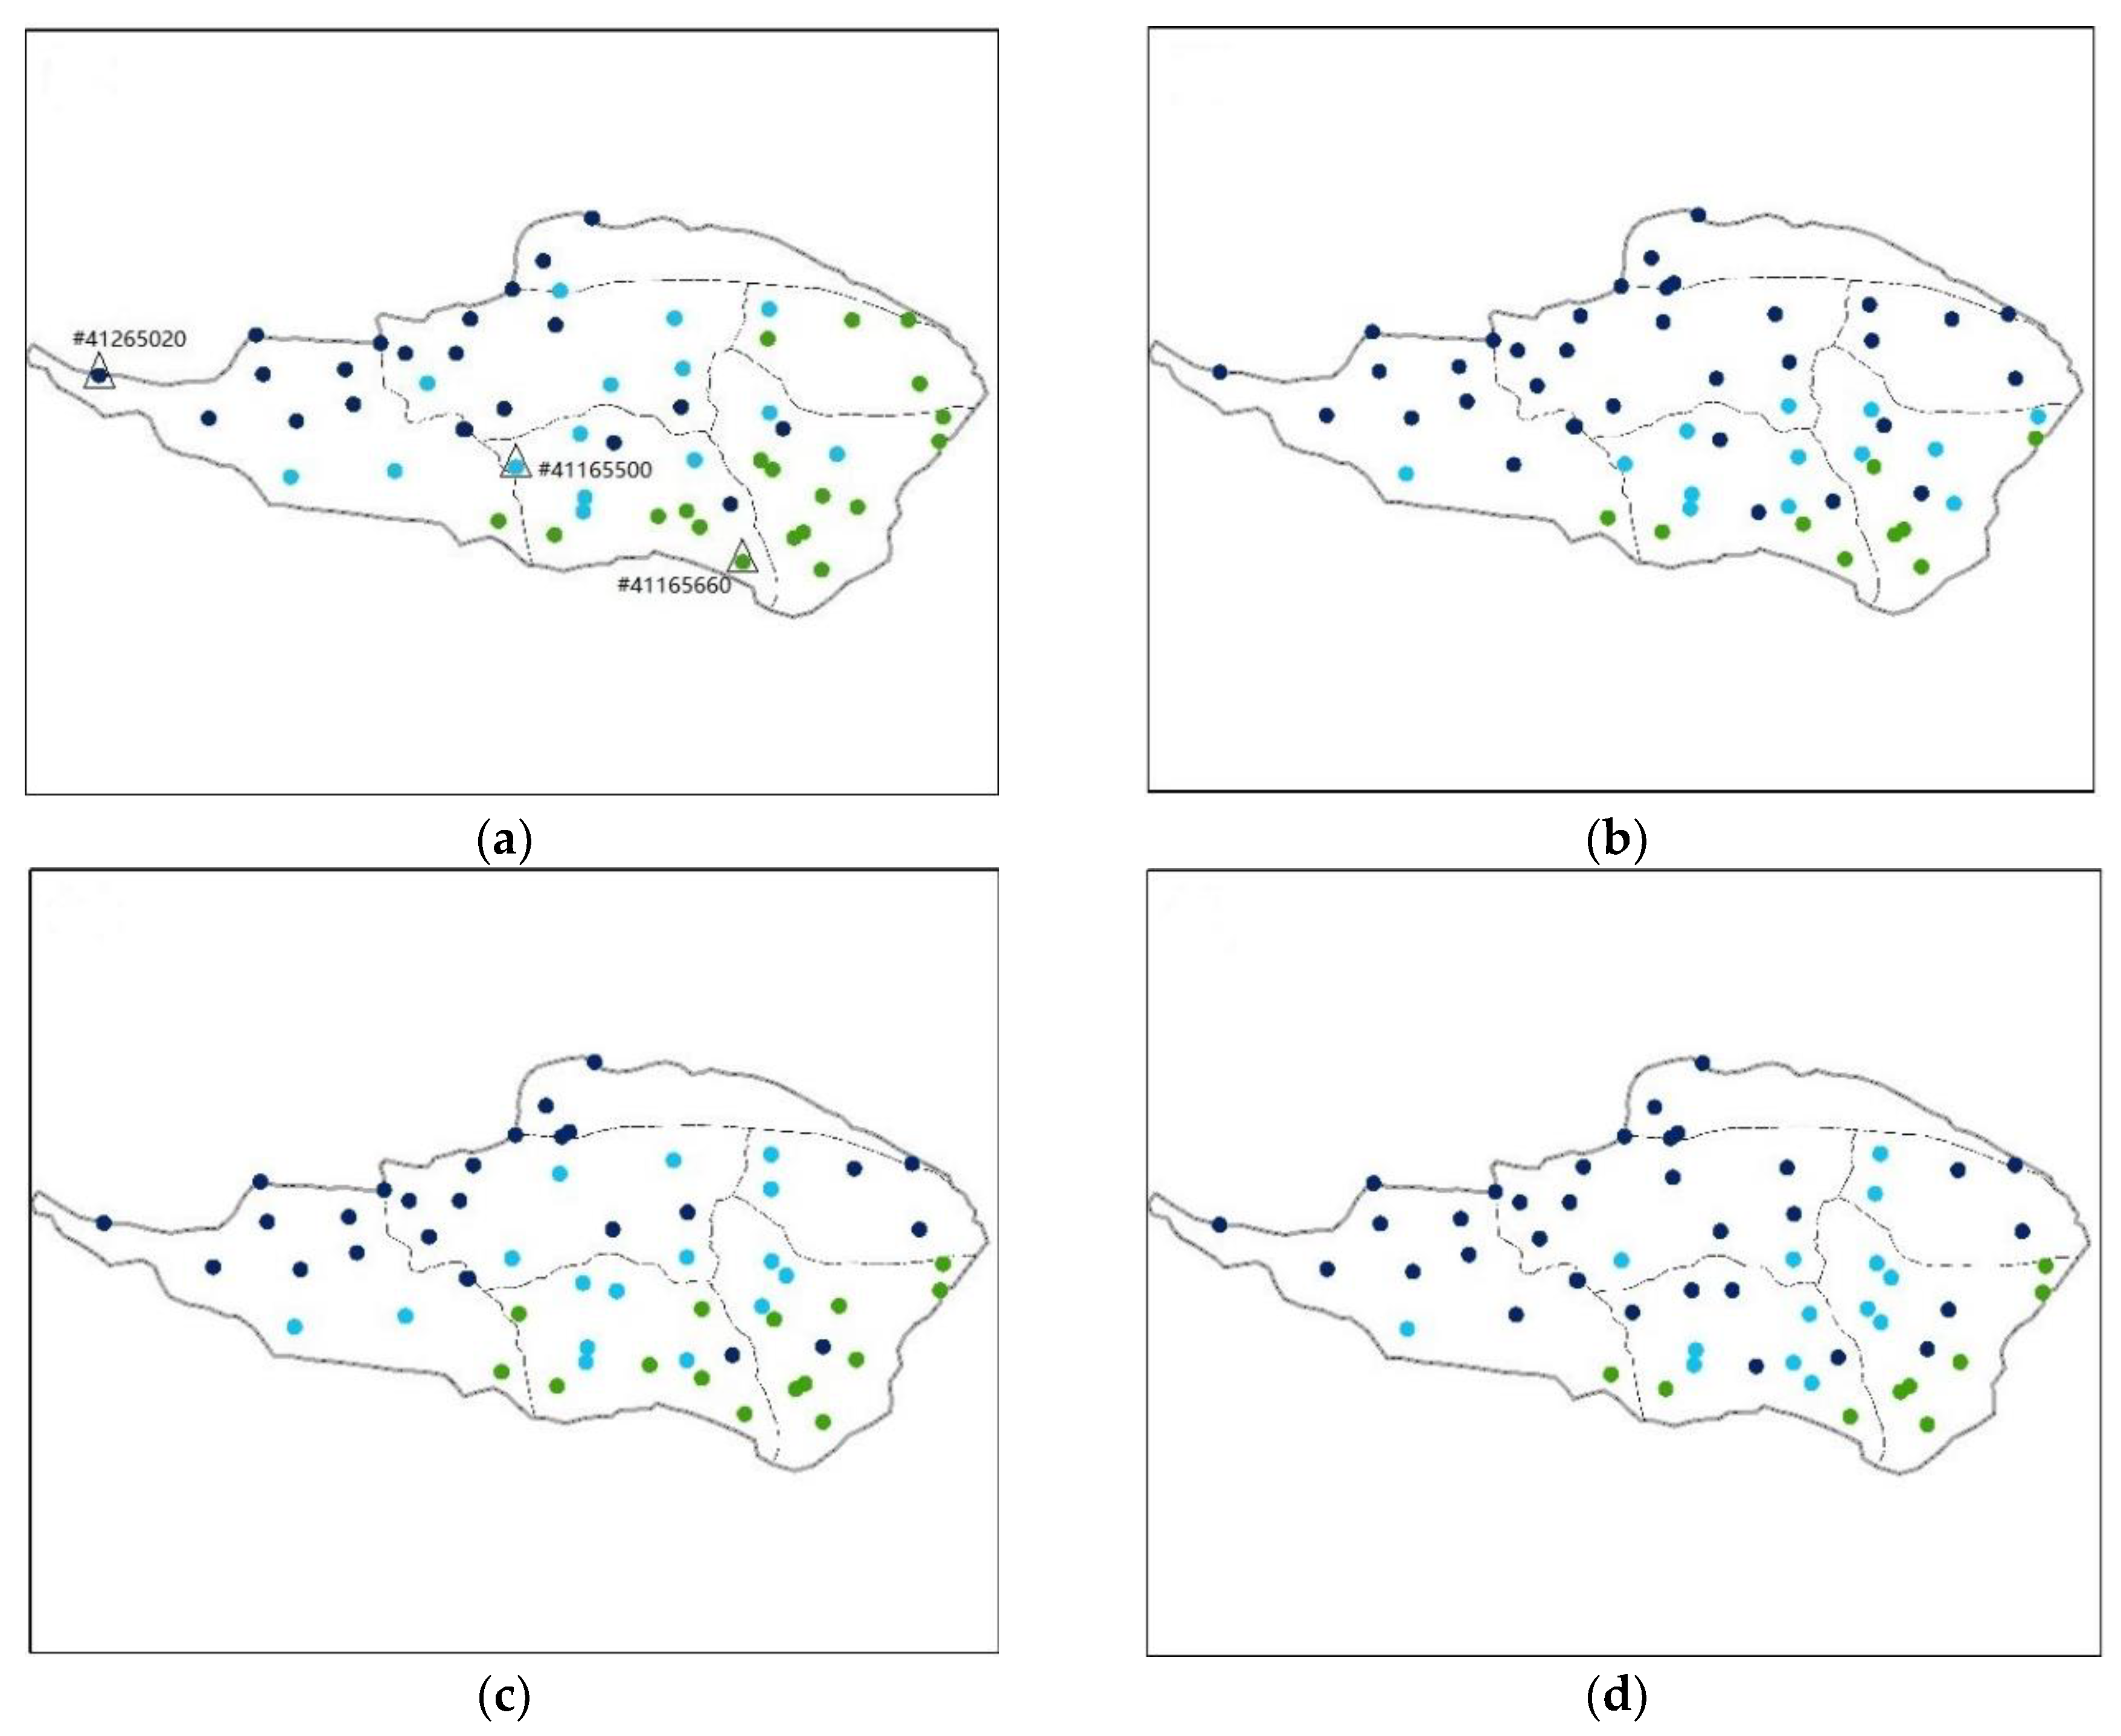
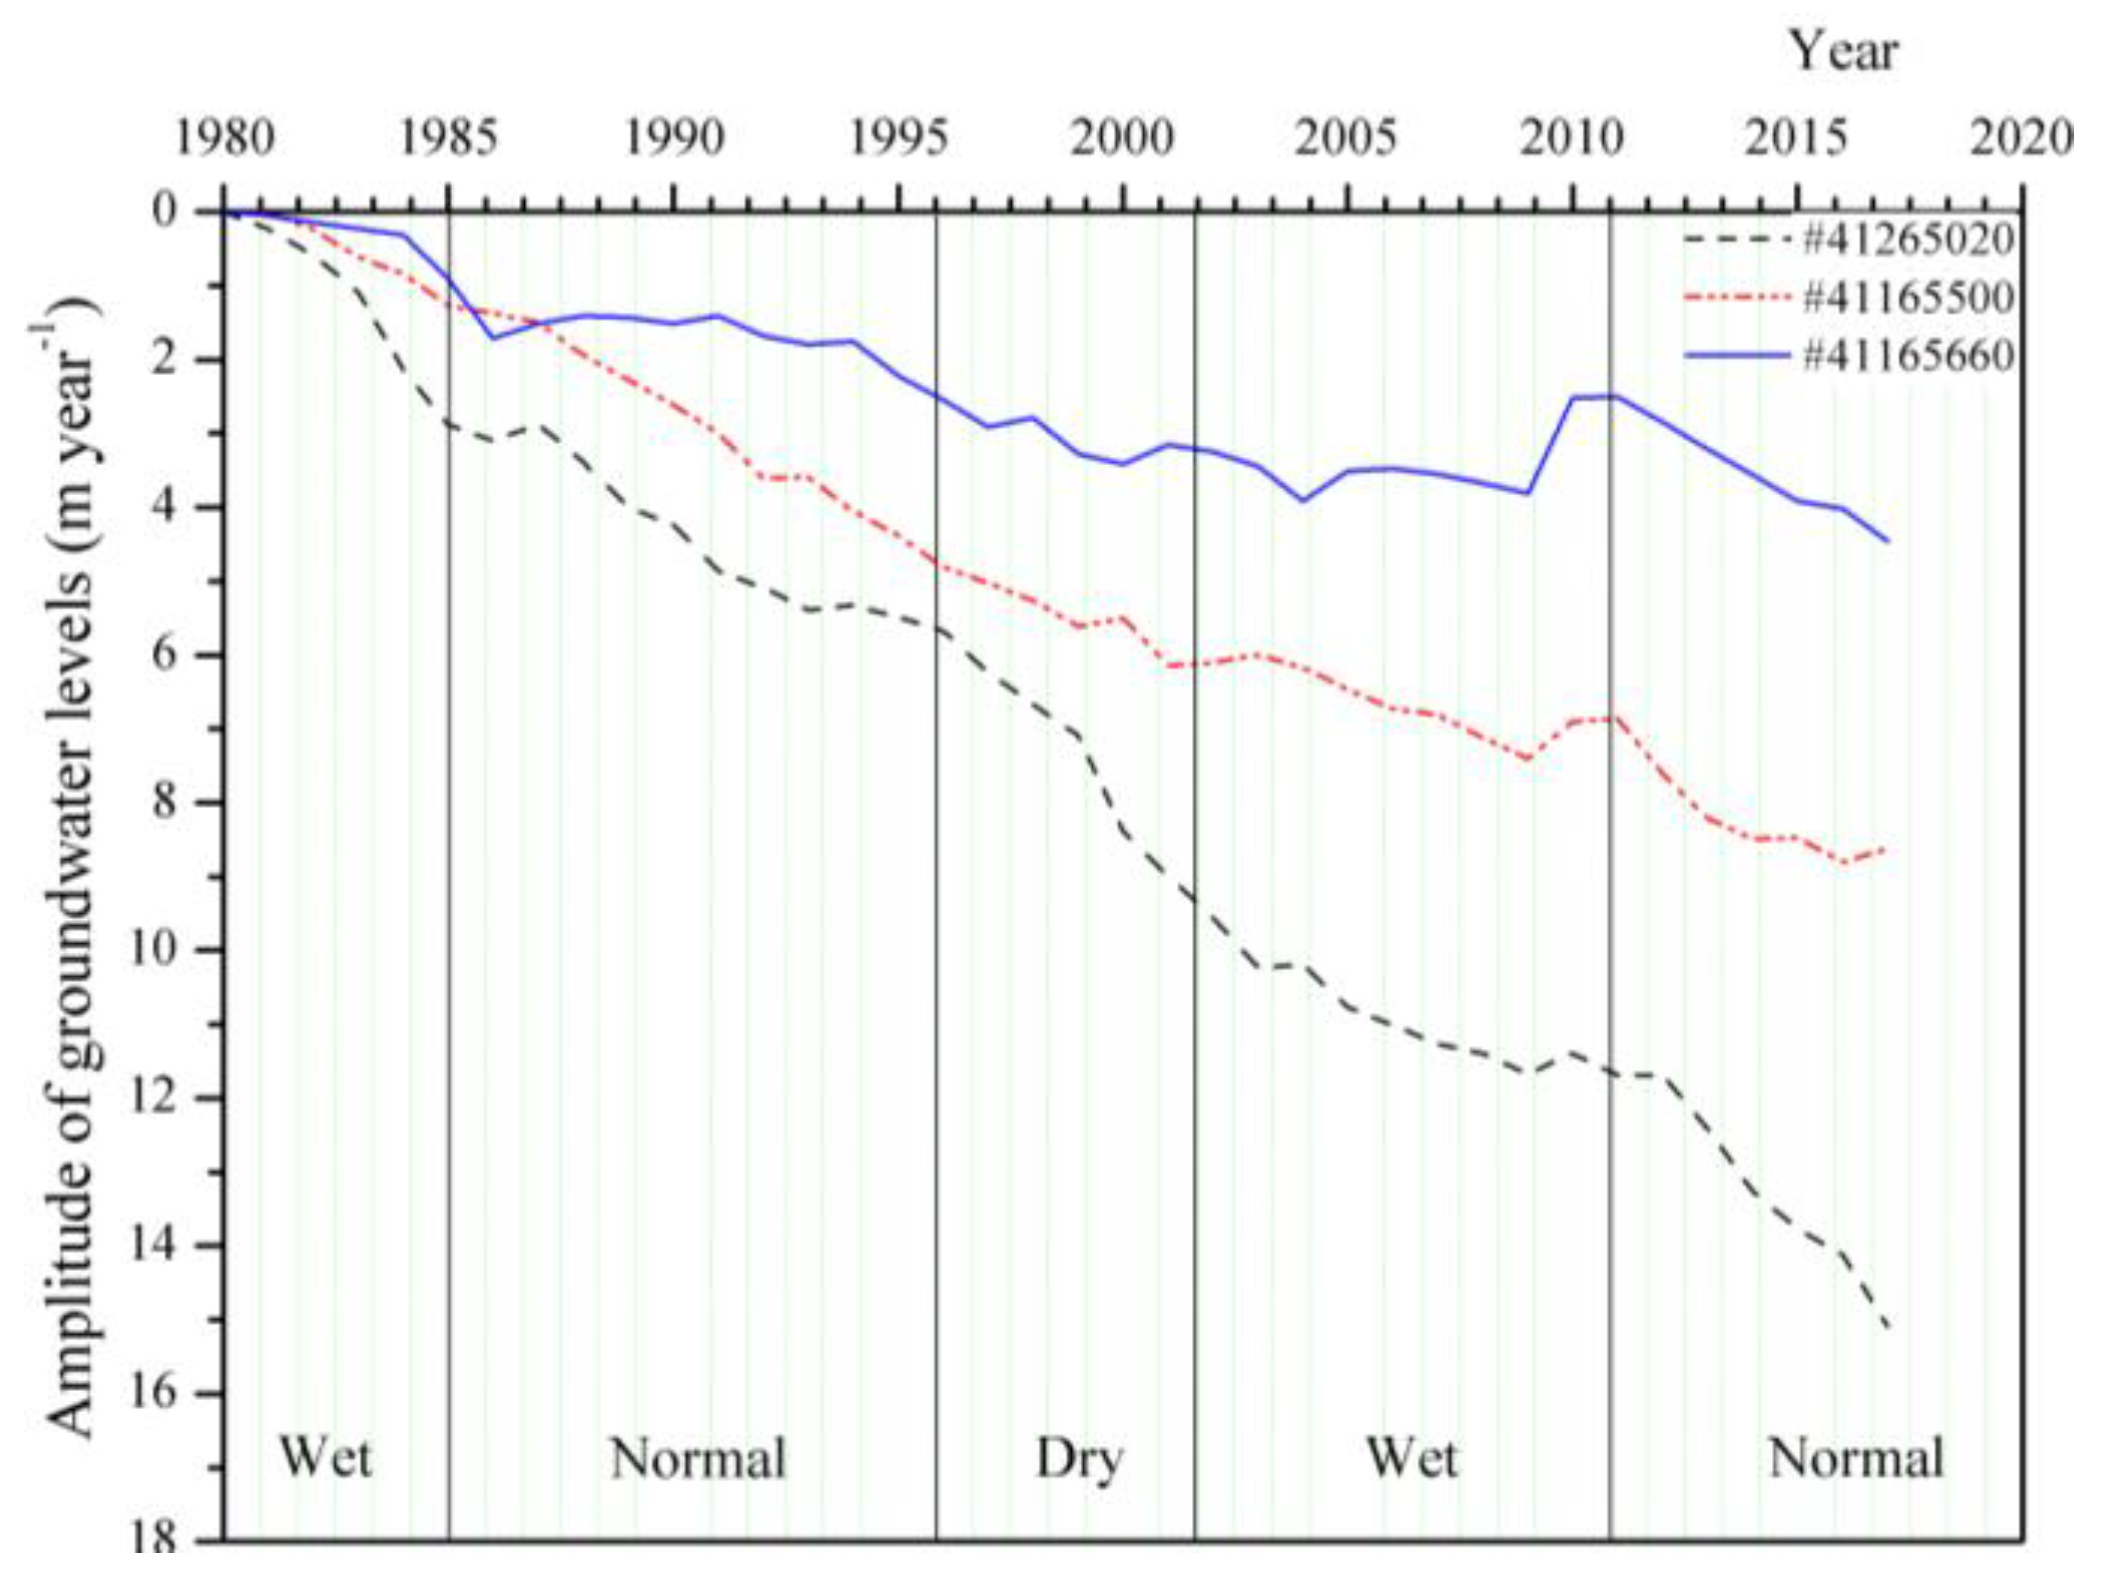
Furthermore, the variation of groundwater levels varied in different regions and climate phases. The MWS exhibiting significantly declining trend were mainly distributed in the west and northwest of the study area (Jingyang county and Sanyuan county), and the MWS without significantly declining trend were mainly distributed in the southeast (Lintong south and Gaoling southeast), as shown in Figure 7. The typical MWS in different regions showed the variability of groundwater responses across the 1980–2017 period (Figure 8).
In the wet phase (1980–1984), the MWS with a modestly declining trend were mainly distributed in Sanyuan and Jingyang counties in the northwest of the study area, and the MWS with no significant decline were mainly distributed in the middle area i.e., Gaoling county and southeast area i.e., Lintong district. In the normal and dry phase (1985–1996, 1997–2002), the MWS with significant declining trend were mainly distributed in Jingyang, Sanyuan and Gaoling counties. The MWS with significant declining trend were mainly located in Jingyang and Sanyuan counties from 1992 to 1996. In the wet phase (2003–2011), the MWS with significant declining trend were mainly clustered in the northwest of Sanyuan county and the north of Jingyang county. In the normal phase (2012–2017), the MWS exhibiting a significant declining trend were mainly clustered in Jingyang county.
3.3. The Influence of Groundwater Extraction and the Well–Canal Ratio Factors on Groundwater Levels in Distinct Climate Phases
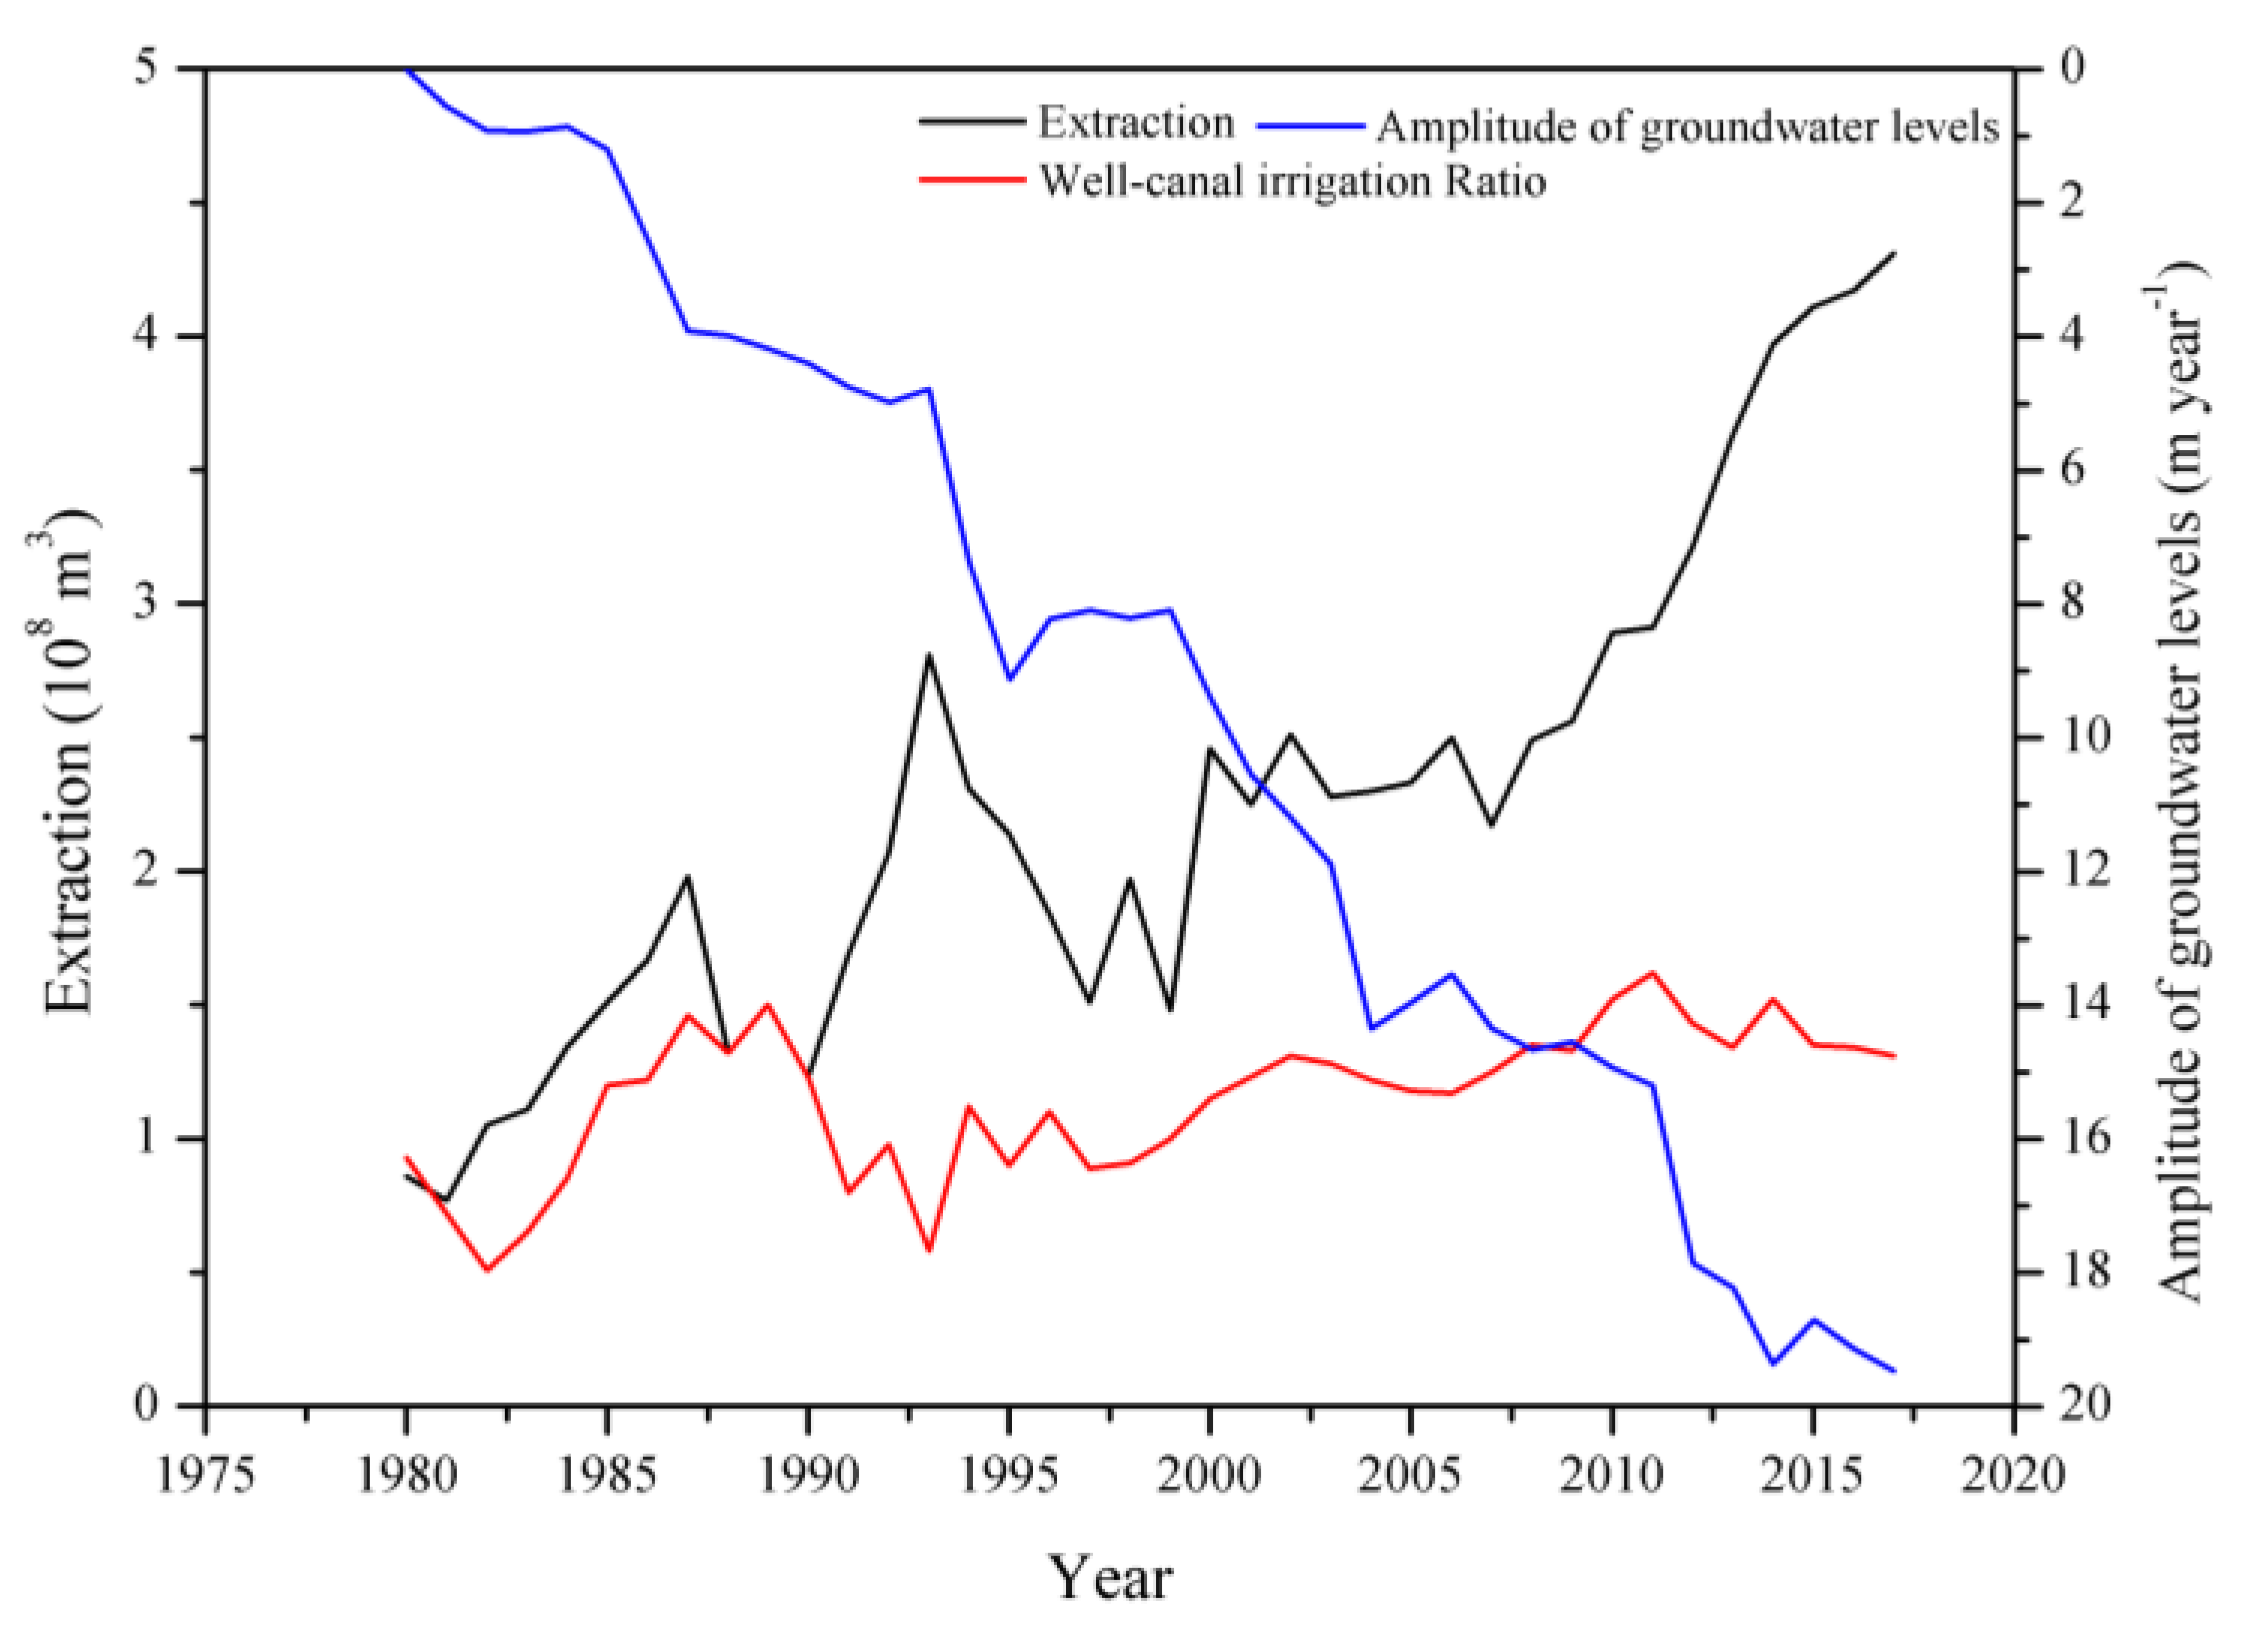
A sensitive response of groundwater levels was demonstrated to the groundwater extraction. With the increase of groundwater extraction, the groundwater levels decreased, as in Figure 9. The groundwater extraction was affected by extreme rainfall events. Rainfall around 2002 decreased significantly (p < 0.05), as in Figure 3, but the groundwater extraction showed a higher level. The corresponding groundwater levels exhibited significant decline, accordingly, as shown in Figure 6. In the wet period (1980–1984), the groundwater depth in most of the study area was around 3 m, and the groundwater extraction was kept at a lower level. In the normal period (1985–1996), the groundwater extraction and the ratio of the well–canal irrigation fluctuated significantly, affected by management policy and rainfall, which then further affected the change of groundwater levels. In the dry period (1997–2002), the ratio of the well–canal irrigation showed an increasing trend, indicating that the ratio of well irrigation from groundwater extraction increased. In the wet period (2003–2011), the groundwater extraction and the ratio of well–canal irrigation showed a stable trend, and the groundwater levels showed a slow decreasing trend. In the normal period (2012–2017), the groundwater extraction exhibited a rapidly increasing trend. The groundwater levels declined significantly between 2011 and 2012 (p < 0.05), indicating that the groundwater extraction was an important factor affecting the groundwater levels.
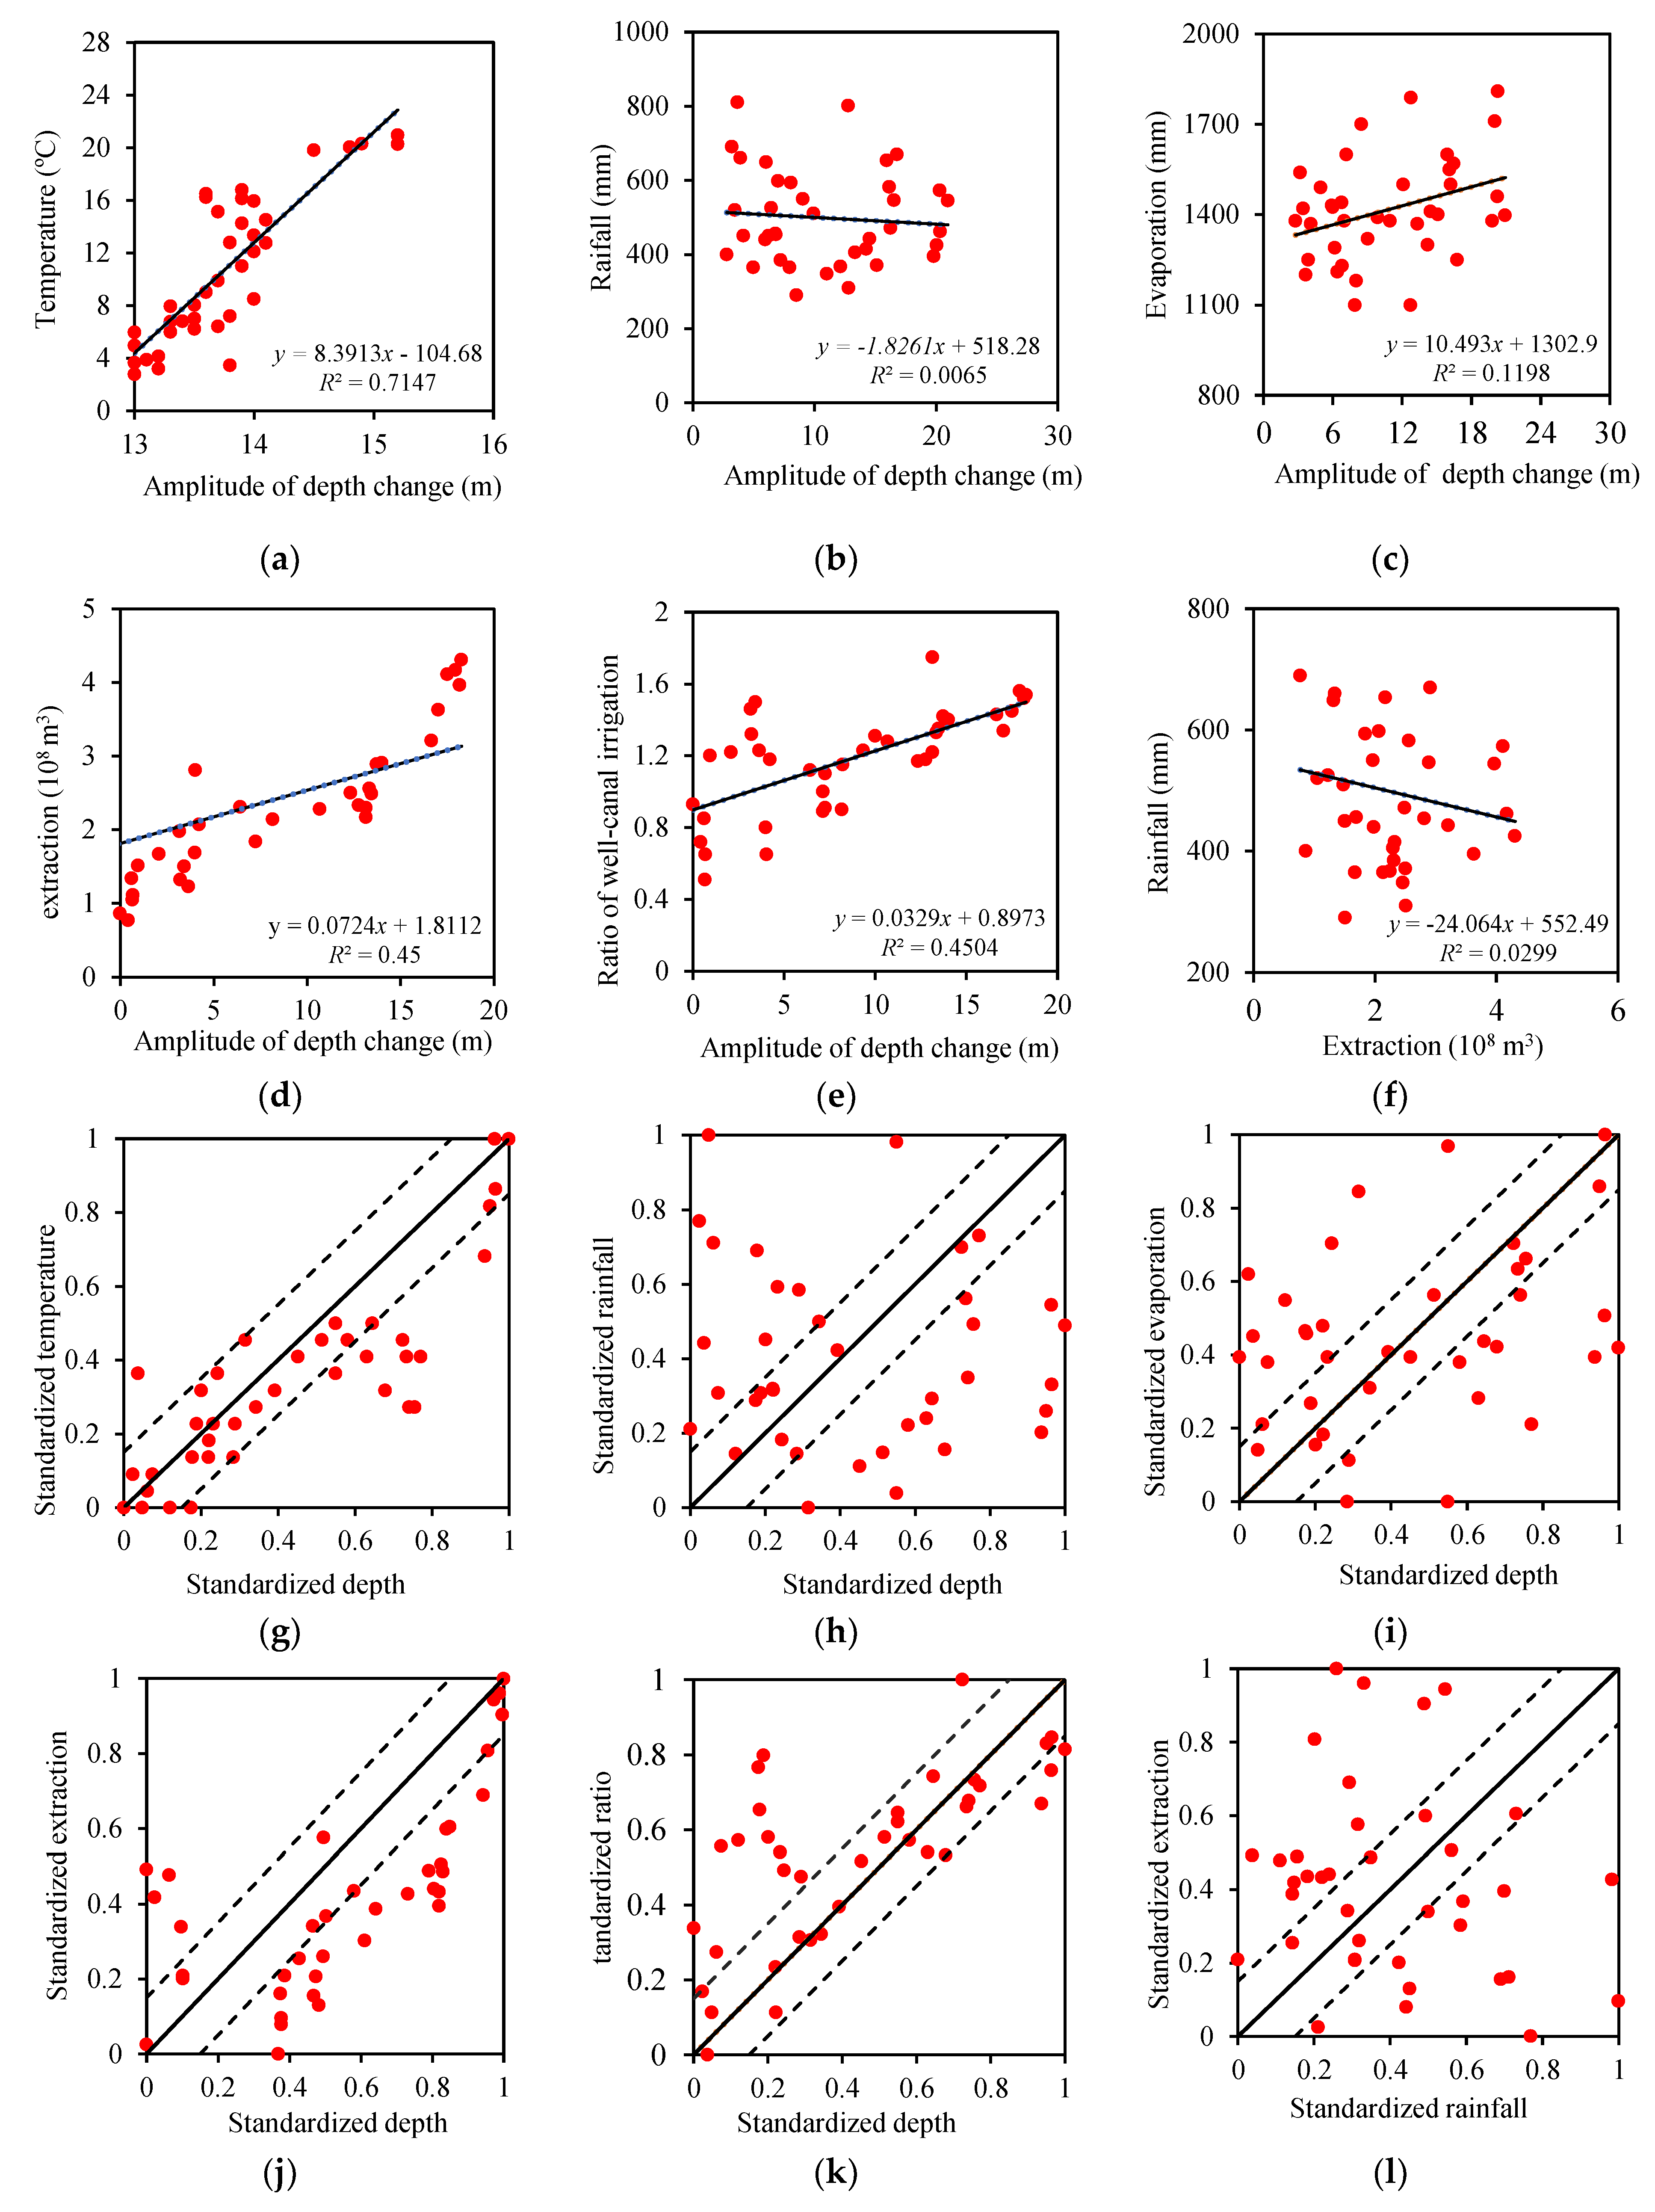
There were significant differences in the response of groundwater levels to different influencing factors, as shown in Figure 10. The temperature, as an indirect factor affecting groundwater level, showed a higher correlation with groundwater levels than rainfall, during the 38-years period (Figure 10a,b,g,h). Furthermore, a direct evaporation showed a lower correlation with groundwater levels (Figure 10c,i). As a direct impact factor, the groundwater extraction and the well–canal irrigation ratio showed a high correlation with the groundwater levels (Figure 10d,e,j,k). The rainfall showed a lower correlation with groundwater extraction (Figure 10f,l), indicating that the rainfall had a little effect on the groundwater extraction. As direct factors affecting groundwater discharge and recharge, the influence of extraction, canal irrigation, and rainfall, on groundwater levels, should be more significant. However, the indirect factor, temperature, showed a higher correlation with groundwater levels than the other direct factors.
4. Discussion
This study focused on the response among the climate factors (rainfall, temperature), groundwater extraction, and the well–canal irrigation ratio, to the groundwater levels change. The change of groundwater levels in different climatic phases were different. The numbers of the MWS exhibiting groundwater levels decline, in dry or normal periods, was much higher than that in wet periods. Moreover, extreme weather showed a higher response to the groundwater levels. Although the groundwater extraction fluctuated in some periods, due to extreme weather and policies, the overall trend was upward, indicating that the groundwater extraction was a major driving force leading to the chronic decline of groundwater levels.
The magnitude of groundwater levels was distinct in the different sub-regions of the study area. The MWS with significant declines in groundwater levels were mainly clustered in the western part of the study area (the Jingyang county and the Sanyuan county), which has been proved by previous studies. From 1978 to 2014, the groundwater levels decreased by more than 15 m, in the central and western regions, and the local regions decreased by more than 20 m, but in the southeast, by 5–10 m [47]. According to previous research, the ratio of well–canal irrigation reached to 1.2 in the west and northwest (mainly in the Jingyang county and the Sanyuan county) where the groundwater level declined significantly, which indicated a groundwater overexploitation, and that the groundwater recharge was not relatively sufficient. Conversely, some regions in the southeast, where the ratio of the well–canal irrigation was less than 1, showed that the groundwater level decline was not significant, and the groundwater recharge was relatively sufficient. Moreover, relevant data showed that the vegetable planting area in the west and northwest was larger than that in the southeast, resulting in a higher water consumption than that in the southeast [48]. In addition, as a vital factor impacting the magnitude of the groundwater levels, the different hydrogeological permeability of the study area, a lower value in the northwest and the southeast, and a higher value in the middle area, were shown by Huang [23], using the MODFLOW model. Furthermore, the lateral recharge of rivers (Weihe, Jinghe) in the southeast, was more significant than that in the west and northwest. These reasons might explain the significant differences in the magnitude of groundwater levels in the different sub-regions under the same climatic phase.
4.1. Influence of Distinct Climate Phases on Groundwater Levels
In distinct climatic phases, the variation range of groundwater levels was also distinct. In the study, the variation of groundwater levels in the dry period (1997–2002,) was more significant than that in wet periods (1980–1984 and 2003–2011). The subsequent positive groundwater levels trend in the wet periods, was not sufficient to offset the magnitude of the negative groundwater levels trend, in the preceding dry period or normal, which was noted by Le Brocque et al. [38]. However, the magnitude of groundwater levels change would reduce in the wet periods, which indicated a positive groundwater levels response to the wetter climate. In the normal period (2012–2017), the declining trend of groundwater levels was significant around 2012. The reason might be the emergence of extreme weather, a higher temperature increase of approximately 0.6 °C, and less rainfall around 2012.
It is difficult to quantity groundwater dynamics, due to these complex factors. Aside from temperature and rainfall, the underlying surface, permeability, etc., were the non-negligible factors affecting the groundwater recharge [49]. A higher temperature could accelerate the discharge of groundwater by increasing the evaporation or the crop stress. The factors affecting evaporation were not just temperature, including wind speed, sunshine duration, underlying surface, etc. This explained why evaporation was not highly correlated with groundwater levels, in this study, although there was a high correlation between temperature and the groundwater level. The effect of other climate factors (wind speed, sunshine duration, underlying surface, etc.) on groundwater levels should be considered in future studies. The detailed relationships between temperature and groundwater levels, need to be further explored. Furthermore, the response sensitivity of groundwater levels to wet, dry, or normal climate phases might not be the same [50], which might be a temporary or long-term response. In the study, the temporal responses of groundwater levels to extreme weather were not considered; this formed a vital part of the exploration of the effects of climate variables on groundwater levels.
4.2. The Influence of Other Factors on the Groundwater Level
The potential links among climate variables, policy, regulation, governance and management, land use management, and climatic conditions, need to be investigated further, to fully explain their impact on groundwater discharge and recharge [51]. In addition to climate factors, land use type, irrigation utilization rate, water diversion from the canal head, and sunshine duration, also indirectly affected the decline or recovery of groundwater levels [52]. From 1995 to 2014, the cultivated land area decreased to 17,082 hm2, with an average annual change rate of −0.89%, and the irrigation area increased, resulting in an increasing groundwater extraction. The water diversion from the canal head decreased from 480 million m3 to 346 million m3, between 1980 and 2014. The irrigation utilization coefficient was about 0.6, which was lower than the developed countries with 0.7–0.8 [53]. All these factors could affect the recharge and discharge of groundwater, but the impact degree of these factors on the groundwater level needs further study in the future.
Groundwater management policy is also an important factor affecting groundwater resources. In the 1950s, the groundwater levels rose greatly, resulting in soil salinization [54]. The area of groundwater depth, within 3 m, accounted for 62.7% of the total area of the Jinghuiqu irrigation district. The management policy for developing well irrigation was implemented to extract the groundwater, resulting in the chronic decline of groundwater levels and the imbalance of groundwater-linked ecosystems, form a long-term perspective. Since 1985, water-saving lining projects have been implemented for branch canals in the Jinghuiyu irrigation district and leakage losses of each branch canal have been reduced from 40% to 5–18%, which might have led to less groundwater recharge from channels. Although the well–canal irrigation pattern was advocated to recover the groundwater level, at present, the groundwater level still showed a declining trend. The reason might be that the recovery of groundwater levels through the wet periods was hindered, due to the overexploitation of groundwater [55]. The management of groundwater extraction have not been standardized without an effective supervision. Private well drilling exists widely in the local industrial and agricultural production, due to decreasing water diversion and a higher price for diversion water than well drilling, which needed to be noted by the groundwater manager.
Furthermore, the hydrogeology has an important influence on a regional groundwater flow system. In this study, the variation of groundwater levels showed a more significant decline in the northwest than in the southeast, which might have been affected by the groundwater flow system from north to south. Additionally, topographic characteristics of the study area are possibly coupled to the decreasing permeability in these directions (North to South, Northwest to Southeast). However, at present, there have only been a few studies in this study area, and further studies are needed.
5. Conclusions
Based on the analysis of the observation data of the groundwater levels and climate factors in the Jinghuiqu irrigation district, the results showed that climatic factors had obvious influence on the change of groundwater levels. The temperature and groundwater levels showed a higher correlation than the other factors, with a coefficient of 0.71. This was followed by groundwater extraction, with a coefficient of 0.45. In the dry period, the groundwater levels decreased more obviously than in the wet period, and the groundwater levels were not completely restored in the wet or normal periods. Especially, extreme climate events had a more significant impact on the groundwater levels. Groundwater levels decreased in 2002, with rainfall decreasing significantly (p < 0.05), showed a stable trend around 1984, with increasing rainfall, and decreased significantly around 2012, with decreasing rainfall and increasing temperature (p < 0.05). Undeniably, the groundwater extraction had a significant impact on the distribution of the groundwater levels changes. The variation of groundwater levels was higher in the northwest than that in the southeast, due to the difference of the groundwater extraction and the well–canal irrigation ratio in these regions. Additionally, local hydrogeology, topography, planning structure, and water intake priority, etc., were the non-negligible factors affecting groundwater recharge, which needs to be studied further. Furthermore, groundwater management policies needs to be further standardized. For the fixed irrigation system at present, an alternative irrigation system should be promoted, decreasing well irrigation in wet periods, increasing water diversion in dry periods, and individual well drilling should be effectively supervised, to decrease groundwater extraction. Meanwhile, the significant impacts of climate change on groundwater dynamics should also be considered by groundwater managers, which are one of the important signals reflecting the change of groundwater levels.
Author Contributions
Conceptualization, Z.Z. and Z.J.; methodology, Z.Z.; validation, Z.Z., Z.J. and Z.G.; investigation, Z.Z., Z.G., and C.X.; writing—original draft preparation, Z.Z.; writing—review and editing, Z.Z. and Z.J.
Funding
This work was supported by the “111” Project (B08039), National Natural Science Foundation of China (41877179), Innovation and Entrepreneurship Training Program for College Students (201810710101), Special Fund for Basic Scientific Research of Central Colleges (300102299206), Open fund of Key Laboratory of Subsurface Hydrology and Ecological Effect in Arid Region of Ministry of Education (300102298502), and China Postdoctoral Science Foundation (2018M633438).
Acknowledgments
The authors are thankful to the Chang’an University Water and Development Research Institute and Jinghuiqu management bureau for the data provided by them.
Conflicts of Interest
The authors declare no conflict of interest.
References
- Huntington, T.G. Evidence for intensification of the global water cycle: Review and synthesis. J. Hydrol. 2006, 319, 83–95. [Google Scholar] [CrossRef]
- Wilby, R.L.; Whitehead, P.G.; Wade, A.J.; Butterfield, D.; Davis, R.J.; Watts, G. Integrated modelling of climate change impacts on water resources and quality in a lowland catchment: River Kennet, UK. J. Hydrol. 2006, 330, 204–220. [Google Scholar] [CrossRef]
- IPCC. Climate Change 2007: The Physical Science Basis; Contribution of Working Group 1 to the Forth Assessment Report of the Intergovernmental Panel on Climate Change; Solomon, S., Qin, D., Manning, M., Chen, Z., Marquis, M., Averyt, K.B., Tignor, M., Miller, H.L., Eds.; Cambridge University Press: New York, NY, USA, 2007. [Google Scholar]
- IPCC. Summary for Policymakers. In Climate Change 2013: The Physical Science Basis; Contribution of Working Group I to the Fifth Assessment Report of the Intergovernmental Panel on Climate Change; Stocker, T.F., Qin, D., Plattner, G.-K., Tignor, M., Allen, S.K., Boschung, J., Nauels, A., Xia, Y., Bex, V., Midgley, P.M., Eds.; Cambridge University Press: Cambridge, UK; New York, NY, USA, 2013. [Google Scholar]
- Touhami, I.; Chirino, J.M.; Andreu, J.R.; Sánchez, H.; Moutahir, J.B. Assessment of climate change impacts on soil water balance and aquifer recharge in a semiarid region in south east Spain. J. Hydrol. 2015, 527, 619–629. [Google Scholar] [CrossRef] [Green Version]
- Treidel, H.; Martin-Bordes, J.J.; Gurdak, J.J. Climate Change Effects on Groundwater Resources: A Global Synthesis of Findings and Recommendations, International Association of Hydrologists (IAH)—International Contributions to Hydrogeology; Taylor & Francis: Abingdon, UK, 2012; 414p. [Google Scholar]
- Stavig, L.; Collins, L.; Hager, C.; Herring, M.; Brown, E.; Locklar, E. The Effects of Climate Change on Cordova, Alaska on the Prince William Sound. Alaska Tsunami Papers. 2005. Available online: https://seagrant.uaf.edu/nosb/papers/2005/cordova-nurds.html (accessed on 1 November 2018).
- Hiscock, K.; Sparkes, R.; Hodgens, A. Evaluation of Future Climate Change impacts on European Groundwater Resources. Climate Change Effects on Groundwater Resources: A Global Synthesis of Findings and Recommendations; International Association of Hydrogeologists (IAH)—International Contributions to Hydrogeology; Treidel, H., Martin-Bordes, J.J., Gurdak, J.J., Eds.; Taylor & Francis: London, UK, 2012; pp. 351–366. [Google Scholar]
- Gandhi, V.P.; Bhamoriya, V. Groundwater Irrigation in India; India Infrastructure Report 90; Oxford University Press: New Delhi, India, 2011. [Google Scholar]
- Pengra, B.A. A Glass Half Empty: Regions at Risk Due to Groundwater Depletion. Environ. Dev. 2012, 2, 117–127. [Google Scholar] [CrossRef]
- Salem, G.S.A.; Kazama, S.; Nepal, C.D. Impacts of climate change on groundwater level and irrigation cost in a groundwater dependent irrigated region. Agric. Water Manag. 2018, 208, 33–42. [Google Scholar] [CrossRef]
- Simmons, C.T. Groundwater down under. Groundwater 2016, 54, 459–460. [Google Scholar] [CrossRef] [PubMed]
- Mehrdad, J.; Ara, T.; Seyed, K.A.; Saeid, H.; Petter, P. Long term groundwater balance and water quality monitoring in the eastern plains of Urmia Lake, Iran: A novel GIS based low cost approach. J. Afr. Earth Sci. 2018, 147, 11–19. [Google Scholar] [CrossRef]
- Prasad, Y.S.; Rao, B.V. Groundwater depletion and groundwater balance studies of Kandivalasa River Sub Basin, Vizianagaram District, Andhra Pradesh, India. Groundw. Sustain. Dev. 2018, 6, 71–78. [Google Scholar] [CrossRef]
- Hafmann, N.; Mortsch, L.; Donner, S.; Dunacan, K.; Kreutzwiser, R.; Kulshreshtha, S.; Piggott, A.; Schellenberg, S.; Schertzer, B.; Slivizky, M. Climate Change and Variability: Impacts on Canadian Water; Environmental Adaptation Research Group, Environment Canada, Faculty of Environment Studies, University of Waterloo: Waterloo, ON, Canada, 2000; p. 120. [Google Scholar]
- Chen, Z.; Grasby, S.; Osadetz, K.G. Relation between climate variability and groundwater level in the upper carbonate aquifer, south Manitoba, Canada. J. Hydrol. 2004, 290, 43–62. [Google Scholar] [CrossRef]
- Zektser, S.; Loáiciga, H.A.; Wolf, J.T. Environmental impacts of groundwater overdraft: Selected case studies in the southwestern United States. Environ. Geol. 2005, 47, 396–404. [Google Scholar] [CrossRef]
- Panda, K.; Mishra, A.; Jena, S.K.; James, B.K.; Kumar, A. The influence of drought and anthropogenic effects on groundwater levels in Orissa, India. J. Hydrol. 2007, 343, 140–153. [Google Scholar] [CrossRef]
- Al-Ruwaih, F.; Almedeij, J. Periodic behavior of groundwater level fluctuations in residential areas. J. Hydrol. 2006, 328, 677–684. [Google Scholar] [CrossRef]
- Shahid, S.; Hazarika, M.K. Groundwater drought in the north-western districts of Bangladesh. Water Res. Manag. 2010, 24, 1989–2006. [Google Scholar] [CrossRef]
- Daneshvar, V.F.; Dinpashoh, Y.; Aalami, M.T.; Jhajharia, D. Trend analysis of groundwater using non-parametric methods (case study: Ardabil plain). Stoch. Environ. Res. Risk Assess. 2013, 27, 547–559. [Google Scholar] [CrossRef]
- Weider, K.; Boutt, D. Heterogeneous water table response to climate revealed heterogeneous water table response to climate revealed by 60 years of ground water data. Geophys. Res. Lett. 2010, 37, L24405. [Google Scholar] [CrossRef]
- Huang, Y.F.; Liu, J.M.; Jiang, P.; Zhang, B. Study on groundwater dynamics and prediction of Jinghuiqu based on Modflow. Res. Soil Water Conserv. 2014, 21, 273–278. [Google Scholar] [CrossRef]
- Jiang, P.; Liu, J.M.; Huang, Y.F.; Zhang, Y.Q. Groundwater in Jinghuiqu responds to climate change and human activities. Yellow River 2014, 36, 45–47, 51. (In Chinese) [Google Scholar] [CrossRef]
- Wada, Y. Modeling groundwater depletion at regional and global scales: Present state and future prospects. Surv. Geophys. 2016, 37, 419–451. [Google Scholar] [CrossRef]
- Döll, P.; Müller Schmied, H.; Schuh, C.; Portmann, F.T.; Eicker, A. Global-scale assessment of groundwater depletion and related groundwater abstractions: Combining hydrological modeling with information from well observations and GRACE satellites. Water Resour. Res. 2014, 50, 5698–5720. [Google Scholar] [CrossRef] [Green Version]
- Sahoo, S.; Russo, T.; Lall, U. Comment on “Quantifying renewable groundwater stress with GRACE” by Alexandra, S. Richey et al. Water Resour. Res. 2016, 52, 4184–4187. [Google Scholar] [CrossRef]
- Gurdak, J.J.; Hanson, R.T.; McMahon, P.B.; Bruce, B.W.; McCray, J.E.; Thyne, G.D.; Reedy, R.C. Climate variability controls on unsaturated water and chemical movement, high plains aquifer, USA. Vadose Zone J. 2007, 6, 533–547. [Google Scholar] [CrossRef]
- Russo, T.A.; Lall, U. Depletion and response of deep groundwater to climate-induced pumping variability. Nat. Geosci. 2017, 10, 105–108. [Google Scholar] [CrossRef]
- Sen, Z. Hydrological trend analysis with innovative and over-whitening procedures. Hydrol. Sci. J. 2017, 62, 294–305. [Google Scholar] [CrossRef]
- Tirogo, J.; Jost, A.; Biaou, A.; Valdes-Lao, D.; Koussoubé, Y.; Ribstein, P. Climate variability and groundwater response: A case study in Burkina Faso (West Africa). Water 2016, 8, 171. [Google Scholar] [CrossRef]
- Tabari, H.; Nikbakht, J.; Shifteh Some’e, B. Investigation of groundwater level fluctuations in the north of Iran. Environ. Earth Sci. 2012, 66, 231–243. [Google Scholar] [CrossRef]
- Abdullahi, M.G.; Toriman, M.E.; Gasim, M.B.; Garba, I. Trends analysis of groundwater: Using non-parametric methods in Terengganu Malaysia. J. Earth Sci. Clim. 2015, 6. [Google Scholar] [CrossRef]
- Bronaugh, D.; Werner, A. zyp: Zhang + Yue-Pilon Trends Package. R Package Version 0. 2013, 10-1. Available online: http://CRAN.R-project.org/package=zyp (accessed on 17 March 2019).
- Jia, Z.F.; Wang, Z.; Wang, H. Characteristics of Dew Formation in the Semi-Arid Loess Plateau of Central Shaanxi Province, China. Water 2019, 11, 126. [Google Scholar] [CrossRef]
- Liu, X.H.; Li, L.; Hu, A.Y. Hydrochemical characterization of a groundwater aquifer and its water quality suitability for irrigation in Jinghuiqu Irrigation District of China. Water Environ. Res. 2013, 85, 245–258. [Google Scholar] [CrossRef]
- Bellier, O.; Mercier, J.L.; Vergely, P.; Long, C.; Ning, C. Evolution Sédimentaire et Tectonique du Graben Cénozoïque de la Wei He (province du Shaanxi, Chine du Nord). Bull. Soc. Géol. Fr. 1988, 8, 979–994. [Google Scholar] [CrossRef]
- Le Brocque, A.F.; Jarrod, K.; Kathryn, R.S. Chronic groundwater decline: A multi-decadal analysis of groundwater trends under extreme climate cycles. J. Hydrol. 2018, 561, 976–986. [Google Scholar] [CrossRef]
- Wang, C.X.; Su, Z.L.; Jiang, Y.C.; Wu, C.B. Disaster analysis of Sanming city based on Mann-Kendall method in Excel. J. Qinghai Meteorol. 2017, 3, 82–85. [Google Scholar]
- Wei, F.Y. Modern Climate Statistical Diagnosis and Prediction Technology; China Meteorological Press: Beijing, China, 2003; pp. 69–72.
- Chen, Z.P.; Xu, Q. Mann-Kendall test method for analysis of precipitation time-history variation characteristics. Sci. Technol. Bull. 2016, 32, 47–50. [Google Scholar] [CrossRef]
- Dai, F.G.; Cai, H.J.; Liu, X.M.; Liu, X.; Liang, H.W. The proportion of suitable well and canal irrigation was simulated and analyzed by the groundwater model in the irrigated area. Trans. Chin. Soc. Agric. Eng. 2012, 28, 45–51. [Google Scholar] [CrossRef]
- Anysz, H.; Zbiciak, A.; Ibadov, N. The Influence of Input Data Standardization Method on Prediction Accuracy of Artificial Neural Networks. Procedia Eng. 2016, 153, 66–70. [Google Scholar] [CrossRef] [Green Version]
- Niu, Y. Standardized Data Processing for Comprehensive Evaluation of Crop Yield Indicators. Rural Econ. Sci.-Technol. 2017, 28, 16–19. [Google Scholar] [CrossRef]
- Liu, J.Y.; Zhang, K.; Wang, G.H. A comparative study of data standardization methods in comprehensive evaluation. Dig. Technol. Appl. 2018, 36, 84–85. [Google Scholar] [CrossRef]
- Hundecha, Y.; Bárdossy, A. Trends in daily precipitation and temperature extremes across western Germany in the second half of the 20th century. Int. J. Climatol. 2005, 25, 1189–1202. [Google Scholar] [CrossRef] [Green Version]
- Wang, J.Y.; Liu, Y.; Yao, A.M. Dynamic Analysis of Groundwater Level in Jinghuiqu irrigation district. J. Irrig. Drain. 2015, 34, 67–70. [Google Scholar] [CrossRef]
- Wang, J.Y.; Zhang, P.P.; Liu, Y. Relationship between Groundwater Level Dynamics and Irrigation Agriculture in Jinghuiqu irrigation district. Agric. Res. Arid Areas 2016, 34, 247–251. [Google Scholar]
- Guobin, F.; Russell, S.; Crosbie, O.B.; Stephen, P.; Charles, W.D.; Xiaogang, S.; Tom, V.N.; Chris, L. Attributing variations of temporal and spatial groundwater recharge: A statistical analysis of climatic and non-climatic factors. J. Hydrol. 2019, 568, 816–834. [Google Scholar] [CrossRef]
- Crosbie, R.S.; McCallum, J.L.; Walker, G.R.; Chiew, F.H.S. Modelling climate-change impacts on groundwater recharge in the Murray-Darling Basin, Australia. Hydrogeol. J. 2010, 18, 1639–1656. [Google Scholar] [CrossRef]
- Smerdon, B.D. A synopsis of climate change effects on groundwater recharge. J. Hydrol. 2017, 555, 125–128. [Google Scholar] [CrossRef]
- Crosbie, R.S.; McCallum, J.L.; Walker, G.R.; Chiew, F.H.S. Episodic recharge and climate change in the Murray-Darling Basin, Australia. Hydrogeol. J. 2012, 20, 245–261. [Google Scholar] [CrossRef]
- Li, X.Y. Analysis and Evaluation of Ecological Environment Quality in Jinghuiqu Irrigation District. Master’s Thesis, Chang’an University, Xi’an, China, 2008. [Google Scholar] [CrossRef]
- Ye, Y.C.; Li, L. Jinghuiqu Chorography; Sanqin Publishing: Xi’an, China, 1991; pp. 207–210. [Google Scholar]
- Richey, A.S.; Thomas, B.F.; Lo, M.H.; Reager, J.T.; Famiglietti, J.S.; Voss, K.; Swenson, S.; Rodell, M. Quantifying renewable groundwater stress with GRACE. Water Resour. Res. 2015, 51, 5217–5238. [Google Scholar] [CrossRef] [Green Version]
Figure 1.
Location of the Jinghui irrigation district.

Figure 2.
Characteristics of climate change in the study area. (a) The annual rainfall and evaporation (1980–2017), and (b) The annual temperature (1950–2017).
Figure 2.
Characteristics of climate change in the study area. (a) The annual rainfall and evaporation (1980–2017), and (b) The annual temperature (1950–2017).

Figure 3.
Weighted rainfall anomaly (5 year) for the Jinghuiqu irrigation region with respect to long-term rainfall anomaly (1980–2017). 90th percentile and 10th percentile showing extreme wet years and extreme dry years as dashed horizontal lines.
Figure 3.
Weighted rainfall anomaly (5 year) for the Jinghuiqu irrigation region with respect to long-term rainfall anomaly (1980–2017). 90th percentile and 10th percentile showing extreme wet years and extreme dry years as dashed horizontal lines.

Figure 4.
Mean annual rainfall M–K statistic curve. UF refers to the normal statistics (1980–2017). UB is reverse order of −UF as an auxiliary line. α0.05 refers to 95% confidence limit.
Figure 4.
Mean annual rainfall M–K statistic curve. UF refers to the normal statistics (1980–2017). UB is reverse order of −UF as an auxiliary line. α0.05 refers to 95% confidence limit.

Figure 5.
(a) Mean annual temperature M–K statistic curve. (b) Mean annual temperature slip t-test statistic curve. α = 0.01 refers to the 99% confidence limit, t0.01 and t0.05 refer to the 99% and 95% confidence limit of the slip t-test.
Figure 5.
(a) Mean annual temperature M–K statistic curve. (b) Mean annual temperature slip t-test statistic curve. α = 0.01 refers to the 99% confidence limit, t0.01 and t0.05 refer to the 99% and 95% confidence limit of the slip t-test.


Figure 6.
An average amplitude of change in groundwater level relative to 1980 for all alluvial monitoring wells (MWS) (1980–2017). Shading represents 95% confidence limits. Red dotted line represents a fitting line.
Figure 6.
An average amplitude of change in groundwater level relative to 1980 for all alluvial monitoring wells (MWS) (1980–2017). Shading represents 95% confidence limits. Red dotted line represents a fitting line.

Figure 7.
The spatial distribution and some representatives of the MWS showing groundwater responses (p < 0.05) during the period 1980–2017: (●) declining trend significantly; (●) declining trend; and (●) declining trend slightly. (a) Wet phase 1980–1984; Location of the typical MWS (#41265020, #41165500, #41165660) (b) Normal and Dry phases 1985–1996, 1997–2002; (c) Wet phase 2003–2011; and (d) Normal phase 2012–2017.

Figure 8.
Examples of individual monitoring well time series within the broad types of groundwater responses identified in distinct regions.
Figure 8.
Examples of individual monitoring well time series within the broad types of groundwater responses identified in distinct regions.

Figure 9.
The effect of groundwater extraction and the well–canal irrigation ratio on groundwater levels.
Figure 9.
The effect of groundwater extraction and the well–canal irrigation ratio on groundwater levels.

Figure 10.
The correlation among different climate factors, human factors, and groundwater depths. (a) Temperature and depth, (b) rainfall and depth, (c) evaporation and depth, (d) extraction and depth, (e) well-canal irrigation ratio and depth, and (f) rainfall and extraction. (g–l) 95% confidence interval of the correlation between the two dashed lines (1980–2017).


Table 1.
Summary of groundwater recharge and discharge balance.
| Average Annual Rainfall (mm) | Canal Irrigation Water (108 m3) | Well Irrigation Water (108 m3) | Groundwater Depth (m) | Ratio | Water Balance |
|---|---|---|---|---|---|
| 390 | 4.1 | 2.1 | 3–5 | 0.52 | balanced |
| 600–700 | 3.7–4.0 | 1.4–1.9 | 3–5 | 0.35–0.55 | fundamental |
| 540 | 1.5–2.0 | 1.0–1.4 | >8 | 0.5–0.7 | possible |
| 450 | 1.2–1.7 | >1.5 | >8 | >1 | imbalanced |
Data from previous study by Dai et al. [42]. Canal irrigation water refers to the use of surface water. Well irrigation water refers to the use of groundwater. Ratio refers to ‘well irrigation water’ divided by ‘Canal irrigation water’. The ‘fundamental’ refers to an unstable balance; the ‘possible’ refers to a possible imbalance.
Table 2.
Location information of five weather stations.
| Weather Station | Longitude (N) | Latitude (E) | Weather Station No. |
|---|---|---|---|
| Sanyuan | 108.78° | 34.60° | 57041 1 |
| Jingyang | 108.82° | 34.55° | 57033 1 |
| Lintong | 109.26° | 34.40° | - |
| Fuping | 109.18° | 34.78° | 57042 1 |
| Gaoling | 109.11° | 34.52° | - |
1 Weather station number from the Chinese national meteorological information center. “-” indicates not available.
Table 3.
Summary of groundwater responses showing Sen’s slope estimators, number, Z statistics, and mean groundwater level changes, within the response types, across the entire sampling period (1980–2017) and within the climatic phases.
Table 3.
Summary of groundwater responses showing Sen’s slope estimators, number, Z statistics, and mean groundwater level changes, within the response types, across the entire sampling period (1980–2017) and within the climatic phases.
| Trend (Response) | Mean Sen’s Slope (year−1) | Over Phase | Number of MWS | Z Absolute Value | Groundwater Level Change (m year−1) | Standard Error |
|---|---|---|---|---|---|---|
| Wet (1980–1984) | ||||||
| Rising | 0.16 | 0.31 | 37 | 0.76 | 0.12 | 0.02 |
| Declining | −0.25 | −0.24 | 48 | 1.35 * | −0.15 | 0.01 |
| Stable | 0.02 | 0.07 | 34 | 0.33 | 0.05 | 0.02 |
| Normal (1985–1996) | ||||||
| Rising | 0.08 | 0.11 | 11 | 0.71 | 0.19 | 0.02 |
| Declining | −0.21 | −0.33 | 63 | 1.49 * | −0.54 | 0.02 |
| Stable | −0.01 | −0.12 | 45 | 1.15 | −0.13 | 0.02 |
| Dry (1997–2002) | ||||||
| Rising | 0.13 | 0.17 | 16 | 0.51 | 0.15 | 0.02 |
| Declining | −0.56 | −0.39 | 71 | 1.79 ** | −0.62 | 0.01 |
| Stable | −0.17 | −0.13 | 32 | 0.65 | −0.23 | 0.01 |
| Wet (2003–2011) | ||||||
| Rising | 0.23 | 1.02 | 28 | 1.12 | 0.21 | 0.02 |
| Declining | −0.42 | −0.52 | 50 | 1.51 * | −0.29 | 0.04 |
| Stable | 0.05 | 0.43 | 41 | 0.81 | 0.11 | 0.03 |
| Normal (2012–2017) | ||||||
| Rising | 0.11 | 0.59 | 13 | 0.64 | 0.07 | 0.03 |
| Declining | −0.28 | −0.32 | 69 | 1.68 ** | −0.69 | 0.03 |
| Stable | −0.03 | −0.55 | 37 | 1.24 | −0.06 | 0.02 |
“*” and “**” represent 90% and 95% confidence levels, respectively.
© 2019 by the authors. Licensee MDPI, Basel, Switzerland. This article is an open access article distributed under the terms and conditions of the Creative Commons Attribution (CC BY) license (http://creativecommons.org/licenses/by/4.0/).
Share and Cite
MDPI and ACS Style
Zhao, Z.; Jia, Z.; Guan, Z.; Xu, C. The Effect of Climatic and Non-climatic Factors on Groundwater Levels in the Jinghuiqu Irrigation District of the Shaanxi Province, China. Water 2019, 11, 956. https://doi.org/10.3390/w11050956
AMA Style
Zhao Z, Jia Z, Guan Z, Xu C. The Effect of Climatic and Non-climatic Factors on Groundwater Levels in the Jinghuiqu Irrigation District of the Shaanxi Province, China. Water. 2019; 11(5):956. https://doi.org/10.3390/w11050956
Chicago/Turabian StyleZhao, Zhiqiang, Zhifeng Jia, Zilong Guan, and Chunyan Xu. 2019. "The Effect of Climatic and Non-climatic Factors on Groundwater Levels in the Jinghuiqu Irrigation District of the Shaanxi Province, China" Water 11, no. 5: 956. https://doi.org/10.3390/w11050956
Note that from the first issue of 2016, this journal uses article numbers instead of page numbers. See further details here.