Fuzzy AHP Integrated with GIS Analyses for Drought Risk Assessment: A Case Study from Upper Phetchaburi River Basin, Thailand

1
Environmental Research Institute, Chulalongkorn University, Phayathai Road, Pathumwan, Bangkok 10330, Thailand
2
Chula Unisearch, Chulalongkorn University, Phayathai Road, Pathumwan, Bangkok 10330, Thailand
*
Author to whom correspondence should be addressed.
Water 2019, 11(5), 939; https://doi.org/10.3390/w11050939
Submission received: 13 March 2019
/
Revised: 28 April 2019
/
Accepted: 29 April 2019
/
Published: 4 May 2019
(This article belongs to the Section Water Resources Management, Policy and Governance)
Abstract
:This study aimed to analyse and assess desertification risks in the Upper Phetchaburi River Basin. Upstream areas are especially crucial for aquatic ecosystems since the mid- and downstream areas are continuously being utilized for agricultural and community purposes. Many parts of the basin have been at moderate risk of drought. The fuzzy analytical hierarchy process (FAHP) is an effective and widely accepted model used to identify complicated environmental problems and disasters and prioritize factors in environmental studies. This study emphasized on four main factors influencing drought: Climate, physical factors, soil and land utilization factors. Each factor contains ten sub-criteria to identify severity levels and specific issues. The major areas of the basin were facing different risk levels: moderate (21%), high (5.79%) and severe (0.07%). Precipitation and slope gradient were the main factors affecting drought risks. The problematic areas were agricultural areas located in midstream and downstream areas. Therefore, spatial mitigations and possible ways forward should focus on increasing moisture contents—to reduce soil erosion and enhance soil fertility—and create restrictions to ensure appropriate land use. The mitigations must take into account spatially critical factors and must also include an integrated plan for the entire basin area.
1. Introduction
Drought has attracted attention across basin areas in many parts of the world. Land degradation, drought and desertification are all consequences of human activities [1,2,3,4,5]. Erosion, agrochemical cropping, monoculture farming and changes in the fertility and drainage of soil are all causes of land degradation [4,6,7]. Human activities complicate [3,4,8] and increase the risk of drought [5,6,9] rendering its occurrence and severity more difficult to predict [9,10]. Therefore, obtaining data and conducting risk assessments in areas at risk of droughts are vital for planning for the future of land development, drought prevention and minimizing the adverse impacts from it.
Recent research has shown that mathematical models such as the drought hazardous and vulnerability index (DHVI) (e.g., [11,12,13,14]) are effective tools for assessing the risk of drought (e.g., [15,16,17]. However, the models often do not include all anthropogenic effects [18,19,20]. Among these tools, the fuzzy analytical hierarchy process (FAHP), a combination of analytical hierarchy process (AHP) and fuzzy theory [21,22], include anthropogenic factors. FAHP is effective for estimating the degree of importance, or weight, and is used for various purposes including site selection, evaluation, planning, decision making and forecasting (e.g., [23,24,25,26,27]). The FAHP approach was proposed by Chang [28] as a way of solving the limitations of AHP [24,29,30]. Even though FAHP is a highly complex process, it is more applicable and effective than the conventional AHP when dealing with real world problems, especially for risk assessment and disaster predicting (e.g., [29,31,32,33,34,35]).
Both FAHP and AHP methods are extremely useful for prioritizing multiple-choice criteria and sorting them into a hierarchical structure. FAHP assesses the relative importance of each criterion and also generates an overall rank of alternatives or weight of factors. In the classic AHP method, the numerical values of linguistic variables are directly used for the evaluation of the criteria. If the environment where the decision-making process takes place is fuzzy, then fuzzy numbers will be used for the evaluation concerning some deviations of the decision makers. According to the literature, the AHP method is a decision support tool that is widely employed to solve complex decision problems or as a weight-estimating technique in many fields such as water resource management, environmental management, economic development and medicine and healthcare [1,27,28,36,37,38].
However, AHP has its limitations. Crisp values are required in order to use the AHP analysis. Therefore, its limitations lie in analyzing data sets with vagueness and uncertainty, or those containing complex factors, that are common in real world situations. Fuzzy set theory is widely applied for risk assessment in many research fields (e.g., [22,23,25,26]). The concept of fuzzy sets is a great generalization of the classical notion of a set. A fuzzy set model is a class of objects with a continuum of grades of membership that divides evaluation results into intervals [21]. The fuzzy set model has its function to locate the assessment results in the intervals which makes them more plausible. Therefore, the integration of fuzzy sets and AHP gives a much better and more exact representation of the relationship between criteria and alternatives [24,28,30,31,32,33,34,35,39]. The key to success of the FAHP method lies in correctly prescribing the domain of the fuzzy evaluation and reasonably constructing a fuzzy evaluation matrix. Therefore, subjective limitations are inevitable. Moreover, there has been research comparing the outcomes of AHP and FAHP. The results revealed that FAHP was less sensitive to the changes than AHP [40,41]. The FAHP process was used to express uncertainty and to obtain more accurate results than the AHP method [42].
FAHP is widely used among researchers to weigh selected risk factors and construct a fuzzy logic theory (e.g., [23,24,25,31,39,40,41]). Drought risk assessment is an intrinsically complex, multidimensional process which includes both uncertain quantitative and qualitative factors [38,39]. Therefore, FAHP is considered to be highly appropriate for assessing and predicting drought risks [24,31,39]. For example, Wijitkosum [39] applied AHP with the triangular fuzzy numbers (TFNs) method to analyze data obtained from the quantitative and qualitative criteria for assessing drought risk at Lam Ta Kong Watershed. Aher et al. [41] used FAHP to identify vulnerable areas located in sub-watersheds in the transition zone between the mountainous and the water scarcity regions of western India. Both studies exposed critical factors that affected drought risks in the watersheds. Policy makers were able to use this data to establish drought policy and management. Hosseini-Moghari et al. [31] considered FAHP as an effective tool for drought risk management for qualitative criteria that takes into account subjectivity and uncertainty and aids with synthesizing group judgments. Sadeghravesh et al. [42] prioritized five combating-desertification alternatives for central Iran via FAHP by reducing the uncertainty associated with group decision-making. Therefore, it is well established that FAHP is practical for predicting and identifying the vulnerability of the environment against hazardous disasters.
Also research has shown that FAHP is useful to assess the risks of floods (e.g., [40,43,44,45]), to create landslide susceptibility maps, to assess soil erosion (e.g., [32,46,47,48]) and functions as a decision-making tool for disaster and spatial management (e.g., [24,31,40,41,45]). Geographic information system (GIS) analysis and remote sensing (RS) for spatial analysis, are modern tools that play an important role in graphical visualization, dissemination of information and to facilitate interpretation of such spatial information [48,49,50,51]. For this reason, in many studies GIS and RS techniques have been applied along with mathematical models such as FAHP and have made significant contributions to area-based environmental analyses [39,52,53,54,55].
This study was conducted in the Upper Phetchaburi River Basin (UPRB) in the southeastern part of Thailand where drought has recently become a critical problem [56]. There are only a few studies of such issues. The basin is classified as a tropical rain forest at higher elevations [57], particularly in the upstream area of Kaeng Krachan National Park, which is on the (tentative) list as a possible UNESCO Natural World Heritage site. The basin is on a drought-watch list because many areas are at moderate risk of desertification [58]. Therefore, it seems prudent to conduct risk analysis in the UPRB to provide useful data for proactive planning in order to develop preventive measures for potential drought-related problems. This study used FAHP to identify specific sites at risk of drought. FAHP was combined with remote sensing and GIS techniques. This research also provides useful general background knowledge for sustainable land use and development. The physical data are crucial for government planning agencies.
2. Materials and Methods
2.1. Study Area
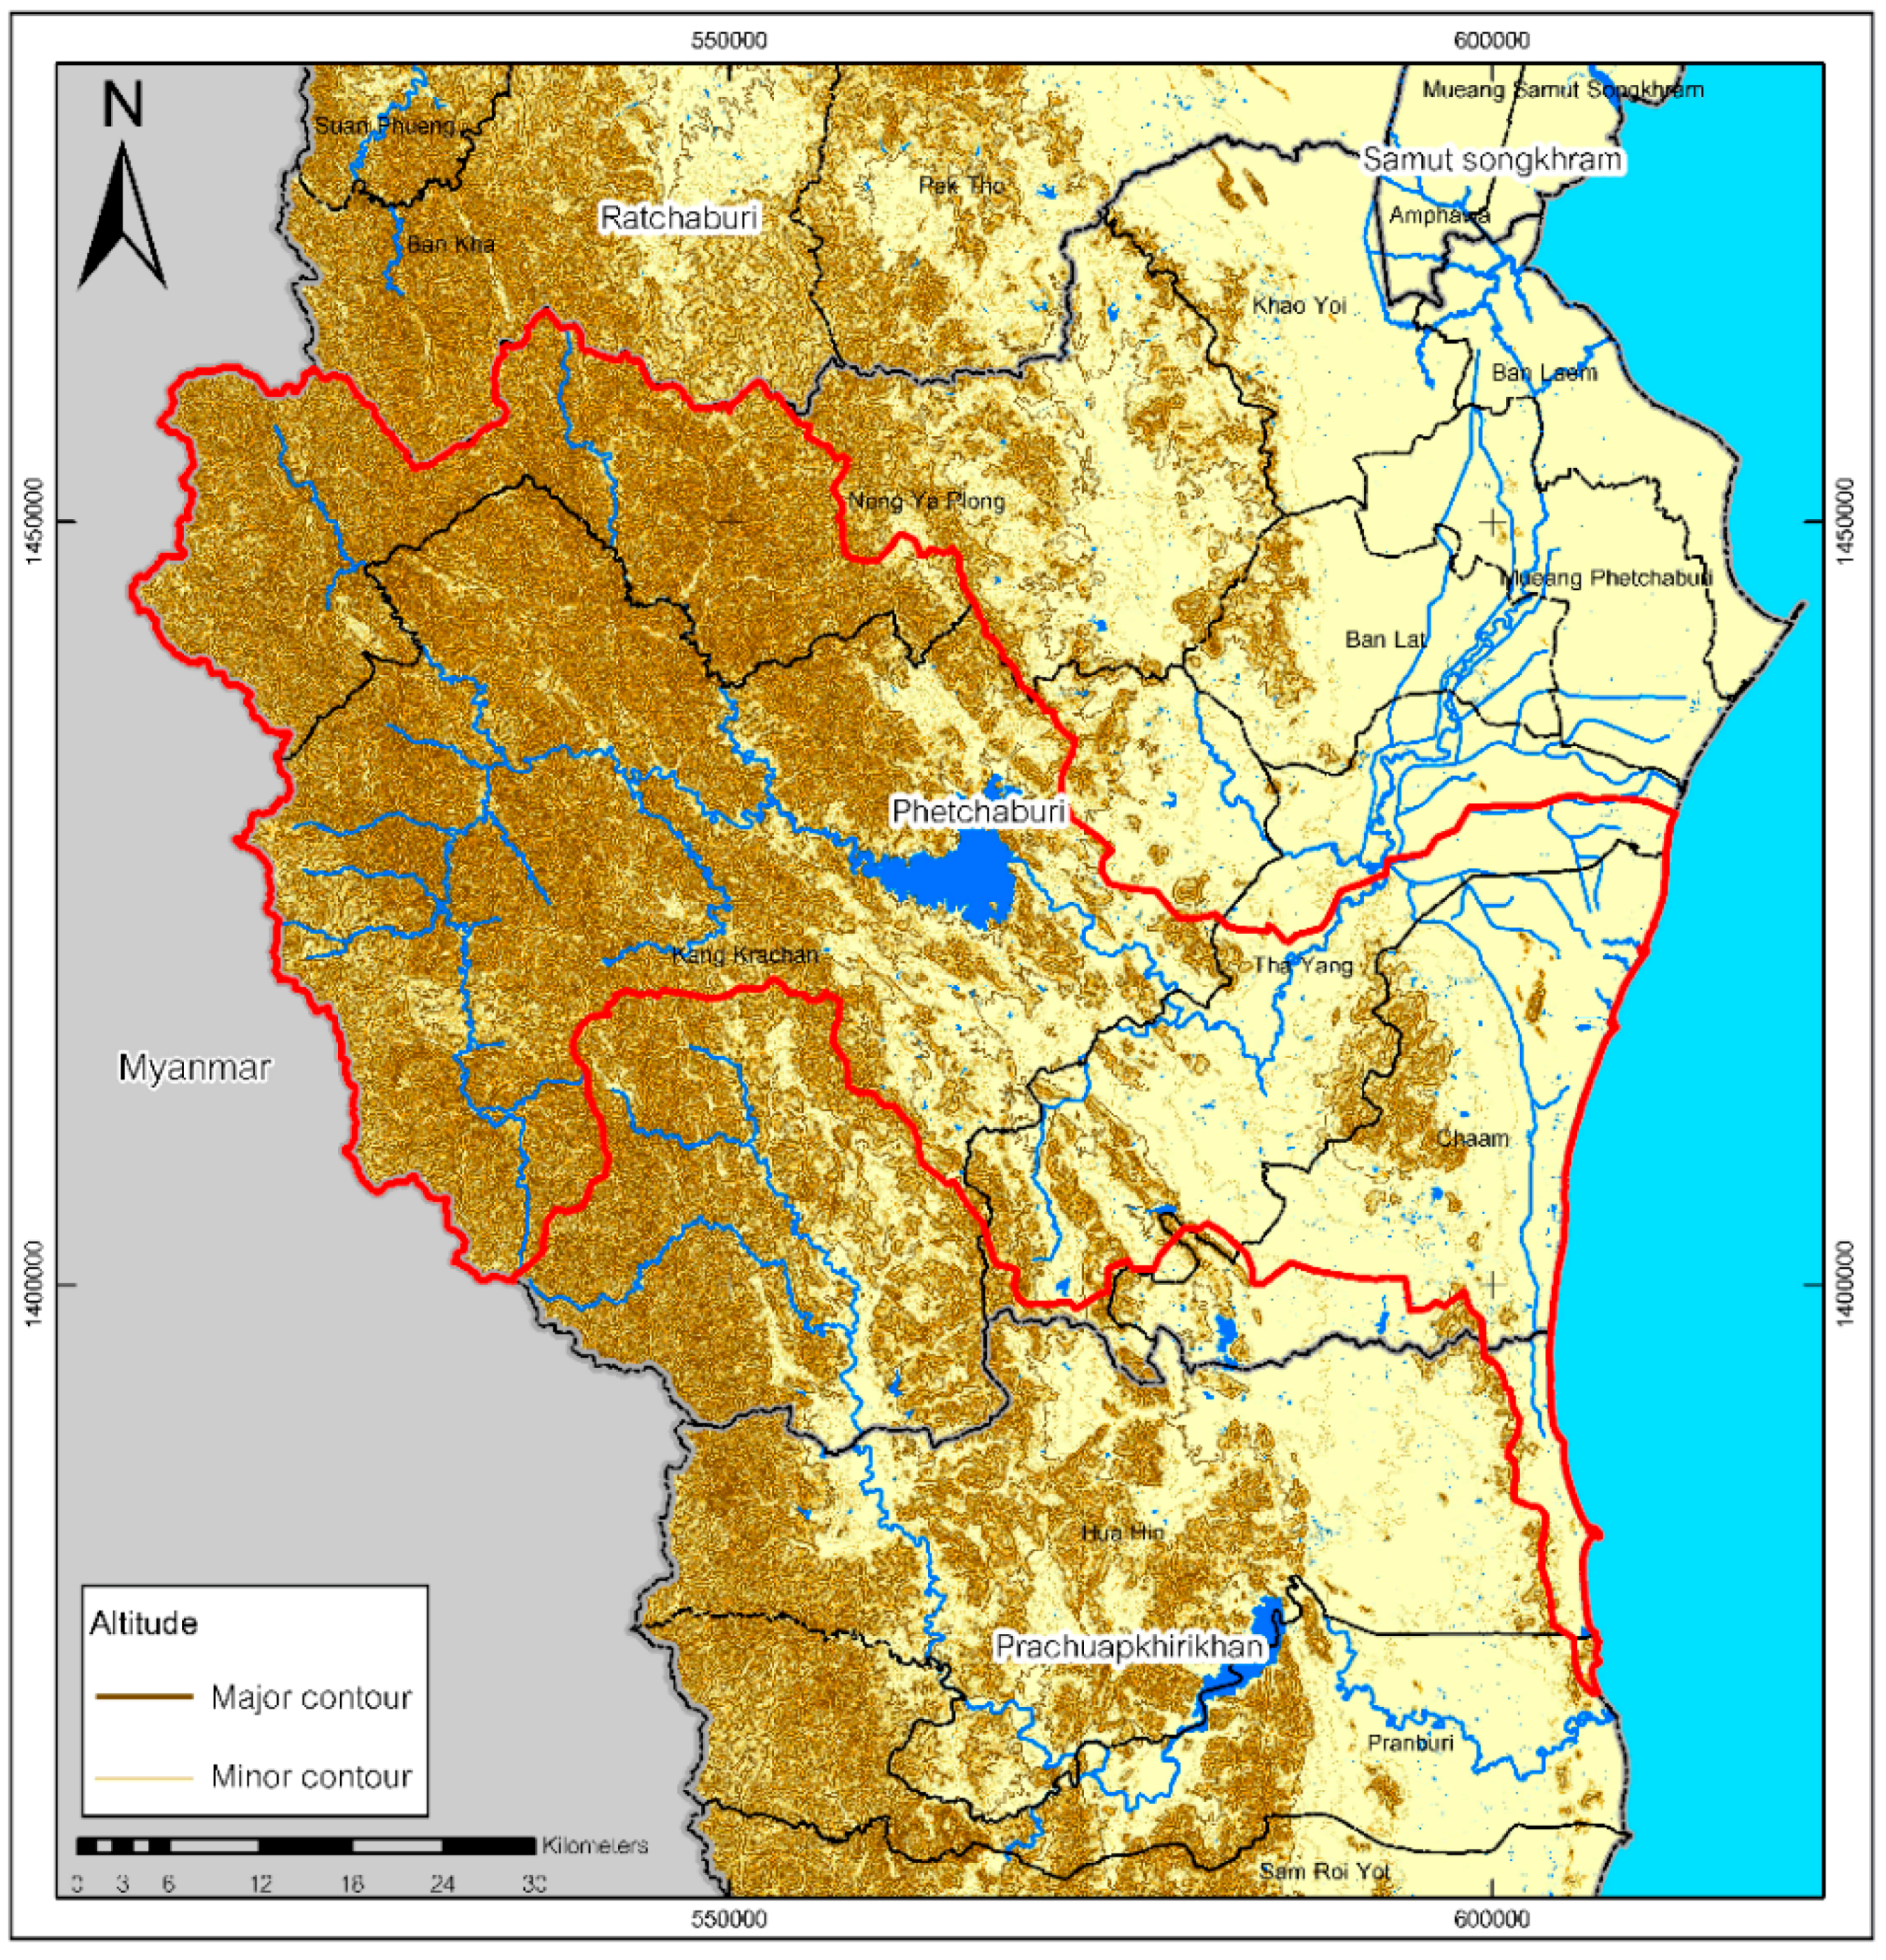
The UPRB is a sub-basin of the Phetchaburi River Basin (12°25′26.91″ N–13°14′38.326″ N 99°5′42.864″ E–100°2′2.70″ E) located in the southeastern part of Thailand. It covers an area of 3447.54 km2, which is 62% of the Phetchaburi River Basin (Figure 1). The west is a high mountain range on the border between Thailand and Myanmar. An internal regional border between the Phetchaburi and Ratchaburi Provinces lies in the north of UPRB. Some areas of the basin are located in Kaeng Krachan National Park. The national park was declared as an The Association for Southeast Asain Nation (ASEAN) Heritage Park in 2003. The Kaeng Krachan Forest Complex (KKFC) was added to the list of potential UNESCO Natural World Heritage during the 35th Session of the World Heritage Committee, UNESCO, Paris, France on 19 December 2013.
Of the total area, 67% of the basin is a downward slope from west to east with a gradient of more than 35%. The total area is 84% forested [57]. The plain area, useful for human settlement and farming, makes up about 14% of the total area. The average annual rainfall is 943.80 mm and average annual evaporation is 1624.0 mm, giving an annual specific yield of 7.84 L/s/km2.
The Phetchaburi River is the main river in the basin. It originates from Kaeng Krachan National Park and supplies Kaeng Krachan and Phetchaburi Dams. The high range mountains (700 m above mean sea level, mamsl) have slopes greater than 35% in the upstream areas (upper Kaeng Krachan Dam) most of which are within the perimeter of a national tropical rain forest reserve. The topography of the central part of the basin is classified as a piedmont plateau, with undulating and rolling terrains at an elevation of 100 mamsl. Downstream are the lowland areas and the sea coast with an average elevation of 3 mamsl where the land is used for agriculture, community settlements and tourism.
2.2. Data Collecting and Evaluating the Drought Risk Factors
The risk of drought is subject to a combination of frequency, severity and its spatial extent, and the vulnerability of a population or activity [4,5,6,59,60,61] Meteorological factors, soil characteristics, water resources and human activities [5,6,39,60,61,62,63] must be investigated for each locality [4]. For this study the four main factors: Climatic, physical, soil and human activities; ten sub-criteria were used to identify and analyze the levels of drought risk.
Precipitation is the most important climatic factor. Rain data for this region has been collected over a 30-year period from seven agrometeorological stations in the UPRB area. Since the Upper Phetchaburi River Basin is partially located in Kaeng Krachan National Park, a rainforest that provides habitat for wild animals and is close to the Thai–Myanmar border. Moreover, the terrain is also mountainous with a gradient level of 75%–100% covering the west side of the basin. The geographical features made it difficult to establish more meteorological stations in the area within the national park premises. Therefore, the agrometeorological station was the only station available in the upstream area and six more agrometeorological stations were scattered in the midstream to downstream basin area. Precipitation data analysis from all meteorological stations revealed that the distribution of precipitation in the area is homogenous. Even though there is only one station in the area, the mountainous upstream area is similar in terms of heights and covered by thick forests. Therefore, precipitation rate is not much different in the area. Moreover, the precipitation data were analyzed with areal data using equal interval. The stability and consistency of the data were analyzed using the double mass curve model [5]. Therefore, the precipitation data obtained from the seven agrometeorological station are suitable as representatives of the area. The Penman–Monteith equation [64] calculates the reference evapotranspiration (ET0) [65]. The aridity index (AI) relates the proportion of annual precipitation to the potential evapotranspiration [5]. The physical data of slope gradient and altitude are the key factors contributing to deep soil moisture that are related with vegetation and drought [39,66], were obtained from 1:50,000 maps of the study area. They were used to create digital elevation models (DEMs) that were in turn used to derive the slope and aspect.
Soil factors include texture, water drainage capacity, fertility and erosion, and are linked with drought and desertification. First, there is a relationship between soil texture, water drainage capacity and erosion resistance which sustains vegetation [67,68,69,70,71,72,73]. Soil fertility and soil moisture are an important factor to support planting and vegetation, including agricultural crops [66,74,75]. The soil erosion must develop more extensively [72]. Soil erosion adversely affects soil fertility [72,76]. It decreases soil depth and productivity [72] and reduces vegetation cover [5,6,73]. Erosion is also a major cause of land degradation [68,69] and desertification [5]. It can be assessed using the universal soil loss equation (USLE) with six factors. In Thailand, R = 0.4669X − 12.1415 has been used to estimate the erosion level for planning soil conservation [73,77], when R is rainfall and runoff erosivity (Mg/ha/year), X is an average annual rainfall (mm/year).
Land utilization includes land use and land cover as risk factors. Land use is defined by the way humans dominate the land to suit their needs. Changes in land coverage such as deforestation may cause drought [4,70,78,79]. Since land cover is a significant index in drought risk, [4,5,78,79,80], land use should be analyzed in parallel with land cover (LULC). For this study, the ENVI software (Ver. 4.7, Harria Geospatial Solutions, Broomfield, CO, USA, 2009) processed satellite images from Landsat 7 (ETM) and linotype, a multispectral scanner. Image geo-referencing accuracy was initially cross-checked against a reference map.
2.3. Concept of Fuzzy Logic and Fuzzy Set Theory
Fuzzy logic was introduced by Zadeh [21] to handle ambiguous, vague and uncertain data [81,82]. The important principle of fuzzy sets is that its members are recognized as fuzzy membership functions which can be any real number in the interval [0,1] which are different from a crisp set. Each member is mapped in the set to a real number, 0 and 1, to indicate the degree of membership of that member. A fuzzy sets number which is a member ‘F’ can be represented in the equation below.
where x is a real number and has value between −∞ < x < +∞ and R is a universal set of the real number μF(x) and is a membership function. μF(x) represents a degree of membership between 0 to 1. The value 0 means that it is not a member of a set, and the value 1 means that is fully a member of a set. The values between 0 and 1 means that it partially belongs to the set. The meaning of each value of fuzzy sets number can be defined in different ways such using both terms for linguistic variables such as equal, moderate, considerable, moderate increase or using fuzzy numbers of the maximum of nine levels (Table 1).
The fuzzy sets membership function can be used in a wide range of domains in which information is ambiguous, vague or uncertain such as in bioinformatics. Membership function is a technique to solve practical problems of fuzzy set operations. Membership function such as Triangular Fuzzy Numbers (TFNs) [85] is intuitive, computationally simple and useful for the data processing in a fuzzy environment [86,87,88]. TFN (Equation (2)) is applied to carry the values of criteria based on fuzzy logic to solve problems or make decisions [39,89].
The TFN of ỹ is shown as the equation of ỹ = (l, m, u), when l ≤ m ≤ u. Where l is the lowest possible value, m is the middle possible value and u is the upper possible value in the decision maker’s interval judgement. If l = m = u, the fuzzy number gets a crisp number. Each TFN is associated with a triangular membership function, which describes the TFN domain.
2.4. AHP and Fuzzy Comprehensive Evaluation Model
The Analytical Hierarchy Process (AHP), established by Saaty [90,91] is a flexible method to analyze multi-criteria problems. AHP is a modeling tool that builds a hierarchy for decision making by establishing priorities [22,29,92]. However, the AHP is limited when dealing with vague and uncertain data especially those similar to human cognition [24,30]. Therefore, the FAHP approach [93] was proposed as a tool for this study because it is useful in prioritizing and ranking criteria and sub-criteria of drought risk factors under fuzzy data [23,24,31,39].
Chang [28] proposed the FAHP approach as a model to analyze data with multiple criteria obtained from fuzzy environments [22,29,82,89]. The key to its success lies in accurately prescribing the domain of a fuzzy evaluation and constructing a reasonable fuzzy comparison matrix (FCM) [24,29,83]. Prioritization criteria or factors are accomplished by comparing the value of individual criteria in each hierarchy. By comparison, FAHP is accomplished by setting the level of significance for each criterion and fuzzy sets number which is divided into nine levels (Table 1). The fuzzy ratio scales are used to indicate the relative strength of the factors in the corresponding criteria, from which the fuzzy judgment matrix can be constructed [29,39,83,84]. The final scores of alternative values are also represented by fuzzy numbers.
The pairwise comparisons for criteria at each level of the hierarchy are constructed by TFNs. The fuzzy comparison matrix, (a_ij) is calculated by Equation (3).
where
The results of the comparison of each pair of the criteria establish weights for each criterion corresponding to the eigenvector of each matrix. The principal eigenvector is the priority vector of a consistent matrix. The eigenvalue of the pairwise comparison matrix [90] represents the highest result from (Equation (5)), where X is the corresponding eigenvector of the matrix which is a matrix containing and n is the size of the matrix. After that, a consistency rate (CR) of each matrix in comparison with the fuzzy was derived as shown in Equation (6), where a consistency index (CI) was obtained from Equation (7). The CR value is obtained by comparing the CI value with one of the following set of numbers in Table 2, each of which is an average random consistency index derived from a sample of randomly generated reciprocal matrices.
where is the largest eigenvalue of matrix [90], representing the highest result from Equation (5), and n is the matrix size. The random index (RI) is the average CI of randomly generated pairwise comparison matrices of the same size as with elements from the Saaty’s scale. The RI of the matrices of order 1–15 can be seen in Table 2. The matrix is considered to be sufficiently consistent if CR of a decision should not exceed 0.1 [39,82,84,89,94].
2.5. Analysis of Drought Risk in the UPRB Using FAHP
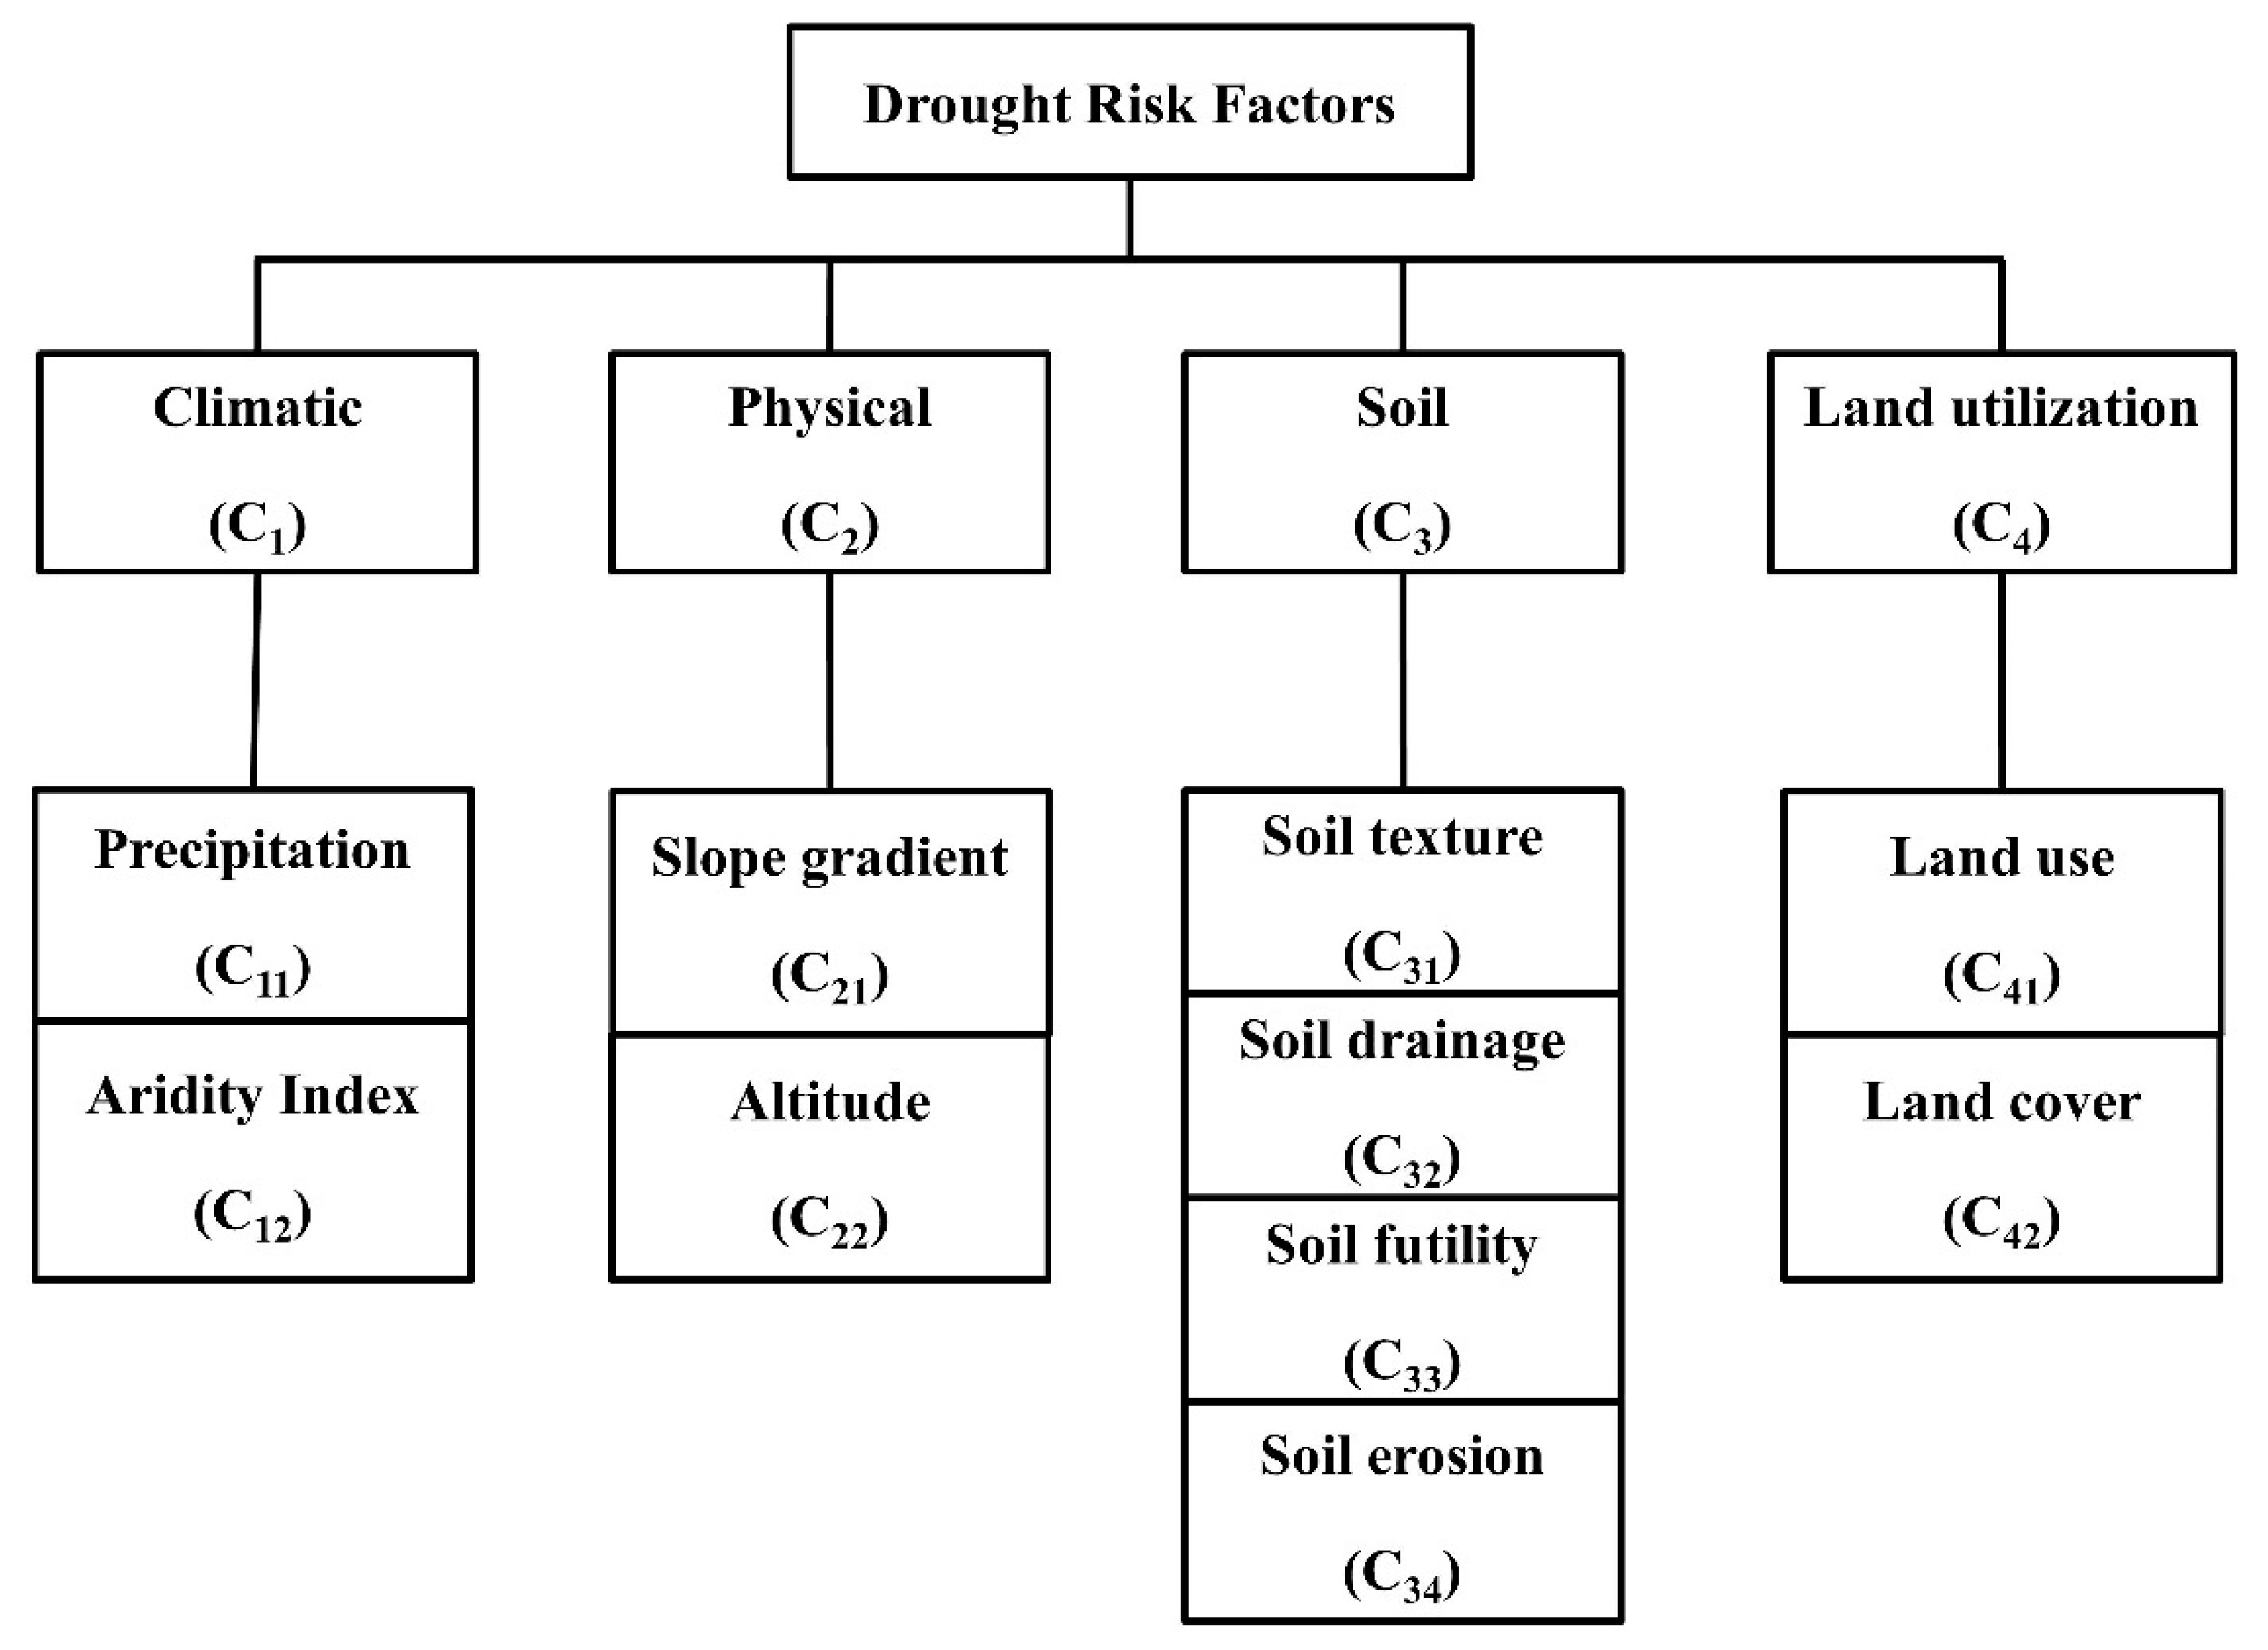
In FAHP model, a combination of AHP and fuzzy sets is used to weight the effective factors contributing to drought and to model drought risk. The most important drought risk factors were filtered out by AHP and a multi-level index system was constructed based on the relationship between the factors and the sub-criteria (attribute). Considering the actual situation in the UPRB area, the ten sub-criteria used as the index system were categorized into factors which were climatic, physical, soil and land utilization systems, as shown in Figure 2.
The essence of the process is decomposition of a complex problem into a hierarchy with a goal at the top of the hierarchy, criteria and sub-criteria at levels and sub-levels of the hierarchy. There are ten pairwise comparison matrices including: A climatic sub-criteria comparison matrix (C11 and C12), a physical sub-criteria comparison matrix (C21 and C22), a soil sub-criteria comparison matrix (C31, C32, C33, C34) and a land utilization sub-criteria comparison matrix (C41 and C42). The fuzzy triangular numbers along with linguistic variables (Table 1) were used to express the relative importance of criteria and sub-criteria in the five matrices.
The algorithms for the analysis using FAHP are as follows. The comparison of the fuzzy values was performed using fuzzy numbers (FNs) 1, 3, 5, 7 and 9 (Table 3). The determined relative weight of each drought factor was calculated using the pairwise comparison data between each pair of risk criterion in the same hierarchy. The judgment matrix was generated by comparing the index of the same level one by one. The fuzzy weight factor for each sub-criterion was calculated using a geometric mean technique. Ten pairwise comparison matrices were developed using Equations (2) and (3). The calculation using the TFNs was then performed. The ten sub-criteria system were calculated and structured according to the relationship between factors as shown in Table 3.
The defuzzification of weight was calculated using centroid average (CA) [95,96] which was the centroid of a triangular fuzzy number = (l, m, n). Defuzzification is the process of transforming a fuzzy output from the fuzzy inference system into a crisp output. The centroid defuzzification method defined the centroid coordinate of in the horizontal axis as its defuzzified value [97,98]), where the output obtained is a crisp quantity. Finally, the consistency test to verify conformity of the calculation results was carried out. To calculate the CR, the eigenvalue ( of the pairwise comparison matrix was derived using Equations (6) and (7).
The drought risk factors and sub-criteria of the UPRB were analyzed using the FAHP model. The weighted sum from each layer was calculated in order to classify levels of drought risks. Following this process, the areas at risk were mapped using the ArcGIS software. The five different levels of drought were very high, high, moderate, low and very low.
3. Results and Discussion
3.1. Factors Affecting Drought Risk in the UPRB
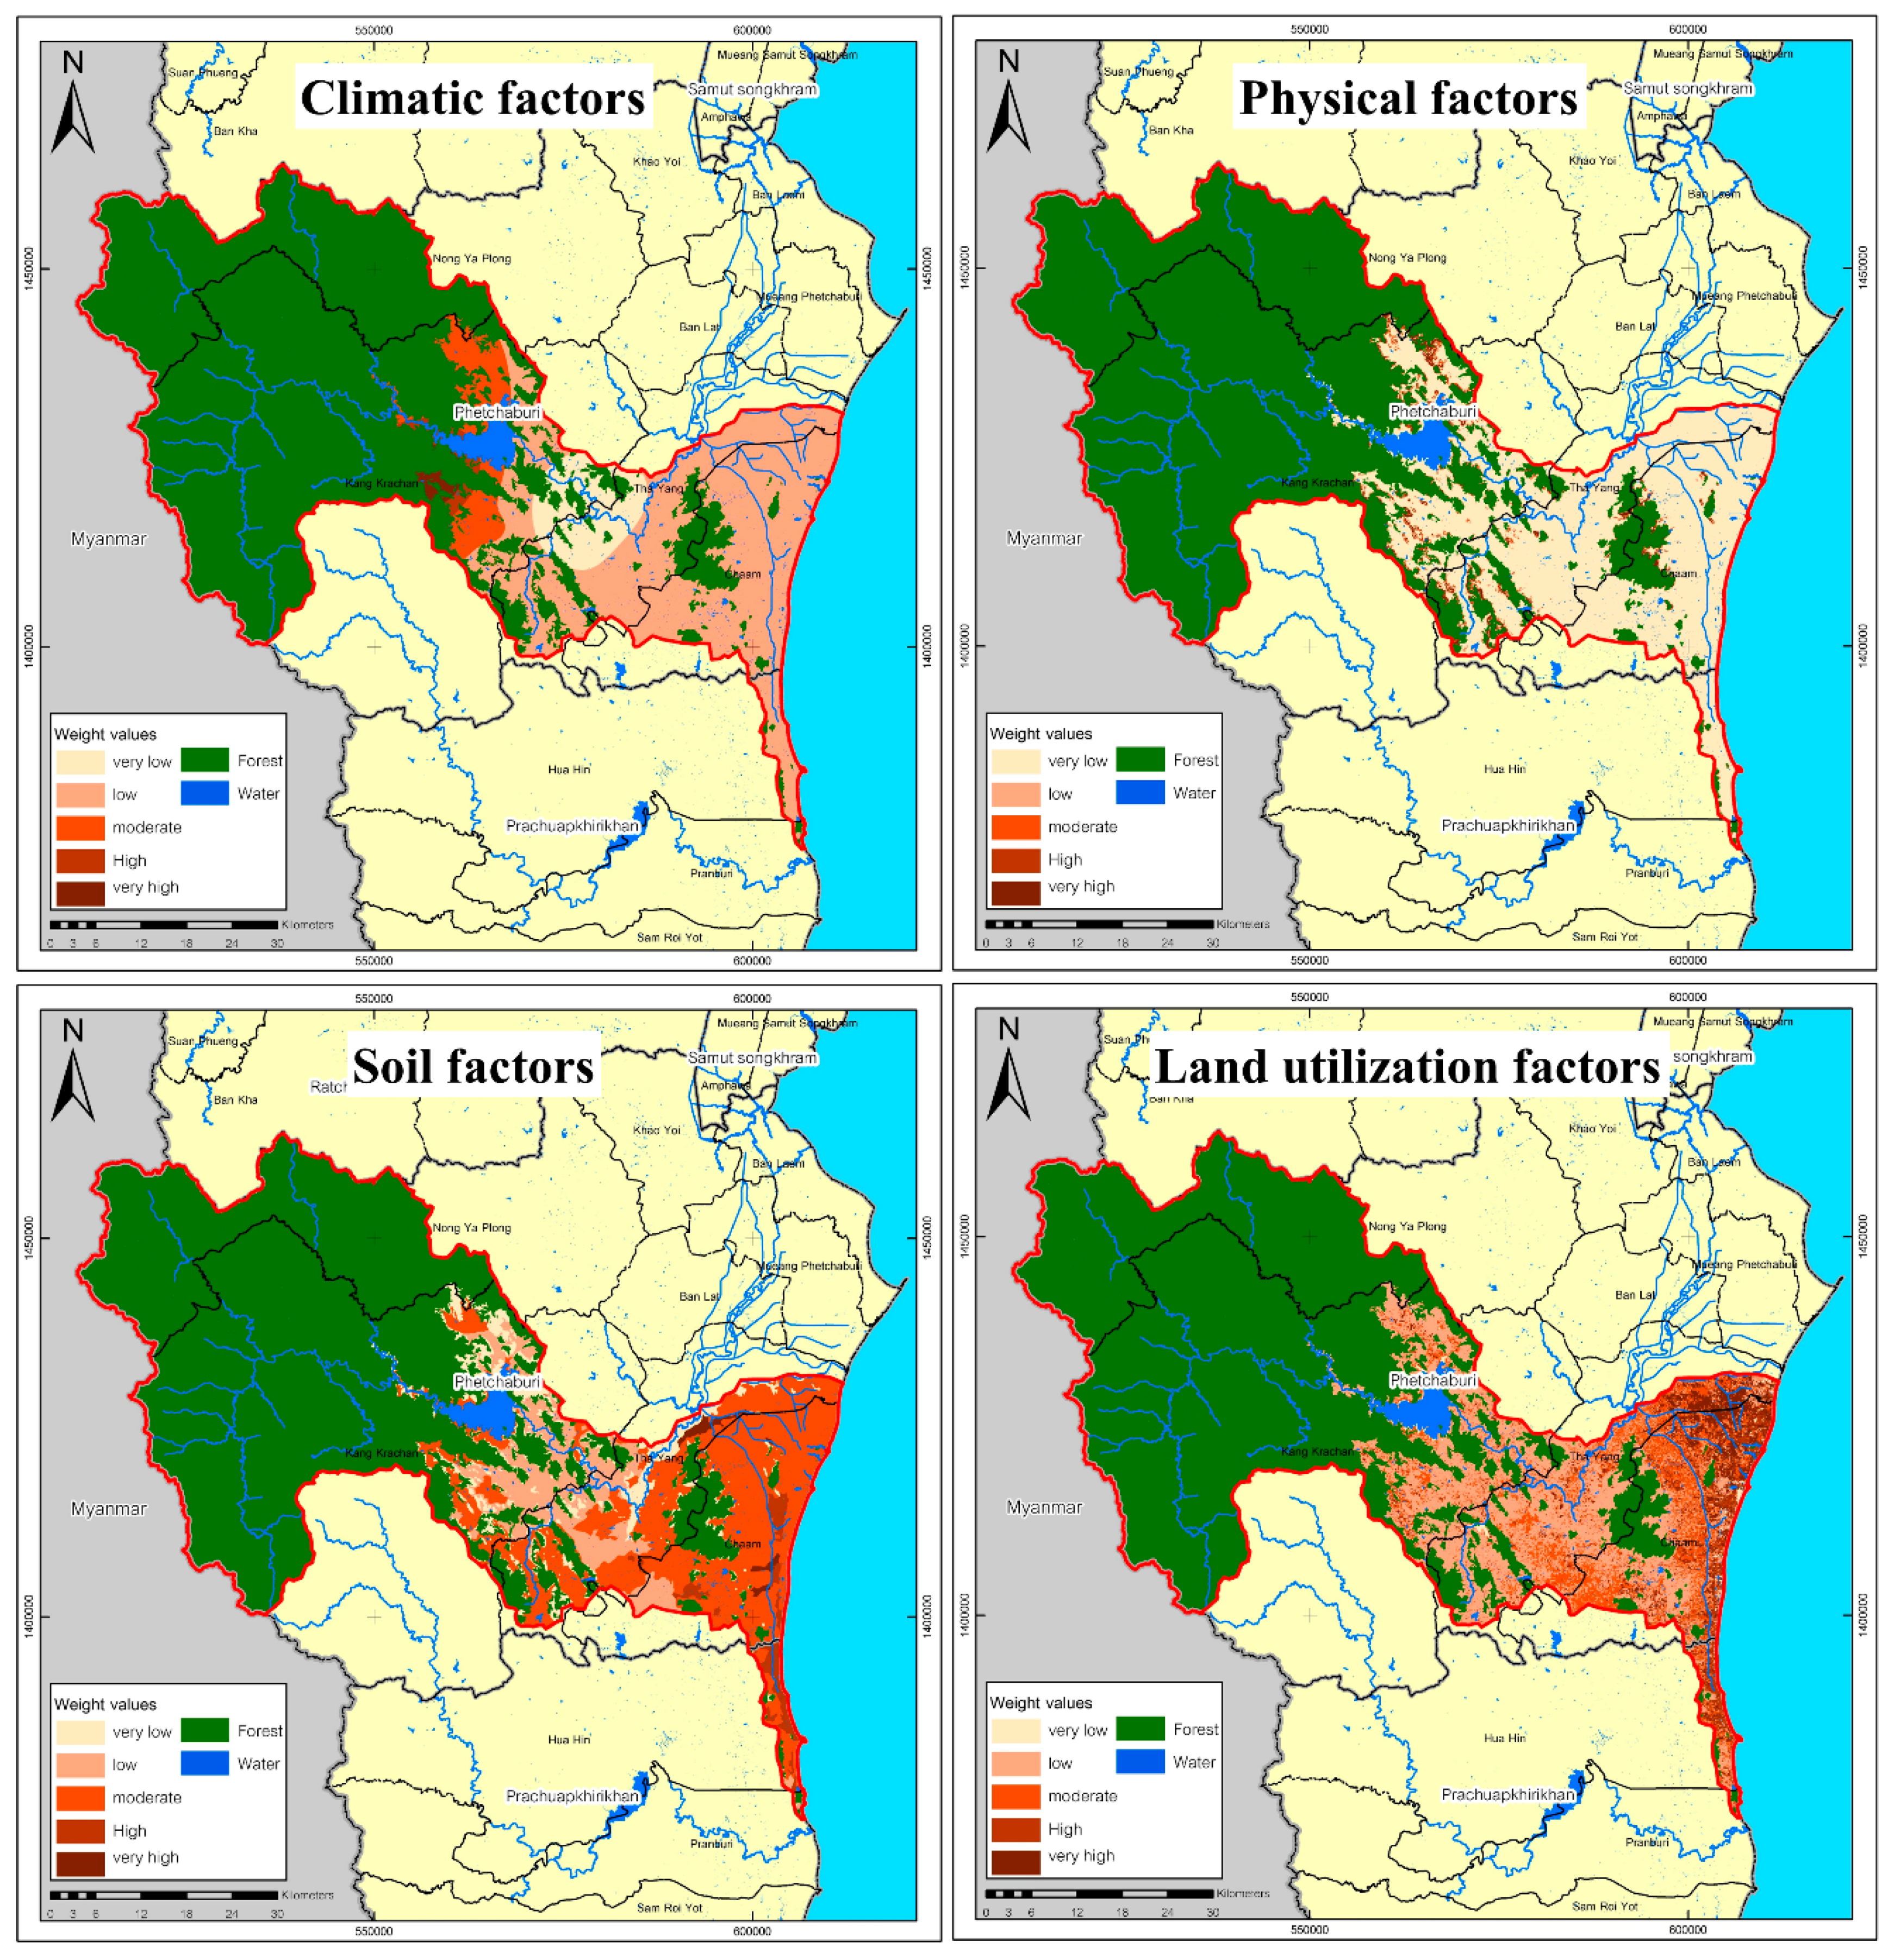
The average annual precipitation in the basin is 943.50 mm. The precipitation data were analyzed with areal data using equal interval. The result indicated that the major part of the UPRB (64.0% by area) is between 842.95–982.16 mm, which was most of the area in the middle part of the basin and some area located in the eastern part at the border of the National Park. This level was considered as risky for drought. The AI of the area at risk was between 0.20 and 1.00 while the AI in most of the area (92.82%) was between 0.50 and 0.65, a value considered to be drought-affected [5].
In Keang Krachan National Park, which has a gradient 75%–100% and a high level of precipitation, the majority of the basin (67.07%) is a >35% forested slope. The rest of the area is covered by various soil textures: sandy loam (6.36%), sand (5.22%), clay (5.00%), powdery sand (2.13%), loam (6.17%) and saline soil (1.09%). Of the area in the central part of the basin, 22.45% has very low soil fertility and only 2.43% has high fertility. Good water drainage was measured in 17.97% of the area. The northeastern part had a low to very low water drainage capacity. The extent of soil particle transportation depends on the gradient of the area. It was estimated that 63.43% of the basin area had a low soil erosion rate and 1% is very high. Bare land is found in some parts of middle areas.
Land use statistics revealed that 84.85%, 2915.96 km2, of the basin was scattered forest. Agriculture accounted for 279.76 km2 (8.12%) and was situated mostly in the middle and the lower part of the basin downstream from the Kaeng Krachan Dam. The use of bulldozers for land clearing for farming was common (4.35%) in the central part of basin. Most of the residential buildings (1.43% of the basin) are located downstream.
The analysis of the priority of factors (Table 4, Figure 3) revealed that climatic factors had the highest relative weight followed by soil, land utilization and physical factors, respectively. Among the ten sub-criteria, the most significant factors were the precipitation level (a climatic factor) and slope gradient (a physical factor).
The results of this study are different from those of Suvachananonda [56] who indicated that the slope gradient and soil drainage were more significantly related to drought in UPRB than rainfall. The difference in the factor analyses is due to the tools used. In our study stepwise multiple regression analysis was used to identify the relationship between a single response variable with two or more controlled variables. Highly related variables or inputs lead to high errors. However, using a number of normal scale variations causes a low-level relationship which prevents independent variables from being chosen for calculation. The independent variable was important because it has an impact on the dependent variables. FAHP was an appropriate tool for prioritizing the factors and the criteria, organizing them into a hierarchical order and analyzing the data using the pairwise comparison technique [31,39,40,41,45,82]. FAHP is able to analyse a large number of variables that are closely related and it is appropriate for environmental risk factor analysis and prediction. Many investigations show that the FAHP method is effective at yielding positive results (e.g., [24,29,31,33,39,40]).
The tools and methods used for risk factor analysis influence the drought risk analysis itself. Moreover, specific characteristics found in the area are also keys to the drought. The characteristics contributing to droughts and desertification included physical and climatic characteristics and human activities as evidenced by several studies using FAHP method in watershed areas, as, for example, at Lam Ta Kong [39] which concluded that soil factors, followed by the physical characteristics were the most significant. Soil texture, soil fertility, slope gradient, precipitation and soil salinity were the five sub-criteria contributing to drought problems. Since spatial factors are critical for risk assessment in certain areas it is necessary to take into account both physical and spatial factors in assessing drought and desertification in order to support effective mitigation and management.
3.2. Areas at Risk of Drought in the UPRB
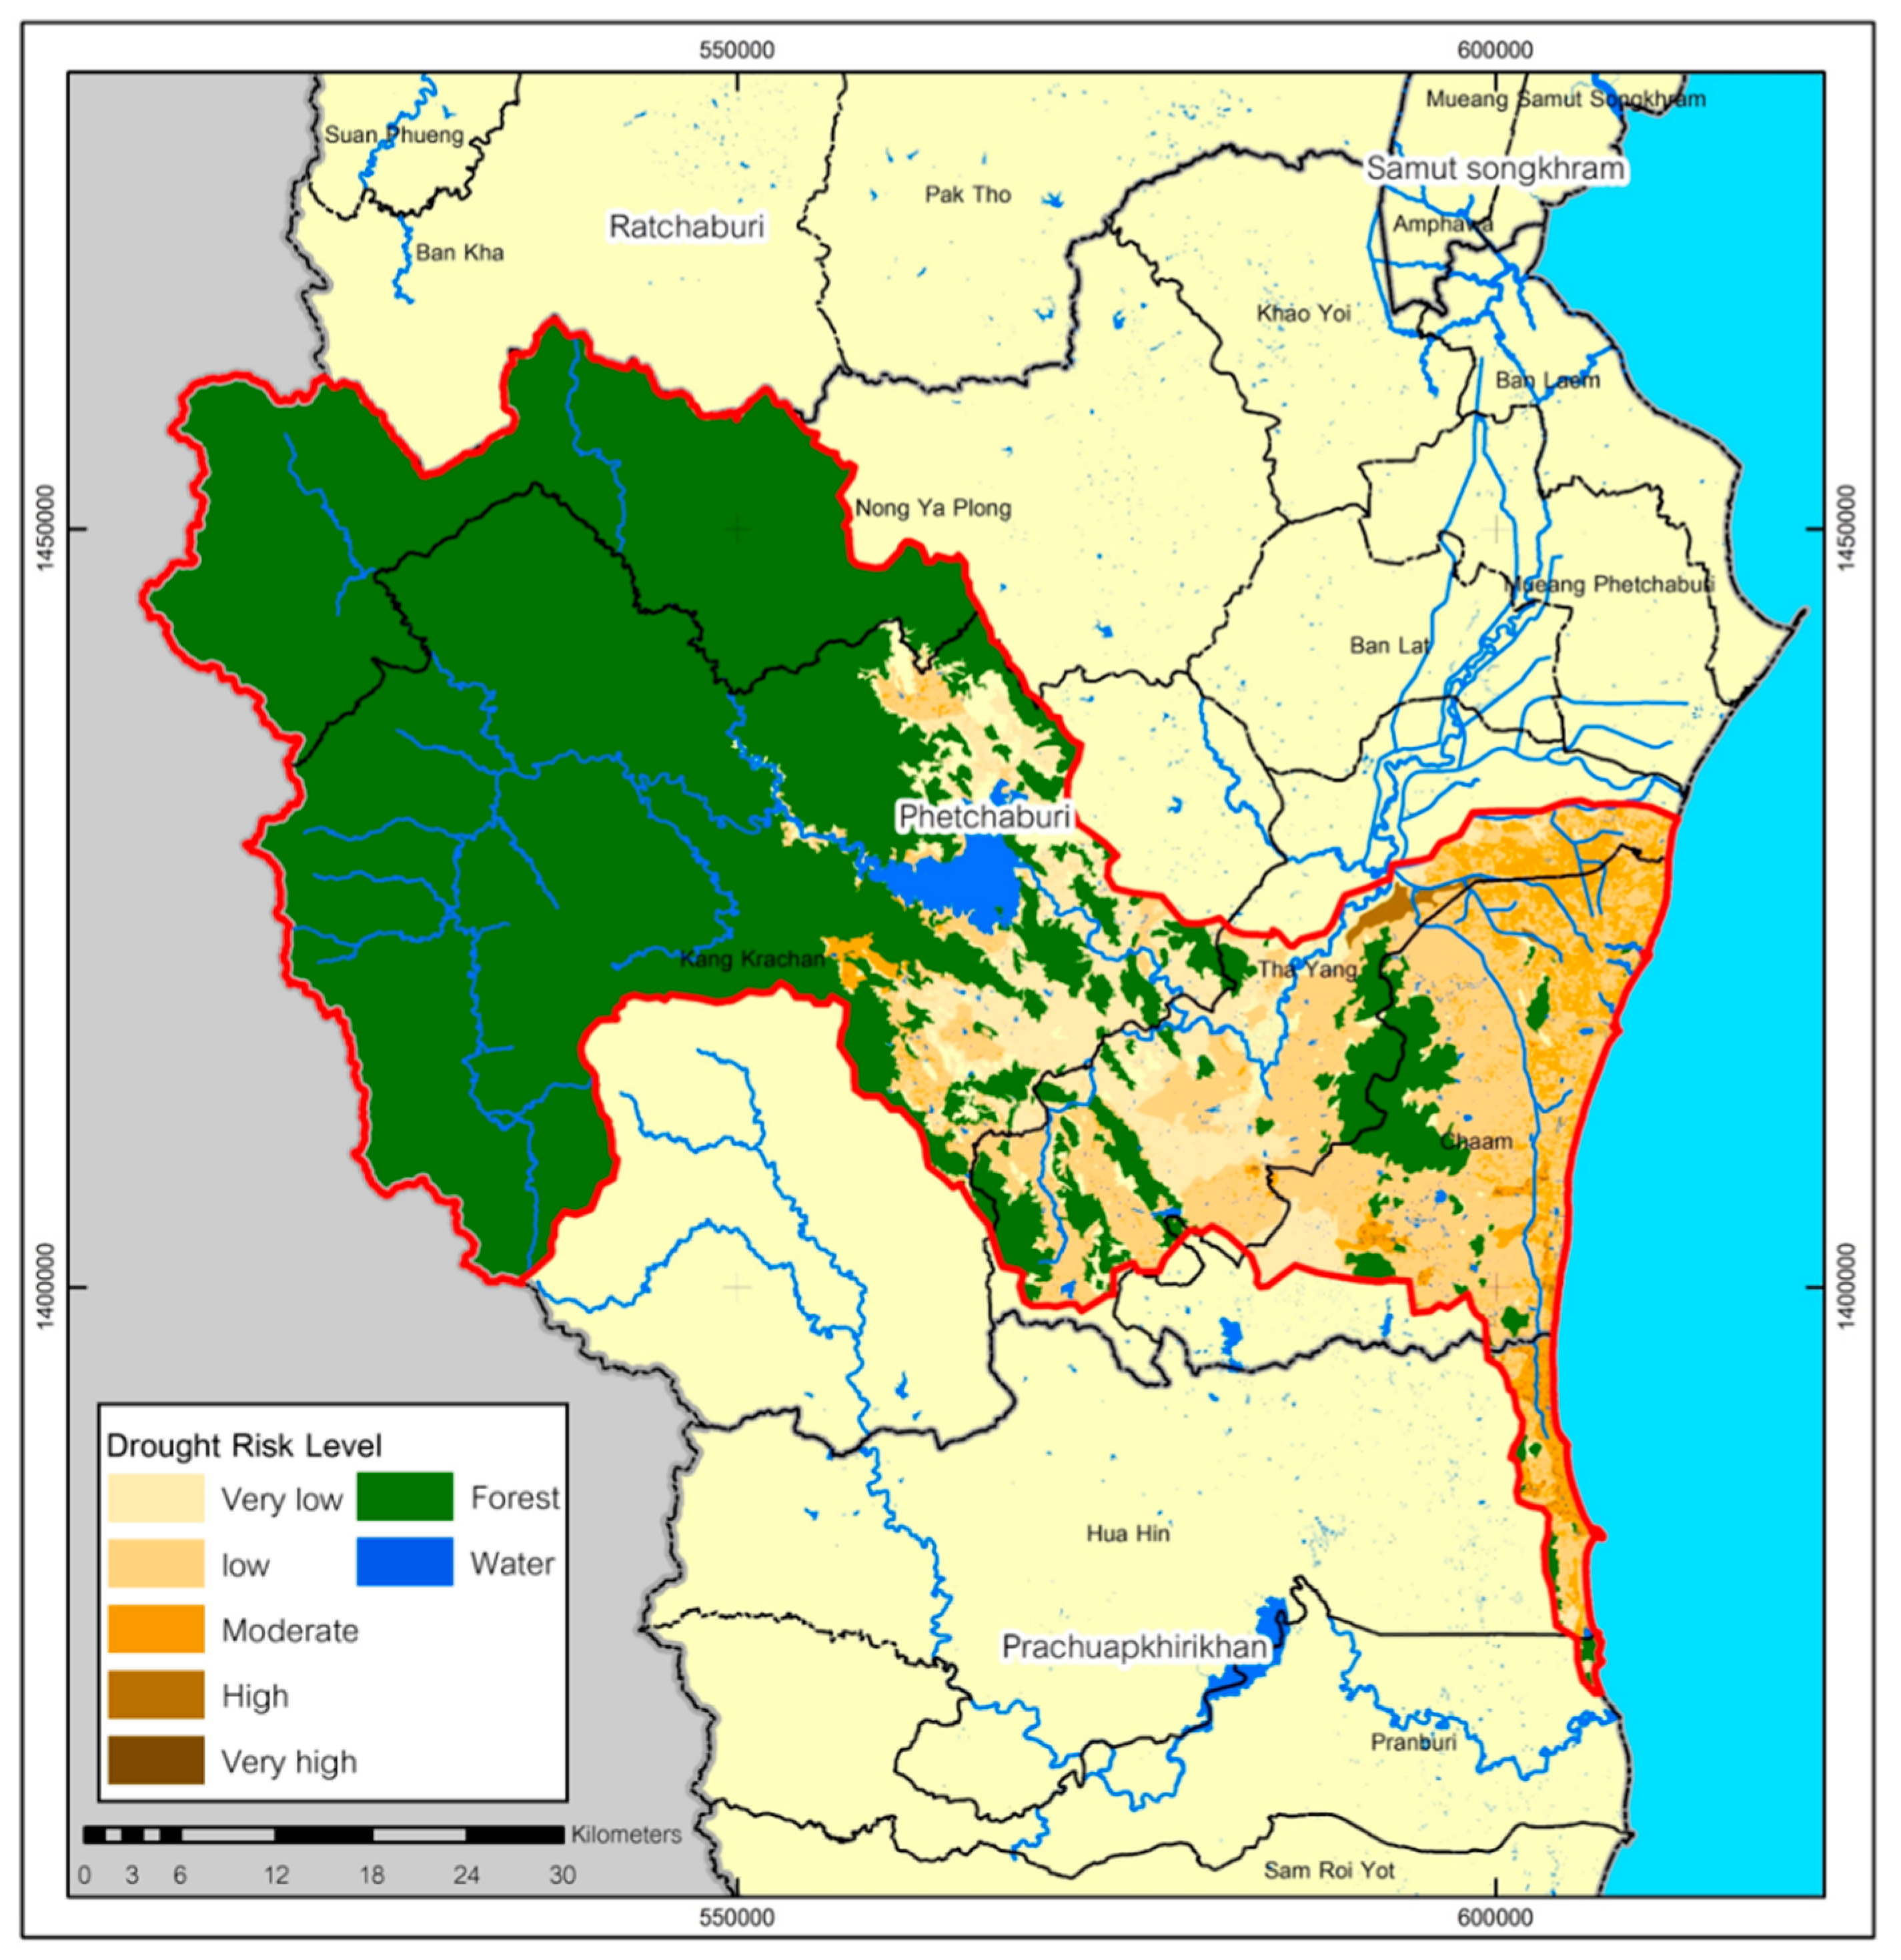
Approximately 726.33% km2 (21.08%) of the study area was found to be at a moderate risk of drought. Areas at a high risk of drought covered 5.79% of the total area, while only 0.07% is considered to have a very high risk (Figure 4).
Areas at a moderate risk of drought are common throughout the basin, especially in the center and downstream. These areas had a low annual precipitation and high soil drainage. Although, the central part of the basin is mostly a level plain, human activities such as using bulldozers expose the topsoil and destroy the vegetation. Moreover, land use has changed from forests to agricultural and residential use on bare land. Such changes in land use typically lead to a decreased rainfall and increased annual runoff [80,99,100,101], making it vulnerable to erosion [69]. Furthermore, the soil had low fertility, which poses a higher risk of both drought [6,9,102,103] and desertification [4,5]. Areas at a high risk of drought were in parts of the middle of the basin, where the average precipitation was less than 900 cm3/year. Sandy loam has very low fertility but very good drainage and therefore a low water holding capacity, high erosion rate and high degradation [4,73,104], which in turn affects vegetation [6,67,71]. The rate of water loss is accelerated without vegetation [7,67]. The agricultural areas were mostly located in the plain, which had a low gradient level of 2%–5%, although some agriculture is carried out in an area with a steep gradient of 75%–100%. Most of the agriculture in the plain had high erosivity that may have resulted from the inappropriate land use. Therefore, the area was considered to be at a relatively high risk of drought.
Although the major drought risk factors in this area were climatic (precipitation) and physical (slope gradient), it is also necessary to consider the land use and changes in land use [4,73,102,105]. The majority of the study area was covered with forests, which, by and large, sustain soil resources, maintain humidity and reduce both the loss of water from the soil [7,66,102,106], and the rate of soil erosion [104,107,108], and hence the desertification risk [4,5]. This explains why drought does not usually occur upstream at the higher elevation.
The overall area of the basin was at a moderate drought risk level; previous studies showed that some areas were at risk of desertification [58]. Therefore, an appropriately planned development of the area is necessary to establish preventive measures for possible droughts. In particular, areas at high risk of drought defining land use and establishing human activities suitable for the capacity of the region.
4. Conclusions and Recommendations
The upstream area of the Upper Phetchaburi River Basin was deemed to be at a moderate risk of drought although some parts were at a high and a very high risk. Areas at risk were those in the plain areas that are used for agricultural and economic purposes as is also true of the downstream area where communities are located. Three groups according to their appropriate mitigations are recognized. The first group is in the upper areas of Kaeng Krachan National Park that follow mitigations enforced by Department of National Parks, Wildlife and Plant Conservation. Forest areas are crucial for moist content and precipitation rate.
The other two are mid-stream and downstream. Relevant public sectors should initiate mitigations and conservation plans to ensure that changes in land use are appropriate to prevent drought and desertification. Agricultural areas in the downstream areas suffered from a risk of high erosion. Therefore, farming with machines that leaves the topsoil exposed should be prohibited. Cover vegetation and planting for soil amelioration should be encouraged. Vetivers, for example, have a very effective root system that holds on tightly to the soil and retains moisture. Moreover, the use of agrochemical pesticides and monocropping should be restricted while crop rotation and organic farming should be encouraged. Organic soil amelioration materials from sources such as biochar should be used. Biochar is effective at reducing rate, retaining moisture and therefore increases the quality and quantity of yields.
Building small and medium sized reservoirs or cheek dams in several areas is an effective way to increase moisture content both in the soil and in the atmosphere. The reservoirs store and make water resources available for both agriculture and human and animal consumption. Preserving the forest areas midstream and downstream also contributes to the hydrology of the area.
Author Contributions
Conceptualization, S.W.; data curation, S.W.; formal analysis, S.W.; investigation, S.W.; methodology, S.W.; project administration, S.W.; supervision, T.S.; writing—original draft, S.W.; writing—review and editing, T.S.
Funding
This research was financial supported by the “Physical Drought Risk Assessment of Upper Phetchaburi River Basin, Phetchaburi Province”, Ratchadaphisek Somphot Endowment Fund, Chulalongkorn University, Climate Change Cluster (RES560530094-CC).
Acknowledgments
The sattlelite imagery was supported by Geo-Informatic and Space Technology Development Agency (GISTDA).
Conflicts of Interest
The authors declare no conflict of interest.
References
- Wang, Y.; Xiao, D.; Li, Y.; Li, X. Soil salinity evolution and its relationship with dynamics of groundwater in the oasis of inland river basins, case study from the Fubei region of Xinjiang Province. China J. Environ. Monitor. 2008, 140, 291–302. [Google Scholar] [CrossRef] [PubMed]
- Rangecroft, S.; Birkinshaw, S.; Rohse, M.; Day, R.; McEwen, L.; Makaya, E.; Van Loon, A. Hydrological modelling as a tool for interdisciplinary workshops on future drought. Prog. Phys. Geogr. 2018, 42, 237–256. [Google Scholar] [CrossRef] [Green Version]
- Van Loon, A.F.; Stahl, K.; Di Baldassarre, G.; Clark, J.; Rangecroft, S.; Wanders, N.; Gleeson, T.; Van Dijk, A.I.J.M.; Tallaksen, L.M.; Hannaford, J.; et al. Drought in a human-modified world: Reframing drought definitions, understanding, and analysis approaches. Hydrol. Earth Syst. Sci. 2016, 20, 3631–3650. [Google Scholar] [CrossRef]
- Wijitkosum, S. The impact of land use and spatial changes on desertification risk in degraded areas in Thailand. Sustain. Environ. Res. 2016, 26, 84–92. [Google Scholar] [CrossRef] [Green Version]
- Wijitkosum, S. Critical Factors Affecting the Desertification in Pa Deng, Adjoining Area of Kaeng Krachan National Park, Thailand. Environ. Asia 2014, 7, 87–98. [Google Scholar]
- Santos, F.; Torn, M.S.; Bird, J.A. Biological degradation of pyrogenic organic matter in temperate forest soils. Soil Biol. Biochem. 2012, 51, 115–124. [Google Scholar] [CrossRef]
- Bouabid, R.; Rouchdi, M.; Badraoui, M.; Diab, A.; Louafi, S. Assessment of land desertification based on the MEDALUS approach and elaboration of an action plan: The case study of the Souss River Basin, Morocco. In Land Degradation and Desertification: Assessment, Mitigation and Remediation; Zdruli, P., Pagliai, M., Kapur, S., Cano, A.F., Eds.; Springer: Dordrecht, The Netherlands, 2010; pp. 131–145. [Google Scholar]
- Van Loon, A.F. Hydrological drought explained. WIREs Water 2015, 2, 359–392. [Google Scholar] [CrossRef] [Green Version]
- Diffenbaugh, N.S.; Swain, D.L.; Touma, D. Anthropogenic warming has increased drought risk in California. Proc. Natl. Acad. Sci. USA 2015, 112, 3931–3936. [Google Scholar] [CrossRef] [PubMed] [Green Version]
- Forzieri, G.; Feyen, L.; Rojas, R.; Flörke, M.; Wimmer, F.; Bianchi, A. Ensemble projections of future streamflow droughts in Europe. Hydrol. Earth Syst. Sci. 2014, 18, 85–108. [Google Scholar] [CrossRef] [Green Version]
- Dabanlı, İ.; Mishra, A.K.; Şen, Z. Long-term spatio-temporal drought variability in Turkey. J. Hydrol. 2017, 552, 779–792. [Google Scholar] [CrossRef]
- Liu, X.; Zhu, X.; Pan, Y.; Li, S.; Liu, Y.; Ma, Y. Agricultural drought monitoring: Progress, challenges, and prospects. J. Geogr. Sci. 2016, 26, 750–767. [Google Scholar] [CrossRef]
- Kamali, B.; Kouchi, D.H.; Yang, H.; Abbaspour, K.C. Multilevel Drought Hazard Assessment under Climate Change Scenarios in Semi-Arid Regions—A Case Study of the Karkheh River Basin in Iran. Water 2017, 241, 1–17. [Google Scholar] [CrossRef]
- Kim, J.-M.; Sasaki, T.; Ueda, M.; Sako, K.; Seki, M. Chromatin changes in response to drought, salinity, heat, and cold stresses in plants. Front. Plant Sci. 2015, 6, 114. [Google Scholar] [CrossRef]
- Wada, Y.; Reager, J.T.; Chao, B.F.; Wang, J.; Lo, M.-H.; Song, C.; Li, Y.; Gardner, A.S. Recent Changes in Land Water Storage and its Contribution to Sea Level Variations. Surv. Geophys. 2017, 38, 131–152. [Google Scholar] [CrossRef]
- Masih, I.; Maskey, S.; Mussá, F.E.E.; Trambauer, P. A review of droughts on the African continent: A geospatial and long-term perspective. Hydrol. Earth Syst. Sci. 2014, 18, 3635–3649. [Google Scholar] [CrossRef]
- Wen, L.; Rogers, K.; Ling, J.; Saintilan, N. The impacts of river regulation and water diversion on the hydrological drought characteristics in the Lower Murrumbidgee River, Australia. J. Hydrol. 2011, 405, 382–391. [Google Scholar] [CrossRef]
- Ahmadalipour, A.; Moradkhani, H. Analyzing the uncertainty of ensemble-based gridded observations in land surface simulations and drought assessment. J. Hydrol. 2017, 555, 557–568. [Google Scholar] [CrossRef]
- Srinivasan, V.; Konar, M.; Sivapalan, M. A dynamic framework for water security. Water Secur. 2017, 1, 12–20. [Google Scholar] [CrossRef]
- Wang, L.; Yuan, X.; Xie, Z.; Wu, P.; Li, Y. Increasing flash droughts over China during the recent global warming hiatus. Sci. Rep. 2016, 6, 30571. [Google Scholar] [CrossRef] [PubMed] [Green Version]
- Zadeh, L.A. Fuzzy sets. Inform. Control 1965, 8, 338–353. [Google Scholar] [CrossRef] [Green Version]
- Balezentiene, L.; Streimikiene, D.; Balezentis, T. Fuzzy decision support methodology for sustainable energy crop selection. Renew. Sustain. Energy Rev. 2013, 17, 83–93. [Google Scholar] [CrossRef]
- Wu, Z.; Jina, B.; Xu, J. Local feedback strategy for consensus building with probability-hesitant fuzzy preference relations. Appl. Soft Comput. 2018, 67, 691–705. [Google Scholar] [CrossRef]
- Tian, J.; Yan, F.Z. Fuzzy Analytic Hierarchy Process for Risk Assessment to General assembling of Satellite. J. Appl. Res. Technol. 2013, 11, 568–577. [Google Scholar] [CrossRef]
- Takács, M. Multilevel Fuzzy Approach to the Risk and Disaster Management. Acta Polytechnica Hungarica 2010, 7, 91–102. [Google Scholar]
- Li, D.-F.; Wang, Y.-C.; Liu, S.; Shan, F. Fractional programming methodology for multi-attribute group decision-making using IFS. Appl. Soft Comput. 2009, 9, 219–225. [Google Scholar] [CrossRef]
- Vaidya, O.S.; Kumar, S. Analytic Hierarchy Process: An Overview of Applications. Eur. J. Oper. Res. 2006, 169, 1–29. [Google Scholar] [CrossRef]
- Chang, D.-Y. Applications of the extent analysis method on fuzzy AHP. Eur. J. Oper. Res. 1996, 95, 649–655. [Google Scholar] [CrossRef]
- Zhao, B.; Tang, T.; Ning, B. Applying Hybrid Decision-Making Method Based on Fuzzy AHP-WOWA Operator for Emergency Alternative Evaluation of Unattended Train Operation Metro System. Math. Probl. Eng. 2016, 2016, 4105079. [Google Scholar] [CrossRef]
- Shaw, K.; Shankar, R.; Yadav, S.S.; Thakur, L.S. Supplier selection using fuzzy AHP and fuzzy multi-objective linear programming for developing low carbon supply chain. Expert Syst. Appl. 2012, 39, 8182–8192. [Google Scholar] [CrossRef]
- Hosseini-Moghari, S.-M.; Araghinejad, S.; Azarnivand, A. Fuzzy analytic hierarchy process approach in drought management: Case study of Gorganrood basin, Iran. J. Water Supply Res. Technol. 2017, 66, 207–218. [Google Scholar] [CrossRef]
- Zhao, H.; Yao, L.; Mei, G.; Liu, T.; Ning, Y. A Fuzzy Comprehensive Evaluation Method Based on AHP and Entropy for a Landslide Susceptibility Map. Entropy 2017, 19, 396. [Google Scholar] [CrossRef]
- Verma, S.; Chaudhri, S. Integration of fuzzy reasoning approach (FRA) and fuzzy analytic hierarchy process (FAHP) for risk assessment in mining industry. J. Ind. Eng. Manag. 2014, 7, 1347–1367. [Google Scholar] [CrossRef]
- de Brito, M.; Evers, M. Multi-criteria decision-making for flood risk management: A survey of the current state of the art. Nat. Hazards Earth Syst. Sci. 2016, 16, 1019–1033. [Google Scholar] [CrossRef]
- Zou, Q.; Zhou, J.; Zhou, C.; Song, L.; Guo, J. Comprehensive flood risk assessment based on set pair analysis-variable fuzzy sets model and fuzzy AHP. Stoch. Environ. Res. Risk Assess. 2013, 27, 525–546. [Google Scholar] [CrossRef]
- Thungngern, J.; Sriburi, T.; Wijitkosum, S. Analytic Hierarchy Process for Stakeholder Participation in Integrated Water Resources Management. Eng. J. 2017, 21, 87–103. [Google Scholar] [CrossRef] [Green Version]
- Aminbakhsh, S.; Gunduz, M.; Sonmez, R. Safety risk assessment using analytic hierarchy process (AHP) during planning and budgeting of construction projects. J. Saf. Res. 2013, 46, 99–105. [Google Scholar] [CrossRef] [PubMed]
- Sa-nguansilp, C.; Wijitkosum, S.; Sriprachote, A. Agricultural Drought Risk Assessment in Lam Ta Kong Watershed. Int. J. Geoinf. 2017, 13, 37–43. [Google Scholar]
- Wijitkosum, S. Fuzzy AHP for Drought Risk Assessment in Lam Ta Kong Watershed, the North-eastern Region of Thailand. Soil Water Res. 2018, 13, 218–225. [Google Scholar]
- Papaioannou, G.; Vasiliades, L.; Loukas, A. Multi-Criteria Analysis Framework for Potential Flood Prone Areas Mapping. Water Resour. Manag. 2015, 29, 399–418. [Google Scholar] [CrossRef]
- Aher, P.D.; Adinarayana, J.; Gorantiwar, S.D. Prioritization of watersheds using multi-criteria evaluation through fuzzy analytical hierarchy process. Agric. Eng. Int. CIGR J. 2013, 15, 11–18. [Google Scholar]
- Sadeghravesh, M.H.; Khosravi, H.; Ghasemian, S. Application of fuzzy analytical hierarchy process for assessment of combating-desertification alternatives in central Iran. Nat. Hazards 2014, 75, 653–667. [Google Scholar] [CrossRef]
- Parhizgara, S.M.; Shahidi, A.; Pourreza-Bilondic, M.; Khashei-Siukib, A. Comparison of classic and fuzzy analytic hierarchy processes for mapping the flood hazard of Birjand plain. Water Harvest. Res. 2017, 2, 43–56. [Google Scholar]
- Rahmati, O.; Zeinivand, H.; Besharat, M. Flood hazard zoning in Yasooj region, Iran, using GIS and multi-criteria decision analysis. Geomat. Natl. Hazards Risk 2016, 7, 1000–1017. [Google Scholar] [CrossRef]
- Dehghani, M.; Ghasemi, H.; Malekian, A. Spatial prioritizing of flood reduction and erosion control using fuzzy logic (Case study: Forg Watershed). Rangel. Watershed Manag. J. J. Natl. Resour. Iran. 2014, 66, 28–39. [Google Scholar]
- Mijani, N.; Neysani Samani, N. Comparison of Fuzzy-Based models in landslide hazard mapping. Int. Arch. Photogramm. Remote Sens. Spat. Inf. Sci. 2017, 42, XLII-4/W4. [Google Scholar] [CrossRef]
- Feizizadeh, B.; Roodposhti, M.S.; Jankowski, P.; Blaschke, T. A GIS-based extended fuzzy multi-criteria evaluation for landslide susceptibility mapping. Comput. Geosci. 2014, 73, 208–221. [Google Scholar] [CrossRef] [PubMed] [Green Version]
- Jaafari, A.; Najafi, A.; Pourghasemi, H.R.; Rezaeian, J.; Sattarian, A. GIS-based frequency ratio and index of entropy models for landslide susceptibility assessment in the Caspian forest, northern Iran. Int. J. Environ. Sci. Technol. 2014, 4, 909–926. [Google Scholar] [CrossRef]
- Patel, D.P.; Srivastava, P.K. Flood Hazards Mitigation Analysis Using Remote Sensing and GIS: Correspondence with Town Planning Scheme. Water Resour. Manag. 2013, 27, 2353–2368. [Google Scholar] [CrossRef]
- Pourghasemi, H.R.; Moradi, H.R.; Fatemi Aghda, S.M. Landslide susceptibility mapping by binary logistic regression, analytical hierarchy process, and statistical index models and assessment of their performances. Nat. Hazards 2013, 69, 749–779. [Google Scholar] [CrossRef]
- Haq, M.; Akhtar, M.; Muhammad, S.; Paras, S.; Rahmatullah, J. Techniques of Remote Sensing and GIS for flood monitoring and damage assessment: A case study of Sindh province, Pakistan. Egypt. J. Remote Sens. Space Sci. 2012, 15, 135–141. [Google Scholar] [CrossRef] [Green Version]
- Belal, A.-A.; El-Ramady, H.R.; Mohamed, E.S.; Saleh, A.M. Drought risk assessment using remote sensing and GIS techniques. Arab. J. Geosci. 2014, 7, 35–53. [Google Scholar] [CrossRef]
- Pradhan, B.; Abokharima, M.H.; Jebur, M.N.; Tehrany, M.S. Land subsidence susceptibility mapping at Kinta Valley (Malaysia) using the evidential belief function model in GIS. Nat. Hazards 2014, 73, 1019–1042. [Google Scholar] [CrossRef]
- Chen, W.; Yuan, J.; Li, M. Application of GIS/GPS in Shanghai Airport Pavement Management System. Procedia Eng. 2012, 29, 2322–2326. [Google Scholar] [CrossRef] [Green Version]
- Lin, H.; Chen, M.; Zhang, C.; Hu, M. Virtual Geographic Environments: Feeling it in person and knowing it beyond reality. In Proceedings of the 4th International Conference on Cartography and GIS, Bulgarian Cartographic Association, Albena, Bulgaria, 18–22 June 2012. [Google Scholar]
- Suvachananonda, T. Land Characteristics Affected to Drought of Phetchaburi Province. Master’s Thesis, Mahidol University, Bangkok, Thailand, 2004. [Google Scholar]
- Voravong, S.; Chunkao, K.; Bualert, S. Handling Water through Irrigation Watershed Management for Coping with Stream Pollution Dilution in Phetchaburi River, Thailand. Modern Appl. Sci. 2014, 8, 195–209. [Google Scholar] [CrossRef]
- Land Development Department. Kingdom of Thailand National Action Programme for Combating Desertification. Available online: http://www.unccd.int/actionprogrammes/asia/national/2004/thailand-eng.pdf (accessed on 23 October 2018).
- UNISDR. Drought Risk Reduction Framework and Practices: Contributing to the Implementation of the Hyogo Framework for Action; United Nations secretariat of the International Strategy for Disaster Reduction (UNISDR): Geneva, Switzerland, 2009. [Google Scholar]
- Panagoulia, D.G.; Dimou, D. Climatic instability and low-flow regimes. In Proceedings of the Water Resources Management under Drought or Water Shortage Conditions, EWRA 95 Symposium, Nicosia, Cyprus, 14–18 March 1995; Tsiourtis, N.X., Ed.; EWRA by A.A. Balkema: Rotterdam, The Netherlands, 1995; pp. 29–34. [Google Scholar]
- Dionysia, P.; Dimou, G. Definition and effects of droughts. In Proceedings of the Conference on Mediterranean Water Policy: Building on Existing Experience, Mediterranea Water Network, Valencia, Spain, 12–15 June 1998. [Google Scholar]
- Valipour, M. Use of surface water supply index to assessing of water resources management in Colorado and Oregon, US. Adv. Agric. Sci. Eng. Res. 2013, 3, 631–640. [Google Scholar]
- Kwon, H.-J.; Kim, S.-J. Assessment of distributed hydrological drought based on hydrological unit map using SWSI drought index in South Korea. KSCE J. Civ. Eng. 2010, 14, 923–929. [Google Scholar] [CrossRef]
- FAO. The ETo Calculator: Evapotranspiration from a Reference Surface; Food and Agriculture Organization of the United Nations: Rome, Italy, 2009. [Google Scholar]
- Wijitkosum, S. The Relationship between climatic factors and forest area case study: Huay Sai Royal development study center, Petchaburi province, Thailand. J. Environ. Res. Dev. 2011, 5, 1010–1016. [Google Scholar]
- Yang, Z.-B.; Eticha, D.; Albacete, A.; Rao, I.M.; Roitsch, T.; Horst, W.J. Physiological and molecular analysis of the interaction between aluminium toxicity and drought stress in common bean (Phaseolus vulgaris). J. Exp. Bot. 2012, 63, 3109–3125. [Google Scholar] [CrossRef] [PubMed]
- Fang, L.; Hain, C.R.; Zhan, X.; Andersonc, M.C. An inter-comparison of soil moisture data products from satellite remote sensing and a land surface model. Int. J. Appl. Earth Obs. Geoinf. 2016, 48, 37–50. [Google Scholar] [CrossRef]
- Gomiero, T. Soil Degradation, Land Scarcity and Food Security: Reviewing a Complex Challenge. Sustainability 2016, 8, 281. [Google Scholar] [CrossRef]
- Posthumus, H.; Deeks, L.K.; Rickson, R.J.; Quinton, J.N. Costs and benefits of erosion control measures in the UK. Soil Use Manag. 2015, 31, 16–33. [Google Scholar] [CrossRef]
- Gutiérrez-Vélez, V.H.; Uriarte, M.; DeFries, R.; Pinedo-Vásquez, M.; Fernandes, K.; Ceccato, P.; Baethgen, W.; Padoch, C. Land cover change interacts with drought severity to change fire regimes in Western Amazonia. Ecol. Appl. 2014, 24, 1323–1340. [Google Scholar] [CrossRef] [PubMed]
- Zhao, C.; Deng, X.; Yuan, Y.; Yan, H.; Liang, H. Prediction of Drought Risk Based on the WRF Model in Yunnan Province of China. Adv. Meteorol. 2013, 2013, 295856. [Google Scholar] [CrossRef]
- Pimentel, D.; Burgess, M. Soil Erosion Threatens Food Production. Agriculture 2013, 3, 443–463. [Google Scholar] [CrossRef] [Green Version]
- Wijitkosum, S. Impacts of land use changes on soil erosion in Pa Deng sub-district, adjacent area of Kaeng Krachan National Park, Thailand. Soil Water Res. 2012, 7, 10–17. [Google Scholar] [CrossRef]
- Bachmair, S.; Stahl, K.; Collins, K.; Hannaford, J.; Acreman, M.; Svoboda, M.; Knutson, C.; Helm Smith, K.; Wall, N.; Fuchs, B.; et al. Drought indicators revisited: The need for a wider consideration of environment and society. WIREs Water 2016, 3, 516–536. [Google Scholar] [CrossRef]
- Lorenzo-Lacruz, J.; Morán-Tejeda, E.; Vicente-Serrano, S.M.; López-Moreno, J.I. Streamflow droughts in the Iberian Peninsula between 1945 and 2005: Spatial and temporal patterns. Hydrol. Earth Syst. Sci. 2013, 17, 119–134. [Google Scholar] [CrossRef]
- Novara, A.; Sarno, M.; Pereira, P.; Cerdà, A.; Brevik, E.C.; Gristina, L. Straw uses trade-off only after soil organic carbon steady-state. Ital. J. Agron. 2018, 13, 216–220. [Google Scholar] [CrossRef]
- Land Development Department. Soil Erosion in Thailand; Land Development Department: Bangkok, Thailand, 2000. [Google Scholar]
- Bagley, J.E.; Desai, A.R.; Harding, K.J.; Snyder, P.K.; Foley, J.A. Drought and deforestation: Has land cover change influenced recent precipitation extremes in the Amazon? J. Clim. 2014, 27, 345–361. [Google Scholar] [CrossRef]
- Mokhtari, A.; Mansor, S.B.; Mahmud, A.R.; Helmi, Z.M. Monitoring the Impacts of Drought on Land Use/Cover: A Developed Object-based Algorithm for NOAA AVHRR Time Series Data. J. Appl. Sci. 2011, 11, 3089–3103. [Google Scholar] [CrossRef]
- Obojes, N.; Bahn, M.; Tasser, E.; Walde, J.; Inauen, N.; Hiltbrunner, E.; Saccone, P.; Lochet, J.; Clement, J.C.; Lavorel, S.; et al. Vegetation effects on the water balance of mountain grasslands depend on climatic conditions. Ecohydrology 2015, 8, 552–569. [Google Scholar] [CrossRef]
- Kubler, S.; Robert, J.; Derigent, W.; Voisin, A.; Traon, Y.L. A state-of the-art survey & testbed of fuzzy AHP (FAHP) applications. Expert Syst. Appl. 2016, 65, 398–422. [Google Scholar] [Green Version]
- Tseng, M.L.; Chiang, J.H.; Lan, L.W. Selection of optimal supplier in supply chain management strategy with analytic network process and choquet integral. Comput. Ind. Eng. 2009, 57, 330–340. [Google Scholar] [CrossRef]
- Dinh, L.C.; Duc, T.T. GIS and Analytic Hierarchy Process for Land Evaluation. Available online: http://docplayer.net/14799069-Gis-and-analytic-hierarchy-process-for-land-evaluation.html (accessed on 24 October 2018).
- Kabir, G.; Hasin, A.A.M. Comparative analysis Of AHP and fuzzy AHP models for multicriteria inventory classification. Int. J. Fuzzy Logic Syst. 2011, 11, 1–16. [Google Scholar]
- Zhu, K.J.; Jing, Y.; Chang, D.Y. A Discussion on Extent Analysis Method and Applications of Fuzzy AHP. Eur. J. Oper. Res. 1999, 116, 450–456. [Google Scholar] [CrossRef]
- Nazam, M.; Xu, J.; Tao, Z.; Ahmad, J.; Hashim, M. A fuzzy AHP-TOPSIS framework for the risk assessment of green supply chain implementation in the textile industry. Int. J. Supply Oper. Manag. 2015, 2, 548–568. [Google Scholar]
- Wei, W.; Xu, L.; Zhou, Z. Research and Design on Fuzzy-based Cluster Model. AASRI Procedia 2012, 1, 92–99. [Google Scholar] [CrossRef]
- Liu, H.-W.; Wang, G.-J. Multi-criteria decision-making methods based on intuitionistic fuzzy sets. Eur. J. Oper. Res. 2007, 179, 220–233. [Google Scholar] [CrossRef]
- Khazaeni, G.; Khanzadi, M.; Afshar, A. Optimum risk allocation model for construction contracts: Fuzzy TOPSIS approach. Can. J. Civ. Eng. 2012, 39, 789–800. [Google Scholar] [CrossRef]
- Saaty, T.L. The Analytic Hierarchy Process; McGraw-Hill: New York, NY, USA, 1980. [Google Scholar]
- Saaty, T.L.; Vargas, L.G. Models, Methods, Concepts & Applications of the Analytic Hierarchy Process; Springer Science & Business Media: New York, NY, USA, 2012. [Google Scholar]
- Erden, T.; Karaman, H. Analysis of earthquake parameters to generate hazard maps by integrating AHP and GIS for Küçükçekmece region. Nat. Hazards Earth Syst. Sci. 2012, 12, 475–483. [Google Scholar] [CrossRef] [Green Version]
- Pourghasemi, H.R.; Pradhan, B.; Gokceoglu, C. Application of fuzzy logic and analytical hierarchy process (AHP) to landslide susceptibility mapping at Haraz watershed, Iran. Nat. Hazards. 2012, 63, 1–32. [Google Scholar] [CrossRef]
- Wang, Y.; Li, Z.; Tang, Z.; Zeng, G. A GIS-Based Spatial Multi-Criteria Approach for Flood Risk Assessment in the Dongting Lake Region, Hunan, Central China. Water Resour. Manag. 2011, 25, 3465–3484. [Google Scholar] [CrossRef]
- Wang, Y.M. Centroid defuzzification and the maximizing set and minimizing set ranking based on alpha level sets. Comput. Ind. Eng. 2009, 57, 228–236. [Google Scholar] [CrossRef]
- Yager, R.; Filev, D. Template-based fuzzy system modeling. J. Intell. Fuzzy. Syst. 1994, 2, 39–54. [Google Scholar]
- Uehara, K.; Hirota, K. Parallel and multistage fuzzy inference based on families of α-level sets. Int. J. Inf. Sci. 1998, 106, 159–195. [Google Scholar] [CrossRef]
- Wang, W.-J.; Luoh, L. Simple Computation of the Defuzzifications of Center of Sum and Center of Gravity. J. Intell. Fuzzy. Syst. 2000, 9, 53–59. [Google Scholar]
- Alila, Y.; Kuras´, P.K.; Schnorbus, M.; Hudson, R. Forests and floods: A new paradigm sheds light on age-old controversies. Water Resour. Res. 2009, 45, 1–24. [Google Scholar] [CrossRef]
- Center for International Forestry Research. Forests and Floods Drowning in Fiction or Thriving on Facts? Center for International Forestry Research, Food and Agriculture Organization of the United Nations: Bogor Barat, Indonesia, 2005. [Google Scholar]
- Bruijnzeel, L.A. Hydrological functions of tropical forests: Not seeing the soil for the trees? Agric. Ecosyst. Environ. 2004, 104, 185–228. [Google Scholar] [CrossRef]
- Ingrisch, J.; Karlowsky, S.; Anadon-Rosell, A.; Hasibeder, R.; König, A.; Augusti, A.; Gleixner, G.; Bahn, M. Land Use Alters the Drought Responses of Productivity and CO2 Fluxes in Mountain Grassland. Ecosystems 2018, 21, 689–703. [Google Scholar] [CrossRef]
- Jing, J.; Bezemer, T.M.; Van der Putten, W.H. Interspecific competition of early successional plant species in ex-arable fields as influenced by plant–soil feedback. Basic Appl. Ecol. 2015, 16, 112–119. [Google Scholar] [CrossRef]
- Pimentel, D. Soil Erosion: A Food and Environmental Threat. Environ. Dev. Sustain. 2006, 8, 119–137. [Google Scholar] [CrossRef]
- Cheng, L.; Hoerling, M.; Aghakouchak, A.; Livneh, B.; Quan, X.-W.; Eischeid, J. How has human-induced climate change affected California drought risk? J. Clim. 2016, 29, 111–120. [Google Scholar] [CrossRef]
- Fang, H.; Jiang, C.; Li, W.; Wei, S.; Baret, F.; Chen, J.M.; Garcia-Haro, J.; Liang, S.; Liu, R.; Myneni, R.B.; et al. Characterization and intercomparison of global moderate resolution leaf area index (LAI) products: Analysis of climatologies and theoretical uncertainties. J. Geophys. Res. Biogeosci. 2013, 118, 529–548. [Google Scholar] [CrossRef] [Green Version]
- Su, Z.-A.; Zhang, J.-H.; Nie, X.-J. Effect of Soil Erosion on Soil Properties and Crop Yields on Slopes in the Sichuan Basin, China. Pedosphere 2010, 20, 736–746. [Google Scholar] [CrossRef]
- Zhou, P.; Luukkanen, O.; Tokola, T.; Nieminen, J. Effect of vegetation cover on soil erosion in a mountainous watershed. Catena 2008, 75, 319–325. [Google Scholar] [CrossRef]
Figure 1.
Upper Phetchaburi River Basin.

Figure 2.
The hierarchy model of the drought risk evaluation of the Upper Phetchaburi River Basin (UPRB).
Figure 2.
The hierarchy model of the drought risk evaluation of the Upper Phetchaburi River Basin (UPRB).

Figure 3.
The weighted values of drought risk factor of UPRB.

Figure 4.
The area of drought risk in UPRB.


Table 1.
The definition of fuzzy numbers that is divided into nine levels.
| Fuzzy Numbers | Linguistic Variable |
|---|---|
| 1̃ | Equally importance |
| 3̃ | Moderately importance |
| 5̃ | Strongly importance |
| 7̃ | Very strongly importance |
| 9̃ | Extremely importance |
| 2̃, 4̃, 6̃, 8̃ | Intermediate values between adjacent scale values |
Table 2.
Average random consistency indexes random index (RI) of the judgement matrix.
| n | 1 | 2 | 3 | 4 | 5 | 6 | 7 | 8 | 9 | 10 | 11 | 12 | 13 | 14 | 15 |
|---|---|---|---|---|---|---|---|---|---|---|---|---|---|---|---|
| RI | 0.00 | 0.00 | 0.58 | 0.90 | 1.12 | 1.24 | 1.32 | 1.41 | 1.45 | 1.49 | 1.51 | 1.48 | 1.56 | 1.57 | 1.59 |
Table 3.
Scale for the relative importance of variables used in the pairwise fuzzy comparison matrix (FCM).
Table 3.
Scale for the relative importance of variables used in the pairwise fuzzy comparison matrix (FCM).
| Intensity of Importance | Fuzzy Number | Linguistic Variable | TFNs (l, m, n) | Reciprocal of Fuzzy Values (1/u,1/m,1/l) |
|---|---|---|---|---|
| 1 3 5 7 9 2, 4, 6, 8 | 1̃ 3̃ 5̃ 7̃ 9̃ | Equally important Weekly important Strongly important Very strongly important Extremely more important The median of the above adjacent judgement | (1, 1, 2) (2, 3, 4) (4, 5, 6) (6, 7, 8) (8, 9, 9) (x − 1, x, x + 1; x = 2, 4, 6, 8) | (0.33, 1.00, 1.00) (0.20, 0.33, 1.00) (0.14, 0.20, 0.33) (0.11, 0.14, 0.20) (0.09, 0.11, 0.14) (1/(x + 1), 1/x, 1/(x − 1); x = 2, 4, 6, 8) |
Table 4.
Weight values of the drought risk factors assessed by fuzzy analytical hierarchy process (FAHP).
Table 4.
Weight values of the drought risk factors assessed by fuzzy analytical hierarchy process (FAHP).
| Factors/Criterion | Priority of Criterion | Sub-Criterion | Priority of Sub-Criterion | Final Priority of Sub-Criterion |
|---|---|---|---|---|
| C1 | 0.4425 | C11 | 0.7461 | 0.3301493 |
| C12 | 0.2539 | 0.1123508 | ||
| C2 | 0.0790 | C21 | 0.7461 | 0.0589419 |
| C22 | 0.2539 | 0.0200581 | ||
| C3 | 0.2916 | C31 | 0.1363 | 0.0397451 |
| C32 | 0.3498 | 0.1020017 | ||
| C33 | 0.1211 | 0.0353128 | ||
| C34 | 0.3928 | 0.1145405 | ||
| C4 | 0.1868 | C41 | 0.5588 | 0.1043838 |
| C42 | 0.4412 | 0.0824162 |
© 2019 by the authors. Licensee MDPI, Basel, Switzerland. This article is an open access article distributed under the terms and conditions of the Creative Commons Attribution (CC BY) license (http://creativecommons.org/licenses/by/4.0/).
Share and Cite
MDPI and ACS Style
Wijitkosum, S.; Sriburi, T. Fuzzy AHP Integrated with GIS Analyses for Drought Risk Assessment: A Case Study from Upper Phetchaburi River Basin, Thailand. Water 2019, 11, 939. https://doi.org/10.3390/w11050939
AMA Style
Wijitkosum S, Sriburi T. Fuzzy AHP Integrated with GIS Analyses for Drought Risk Assessment: A Case Study from Upper Phetchaburi River Basin, Thailand. Water. 2019; 11(5):939. https://doi.org/10.3390/w11050939
Chicago/Turabian StyleWijitkosum, Saowanee, and Thavivongse Sriburi. 2019. "Fuzzy AHP Integrated with GIS Analyses for Drought Risk Assessment: A Case Study from Upper Phetchaburi River Basin, Thailand" Water 11, no. 5: 939. https://doi.org/10.3390/w11050939
Note that from the first issue of 2016, this journal uses article numbers instead of page numbers. See further details here.