Stability of Rubble Mound Breakwaters—A Study of the Notional Permeability Factor, Based on Physical Model Tests


Department of Civil Engineering, Aalborg University, 9220 Aalborg, Denmark
*
Author to whom correspondence should be addressed.
Water 2019, 11(5), 934; https://doi.org/10.3390/w11050934
Submission received: 3 April 2019
/
Revised: 29 April 2019
/
Accepted: 30 April 2019
/
Published: 2 May 2019
(This article belongs to the Special Issue Interaction between Waves and Maritime Structures)
Abstract
:The Van der Meer formulae for quarry rock armor stability are commonly used in breakwater design. The formulae describe the stability as a function of the wave characteristics, number of waves, front slope angle and rock material properties. The latter includes a so-called notional permeability factor characterizing the permeability of the structure. Based on armor stability model tests with three armor layer compositions, Van der Meer determined three values of the notional permeability. Based on numerical model results he added for a typical layer composition one more value. Based on physical model tests, the present paper provides notional permeability factors for seven layer compositions of which two correspond to the compositions tested by Van der Meer. The results of these two layer compositions are within the scatter of the results by Van der Meer. To help determination of the notional permeability for non-tested layer compositions, a simple empirical formula is presented.
1. Introduction
The rock armor stability of rubble mound breakwaters has been estimated with the formulae by Van der Meer [1] in the last decades. The formulae are still used worldwide even though the study was performed approximately 30 years ago. An alternative to the stability formulae by Van der Meer [1] could be a numerical model. However, computational fluid models like the volume of fluid (VOF) and smoothed-particle hydrodynamics (SPH) are still computationally demanding and need to be coupled to a solid state model like a discrete element method (DEM). Furthermore, the numerical models rely on parameters found in physical model tests, as for example, the porosity parameters used to describe the water flow inside the rubble mound breakwater. Thus numerical models cannot be used as a standalone but need input parameters based on physical model tests. Sarfaraz and Pak [2] used a coupled SPH-DEM model to test the stability of cube armored rubble mound breakwaters. They compared the numerical results to empirical formulae and the numerical results were not far from the empirical estimations. Numerical models can be a supplement to empirical formulae used to solve complex problems but, in most situations, empirical formulae are still highly relevant.
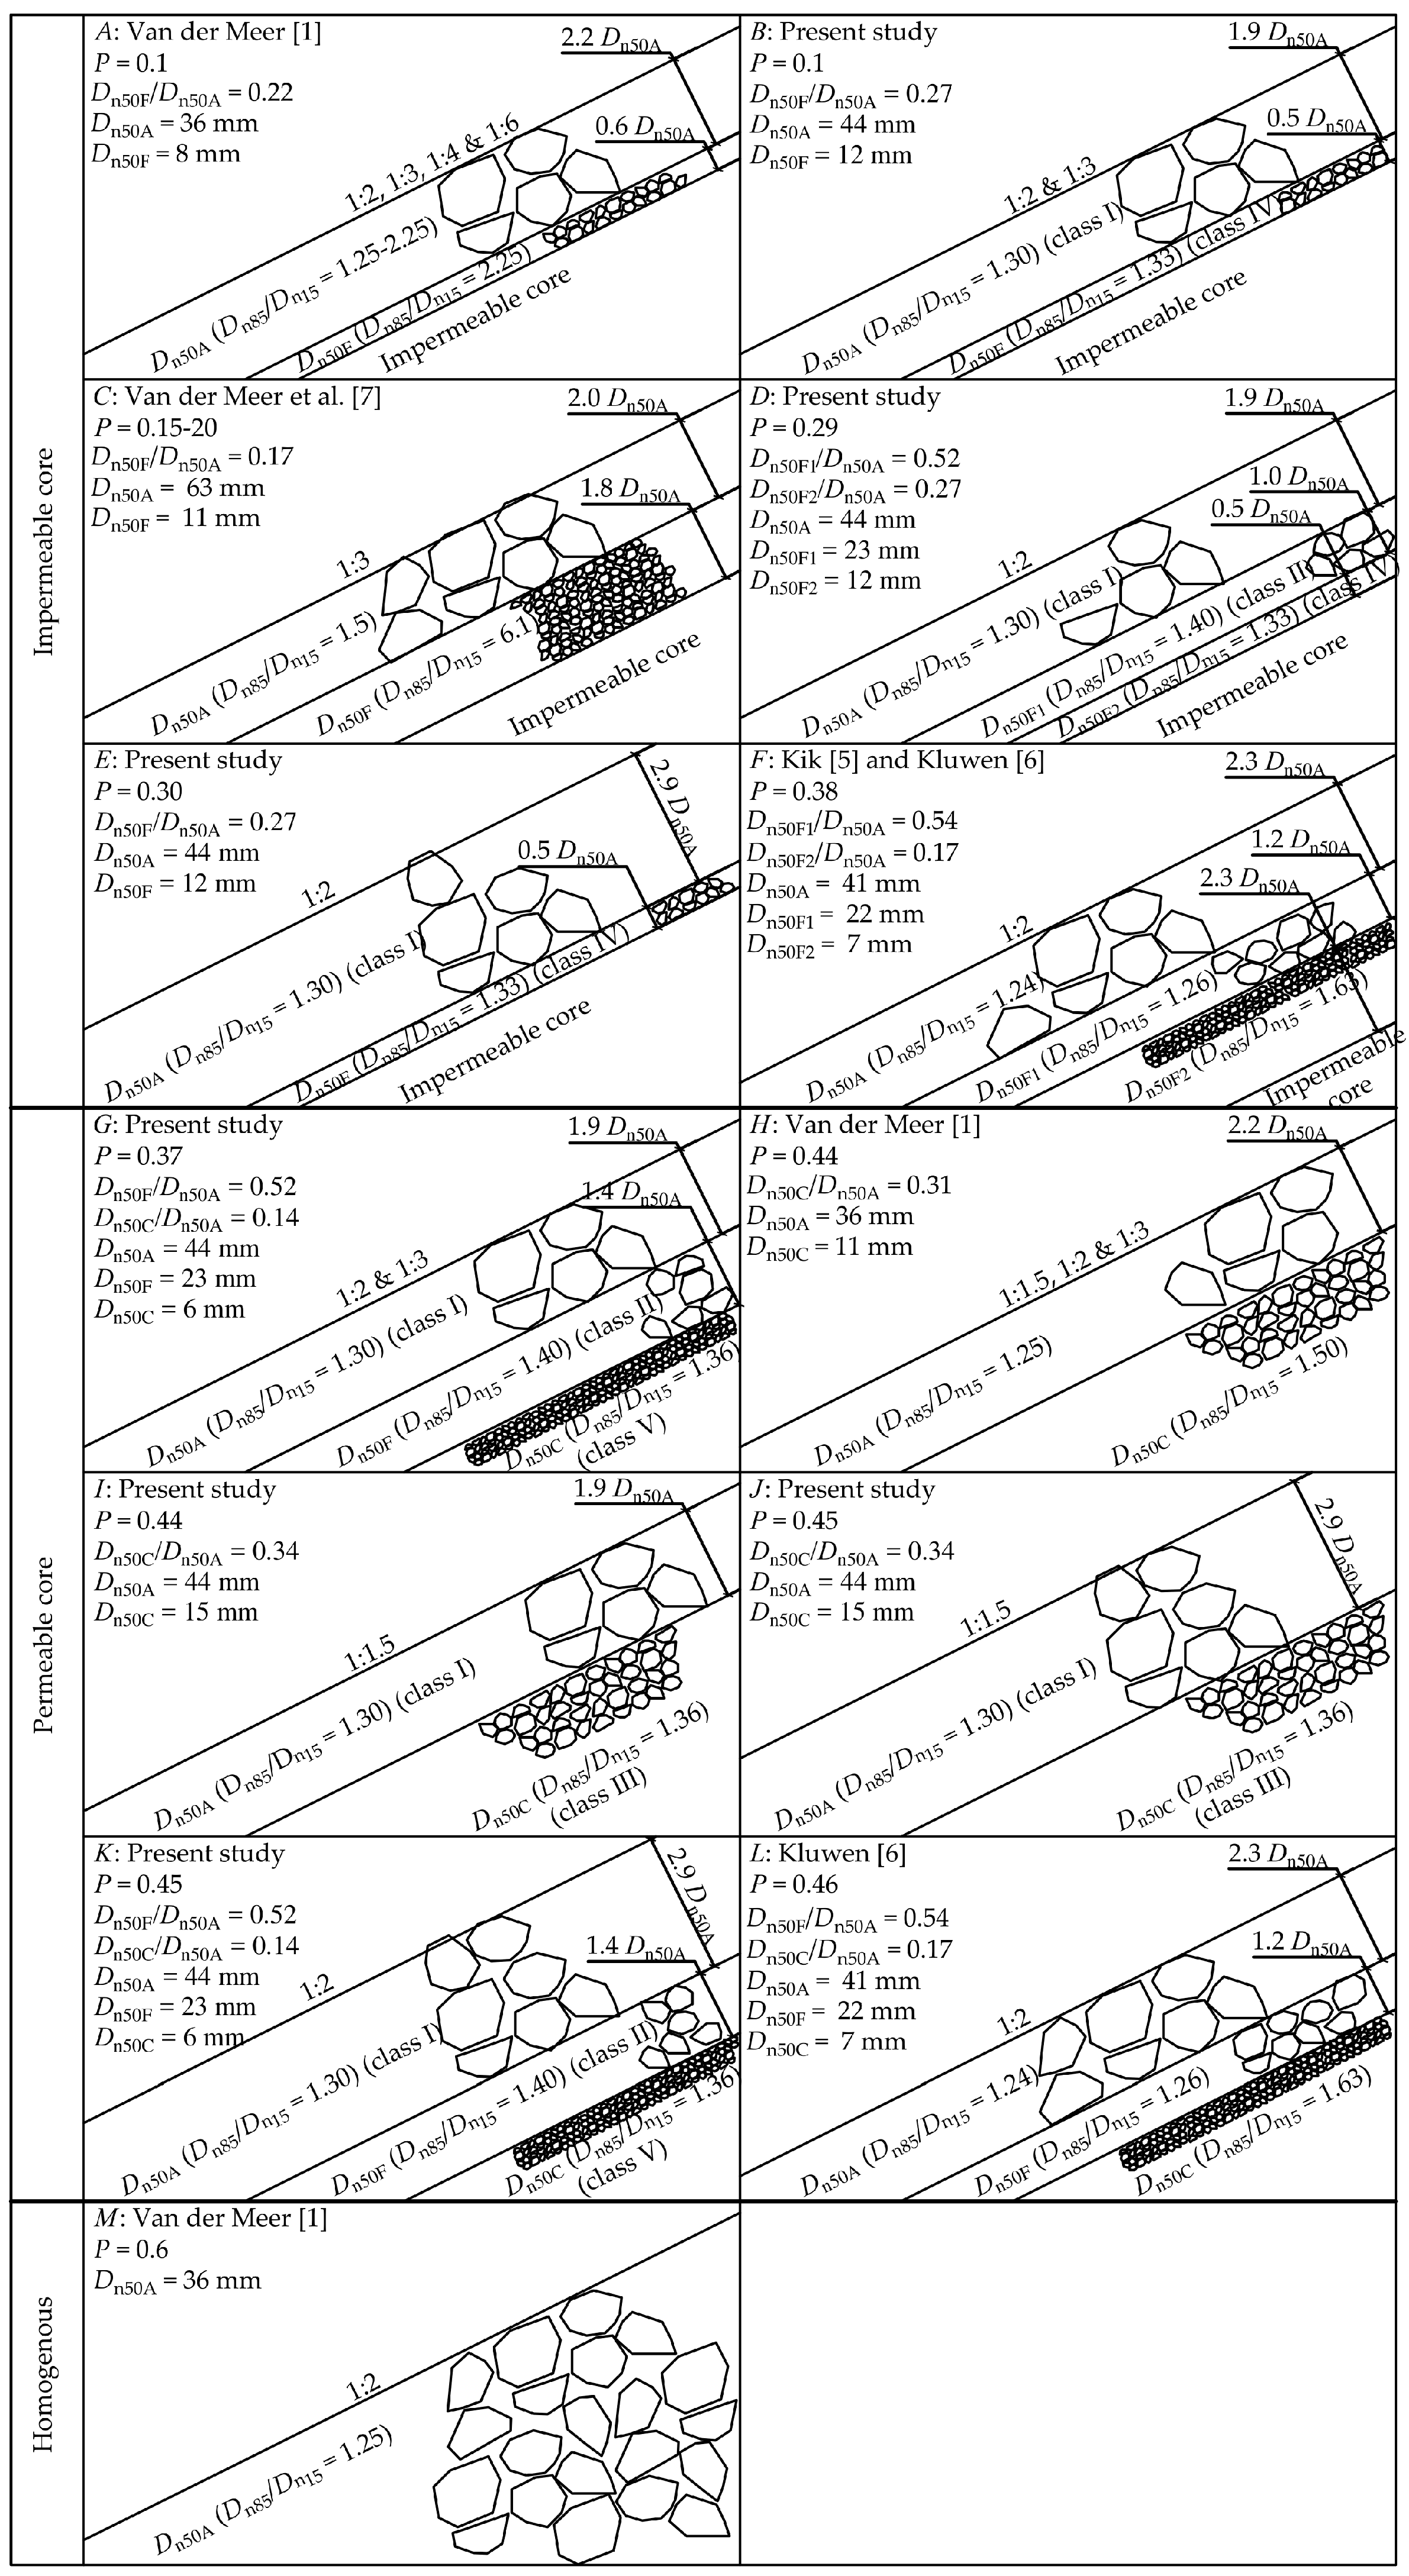
Van der Meer [1] performed a large number of model tests with rubble mound breakwaters exposed to irregular mainly non-breaking Rayleigh distributed waves corresponding to H1/3/h ≤ 0.2 in which H1/3 is the significant incident wave height and h the water depth. The tests included cross-sections with five different front slopes in the range of cot(α) = 1.5–6, and three different layer compositions. The three compositions were: An armor layer on a thin filter layer on an impermeable core, an armor layer on a coarse permeable core and a homogeneous structure, see layer compositions A, H and M in Figure 1. Van der Meer used the work by Thompson and Shuttler [3] as a starting point, finding three notational permeability values (P = 0.1, 0.5, 0.6) for the tested layer compositions. The tests included the impermeable core composition tested by Thompson and Shuttler.
The notional permeability parameter has no physical meaning but was introduced to ensure that the effect of permeability was taken into account. For the very typical layer composition consisting of a permeable core, underlayer and armor layer, Van der Meer [1] estimated the value P = 0.4 on the basis of above given P-values and the numerical HADEER model by Hölscher and Barends [4], which models the wave introduced flow in the porous structure of rubble mounds.
Kik [5] tested a layer composition with an impermeable geo-textile placed underneath a relatively thick second underlayer, cf. composition F in Figure 1, and found P = 0.37, but recommend a design value of P = 0.35 due to limited tests. Kluwen [6] tested the same structure under similar wave conditions but extended the number of data. Based on all the tests, Kluwen fitted a notional permeability of P = 0.38. Kluwen [6] also tested layer composition L in Figure 1 and determined P = 0.46. This layer composition is similar to the layer composition for which Van der Meer [1] estimated P = 0.4, but the composition by Kluwen [6] had a thicker armor layer, a thinner underlayer and coarser material in both underlayer and core.
Recently, Van der Meer et al. [7] studied the influence of grading and thickness of the underlayer/filter layer for a structure with an impermeable core. They observed that an underlayer with a thickness of 0.5Dn50A of the armor stone size gave complete failure, while a thickness of 1.75Dn50A reduced the armor layer damage by 50%. For the layer composition with a thick underlayer, they estimated P = 0.15–0.2, see layer composition C in Figure 1. Furthermore, they observed that a very wide-graded underlayer material (including fine material) gave as expected more damage than a narrow graded underlayer material with the same Dn50. Since only two wave steepnesses were tested for each composition, no final recommendations on P were given.
In addition to the above given existing notional permeability factors, Figure 1 also presents the obtained results from the present study on seven layer compositions (B, D, E, G, I, J and K). A more detailed description of these layer compositions and the analysis of the obtained notional permeability factors are given later in the present paper.
The influence of the notional permeability value on armor stability is demonstrated in Table 1. Based on the notional permeability factors given in Figure 1, the related required rock armor masses are given as calculated from the Van der Meer [1] formulae for some typical conditions including three different deep water wave steepnesses, significant wave height H1/3 = 4 m, front slope cot(α) = 2, damage Sd = 2, rock mass density of 2650 kg/m3, water mass density of 1025 kg/m3 and number of waves N = 1000 waves. Table 1 shows that changing the notional permeability from P = 0.46 to P = 0.38 demands an increase in armor unit mass of approximately 10–35%, depending on the breaker parameter ξ0m = tanα/s0m0.5 in which s0m = 2πH1/3/(gTm2) and Tm is the mean wave period. Changing the notional permeability from P = 0.38 to P = 0.17 demands an increase in armor unit mass of approximately 50–100%. This large sensitivity of the armor mass to the notional permeability motivates the determination of more notional permeability values.
A method to estimate the notional permeability was proposed by Jumelet [8]. He developed a numerical volume exchange model, which couples the external processes with the internal processes. The external process is described by the wave run-up, and the internal process by the Forchheimer equation for flow through porous media. The model was calibrated with the tests by Van der Meer [1]. The model determines the notional permeability factor based on the breaker parameter ξ, the ratio between the armor and core material size, and the relation between the wave run-up for a rubble mound with an impermeable core and a rubble mound with a permeable core. The wave run-up at the armor surface is for a permeable core dependent on the water infiltration into the core. The model assumes that the surface roughness reduces the wave run-up on the armor layer with a roughness factor of γf = 0.75 compared to a smooth slope while the run-up at the core was considered to be γRu = 0.5 of the run-up at the surface.
Van Broekhoven [9] conducted a range of experimental model test data to further investigate these assumptions by Jumelet. He tested layer compositions with permeable and impermeable cores and placed the armor material directly on the core material surface. He found that the wave run-up at the armor surface was not influenced by the permeability of the core, but a clear influence from the permeability was observed for the wave run-up at the core surface. Van Broekhoven [9] concluded that the wave run-up below the armor layer is better correlated to the notional permeability factor than the wave run-up at the armor surface. Based on that observation he determined the notional permeability factor from the breaker parameter and the relation between the wave run-up under the armor layer for a permeable core and an impermeable core. Van Broekhoven [9] did not test layer compositions with filter layers.
Van der Neut [10] used the volume of fluid method by IH Cantabria (IH2VOF) to estimate the notional permeability on the layer compositions tested by Van der Meer [1]. He calibrated the numerical model against small-scale stability tests and found relations between the notional permeability and four different dimensionless parameters determined from the numerical model. Thus the model is not a simulation of the stability, but is a coupling between rock armor stability tests and some dimensionless parameters describing the notional permeability factor.
The aim of the present paper is to get estimates of P for a wider range of layer compositions. For this purpose, new rock armor stability model tests were carried out with seven different layer compositions having different permeabilities.
Following a short presentation in Section 2 of the stability formulae by Van der Meer [1] the model setup and the model materials are presented in Section 3. Wave generation and wave analysis are explained in Section 4. Following a description in Section 5 of the applied damage measuring technique, the test program and the test procedure are given in Section 6. A comparison of the model test results with the results of Van der Meer is presented in Section 7 followed by a presentation and a discussion in Section 8 of the notional permeability factors determined for the new layer compositions. Finally, in Section 9, a discussion of possible methods to estimate the notional permeability is given and a simple empirical method for the estimation of the notional permeability is presented.
2. Stability Formulae by Van der Meer
The Van der Meer [1] formulae for the stability of rock armored non-overtopped breakwaters is as follows, Equation (1):
Here Δ = ρarmor/ρwater − 1 is the reduced relative density of the armor stones. Dn50A = is the nominal size of the armor stones based on the median armor stone mass W50A as described in the Rock Manual [11]. P is the notional permeability factor. α is the angle of the seaward slope of the structure. ξ0m = tan(α)/s0m0.5 is the surf similarity parameter where the wave steepness (s0m = H1/3/L0m) is calculated based on the significant wave height (H1/3) and the mean wave period (Tm) at the toe, using deep water wavelength formulae (L0m = Tm2g/2π). The tested range of ξ0m was 0.7–7. N is the number of waves (no more than 8500 waves should be used). The waves in the present tests deviated to some extend from Rayleigh distributed waves in that H2%/H1/3 = 1.19–1.47. For such cases, Van der Meer recommends H1/3 in Equation (1) replaced by H2%/1.4.
3. Model Test Setup and Model Materials
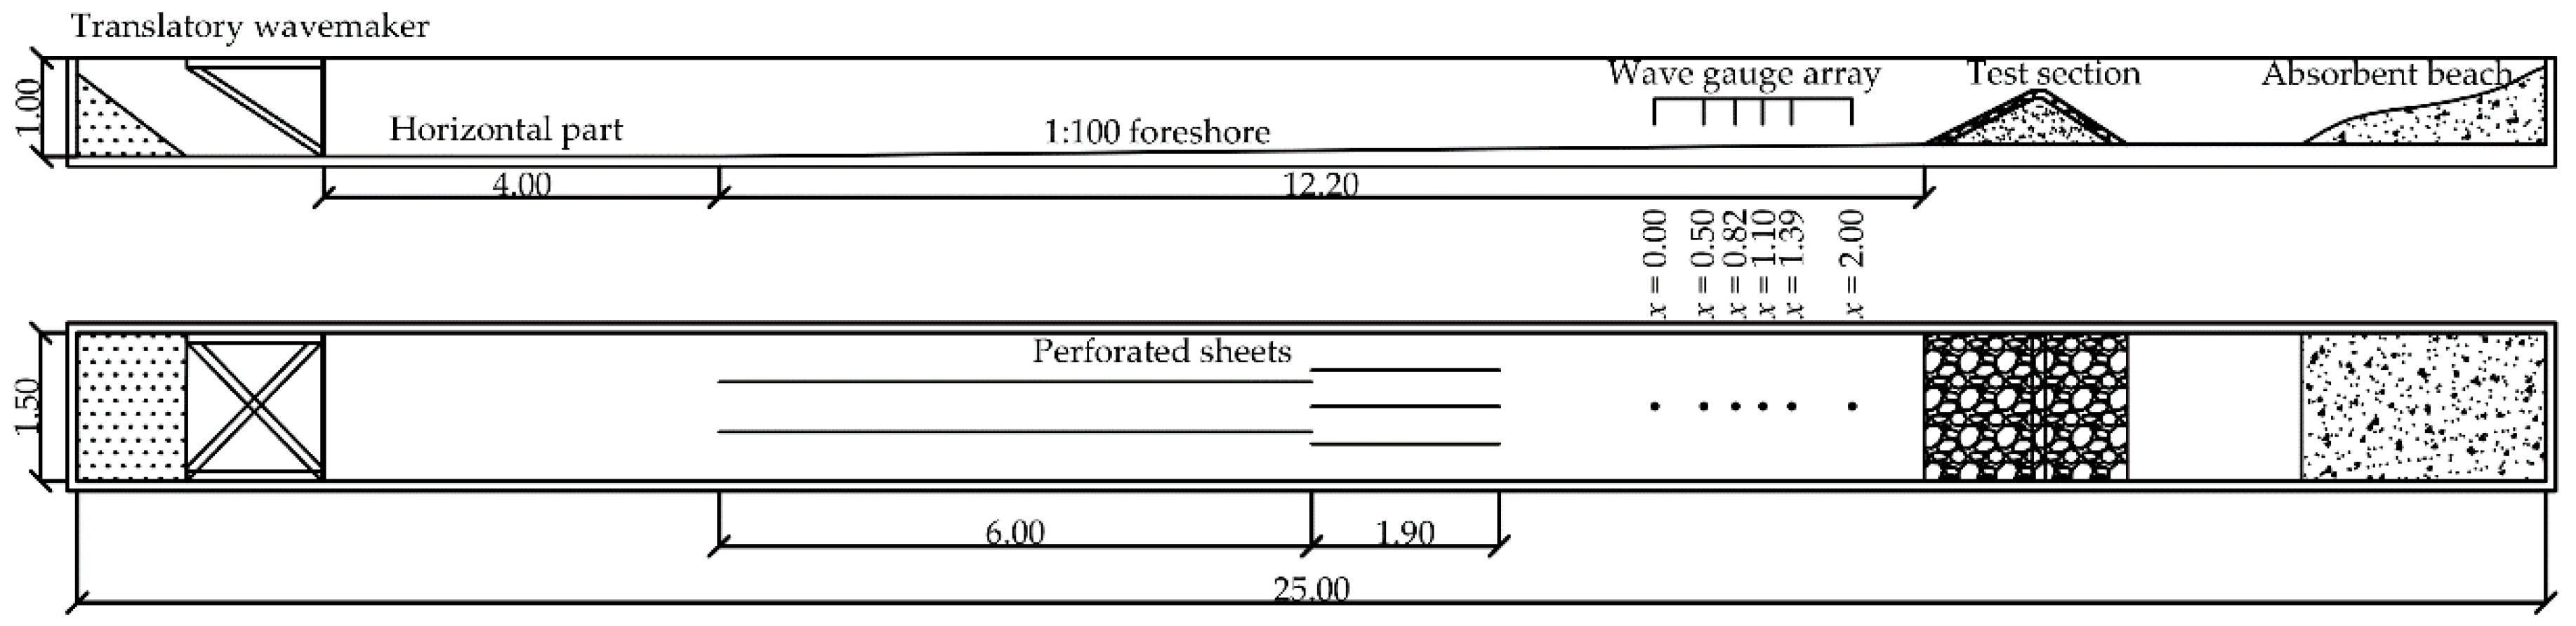
The new tests were carried out in a wave flume at Aalborg University with dimensions of 25.0 × 1.5 × 1.0 m (l × w × h). For the present tests a 1:100 concrete foreshore was used in order to generate depth-limited waves without wave breaking at the wavemaker. Figure 2 illustrates the wave flume.
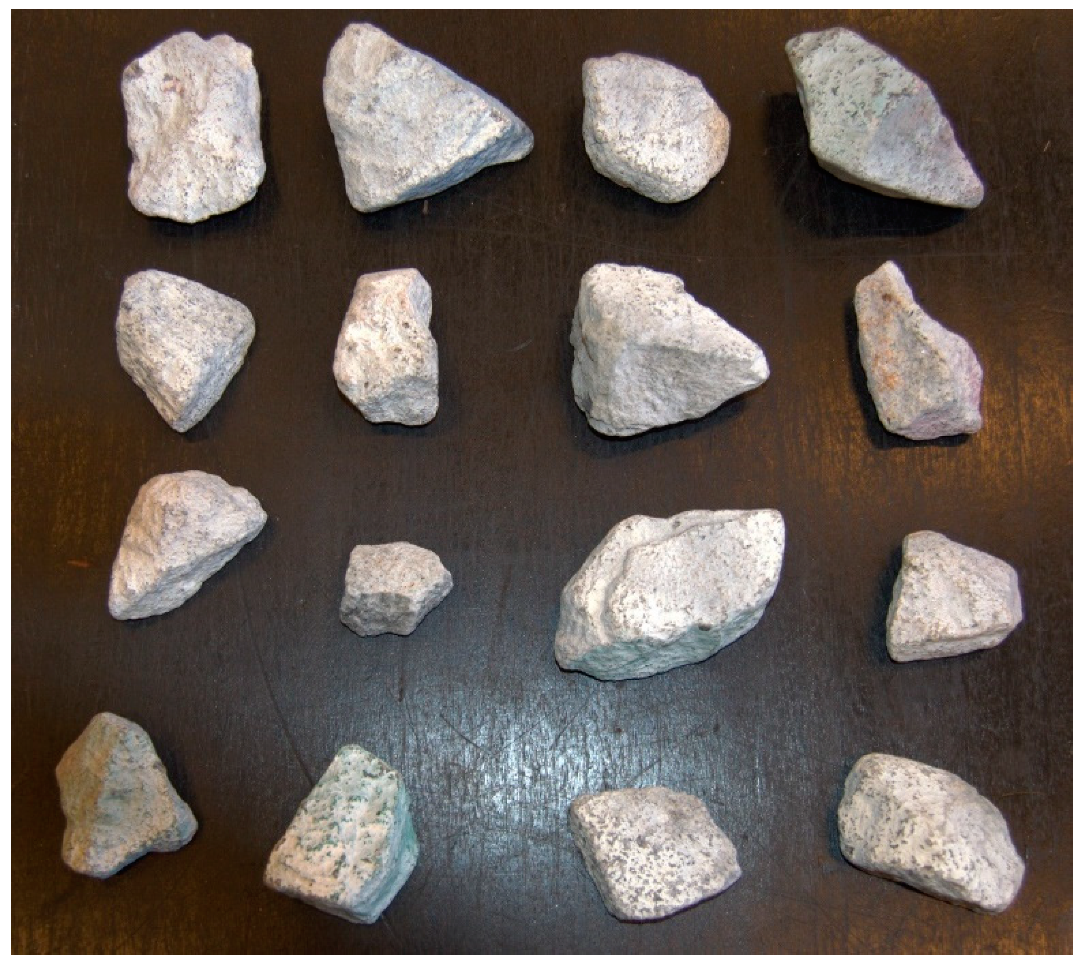
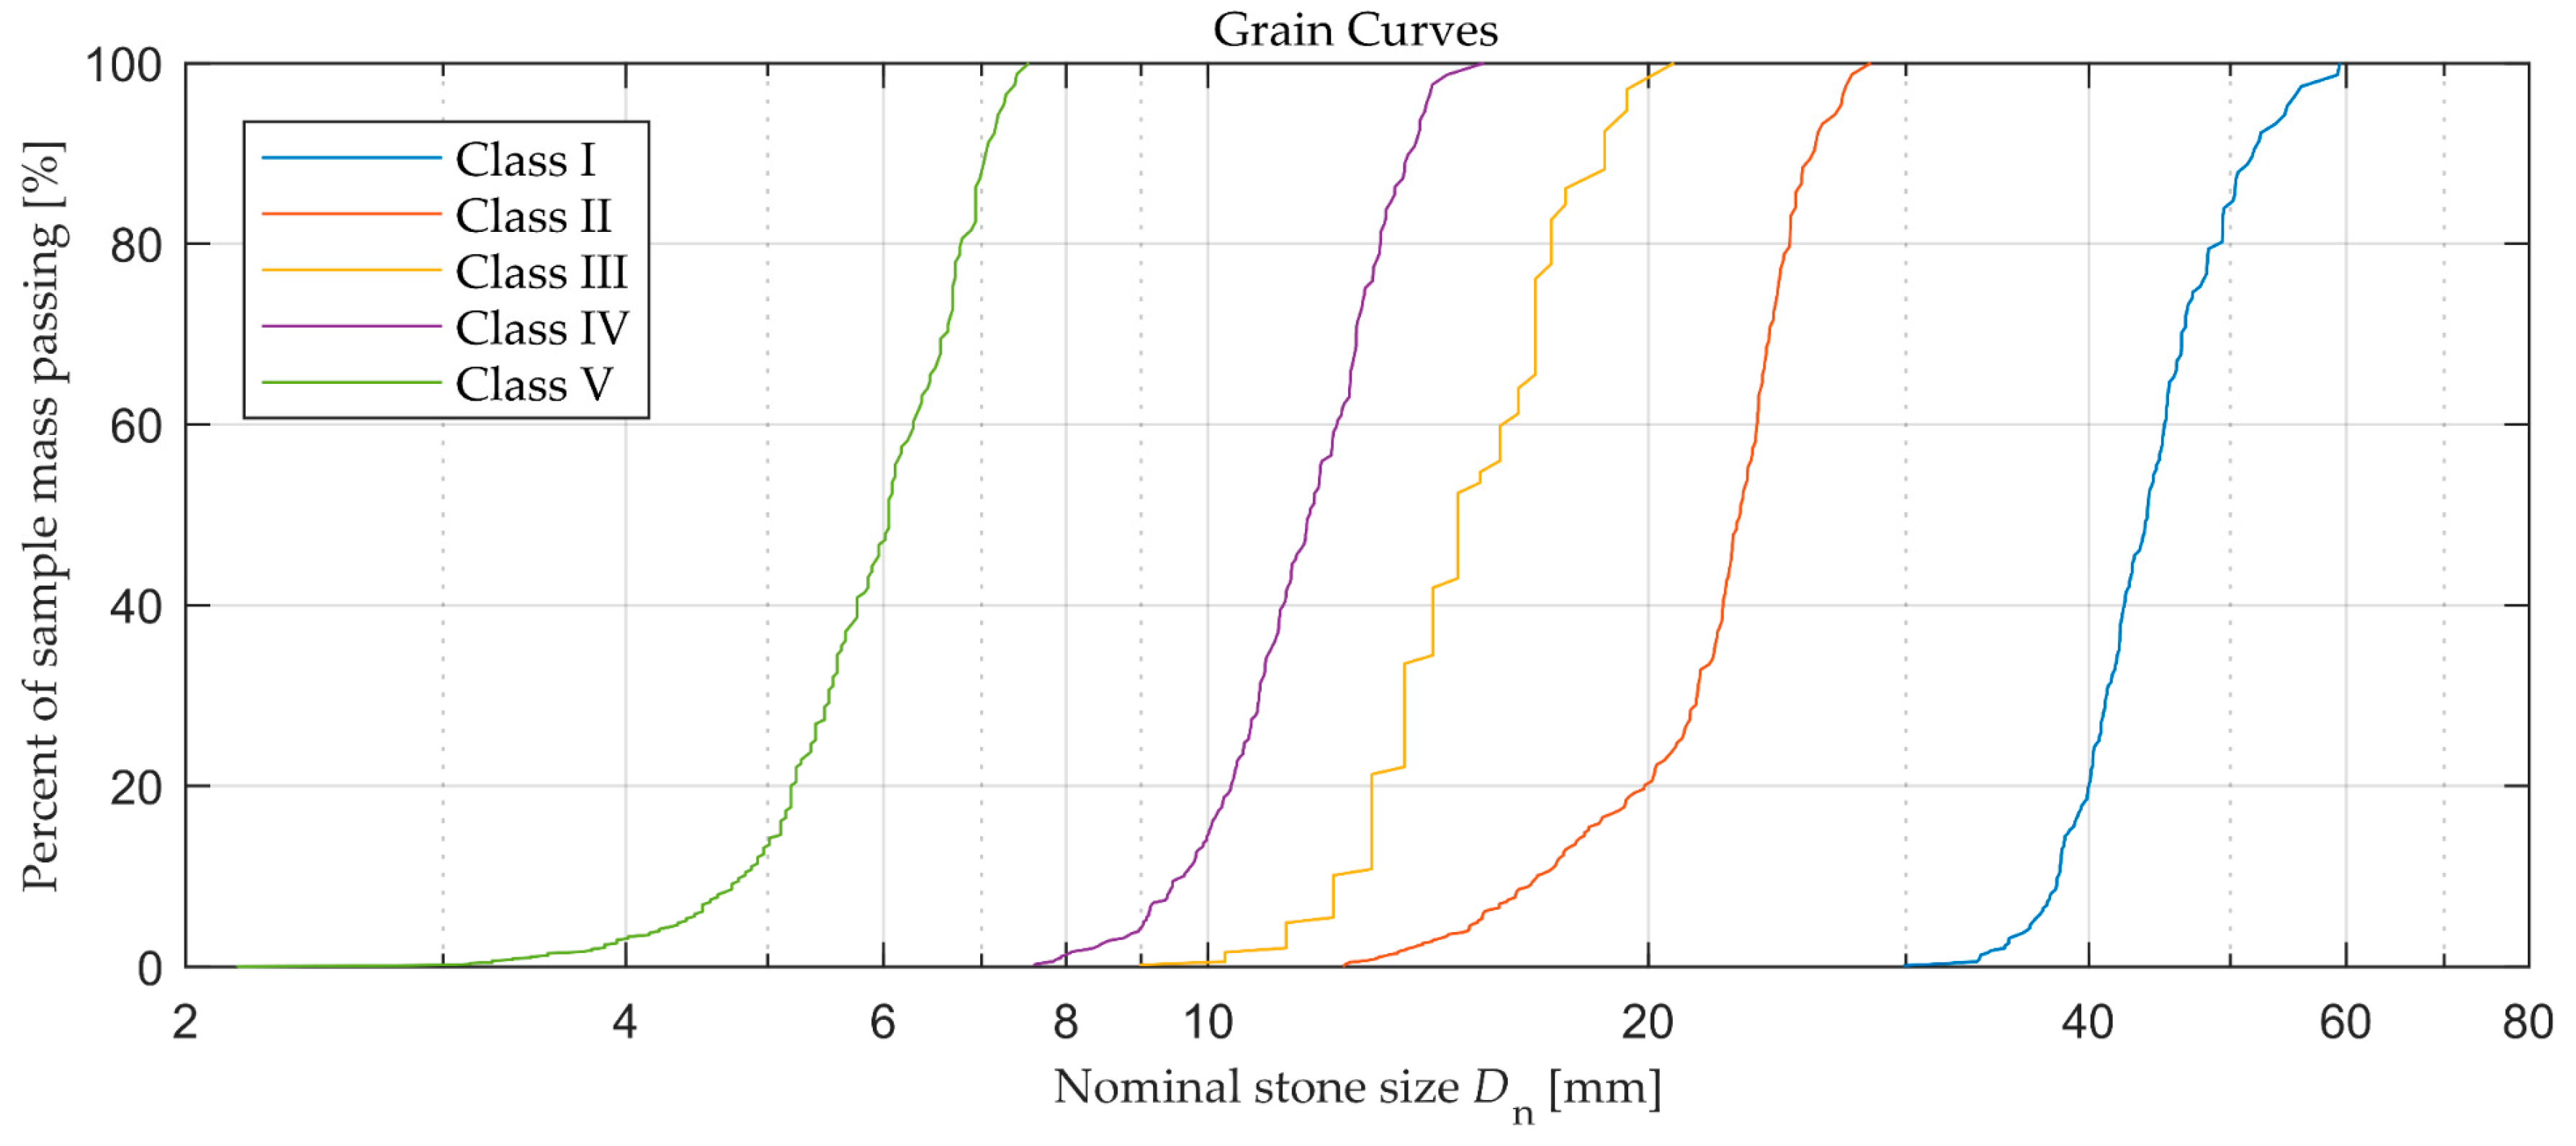
The water depth at the toe of the model breakwater was 0.5 m in all tests. Five different rock materials were used for the tested layer compositions. Table 2 lists the properties of the materials. Figure 3 shows typical shapes of the tested armor rocks. The shapes are of importance for the armor stability. Figure 4 shows the grading curves of the materials listed in Table 2.
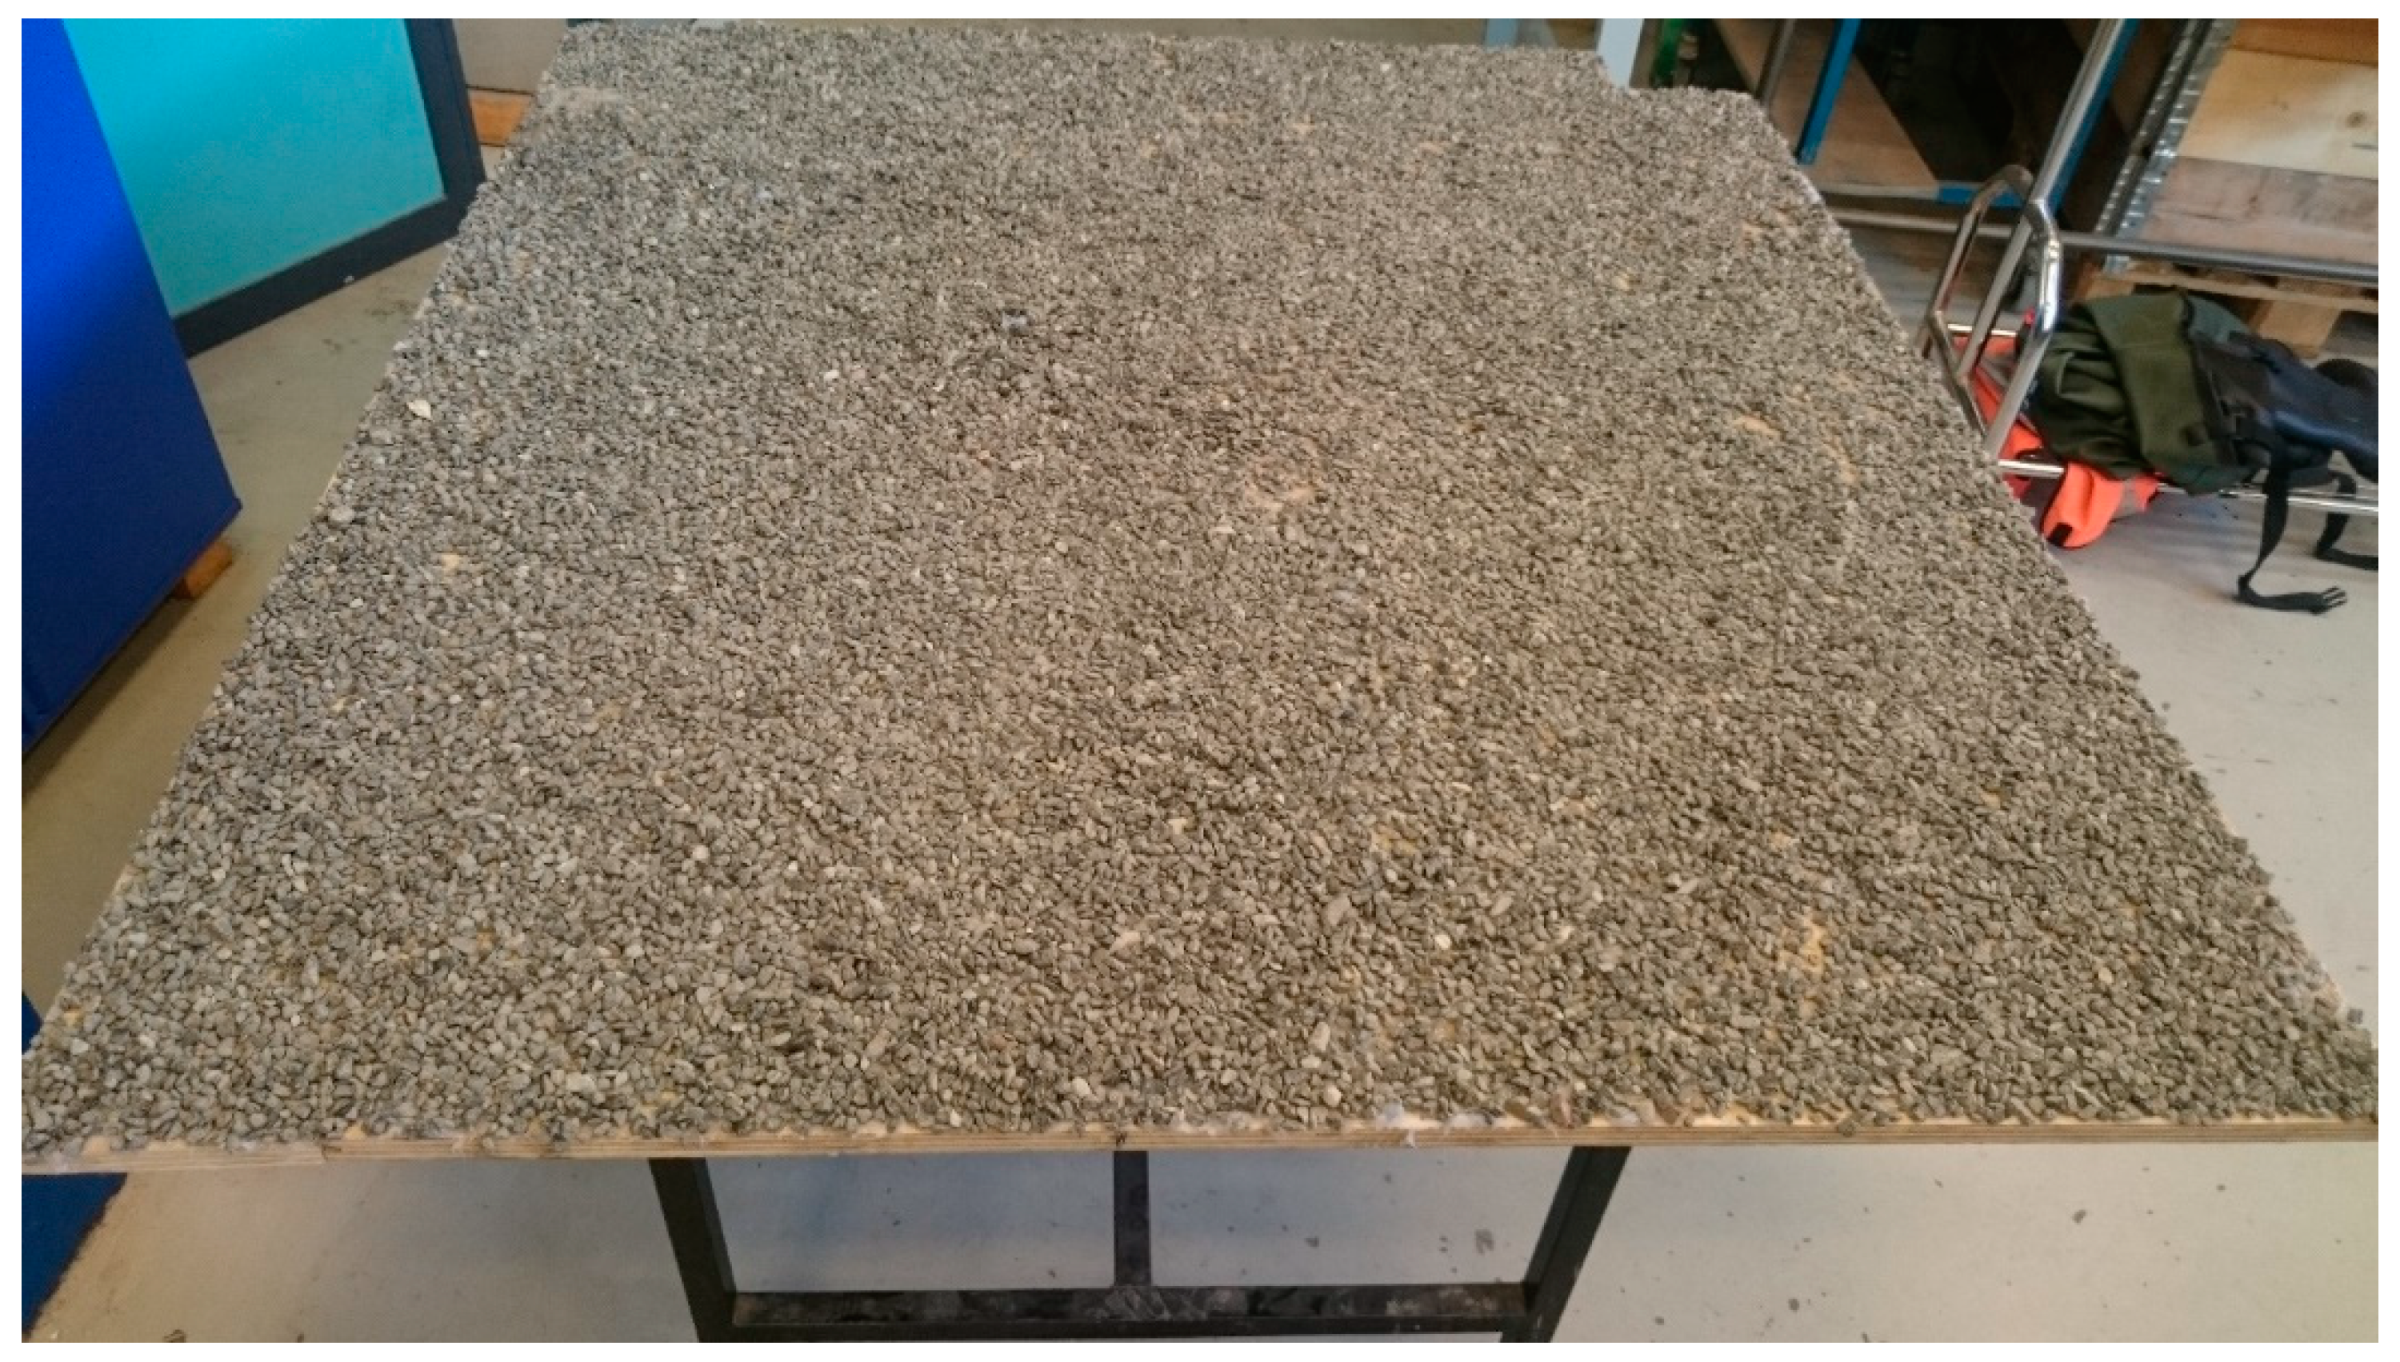
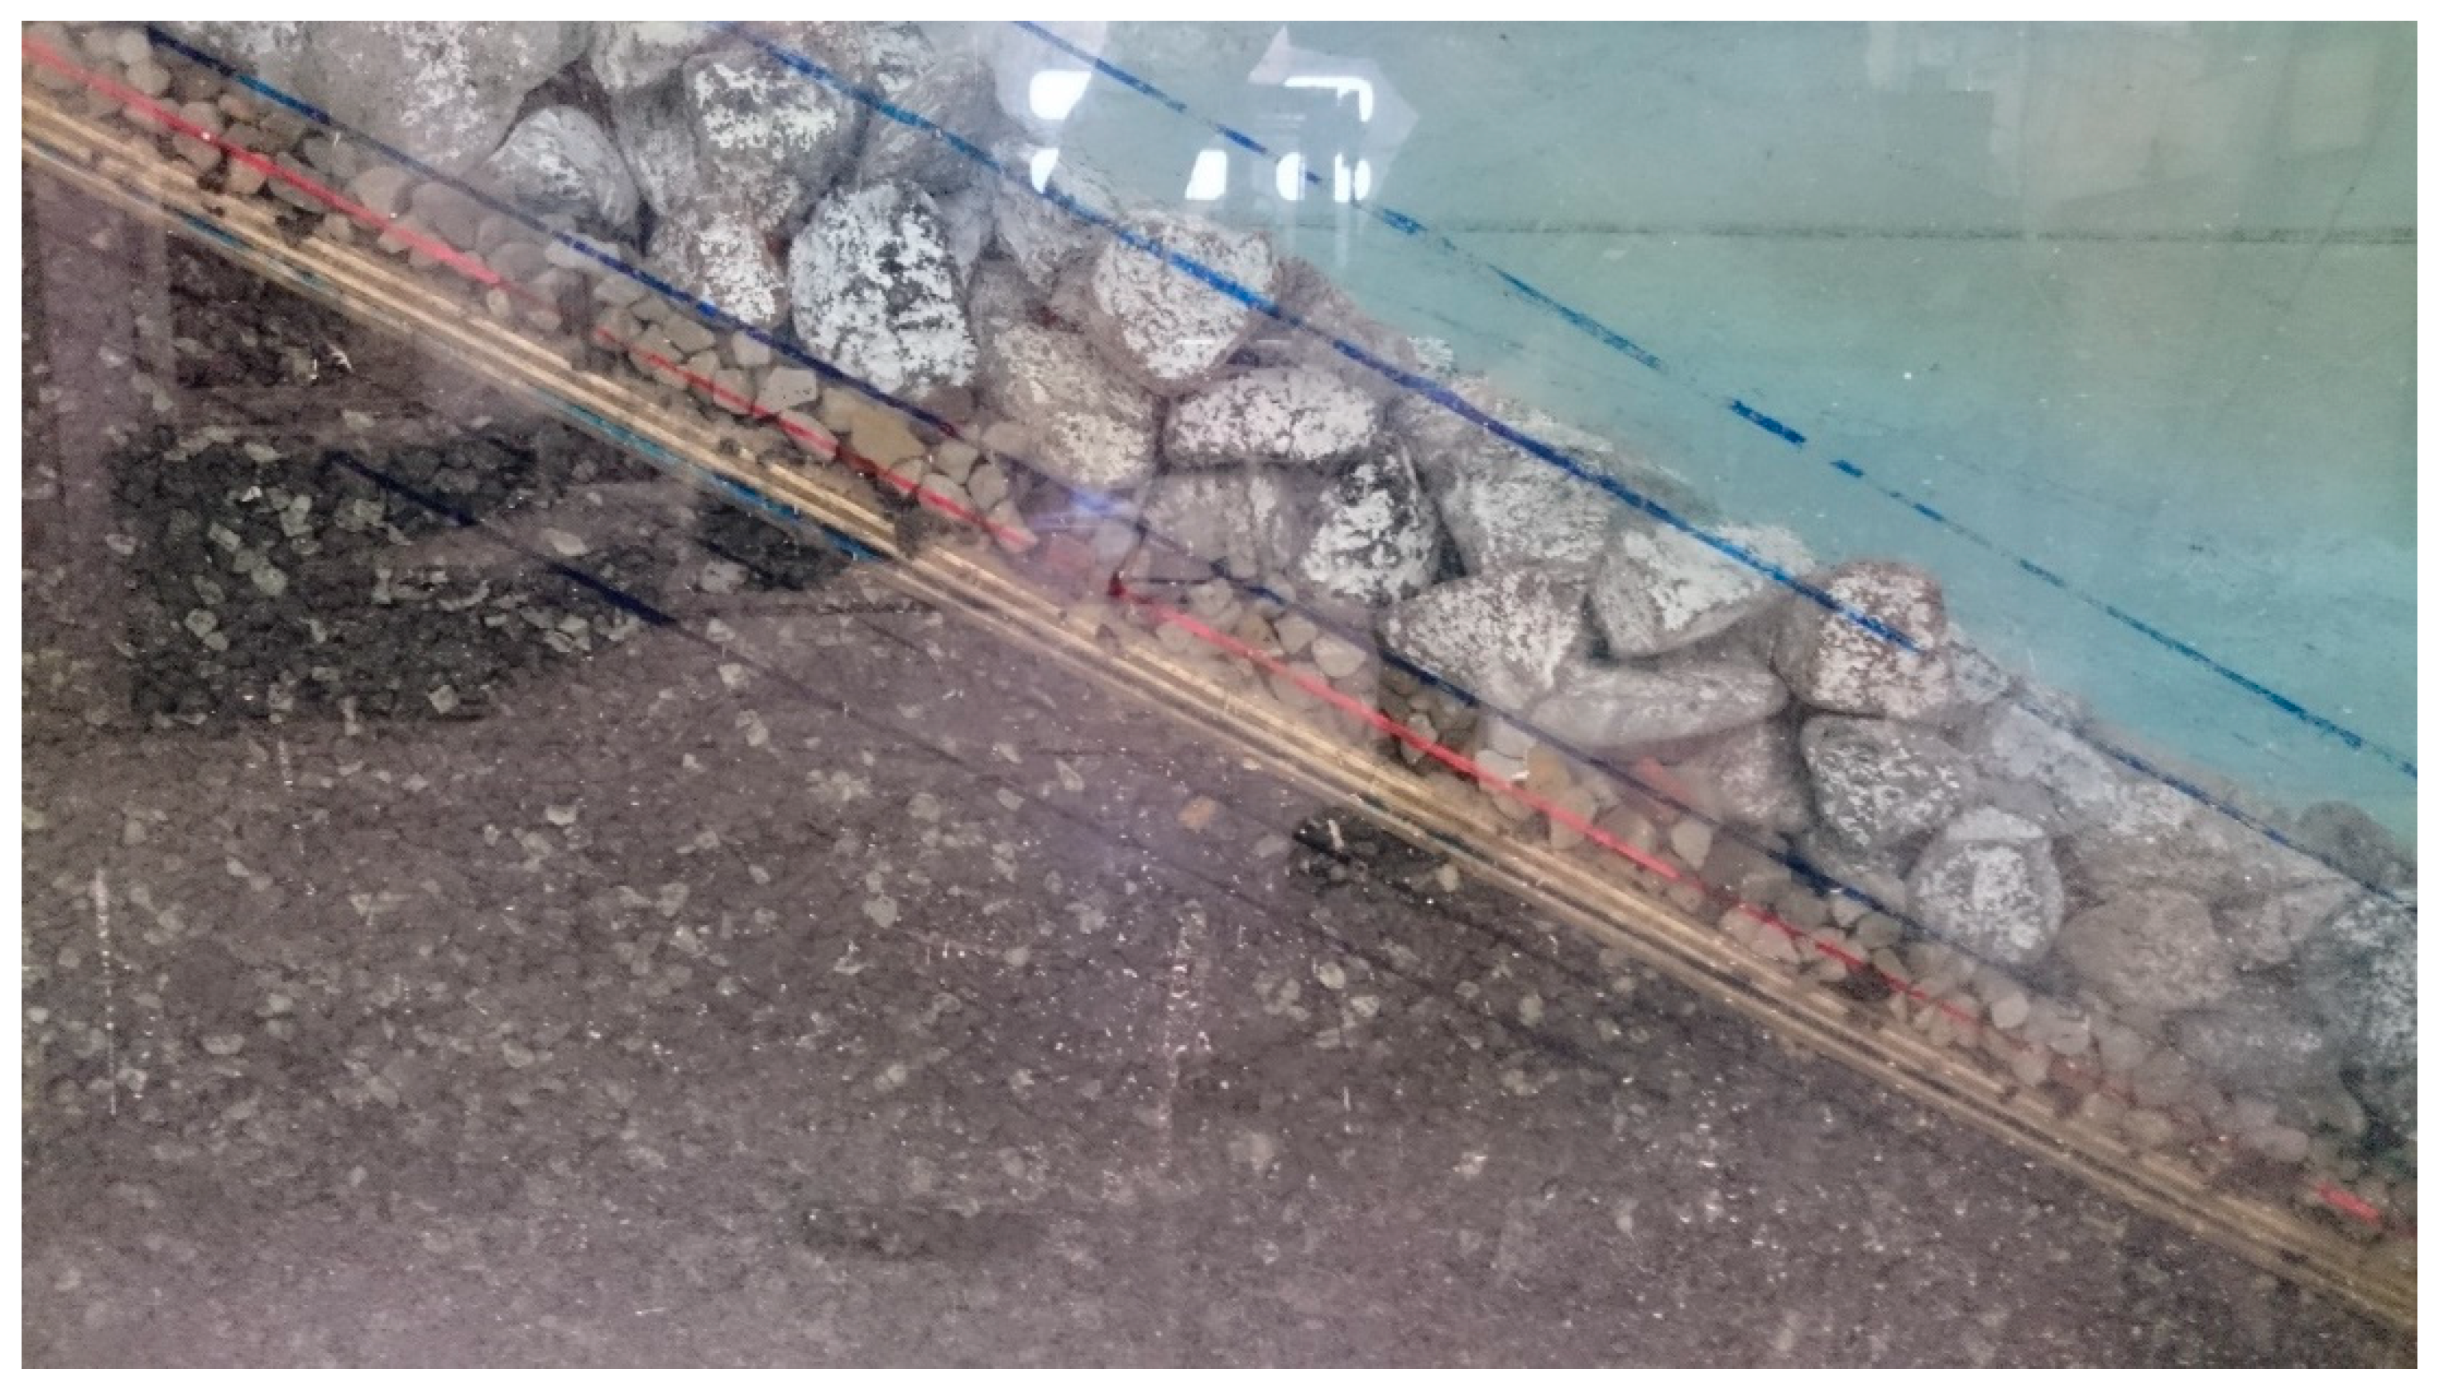
The layer composition with an impermeable core proved to be difficult to be modeled. In the first tests, the impermeable membrane was made of a plywood plate on which the underlayer was directly placed. Unfortunately, sliding of the underlayer was observed when exposed to low steepness waves. An attempt to increase the roughness between the underlayer and the impermeable membrane was made by replacing the plywood plate by concrete slabs with an impermeable membrane below. However, sliding still occurred. Finally, a solution with Class V rocks glued to the plywood plate was found acceptable, see Figure 5. This shows that the interface between the rock material and the core is important. If not modeled correctly this could lead to incorrect stability results. To ensure that the plate was stable and no displacement of the plate could occur, the plywood plate was placed on top of Class V rocks, see Figure 6.
Seven layer compositions as given in Figure 1 were tested. Two of them are similar (compositions B and I) to what Van der Meer [1] tested (compositions A and H). The first composition (B) consists of an armor layer, underlayer and an impermeable core. The composition has an armor thickness of 1.9Dn50A and an underlayer thickness of 0.5Dn50A with a rock size of 0.27Dn50A. The second composition (I) consists of an armor layer and a permeable core. The composition has an armor thickness of 1.9Dn50A with a core rock size of 0.34Dn50A. The third layer composition, D, has an armor layer with two underlayers and an impermeable core. The armor layer has a thickness of 1.9Dn50A and the first underlayer a thickness of 1Dn50A and a rock size of 0.52Dn50A. The second underlayer has a thickness of 0.5Dn50A and has a rock size of 0.27Dn50A. This composition will show how sensitive the notional permeability is to the underlayer thickness when an impermeable core is present and thus provide additional insight to the study by Van der Meer et al. [7], Kik [5] and Kluwen [6]. The fourth composition, G, consists of an armor layer, an underlayer and a permeable core. The armor layer has a thickness of 1.9Dn50A, and the underlayer has a thickness of 1.4Dn50A with a rock size of 0.52Dn50A. The core has a rock size of 0.14Dn50A. This layer composition is similar to the non-tested (P = 0.4) layer composition by Van der Meer [1]. Furthermore, it is also similar to what Kluwen [6] tested, but she had thicker armor layer and underlayer with a slightly coarser material in the core. Finally, three additional compositions were tested, see layer compositions E, J and K. These layer compositions have an armor layer thickness of 2.9Dn50A compared to 1.9Dn50A, which is used for layer compositions B, I and G. This will give additional information of the notional permeability and the influence of the layer thickness for the armor material.
4. Wave Generation and Wave Analysis
The waves were generated by the software AwaSys 7 by Aalborg University [12], which includes the used wave generation theories by Eldrup and Lykke Andersen [13] and Zhang et al. [14]. The second-order wave generation by Eldrup and Lykke Andersen [13] was used when free unwanted waves were of acceptable small amplitude. When not acceptable (shallow water cases), the wave generation method by Zhang et al. [14] was used. The method by Zhang et al. [14] uses a depth-averaged velocity as input, which for the present study was generated by MIKE 21 BW by propagating waves from deep to shallow water by a 1:100 foreshore. During all tests, active absorption of reflected waves was used based on wave gauges at the paddle face using the Lykke Andersen et al. [15] method, which has been proven effective also for nonlinear irregular waves, cf. Lykke Andersen et al. [16]. JONSWAP spectra with peak enhancement factor γ = 3.3 were used in all tests.
To measure and separate incident and reflected waves, six resistant type wave gauges placed in front of the structure with distances between gauges of 0.50, 0.82, 1.10, 1.39 and 2.00 m as shown in Figure 2 were used. The distance from the breakwater to the nearest wave gauge was approximately 0.4LP (peak wavelength) based on the recommendation given by Klopman and Van der Meer [17]. The water depth in the middle of the array was approximately 1.7 cm higher than at the toe, and due to that, depth-limited waves would be slightly smaller at the toe than at the wave gauge array. The difference in H2% in the middle of the array compared to the toe is estimated by linear shoaling and Battjes and Groendjik [18] to be maximum 1%, which is judged acceptable compared to the scatter in the stability results. In case a steeper foreshore was used the difference would have been significantly larger. In such a case it would be recommended to also measure the waves at the toe without the structure in place. The nonlinear method by Eldrup and Lykke Andersen [19] was used to separate the incident and reflected waves. As opposed to the methods of Goda [20] and Mansard and Funke [21] this separation method includes both bound and free components and amplitude dispersion, which is essential for accurate determination of low exceedance wave parameters, for example H2%, in nonlinear sea states. The method is included in the software package WaveLab 3 by Aalborg University [22].
5. Damage Measurement
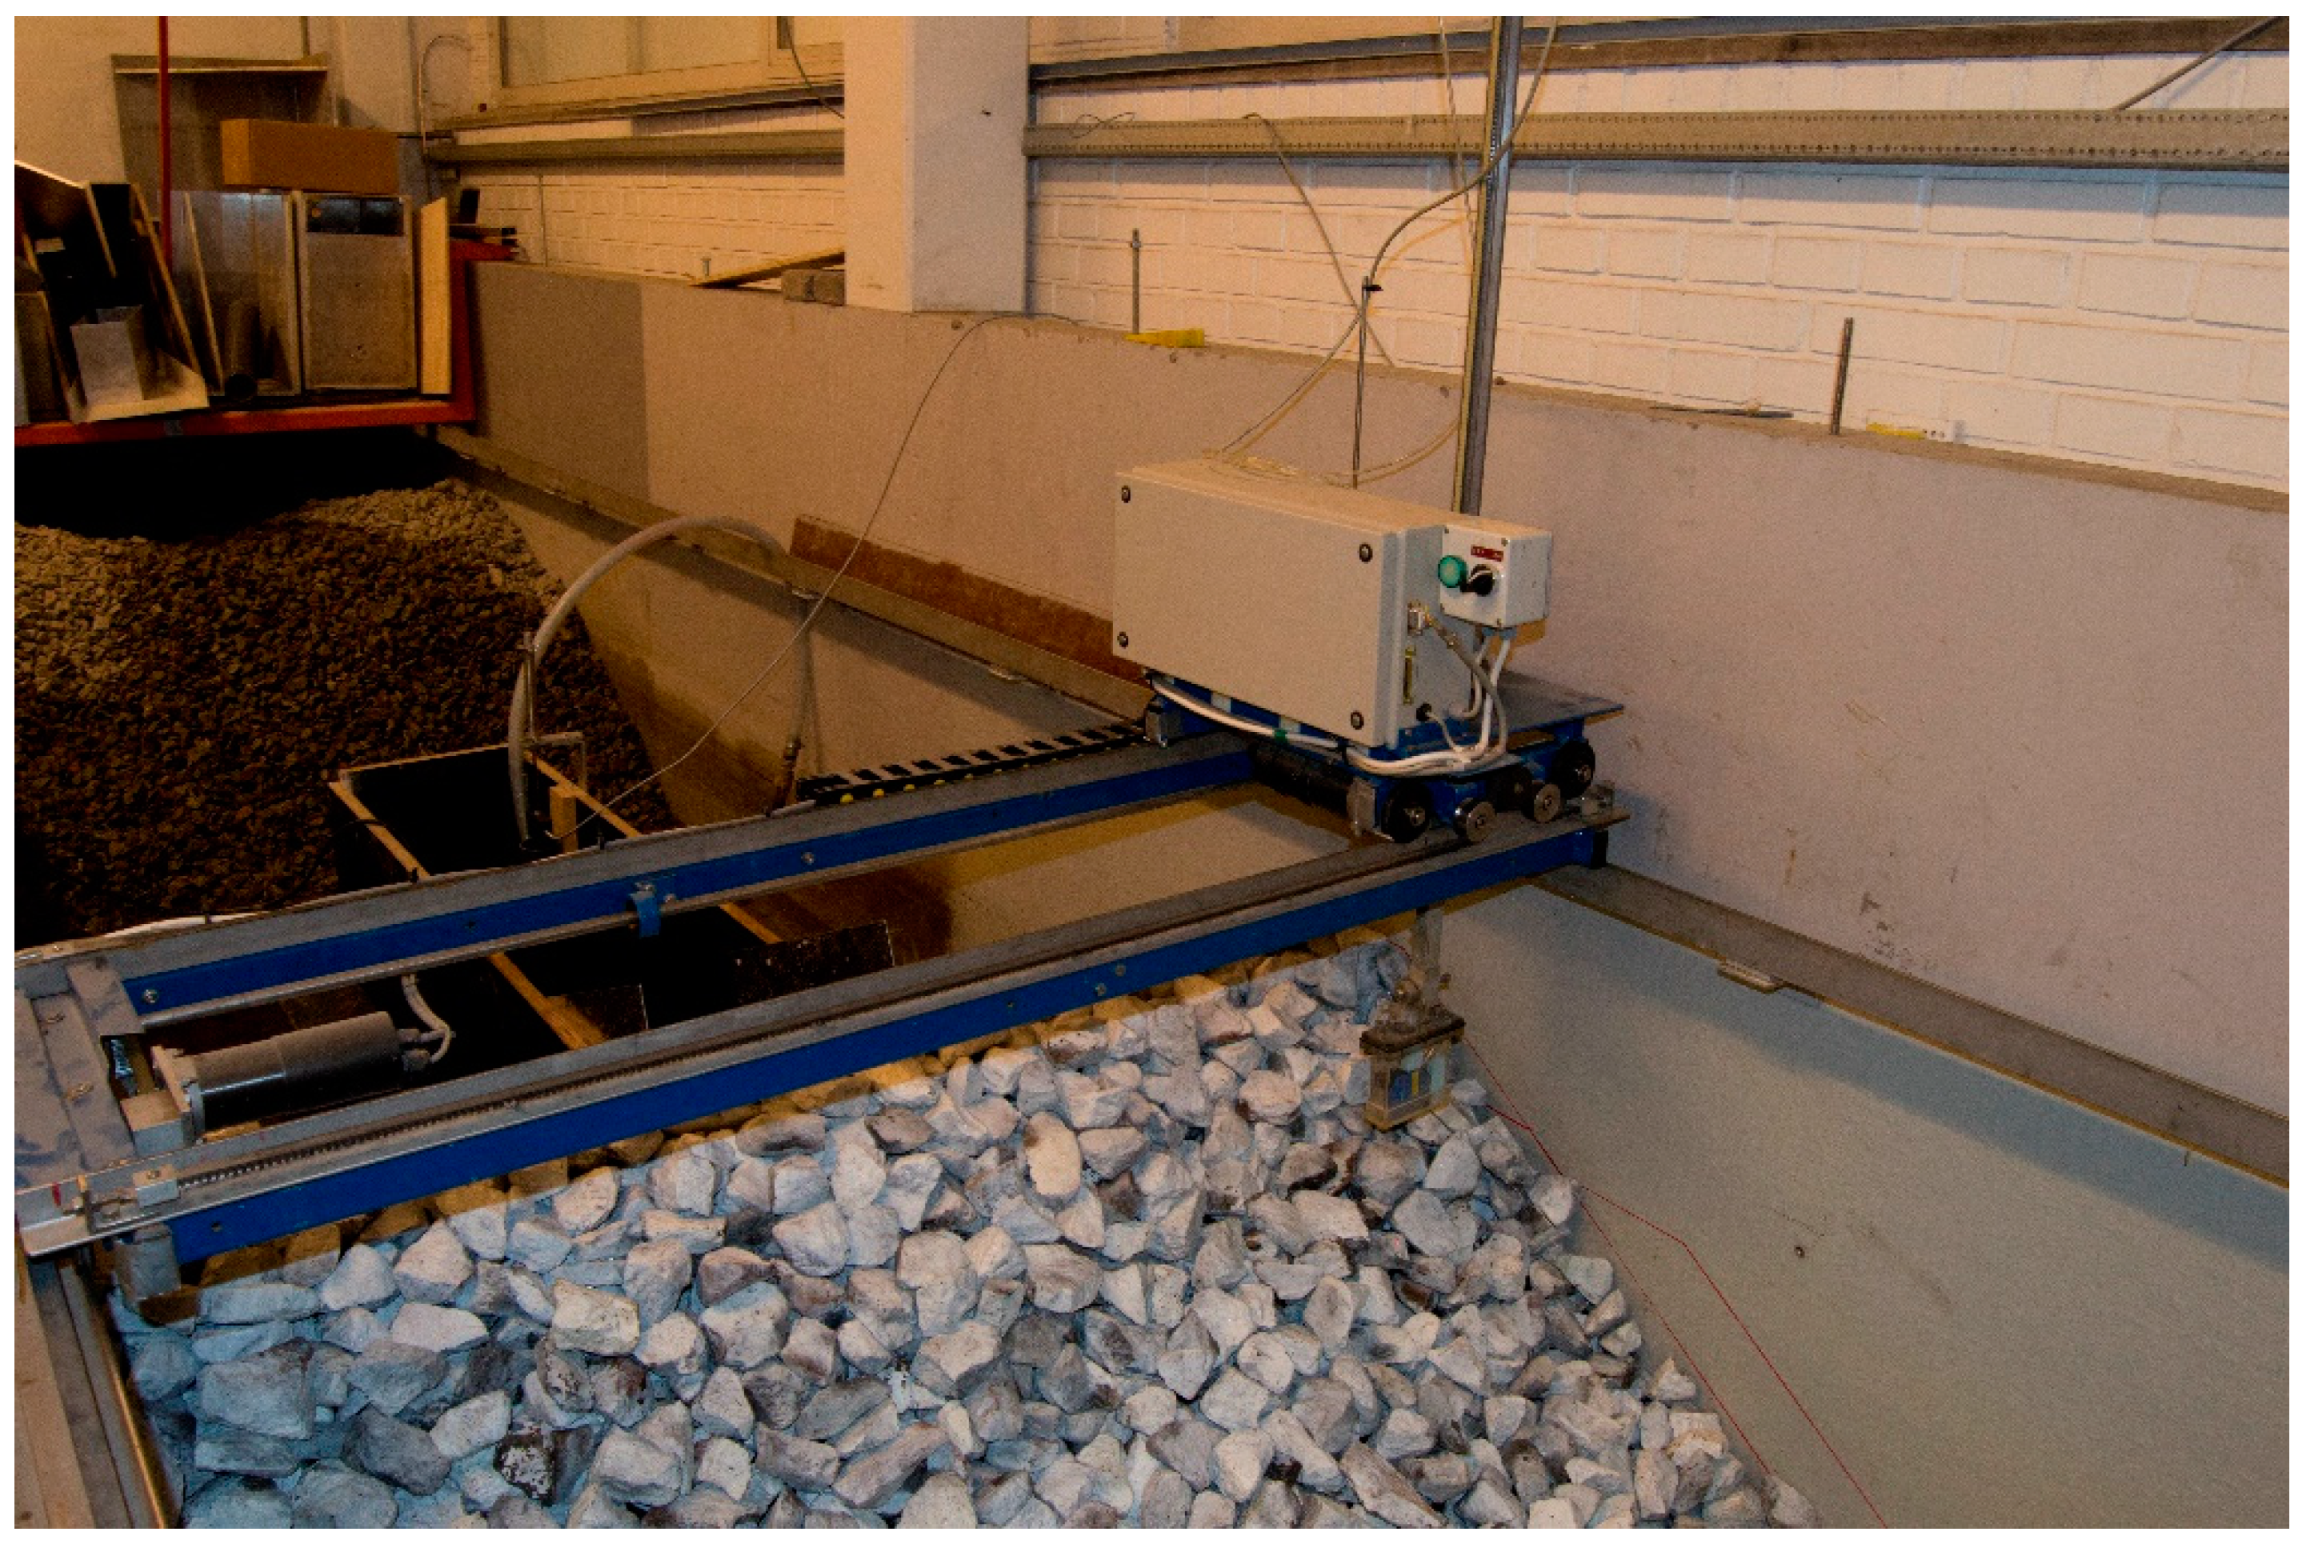
After each test, the reshaped profile was measured by a computer controlled non-contact laser profiler run by the software EPro by Aalborg University [23], cf. Figure 7. The measurement grid had a spacing of 10 mm in length and 5 mm in width. The eroded area Ae and the damage Sd = Ae/Dn50A2 given in the present paper were based on average values (averaged over the measurement grid) where 20 cm on each side of the flume was disregarded to minimize effects from the walls. Furthermore, only the part of the eroded area where clear erosion was observed was evaluated, which means that small settlements on the upper part of the slope were not included in the eroded area. This is in agreement with the procedure used by Van der Meer [1].
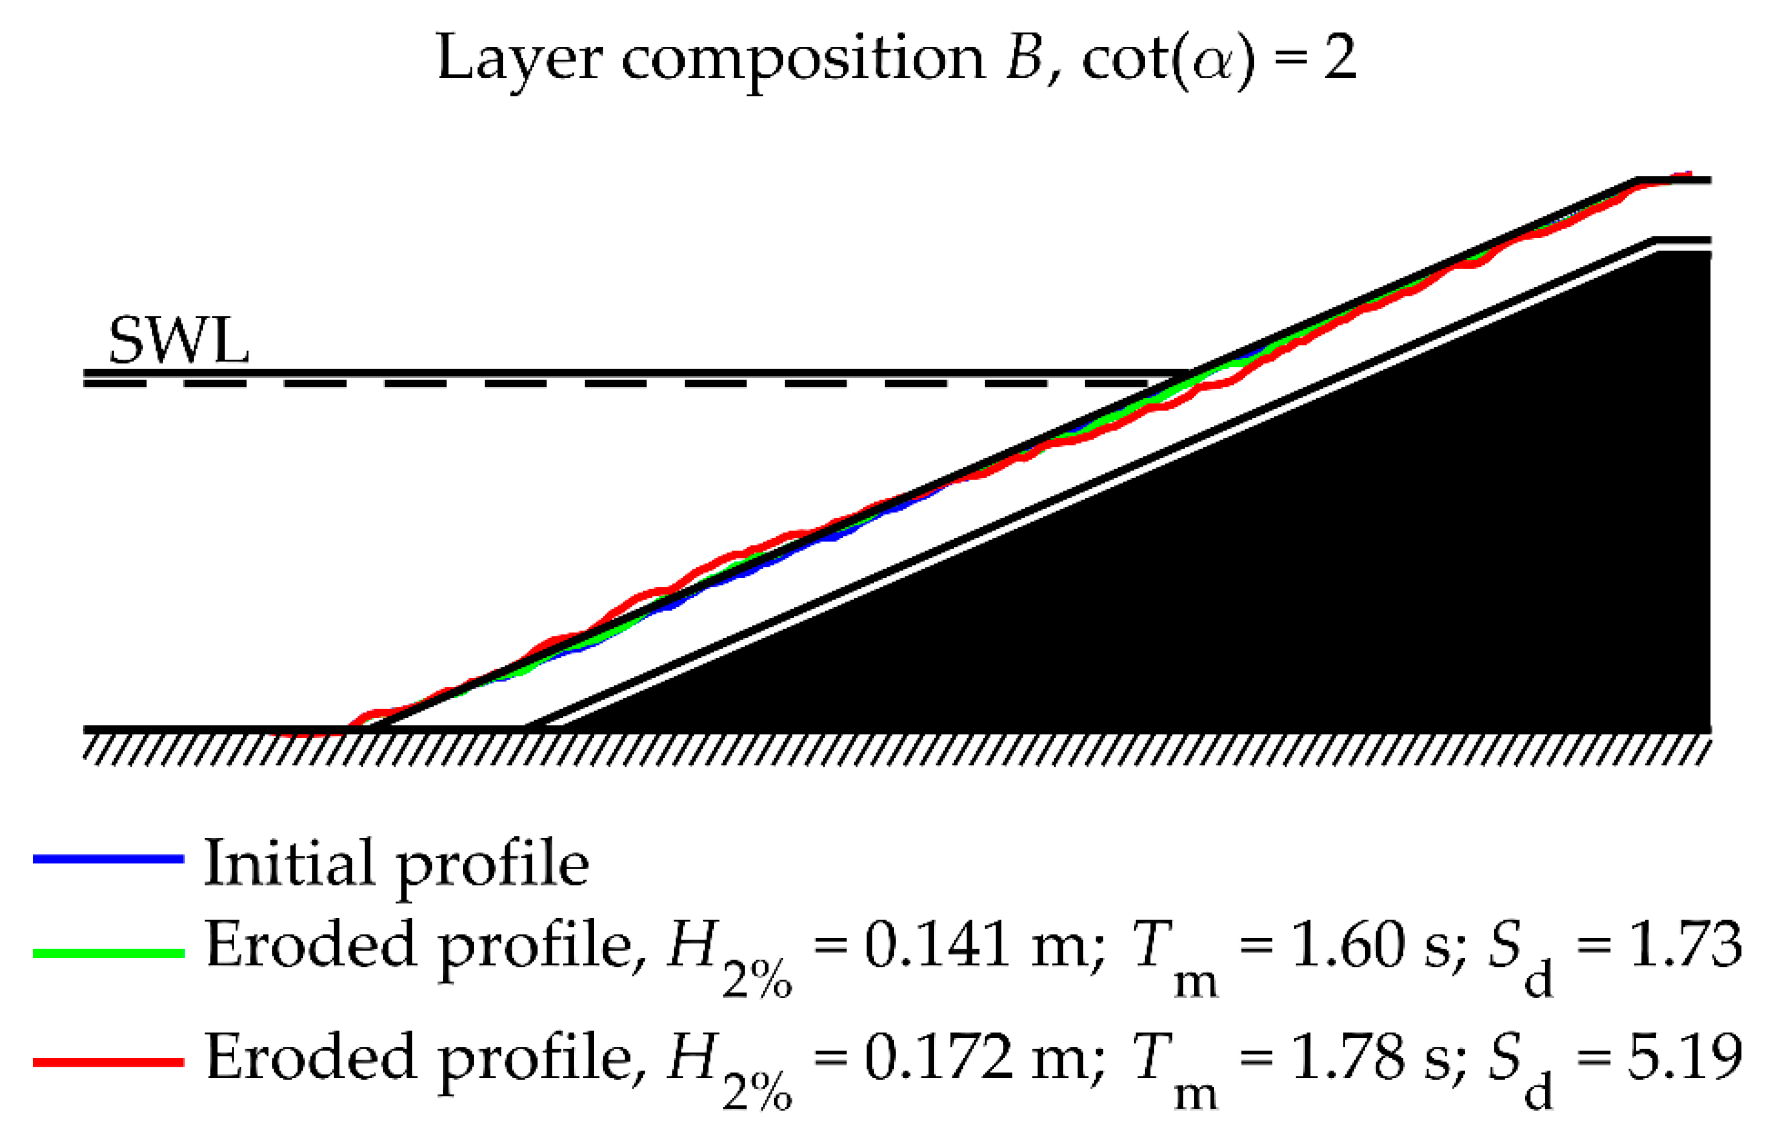
To get more exact measurements, the flume was emptied before laser profiling. Figure 8 shows an example of the averaged measured profile after two consecutive tests.
6. Test Program and Test Procedure
In total 149 model tests were performed to non-breaking and slightly breaking wave attack on the seven different permeabilities. Table 3 shows the parameter ranges covered by the tests. To ensure that viscous scale effects are negligible, the Reynolds number, given in Equation (2), should be larger than a critical value typically taken as Recrit = 3 × 10⁴ (Dai and Kamel [24]).
where ν is the kinematic viscosity, Dn50A the nominal armor stone size and is the characteristic velocity. This is fulfilled for all layer compositions, cf. Table 3.
The 149 tests consisted of different tests series where the wave height was increased in steps, while the wave steepness remained constant. Accumulated damage was measured after each test in the series. Test series were terminated when the underlayer was visible and as such exposed and, after that, the structure was rebuilt for a new test series. In each test, 1000 waves were used. Van der Meer [1] assumed all structures to be non-overtopped when the dimensionless freeboard (Ac/H1/3) > 1–2, which is valid for all the present tests. Ac is the freeboard, H1/3 is the average of the highest 1/3 of the waves.
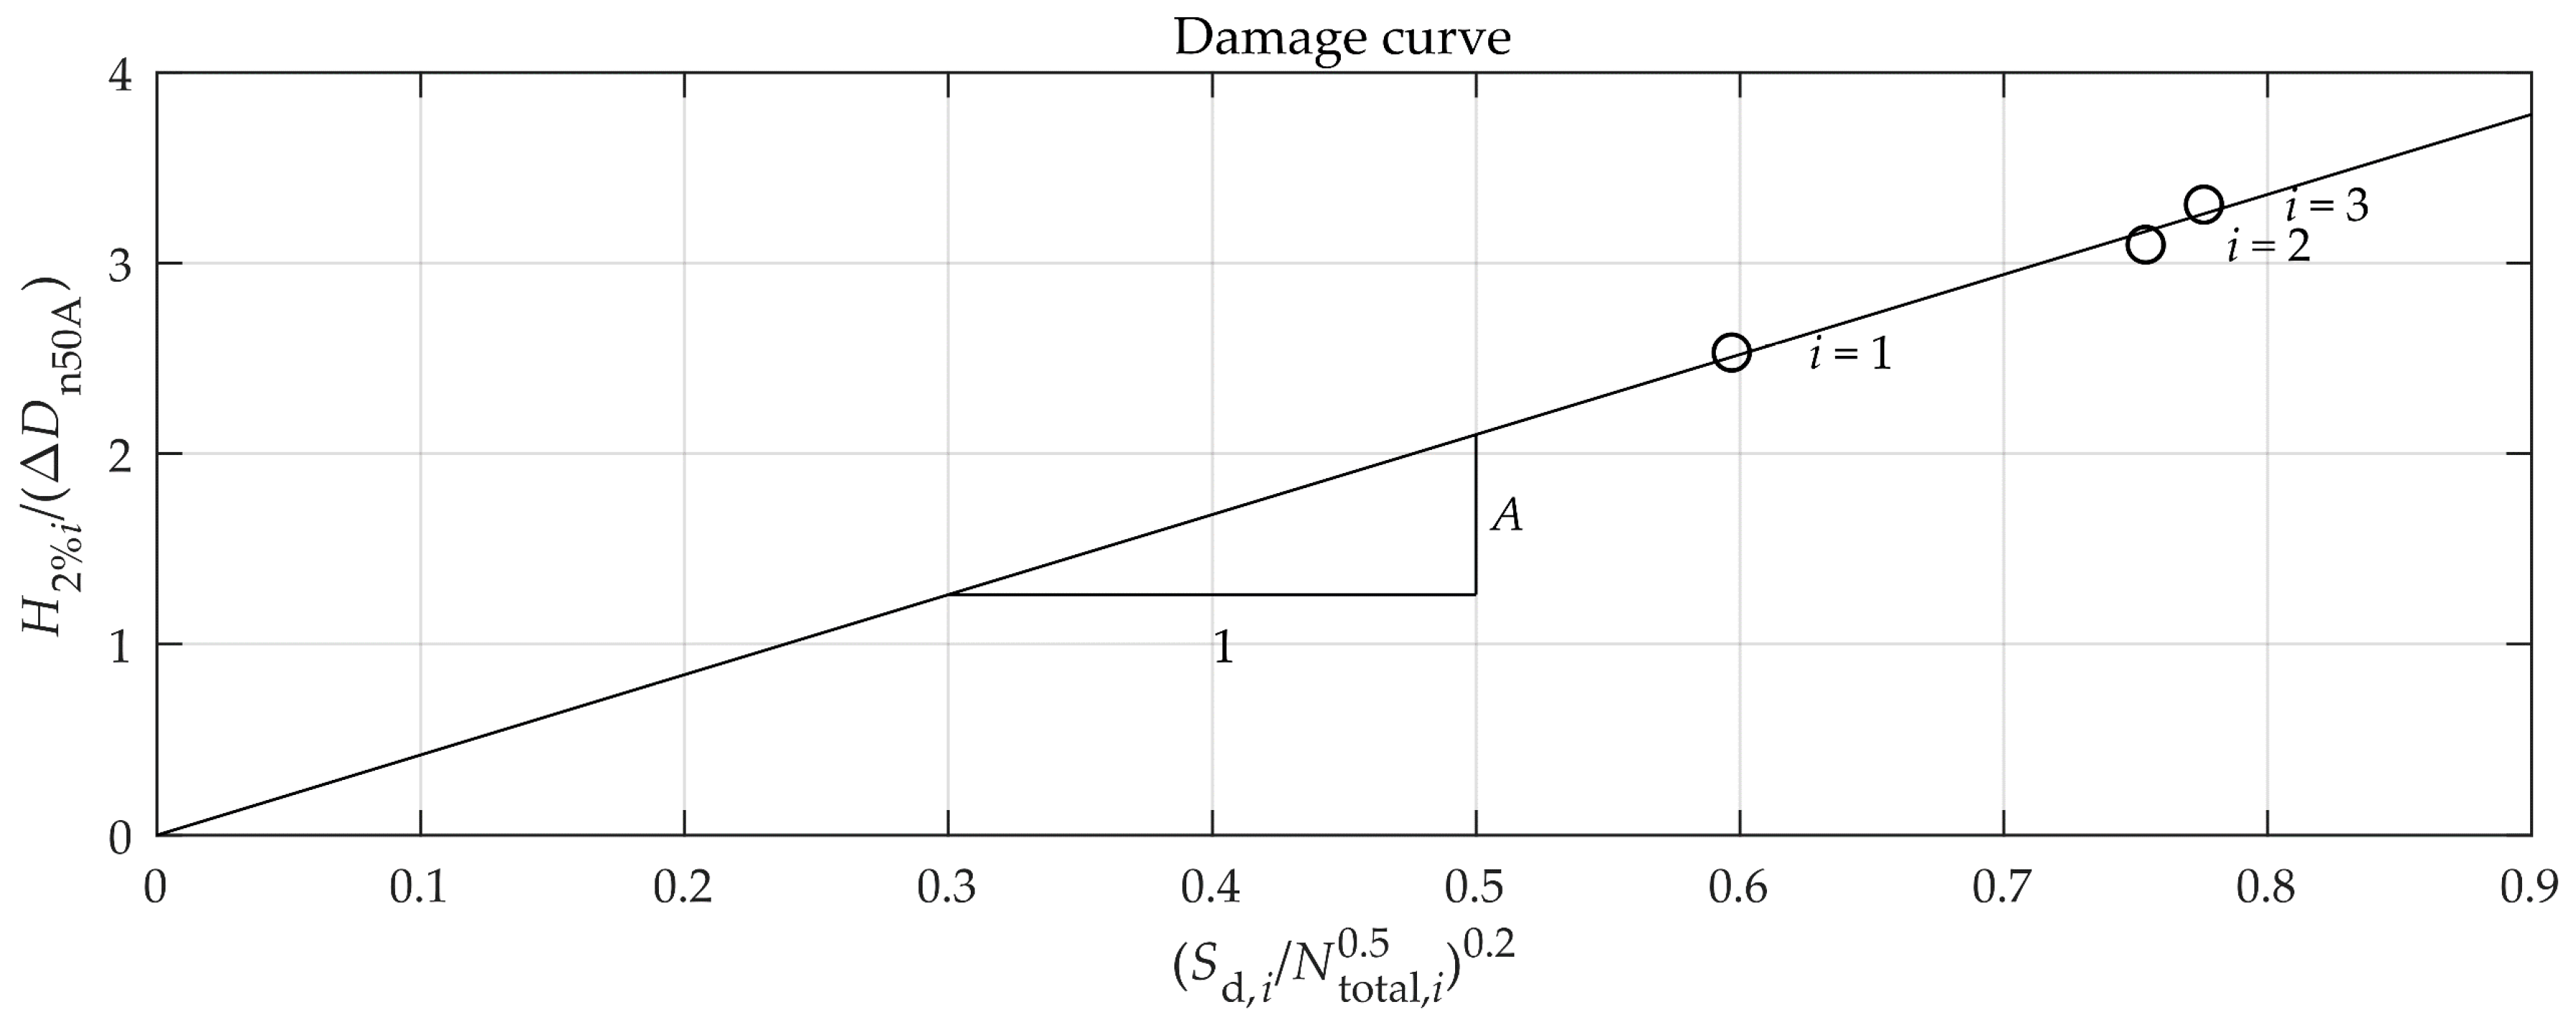
The present test procedure was not identical to that of Van der Meer [1]. He did not measure accumulated damage, but instead the damage after 1000 waves and 3000 waves was measured. Afterwards, the breakwater was rebuilt, and a new sea state was tested. His wave series had a constant wave period with different wave heights. Based on these wave series, he fitted a damage curve for a constant wave period from which he extracted the relation between the wave heights and the damage values in the interval of Sd = 2–17. Thus his stability formulae were established on fitting to the damage curves. The present tests were made with 1–5 wave heights for each wave steepness. Damage curves for each of the present wave series were fitted in the present work. However, because most of the data corresponded to accumulated damage, a conversion to non-accumulated damage with the use of Equation (3) was made in order to comply with the basis of the Van der Meer formulae. The conversion is based on the relations found by Van der Meer [1] between damage, wave height and number of waves. The remaining parameters in the Van der Meer formulae are kept constant in the test series and are thus included in A. A is the slope of the continuous line seen in Figure 9, which describes the relation between the damage, the number of waves and the wave height. For the accumulated test series (i > 1) an extra number of waves Nextra,i were added to the number of waves Ni used in the test. Since the extra number of waves is a function of A, an iterative procedure was applied to Equation (3) until convergence of A was found.
In the tests series of Van der Meer [1] and Thompson and Shuttler [3] the breaker parameter was not kept constant. Consequently, their tests series do not correspond to a constant value of A. However, as their tests already represent non-accumulated damage the raw data were instead plotted in Figure 11.
7. Comparison with Physical Tests of Van der Meer
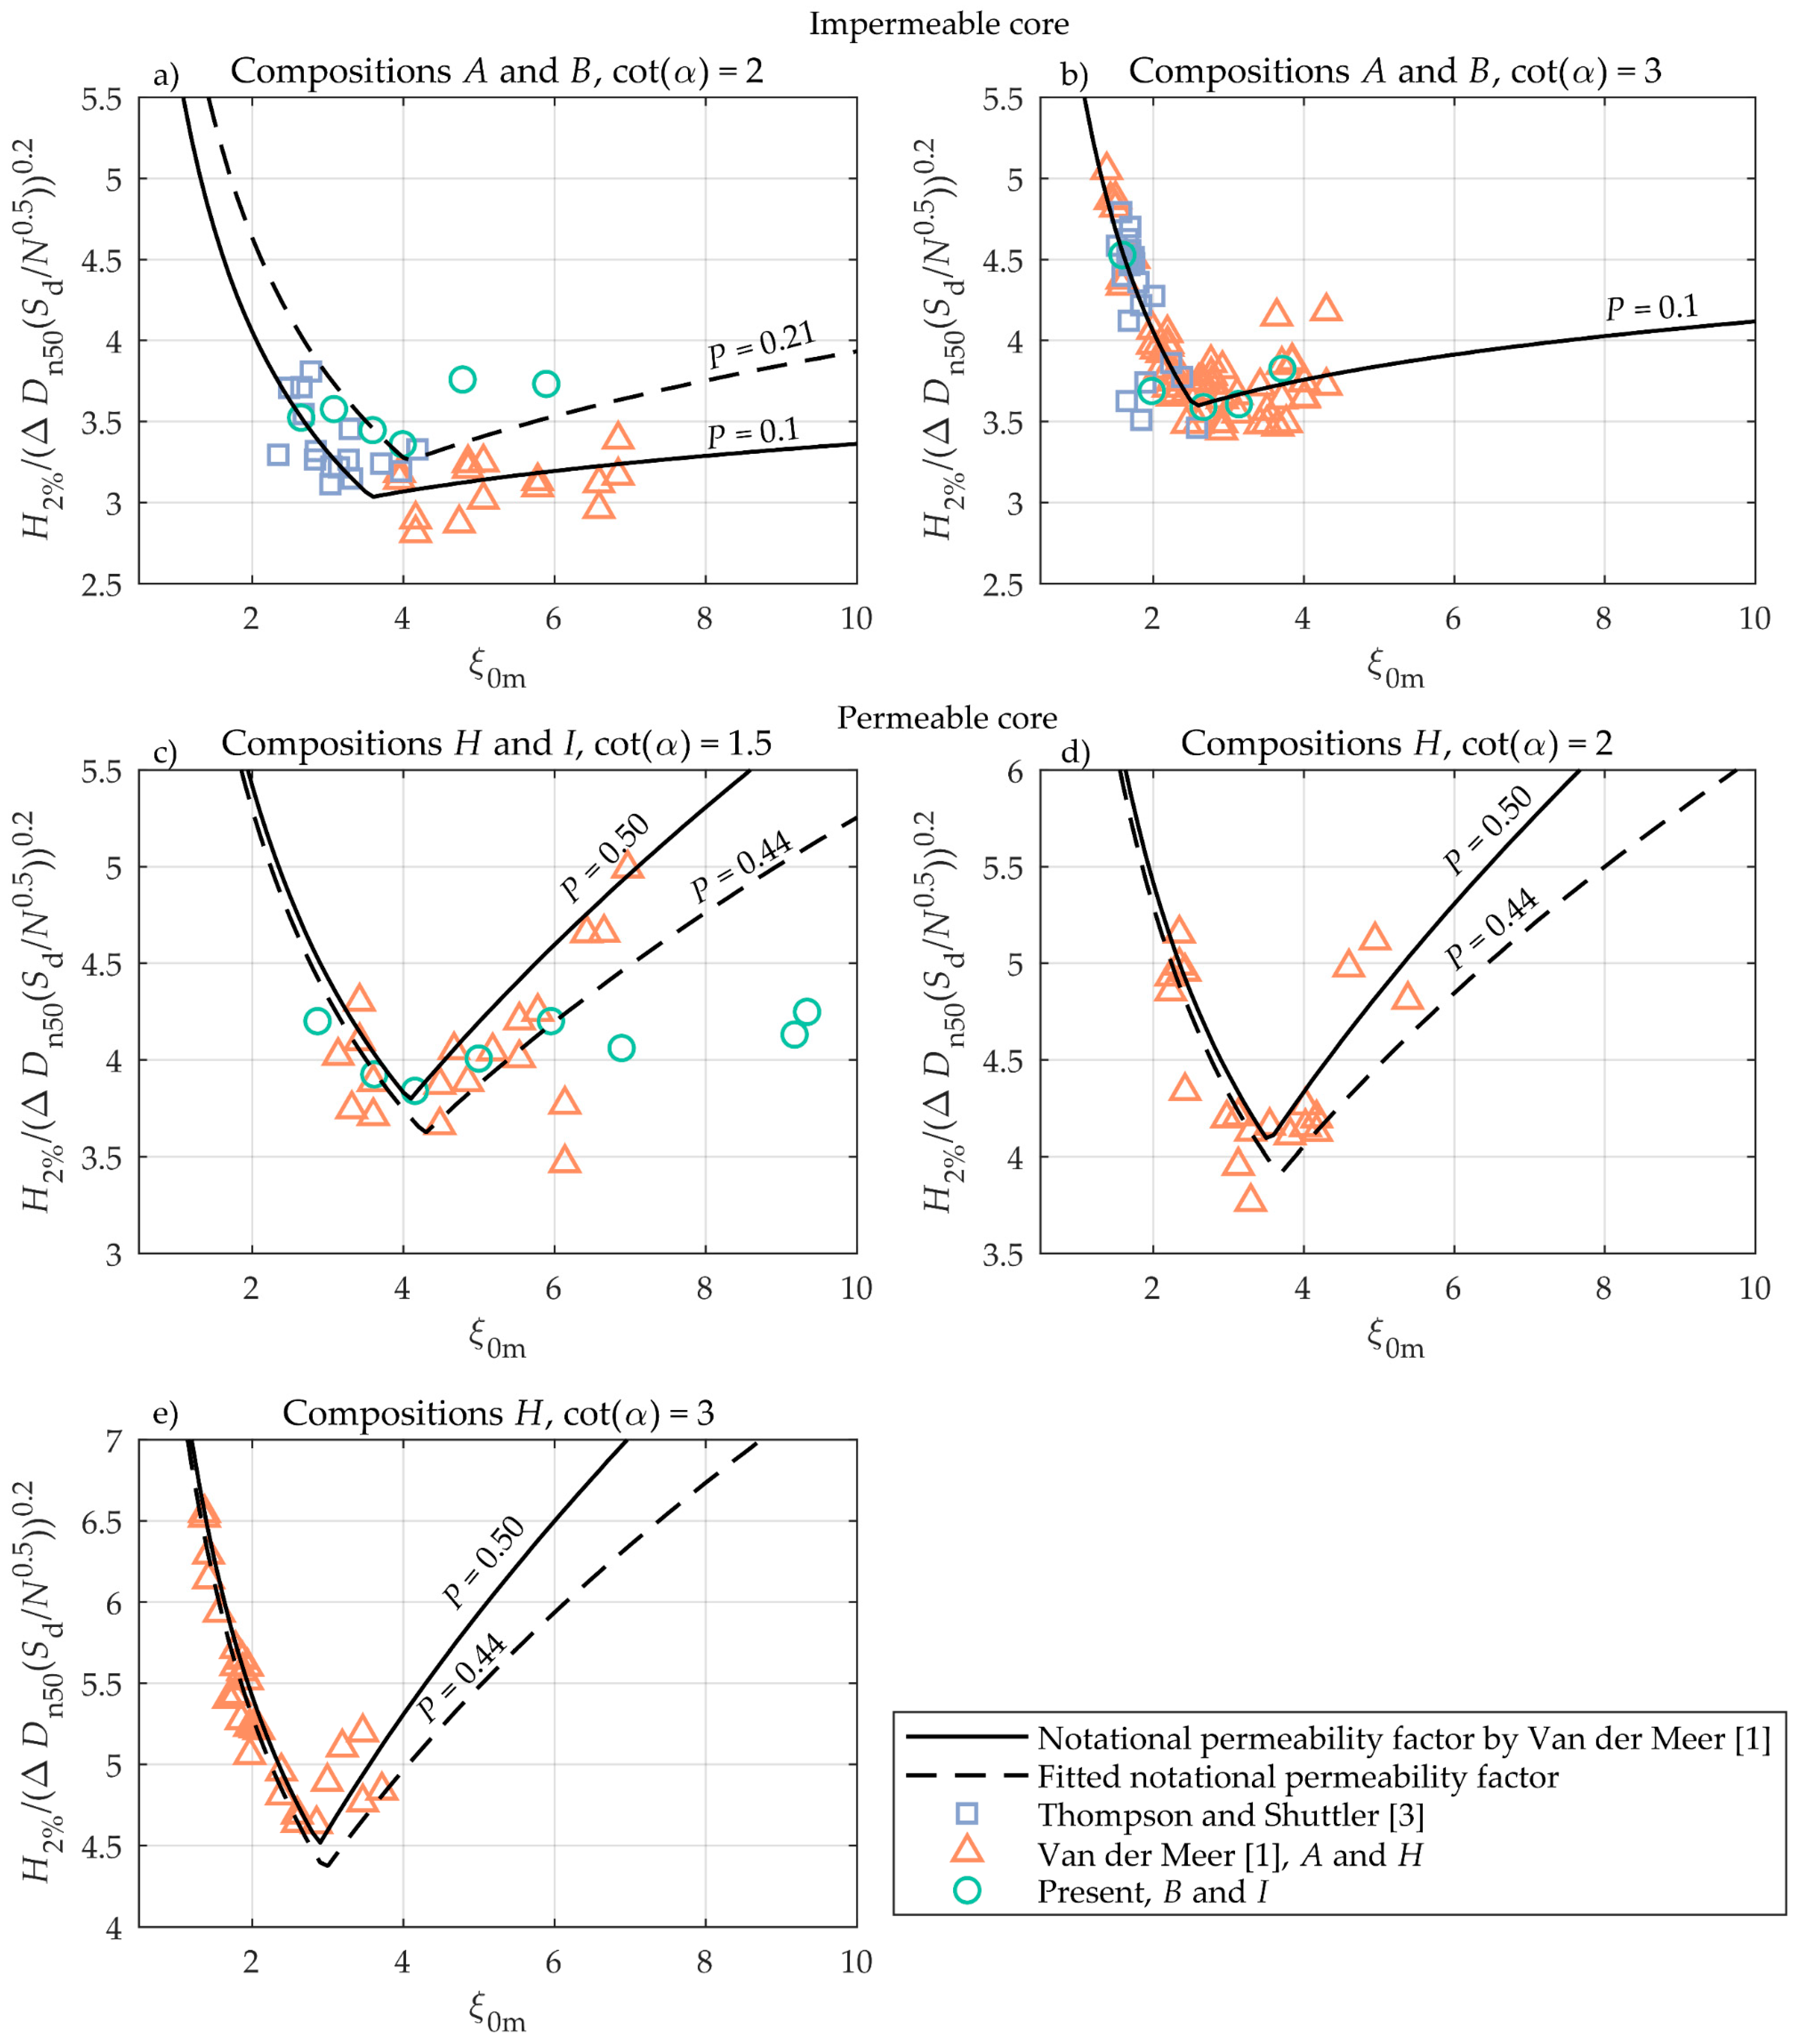
All results of the previously tested layer compositions and the results of Van der Meer [1] and Thompson and Shuttler [3] are shown in Figure 10. The estimation of the notional permeability of the present layer compositions is based on minimization of the root mean square error (RMSE) on H2%/(ΔDn50A(Sd/N0.5)0.2) in the context of the Van der Meer formulae. The waves in the tests by Van der Meer [1] and Thompson and Shuttler [3] are all in deeper water for which wave heights can be assumed Rayleigh distributed, i.e., H2% = 1.4H1/3. The results are shown for measured damage levels in the range 2 ≤ Sd ≤ 8 for cot(α) = 1.5 and 2, and damage levels in the range 2 ≤ Sd ≤ 12 for cot(α) = 3.
Figure 10a,b show the results of the composition with an impermeable core for slopes cot(α) = 2 and cot(α) = 3 for compositions A and B. While the results for cot(α) = 3 seemed in fair agreement with a fitted P = 0.10, the results for the steeper cot(α) = 2 disagreed in the surging wave domain. Quite higher stability in the surging domain and P = 0.21 were found for cot(α) = 2.
In the present layer composition B, the grading ratio of the filter layer is Dn85/Dn15 = 1.33 compared to Dn85/Dn15 = 2.25 used in the tests by Van der Meer [1]. This difference makes the present filter layer more permeable due to a larger porosity, which increases the stability. Furthermore, Van der Meer [1] tested two grain size distributions of the armor layer for the impermeable layer composition. Dn85/Dn15 = 2.25 was tested with cot(α) = 2, 3, 4 and 6 while Dn85/Dn15 = 1.25 was tested with cot(α) = 3 and 4. Thus he did not test the impermeable layer composition with Dn85/Dn15 = 1.25 for ξ0m >> 4, see Figure 10b. Comparing the armor layer for compositions A and B for cot(α) = 2 shows that the present compositions has a more narrow gradation and thus a more permeable armor layer. The combination of a more permeable armor layer and filter layer might be the reason for the increase in armor stability of the present tests for ξ0m > 4 for cot(α) = 2. The results were too few to prove a significant change to the notional permeability factor and it was kept to P = 0.1 to be on the safe side.
Figure 10c shows the results of layer compositions H and I. The present data were for most of the tests within the scatter of the data by Van der Meer [1]. Two of the tests (ξ0m ≈ 9) were significantly more unstable than predicted by the formula with P = 0.5. These two tests with very low steepness waves were outside the applicability range (0.7 < ξ0m < 7) of the Van der Meer [1] formulae and therefore not used in the fitting of P. However, the reason for the two tests deviating might be related to the lower water depth used in the present tests as the wavelength of the large wave period was significantly more affected by the water depth compared to smaller wave periods. It should also be noted that Van der Meer had two significant outliers at ξ0m ≈ 6. The present tests had for composition H with slopes cot(α) = 1.5, 2.0 and 3.0 a fitted P = 0.44, which was lower than the value P = 0.5 given by Van der Meer [1], see Figure 10c–e. However, it should be noted that the Van der Meer formulae with P = 0.5 overpredicted the stability for all of his own data for cot(α) = 1.5.
Considering the differences in layer compositions, there seems to be a fair agreement between the present results and the results of Van der Meer. Therefore, new layer compositions can be tested and a notional permeability factor can be fitted with use of the formulae by Van der Meer [1].
8. Notional Permeability for New Layer Compositions
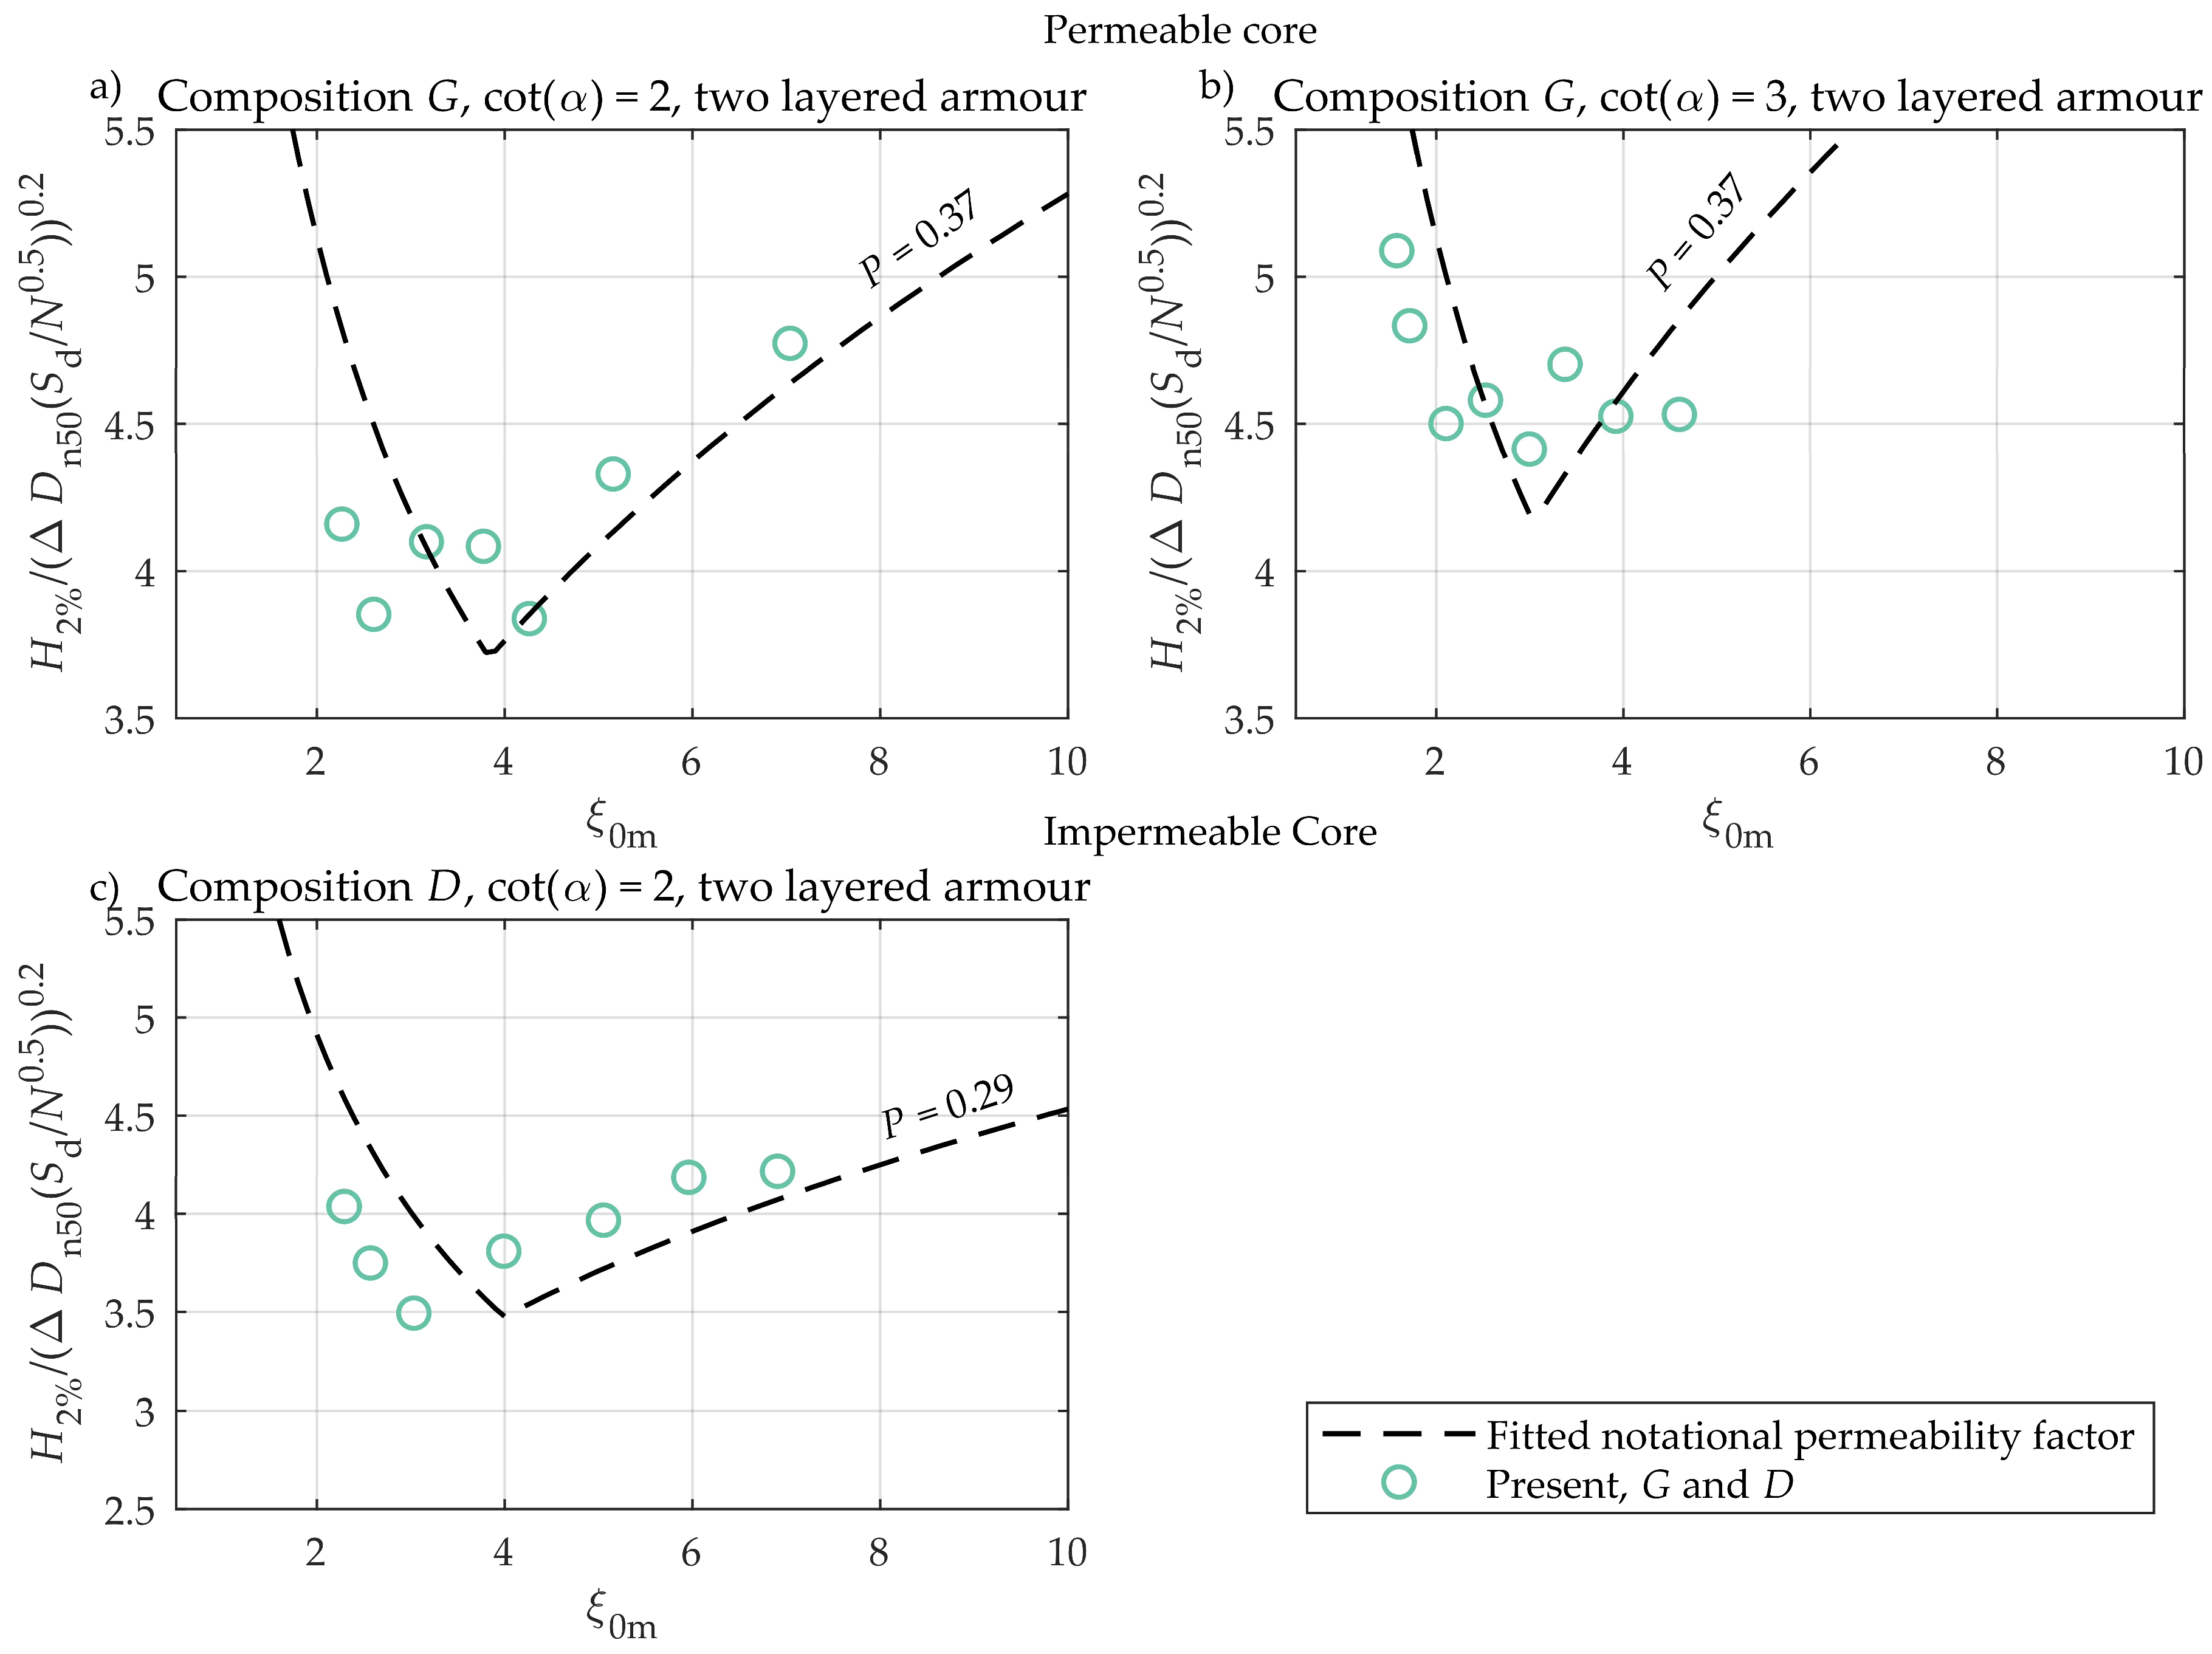
Figure 11 and Figure 12 show the fitted notional permeability factors for the new layer compositions. The results of the layer compositions with an armor layer thickness of two rocks are shown in Figure 11 and results of the three layered armor thickness are shown in Figure 12. Since compositions with an armor layer thickness of three rocks could suffer more damage before failure than an armor layer thickness of two rocks, a wide damage level range of 2 ≤ Sd ≤ 12 was included in the analysis.
Figure 11a,b shows the results of the layer compositions G with a permeable core, one underlayer and an armor layer. By fitting the present results of layer composition G to the formulae by Van der Meer, a notional permeability of P = 0.37 was found for the lowest RMSE for both front slopes. This notional permeability was significantly lower than P = 0.46 found by Kluwen [6] (composition L) for an almost identical composition. The reason for the differences in the P value is not clear.
Figure 11c shows the results of layer composition D with an impermeable core, two underlayers and an armor layer. The lowest RMSE was found for a notional permeability of 0.29. This notional permeability was significantly larger than P = 0.1 given for layer composition A and B, which also has an impermeable core, cf. Figure 10a. Even though the fitted notional permeability factor for layer composition B was P = 0.21 the increase of the notional permeability factor for layer composition D was significant. The notional permeability factor was significantly influenced by the layer thickness of the permeable layers for compositions with an impermeable core. The results with the fitted P were in good agreement with the Van der Meer formulae, but a slight underprediction was observed for the data in the plunging regime and overprediction in the surging regime.
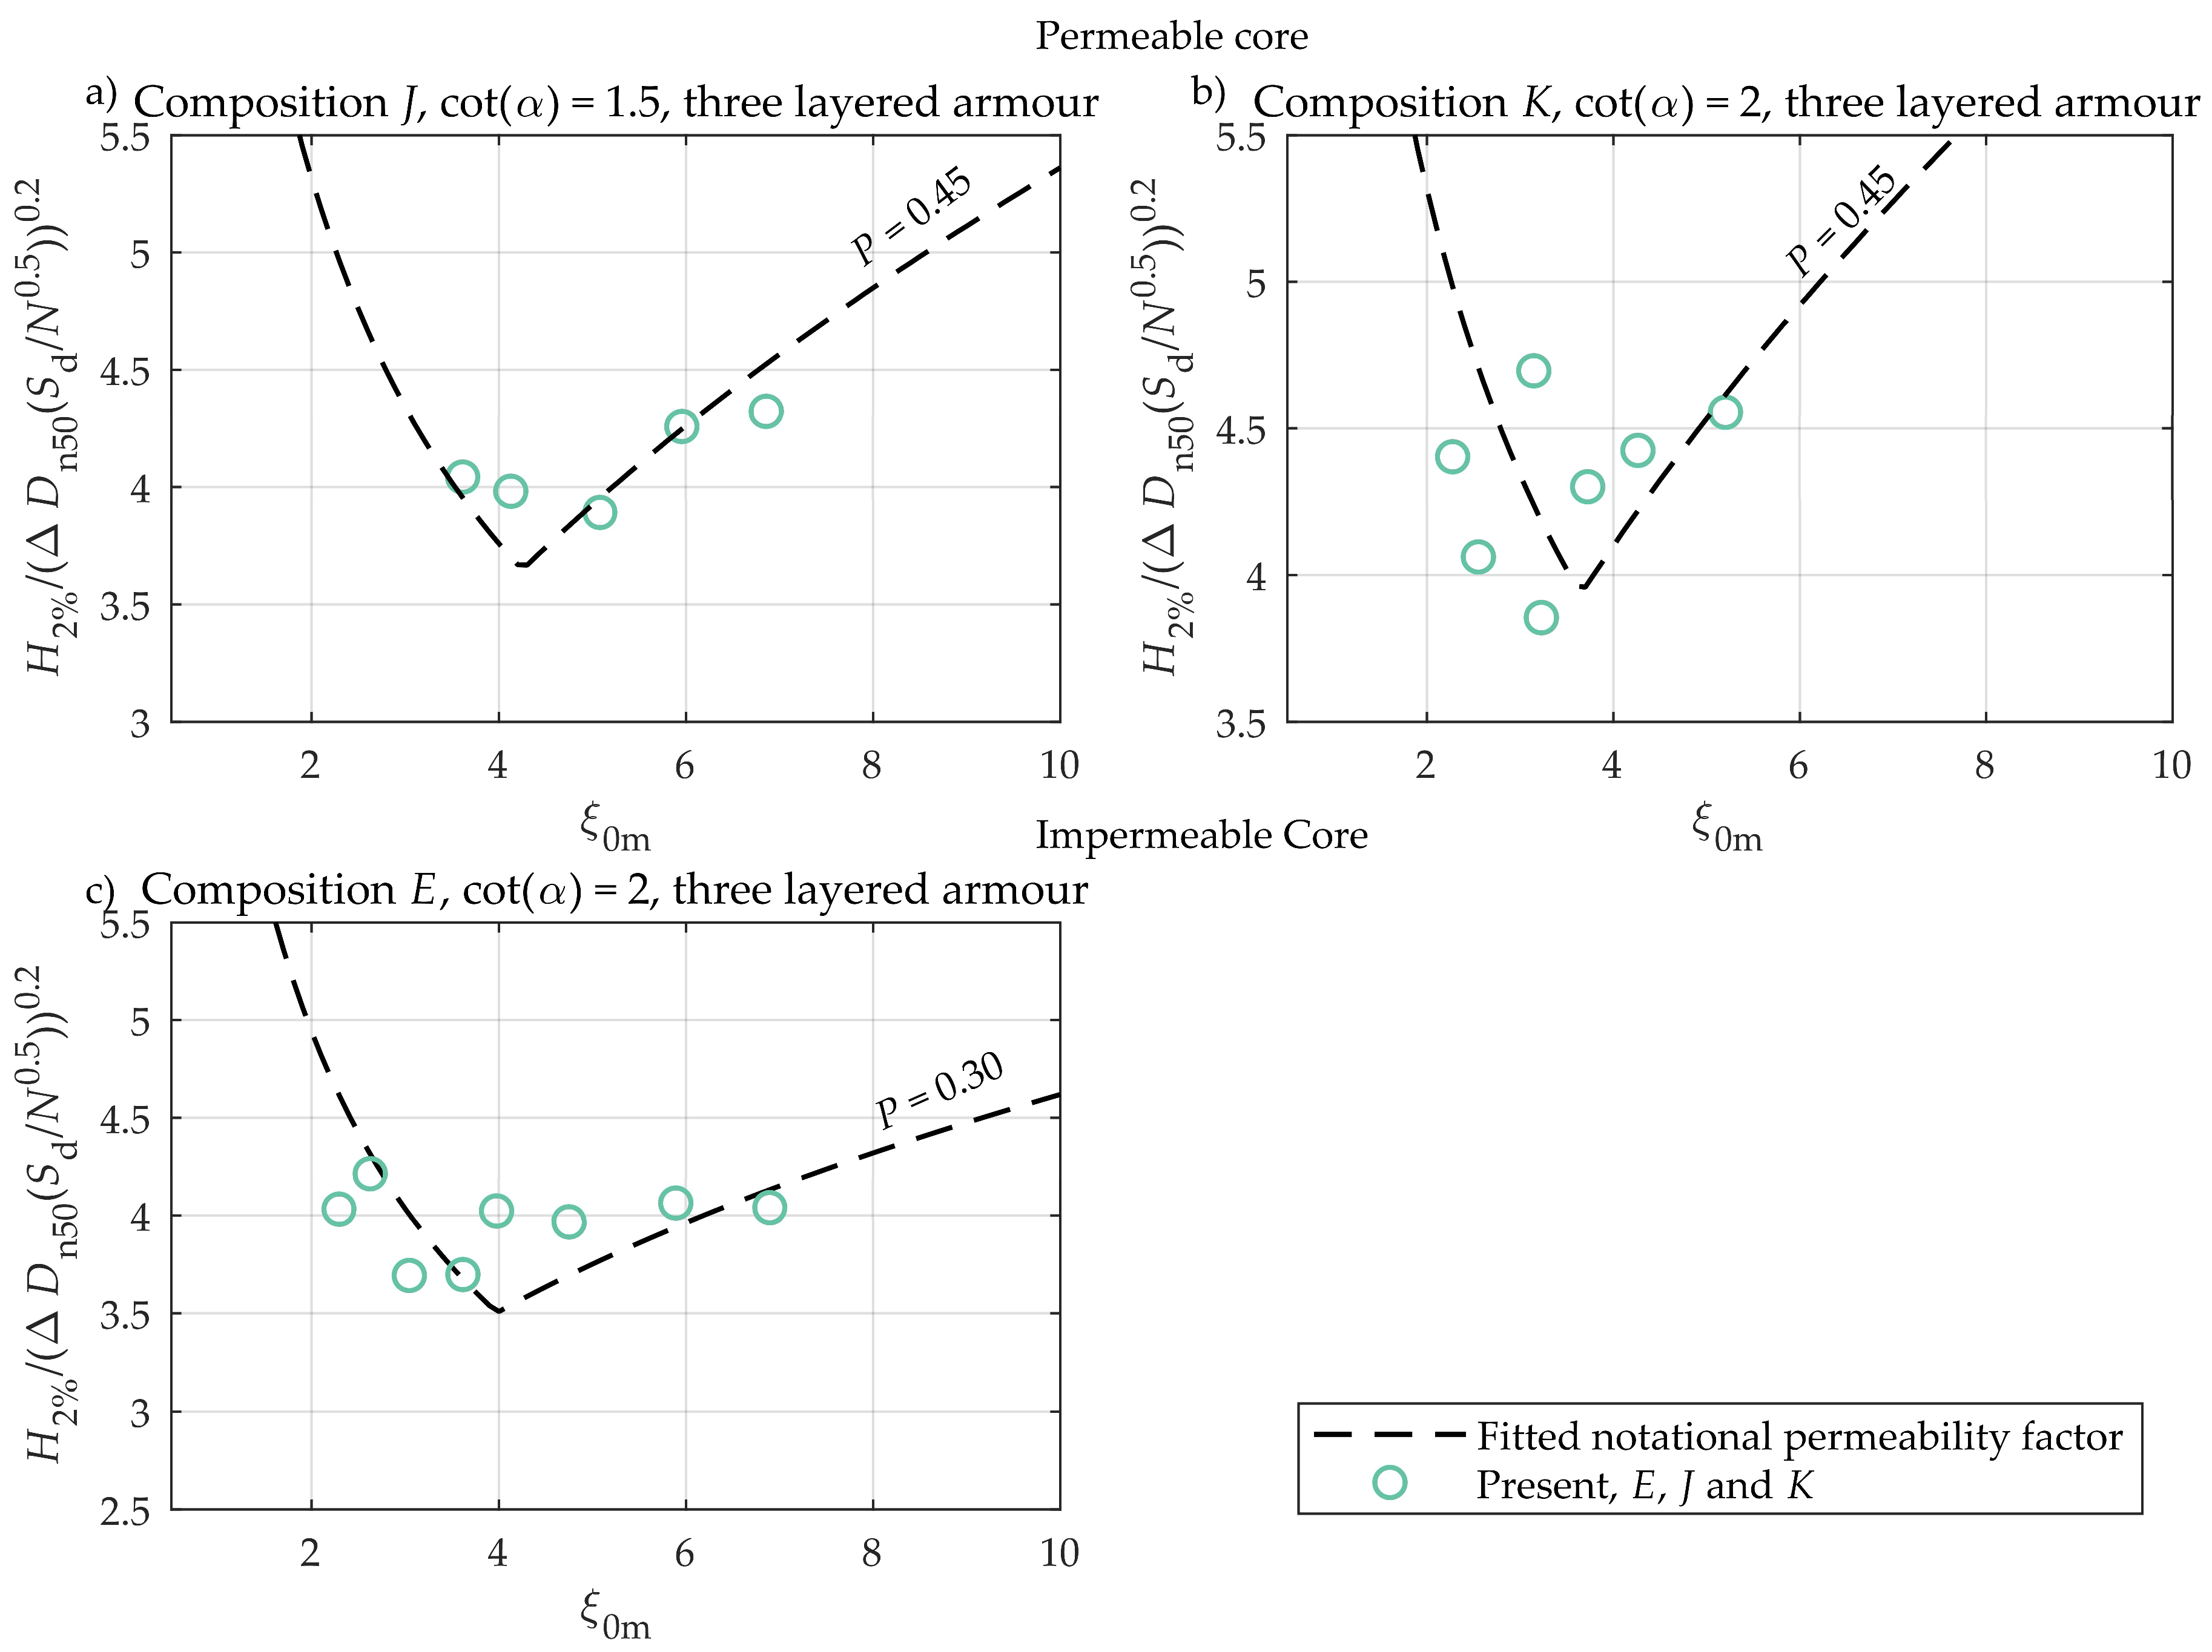
Figure 12a shows the results of layer compositions J with a permeable core and an armor layer. The best fitted notional permeability factor was found for P = 0.45. The results were a close match to the formulae by Van der Meer [1]. Comparing the results to layer composition I in Figure 10c showed that an increase in the armor layer thickness had no significant change to the notional permeability factor.
Figure 12b shows the results of the layer composition K with a permeable core, one underlayer and an armor layer. The composition had a fitted notional permeability factor of 0.45. Comparing the results to layer composition G in Figure 11a shows that the increase in the armor layer thickness has a small influence to the notional permeability factor. Thus for the finer core material, the influence of the armor layer thickness was higher compared to a coarse permeable core. The scatter of the stability results was significant but it was clear that the stability was increased when comparing Figure 11a and Figure 12b. Therefore, an increase of the notional permeability factor was also expected when using the formulae by Van der Meer.
Figure 12c show the results of layer composition E with an impermeable core, thin filter layer and an armor layer. Layer composition E had a best fitted P = 0.30 and the results were only having small deviations with the Van der Meer formulae at the transition between the plunging and surging formulae. Comparing the results to layer composition B in Figure 10a shows that an increase in the armor layer thickness increased the notional permeability factor significantly. Thus the notional permeability for structures with an impermeable core seemed very sensitive to the layer thickness and material size of the permeable layers. This was also observed by Van der Meer et al. [7]. Moreover, the results show that the effect of armor layer thickness for a coarse permeable core was far from being as significant as found for an impermeable core.
The experimental results allowed the effect on the notional permeability of upgrading two layer rock armor to three layer rock armor to be extracted. Table 4 shows that the influence of the thickness of the armor layer on the notional permeability factor was largest for impermeable layer compositions like B and E, and smallest for permeable layer compositions like G and K.
9. New Method for the Estimation of the Notional Permeability Factor
Application of the Van der Meer rock armor stability formulae for desk study design of new rock armor layer compositions demands knowledge of the notional permeability factor P. In the introduction we explained that application of numerical models might help estimating the notional permeability. However, such approach has some difficulties. First of all the notional permeability has no physical meaning as also explained by Van der Meer [1]. It is a parameter fitted to a complex formula fitted to physical model tests of armor stability, and could be indirectly related to phenomena as run-up and porous flow resistance/dissipation. Secondly, because numerical models are partly based on parameters fitted to results of physical model tests, direct determination of P from basic physical principles is not possible. Moreover, while the value of the notional permeability is fixed for a specific layer composition, the other phenomena vary with the wave conditions.
A pragmatic approach to obtain a tool for the prediction of the notional permeability would be to fit a formula to all the parameter values obtained in model tests for all tested layer configurations. Such a formula is presented in the following.
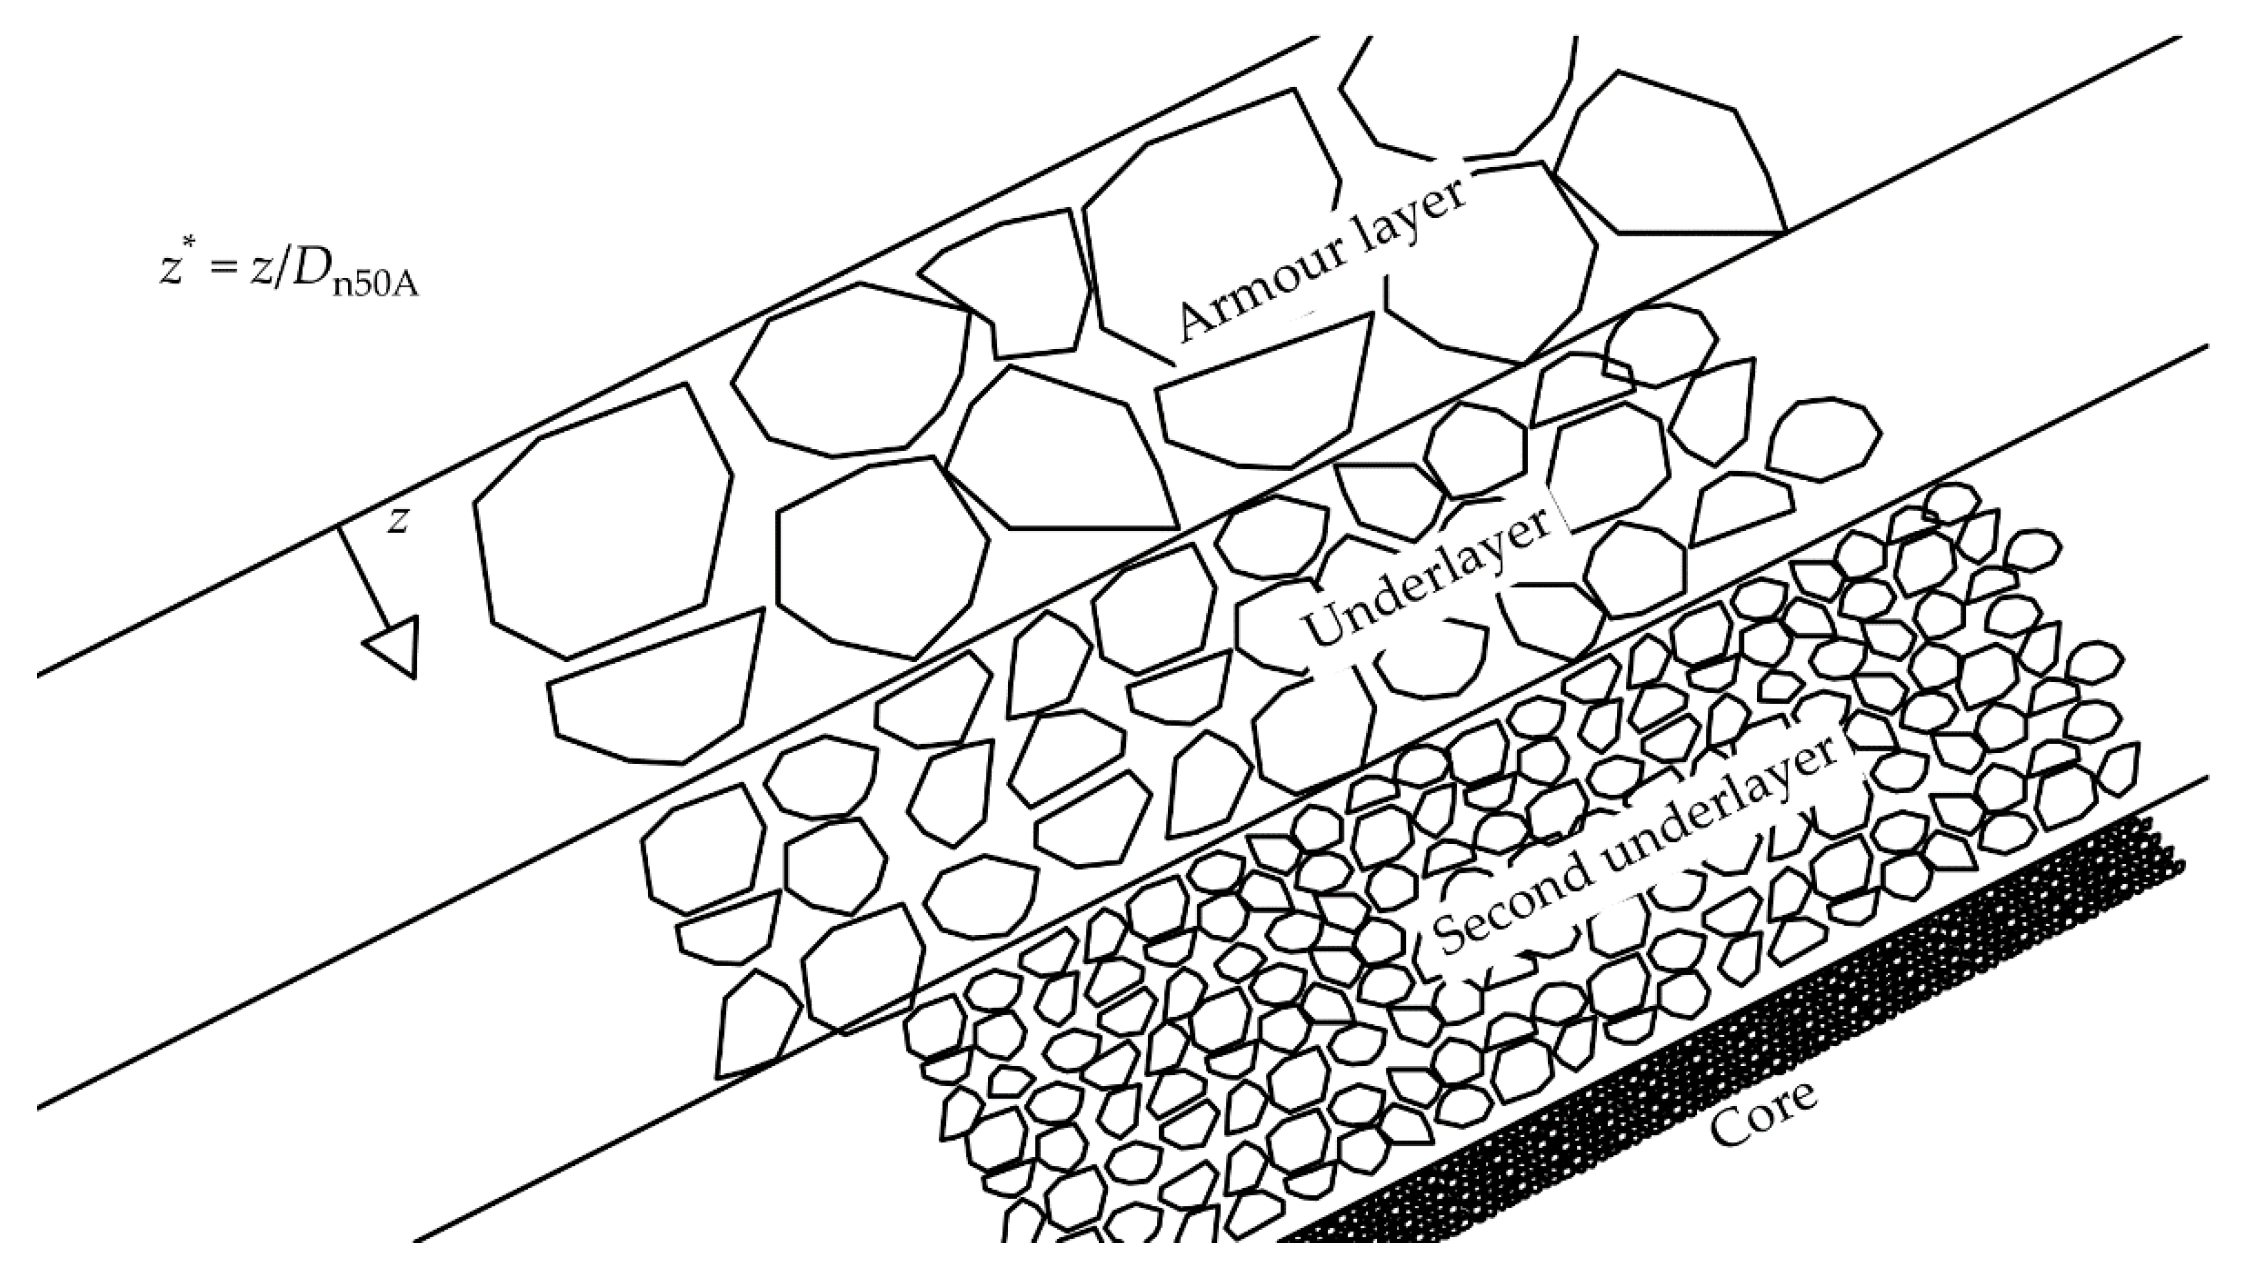
The new formula will include the known physical processes in an empirical way. It is well known that a homogenous structure has the largest P factor, and when introducing a core with smaller size material the wave run-up and the loads on the armor units will increase corresponding to a reduction in the P factor. This is partly due to higher porous flow resistance and a decrease in the buffer capacity of the permeable layers. This effect on the P factor is clearly seen when comparing composition M with I and G in Figure 1. Furthermore, the structure stability is influenced by the thickness of the layers. Comparing the tests with an armor layer thickness of two rocks with the compositions with a thickness of three rocks, it can be seen that the increase in P is largest for compositions where the impermeable layer is closest to the armor layer. This shows that the effect on the P factor from the material size is decreasing with increasing distance into the breakwater. To describe the relative distance from each layer to the surface of the armor layer, a relative distance = z/Dn50A is used. The distance z is perpendicular to the front slope, see Figure 13.
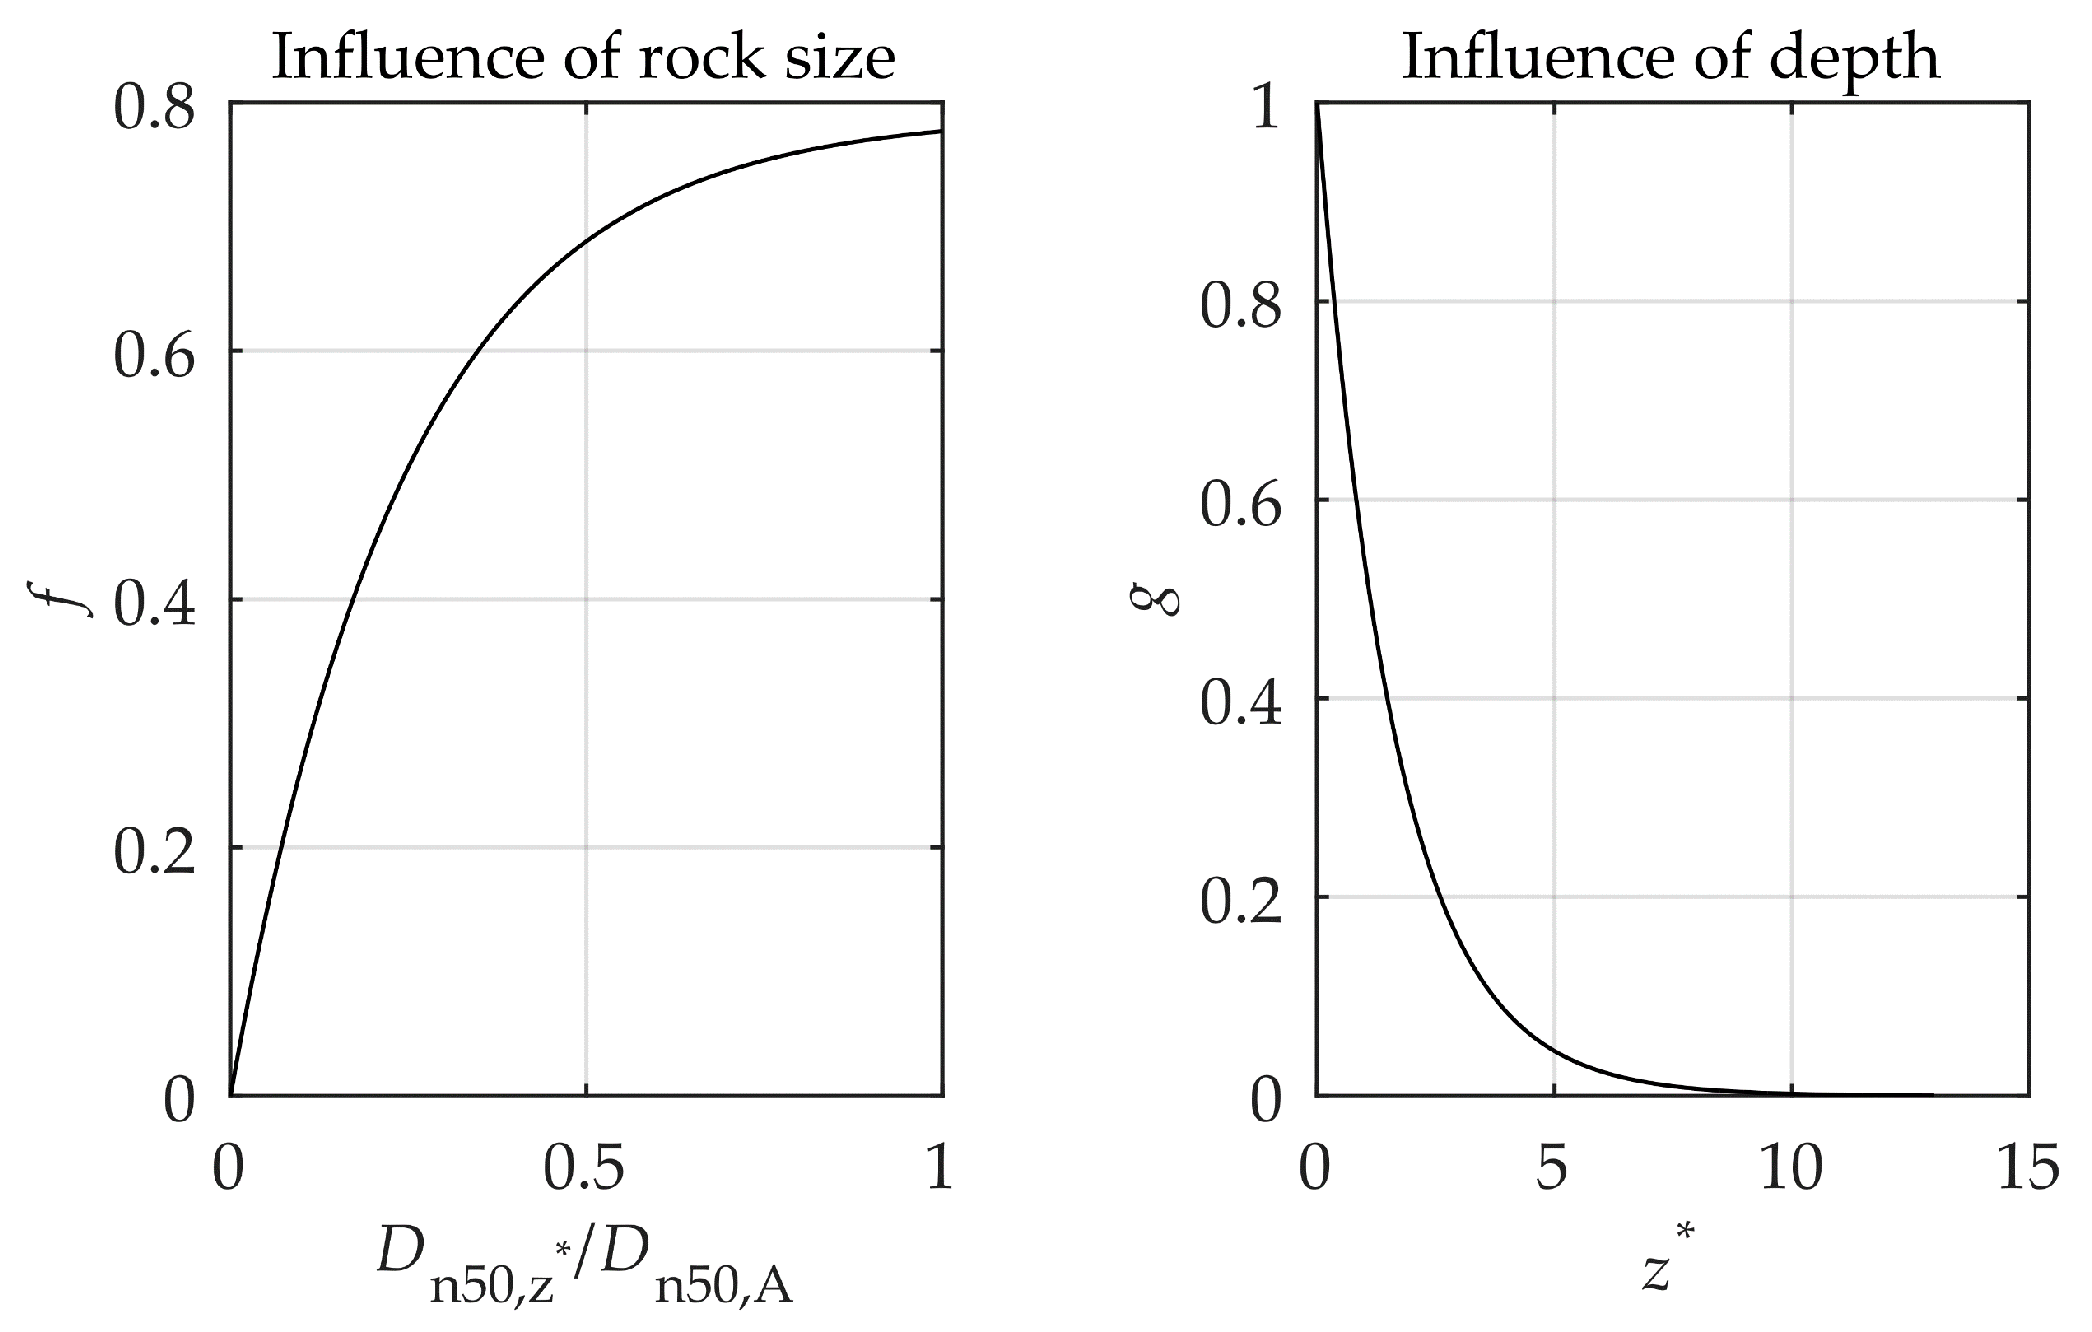
The grading of the materials plays a role because a very wide grading has small porosity. However, this effect cannot be studied based on the present tests as all gradings were narrow with Dn85/Dn15 < 2.25. Therefore, the developed empirical formula is limited to narrow graded materials with grain size distributions within the ranges of the materials tested in the laboratory. Based on the above considerations, the empirical formula for the P factor can be expressed as a function of rock size and the relative depth . The functions f and g defined in Equation (4) and plotted in Figure 14 are empirically fitted to model the influence of the rock size and the relative depths, respectively.
here Dn50A is the nominal size of the armor units, and is the nominal size of the units in the given layer at relative depth .
The g function implies that the layers with the largest influence on the permeability are those close to the slope surface, whereas the f function implies that large material is more permeable than the fine material. Analysis has shown that an integration function, k, giving the influence from the relative rock size and the relative depth, can be used to estimate the notional permeability factor, P(k). The integration function k is given by Equation (5).
is the value of for the impermeable layer, but has a maximum value of 13. For a layer composition consisting of N permeable layers the integration function Equation (5) can be rewritten into a closed form as:
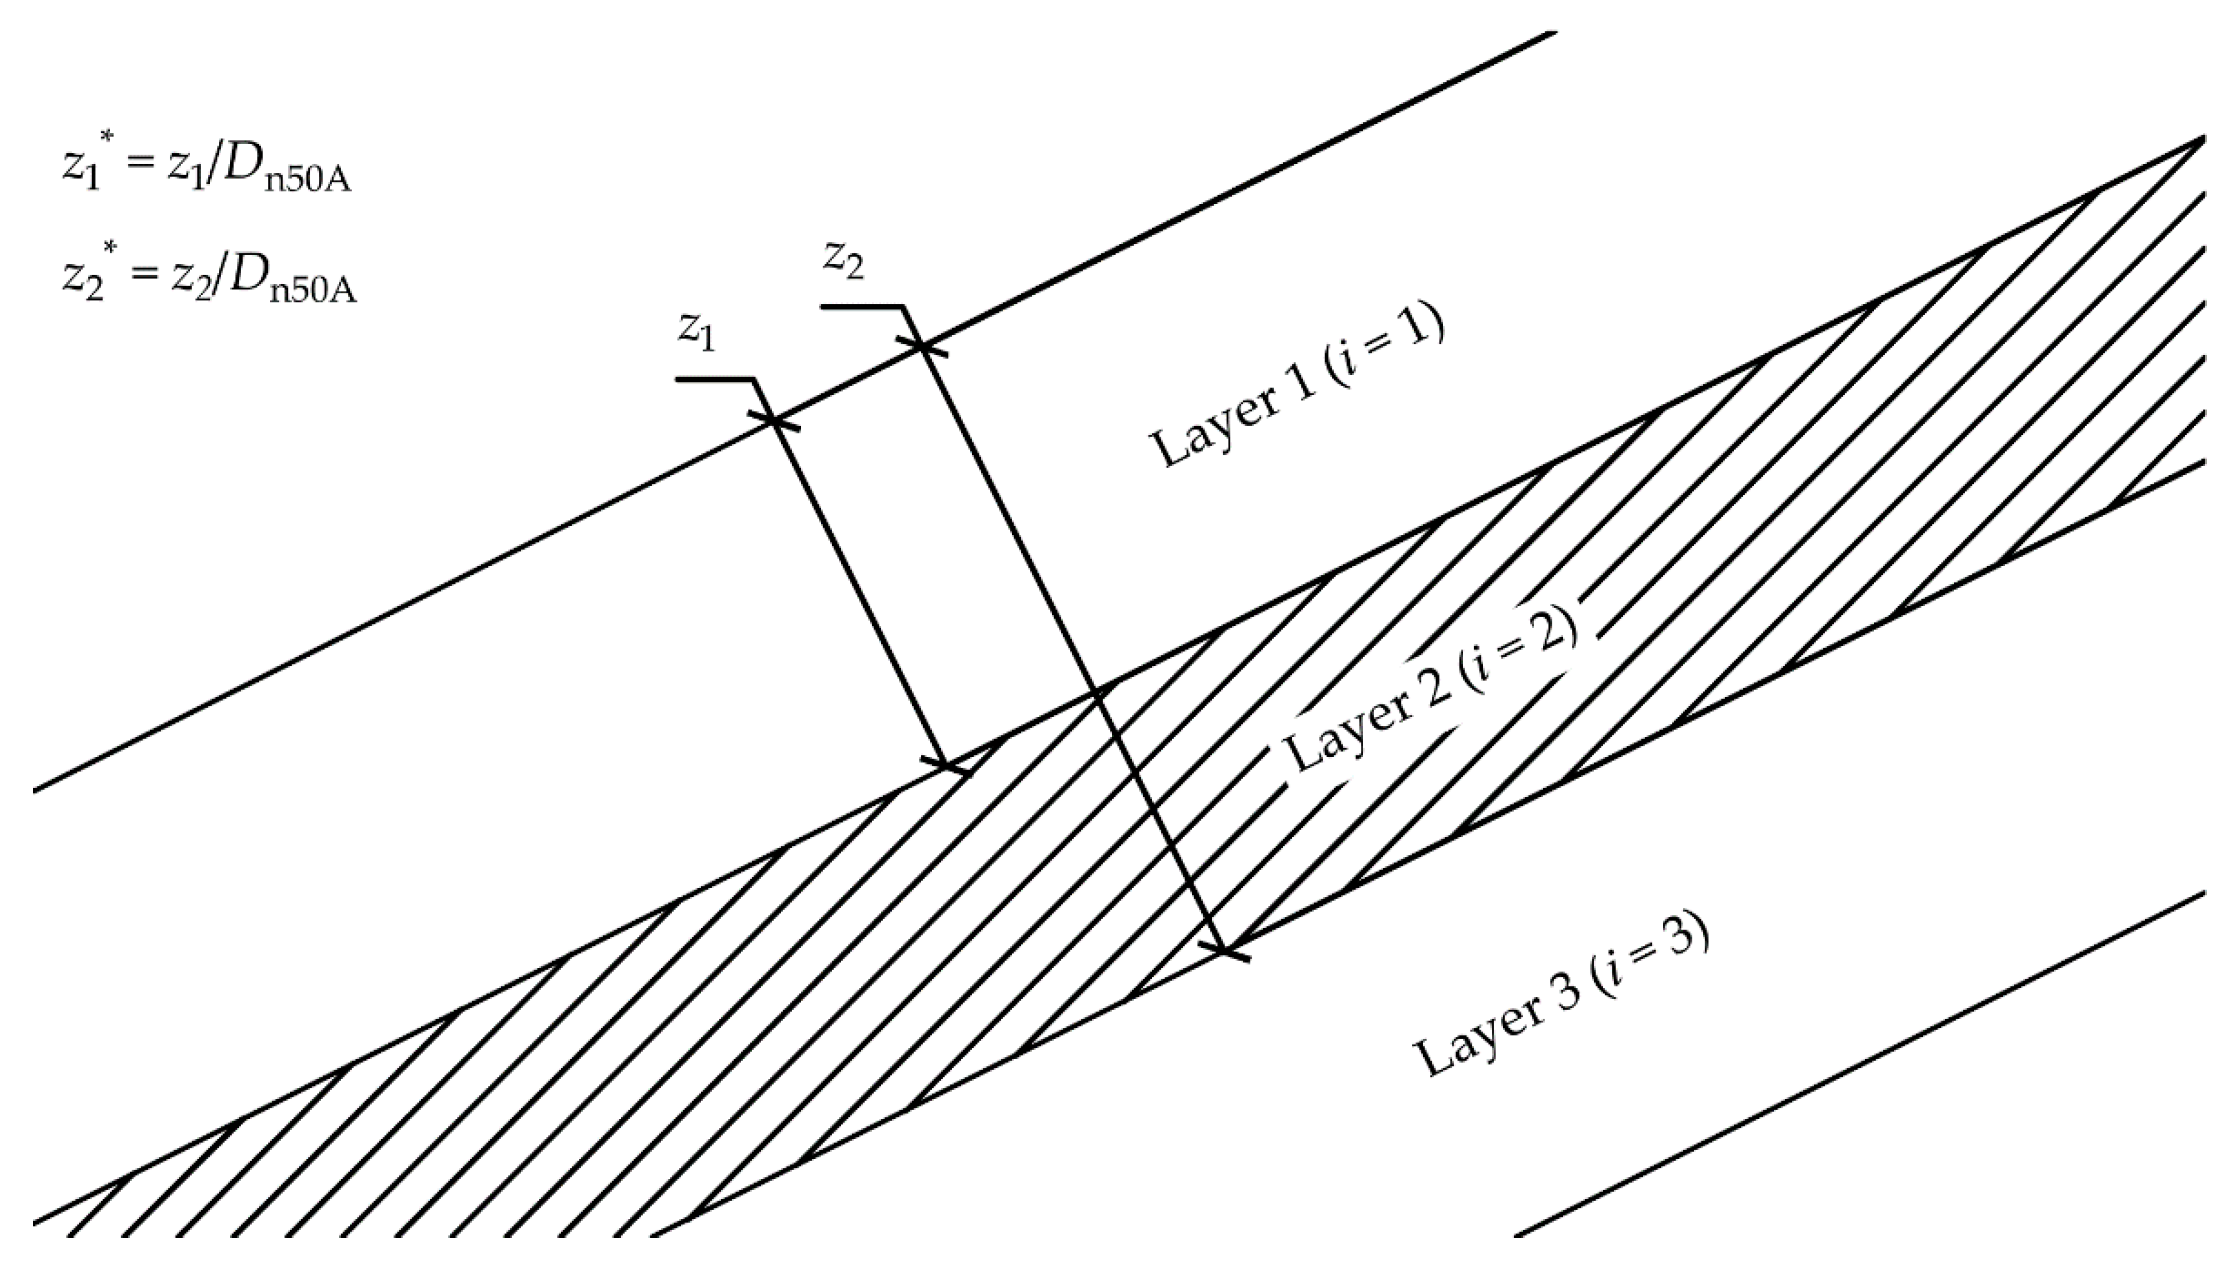
where Dn50,i is the nominal size of the units in the given layer. Figure 15 shows the definition of and for i = 2 in Equation (6). should stop at the impermeable layer or at a maximum value of 13.
Based on the integration function k the new empirical formula for estimating P can be given as
Equation (7) is limited to compositions in which the material size decreases from the armor layer to the core. For example, if a layer composition with an identical core and armor layer is used, but a thin and almost impermeable layer is separating these layers, the integration function k should stop at the impermeable layer, and the material size should never increase with z.
10. Conclusions
The present paper presents notional permeabilities for various rock armored layer compositions based on hydraulic model tests. The model test program included two layer compositions similar to those previously tested by Van der Meer [1].
Notional permeability factors were determined for two new layer compositions, one with an impermeable core and one with a permeable core. Furthermore, three additional compositions similar to previously tested compositions but having a 50% thicker armor layer were tested. In total seven layer compositions were added to the database with known notional permeability factors.
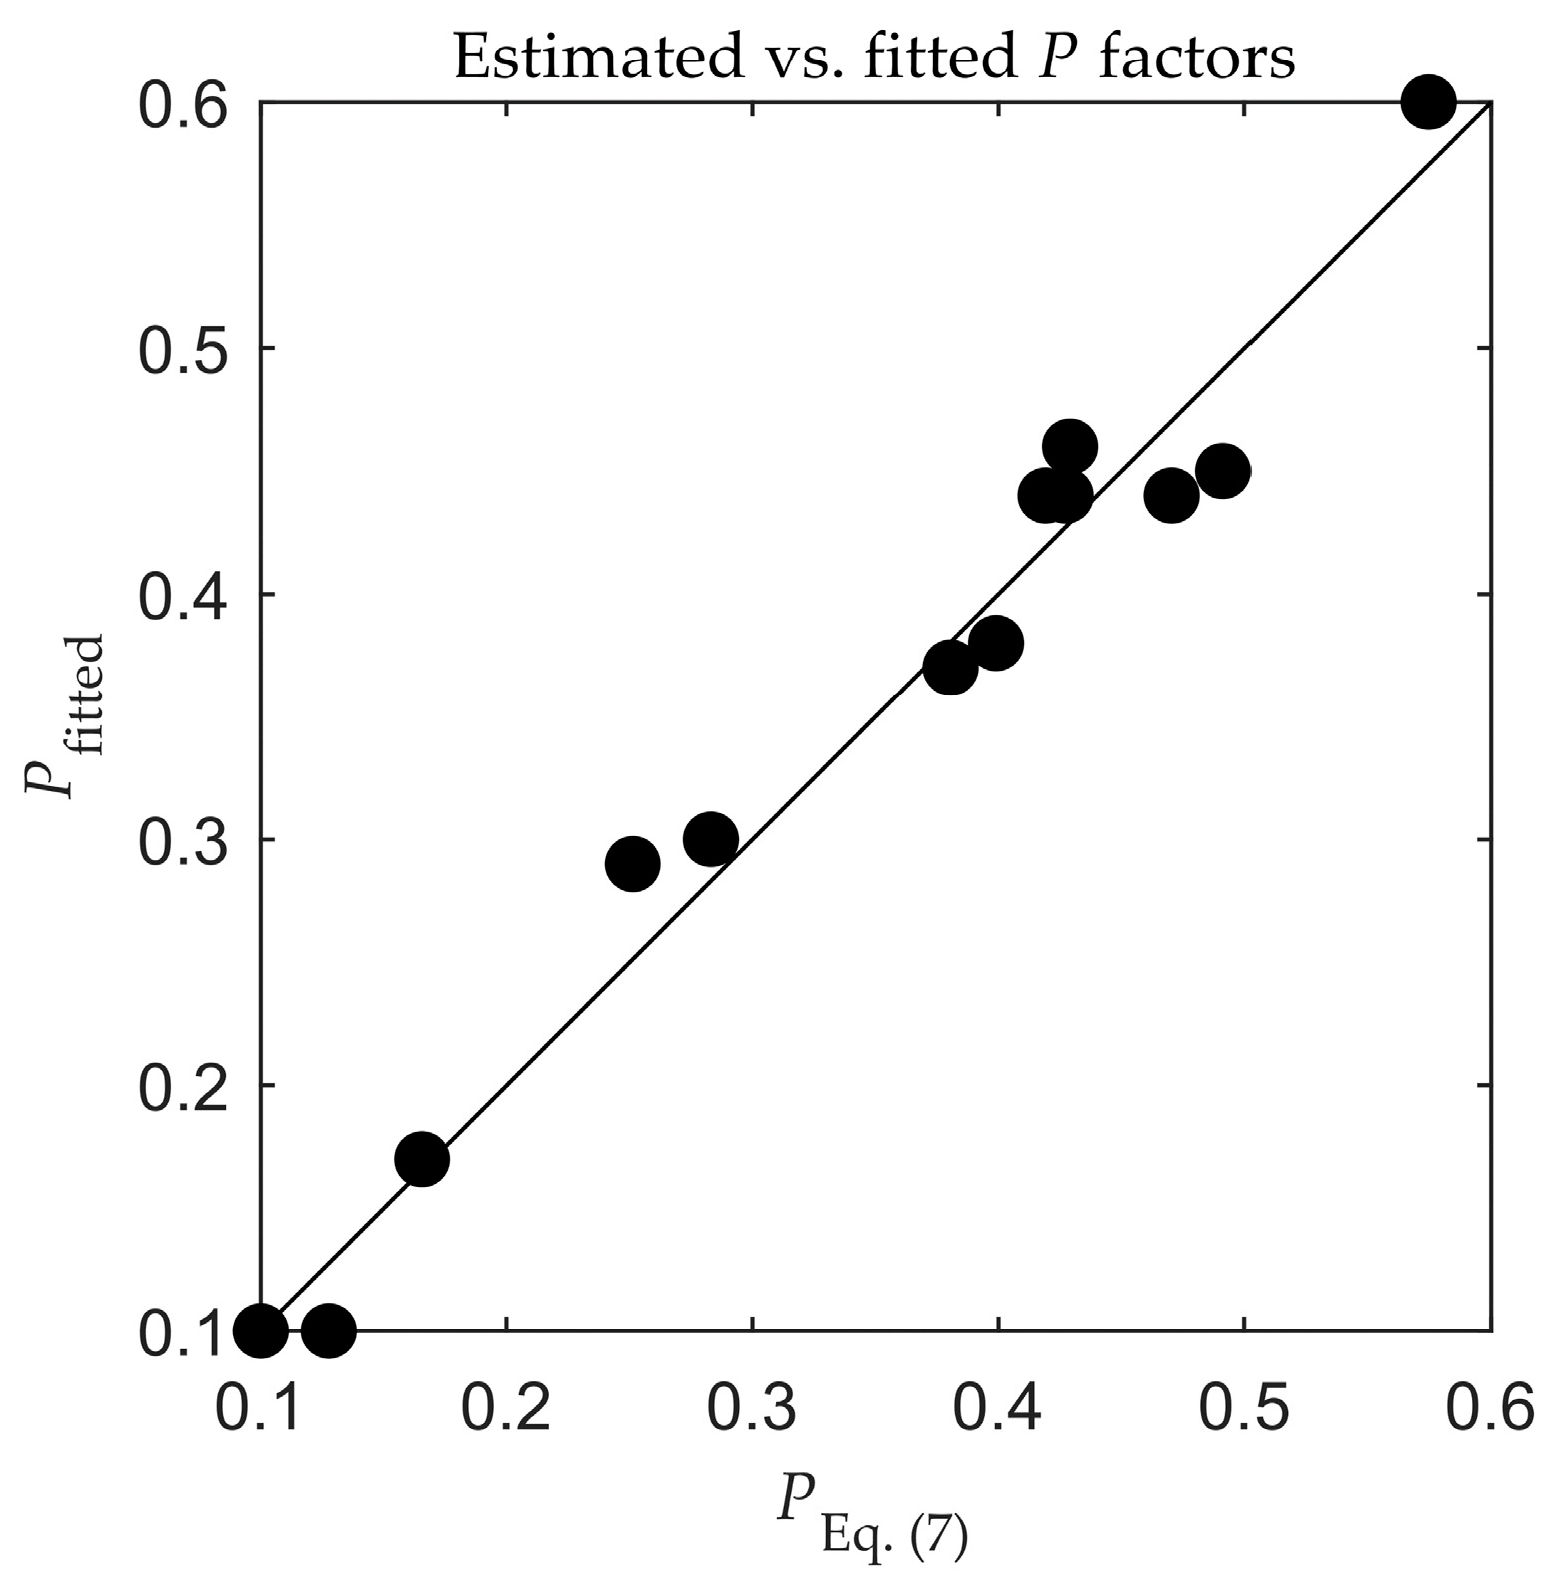
Based on notional permeability factors for all 13 layer compositions, an empirical formula for the estimation of the notional permeability was established. Given typical deviations of 0.03, the formula shows good agreement with the known P factors determined from model tests.
Increasing the armor layer thickness from two to three layers of rocks, the notional permeability factor and the related armor stability were increased. For compositions with impermeable core, the increase was significant. For conventional layer compositions with filter layer(s) and quarry rock core, the increase was moderate. For compositions with armor layer placed directly on a very permeable core, the increase was insignificant.
Author Contributions
M.R.E. and T.L.A. planned the test campaign for the paper in cooperation. The experimental tests and the analysis of the results were performed by the M.R.E. A common discussion on the outline of the analysis was done in a shared effort between the authors. The outline of the paper was written by M.R.E. T.L.A. and H.F.B. performed a detailed review on the draft paper and contributed with valuable suggestions.
Funding
This research received no external funding.
Conflicts of Interest
The authors declare no conflict of interest.
References
- Van der Meer, J.W. Rock Slopes and Gravel Beaches under Wave Attack. Ph.D. Thesis, Delft University of Technology, Delft, The Netherlands, 1988. [Google Scholar]
- Sarfaraz, M.; Pak, A. An integrated SPH-polyhedral DEM algorithm to investigate hydraulic stability of rock and concrete blocks: Application to cubic armours in breakwaters. Eng. Anal. Bound. Elem. 2017, 84, 1–18. [Google Scholar] [CrossRef]
- Thompson, D.M.; Shuttler, R.M. Riprap Design for Wind-Wave Attack, a Laboratory Study in Random Waves; HR Wallingford: Oxfordshire, UK, 1975. [Google Scholar]
- Hölscher, P.; Barends, F.B.J. Transport in Porous Media; Delft Geotechnics: Delft, The Netherlands, 1986. [Google Scholar]
- Kik, R. The Notional Permeability of Breakwaters: Experimental Research on the Permeability Factor P. Mater’s Thesis, Delft University of Technology, Delft, The Netherlands, 2011. [Google Scholar]
- Kluwen, J.G.M. Physical Model Tests of the Notional Permeability on Breakwaters. Mater’s Thesis, Delft University of Technology, Delft, The Netherlands, 2012. [Google Scholar]
- Van der Meer, J.W.; Van Gent, M.R.A.; Wolters, G.; Heineke, D. New Design Guidance for Underlayers and Filter Layers for Rock Armour under Wave Attack; ICE Publishing: London, UK, 2018. [Google Scholar]
- Jumelet, H.D. The Influence of Core Permeability on Armour Layer Stability. Mater’s Thesis, Delft University of Technology, Delft, The Netherlands, 2010. [Google Scholar]
- Van Broekhoven, P.J.M. The Influence of Armour Layer and Core Permeability on the Wave Run-Up. Mater’s Thesis, Delft University of Technology, Delft, The Netherlands, 2010. [Google Scholar]
- Van der Neut, E.M. Analysis of the Notional Permeability of Rubble Mound Breakwaters by Means of a VOF Model. Mater’s Thesis, Delft University of Technology, Delft, The Netherlands, 2015. [Google Scholar]
- CIRIA/CUR/CETMEF. The Rock Manual. The Use of Rock in Hydraulic Engineering. 2007. Available online: www.kennisbank-waterbouw.nl/DesignCodes/rockmanual/introduction.pdf (accessed on 2 May 2019).
- Aalborg University AwaSys—Software for Wave Laboratories. Available online: www.hydrosoft.civil.aau.dk/awasys (accessed on 2 May 2019).
- Eldrup, M.R.; Andersen, T.L. Applicability of Nonlinear Wavemaker Theory. J. Mar. Sci. Eng. 2019, 7, 14. [Google Scholar] [CrossRef]
- Zhang, H.; Schäffer, H.A.; Jakobsen, K.P. Deterministic combination of numerical and physical coastal wave models. Coast. Eng. 2007, 54, 171–186. [Google Scholar] [CrossRef]
- Lykke Andersen, T.; Clavero, M.; Frigaard, P.; Losada, M.; Puyol, J.I. A new active absorption system and its performance to linear and non-linear waves. Coast. Eng. 2016, 114, 47–60. [Google Scholar] [CrossRef]
- Lykke Andersen, T.; Clavero, M.; Eldrup, M.R.; Frigaard, P.; Losada, M. Active Absorption of Nonlinear Irregular Waves. In Proceedings of the Coastal Engineering Conference, Baltimore, MD, USA, 30 July–3 August 2018. [Google Scholar]
- Klopman, G.; van der Meer, J.W. Random Wave Measurements in Front of Reflective Structures. J. Waterw. Port Coast. Ocean Eng. 1999, 125, 39–45. [Google Scholar] [CrossRef]
- Battjes, J.A.; Groenendijk, H.W. Wave height distributions on shallow foreshores. Coast. Eng. 2000, 40, 161–182. [Google Scholar] [CrossRef]
- Eldrup, M.R.; Lykke Andersen, T. Estimation of Incident and Reflected Wave Trains in Highly Nonlinear Two-Dimensional Irregular Waves. J. Waterw. Port Coast. Ocean Eng. 2019, 145, 04018038. [Google Scholar] [CrossRef]
- Goda, Y.; Suzuki, T. Estimation of Incident and Reflected Waves in Random Wave Experiment. In Proceedings of the 15th Coastal Engineering Conference, 1–17 July 1976; ASCE: Reston, VA, USA, 1976; pp. 828–845. [Google Scholar]
- Mansard, E.P.D.; Funke, E.R. The Measurement of Incident and Reflected Spectra Using a Least Squares Method. In Proceedings of the 17th Conference on Coastal Engineering, 23–28 March 1980; Sydney, Australia; ASCE: Reston, VA, USA, 1980; pp. 154–172. [Google Scholar]
- Aalborg University WaveLab—Software for Wave Laboratories. Available online: www.hydrosoft.civil.aau.dk/wavelab (accessed on 27 April 2019).
- Aalborg University EPro—Software for Wave Laboratories. Available online: www.hydrosoft.civil.aau.dk/epro/ (accessed on 27 April 2019).
- Dai, Y.B.; Kamel, A.M. Scale Effect Tests for Rubble-Mound Breakwaters: Hydraulic Model Investigation; U. S. Army Engineer Waterways Experiment Station: Vicksburg, MS, USA, 1969.
Figure 1.
Fitted notional permeability factor of different layer compositions, for which A, H and M are given by Van der Meer [1], F is given by Kik [5] and Kluwen [6], L is given by Kluwen [6], C is given by Van der Meer et al. [7] and B, D, E, G, I, J and K are tested in the present study. Dn50A is the nominal stone size of the armor, Dn50F is the nominal stone size of the filter/underlayer material, and Dn50C is the nominal stone size of the core material.

Figure 2.
Experimental setup of the flume. Measurements are in meters.

Figure 3.
Class I rocks used in the armor layer for the present tests.

Figure 4.
Grain curves of the rock material used in the present tests.

Figure 5.
Plywood plate with glued Class V rocks. Used to increase the roughness of the impermeable interface.
Figure 5.
Plywood plate with glued Class V rocks. Used to increase the roughness of the impermeable interface.

Figure 6.
One of the layer compositions with the impermeable core. The figure shows the plywood plate placed on the Class V rocks.
Figure 6.
One of the layer compositions with the impermeable core. The figure shows the plywood plate placed on the Class V rocks.

Figure 7.
Profiler used to measure the eroded area.

Figure 8.
Example of averaged measured profiles showing the damage development in two consecutive tests.
Figure 8.
Example of averaged measured profiles showing the damage development in two consecutive tests.

Figure 9.
Damage curve for accumulated tests. The tests are shown with markers and the test number in the wave series is given by i. A and Ntotal,i are found by iterating Equation (3) until convergence of A is obtained.
Figure 9.
Damage curve for accumulated tests. The tests are shown with markers and the test number in the wave series is given by i. A and Ntotal,i are found by iterating Equation (3) until convergence of A is obtained.

Figure 10.
Tests with layer compositions A, B, H and I and front slopes cot(α) = 1.5, 2 and 3. Continuous lines indicate the given permeability (P) by Van der Meer [1]. Dashed lines indicate fitted values of P derived from the Van der Meer formulae. Markers indicate the results.
Figure 10.
Tests with layer compositions A, B, H and I and front slopes cot(α) = 1.5, 2 and 3. Continuous lines indicate the given permeability (P) by Van der Meer [1]. Dashed lines indicate fitted values of P derived from the Van der Meer formulae. Markers indicate the results.

Figure 11.
Tests with layer compositions G and D and front slope of cot(α) = 2 and 3. Dashed lines indicate fitted values of P derived from the Van der Meer [1] formulae. Markers indicate the results.
Figure 11.
Tests with layer compositions G and D and front slope of cot(α) = 2 and 3. Dashed lines indicate fitted values of P derived from the Van der Meer [1] formulae. Markers indicate the results.

Figure 12.
Tests with layer compositions J, K and E and front slope of cot(α) = 1.5 and 2. Dashed lines indicate fitted values of P derived from the Van der Meer [1] formulae. Markers indicate the results.
Figure 12.
Tests with layer compositions J, K and E and front slope of cot(α) = 1.5 and 2. Dashed lines indicate fitted values of P derived from the Van der Meer [1] formulae. Markers indicate the results.

Figure 13.
Definition of the relative depth as a function of z and the nominal size of the armor stones Dn50A.
Figure 13.
Definition of the relative depth as a function of z and the nominal size of the armor stones Dn50A.

Figure 14.
Influence of the relative rock size on (f) and influence of relative layer depth on (g). The subplots are plotted with the use of Equation (4).
Figure 14.
Influence of the relative rock size on (f) and influence of relative layer depth on (g). The subplots are plotted with the use of Equation (4).

Figure 15.
Example of the definition of the relative depth and for i = 2 in Equation (6) with Dn50A as the nominal size of the armor stones.
Figure 15.
Example of the definition of the relative depth and for i = 2 in Equation (6) with Dn50A as the nominal size of the armor stones.

Figure 16.
Comparison between the fitted P factors shown in Figure 1 and the estimated P factors calculated by Equation (7).
Figure 16.
Comparison between the fitted P factors shown in Figure 1 and the estimated P factors calculated by Equation (7).


Table 1.
Estimated rock armor weight in tonnes with the use of the Van der Meer [1] formulae.
Table 1.
Estimated rock armor weight in tonnes with the use of the Van der Meer [1] formulae.
| P | s0m (-) | Tm (s) | ξ0m (-) | s0m (-) | Tm (s) | ξ0m (-) | s0m (-) | Tm (s) | ξ0m (-) |
|---|---|---|---|---|---|---|---|---|---|
| 0.05 | 7.2 | 2.2 | 0.02 | 11.3 | 3.5 | 0.01 | 16.0 | 5.0 | |
| 0.10 | 10.9 | 21.6 | 19.8 | ||||||
| 0.17 | 8.1 | 16.2 | 17.4 | ||||||
| 0.38 | 5.3 | 10.5 | 8.6 | ||||||
| 0.46 | 4.8 | 9.5 | 6.3 | ||||||
| 0.50 | 4.6 | 9.0 | 5.4 | ||||||
Table 2.
Test materials used for all layer compositions.
| Rock Class | Median Weight W50 (g) | Mass Density ρ (kg/m3) | Nominal Diameter Dn50 (m) | Grading Ratio fg = Dn85/Dn15 |
|---|---|---|---|---|
| I | 221.0 | 2620 | 0.044 | 1.30 |
| II | 32.2 | 2618 | 0.023 | 1.40 |
| III | 9.0 | 2768 | 0.015 | 1.36 |
| IV | 4.0 | 2485 | 0.012 | 1.33 |
| V | 0.7 | 2936 | 0.006 | 1.36 |
Table 3.
Main characteristics of tests.
| Layer Compositions (Figure 7) | B | E | I | J | G | K | D |
|---|---|---|---|---|---|---|---|
| Number of tests | 28 | 14 | 20 | 17 | 34 | 23 | 13 |
| Breaker parameter, ζ0m | 1.57–6.86 | 2.29–6.90 | 2.82–9.34 | 3.50–6.91 | 1.56–7.04 | 2.26–5.27 | 2.29–6.91 |
| Wave steepness, s0m | 0.005–0.048 | 0.005–0.048 | 0.005–0.056 | 0.009–0.036 | 0.005–0.049 | 0.009–0.049 | 0.005–0.048 |
| Relative wave height, H1/3/h | 0.20–0.34 | 0.21–0.33 | 0.23–0.40 | 0.23–0.40 | 0.24–0.51 | 0.23–0.41 | 0.22–0.34 |
| Relative wave breaking, H2%/H1/3 | 1.30–1.46 | 1.32–1.44 | 1.29–1.44 | 1.29–1.43 | 1.19–1.44 | 1.29–1.47 | 1.30–1.41 |
| Relative wave length, L0m/h | 6.00–59.26 | 6.11–59.15 | 5.05–59.47 | 7.35–38.03 | 6.46–56.38 | 6.42–37.20 | 6.40–59.50 |
| Relative freeboard, Ac/H1/3 | 1.57–2.66 | 1.65–2.59 | 1.37–2.33 | 1.57–2.66 | 1.07–2.30 | 1.33–2.36 | 1.60–2.49 |
| Stability number, H0 = H1/3/ΔDn50 | 1.43–2.42 | 1.47–2.30 | 1.63–2.78 | 1.65–2.80 | 1.65–3.56 | 1.61–2.85 | 1.52–2.38 |
| Reynolds number for armor layer stones, Re × 104 | 3.4–4.4 | 3.4–4.3 | 3.6–4.7 | 3.6–4.7 | 3.6–5.3 | 3.6–4.7 | 3.5–4.3 |
Table 4.
Influence of armor layer thickness.
| Rock Class | Layer Composition | Notional Permeability Factor | Influence | |
|---|---|---|---|---|
| Two Layers | Three Layers | |||
| Impermeable core | B and E for cot(α) = 2 | 0.10 | 0.30 | Significant |
| Permeable core no filter | I and J for cot(α) = 1.5 | 0.44 | 0.45 | Insignificant |
| Conventional layer composition | G and K for cot(α) = 2 | 0.37 | 0.45 | Moderate |
© 2019 by the authors. Licensee MDPI, Basel, Switzerland. This article is an open access article distributed under the terms and conditions of the Creative Commons Attribution (CC BY) license (http://creativecommons.org/licenses/by/4.0/).
Share and Cite
MDPI and ACS Style
Eldrup, M.R.; Lykke Andersen, T.; Burcharth, H.F. Stability of Rubble Mound Breakwaters—A Study of the Notional Permeability Factor, Based on Physical Model Tests. Water 2019, 11, 934. https://doi.org/10.3390/w11050934
AMA Style
Eldrup MR, Lykke Andersen T, Burcharth HF. Stability of Rubble Mound Breakwaters—A Study of the Notional Permeability Factor, Based on Physical Model Tests. Water. 2019; 11(5):934. https://doi.org/10.3390/w11050934
Chicago/Turabian StyleEldrup, Mads Røge, Thomas Lykke Andersen, and Hans Falk Burcharth. 2019. "Stability of Rubble Mound Breakwaters—A Study of the Notional Permeability Factor, Based on Physical Model Tests" Water 11, no. 5: 934. https://doi.org/10.3390/w11050934
Note that from the first issue of 2016, this journal uses article numbers instead of page numbers. See further details here.