1. Introduction
Precipitation is a key component in hydrologic cycle. Rain gauge is a traditional instrument for direct measurement of precipitation and thus the gauged value is deemed as the accurate precipitation. However, the rain gauge suffers from inadequate presentation of the spatial distribution of precipitation since it is distributed unevenly and sparsely especially in the remote region. The core satellite of Global Precipitation Measurement (GPM) mission was launched on 27 February 2014 with two core sensors, i.e., the dual-frequency precipitation radar (DPR) and microwave imager (GMI). Integrated Multi-satellite Retrievals for the GPM (IMERG) is the state-of-art precipitation algorithm with a high spatio-temporal resolution of 0.1°/30 min. The IMERG algorithm blends the advantages of the currently most popular satellite-based quantitative precipitation estimates (QPE) algorithms, i.e., Tropical Rainfall Measuring Mission Multi-satellite Precipitation Analysis (TMPA) [
1], Climate Prediction Center morphing technique (CMORPH) [
2], Precipitation Estimation from Remotely Sensed Information using Artificial Neural Networks-Cloud Classification System (PERSIANN-CCS) [
3]. The real-time and post real-time IMERG products are now available online at
https://pmm.nasa.gov/data-access/downloads/gpm. Early studies on the assessment of IMERG with gauge observations or analysis products show that the GPM Day-1 IMERG products have promising performances over China [
4], Europe [
5], and Canada [
6]. However, it is found that satellite-based QPE products still have many uncertainties in quantitatively estimating precipitation [
7]. Previous research by Sheng Chen et al. [
7] indicates that version 7 (V7) TMPA products perform well when compared with gauge observations and have good capability of hydrologic simulation over Ganjiang basin. In addition, IMERG shows a compatible performance in this region with high correlation coefficients (CC) when directly compared with gauge observations [
8]. The early assessment of GPM Day-1 IMERG over China by Guo et al. shows that the final run calibrated IMERG product (IMERGFRCal) has better performance than the V7 TMPA research product (i.e., 3B42V7) over China [
4]. Additionally, it is found that version 4 IMERG products have moderate correlation coefficients (CCs) with gauge observations at a daily scale over some regions in Asia [
9]. Compared to the gauge and ground weather radar observations, the satellite-based QPE products can serve as an alternative product over large regions, especially the remote areas where there are few gauge and radar observations.
Up to date, IMERG algorithm has experienced three versions, i.e., version 3 (Day-1), version 4, and version 5 (V5). Version 5B (V5B) is a sub-version of V5 and was released on 10 November 2017. The V5B IMERG products are publicly available. Lots of studies have been reported to assess the performances of different versions of the IMERG product over China, United States and other regions over the world through direct comparisons against gauge or radar observations [
4,
5,
6,
10,
11,
12,
13,
14,
15,
16,
17,
18,
19]. To the best of our knowledge, there is no similar study on the hydrological evaluation of IMERG products in the coastal watershed over southern China.
The Nanliu River is the longest river (~287 km) in Guangxi province in southern China with all tributaries limited in the boundary of the province. The whole basin is located south of the Tropic of Cancer in the southeastern Guangxi province in southern China. The basin is the most prosperous region in Guangxi with a long history of more than two thousand years. In recent decades, brisk economic activities caused a drastic change of land cover and land use such as the replacement of pine trees with eucalyptus trees and urban expansion. Flooding is the primary threat to this basin. Therefore, this study aims to assess the hydrologic utility of the latest V5B IMERG products in stream flow simulations and monitoring in Nanliu River basin from March 2014 to December 2016. Firstly, the IMERG products ware directly compared with gauge observations. Secondly, the IMERG products were used as forcing data to drive the hydrologic model Xinanjiang to simulate stream flows for comparison with observed stream flows. The objective of this study has twofold: (1) reveal how well the IMERG products capture the spatial characteristics of precipitation in Nanliu River basin; (2) investigate the potential hydrological utility of IMERG products in Nanliu River basin with implications for the hydrologic application in the tropical region and beyond.
The rest of this paper is organized as follows.
Section 2 introduces the Nanliu River basin and data used as well as the methodology. Results and analysis are provided in
Section 3 Summaries and conclusions are given in
Section 4.
2. Study Region, Data and Methods
2.1. Study Region
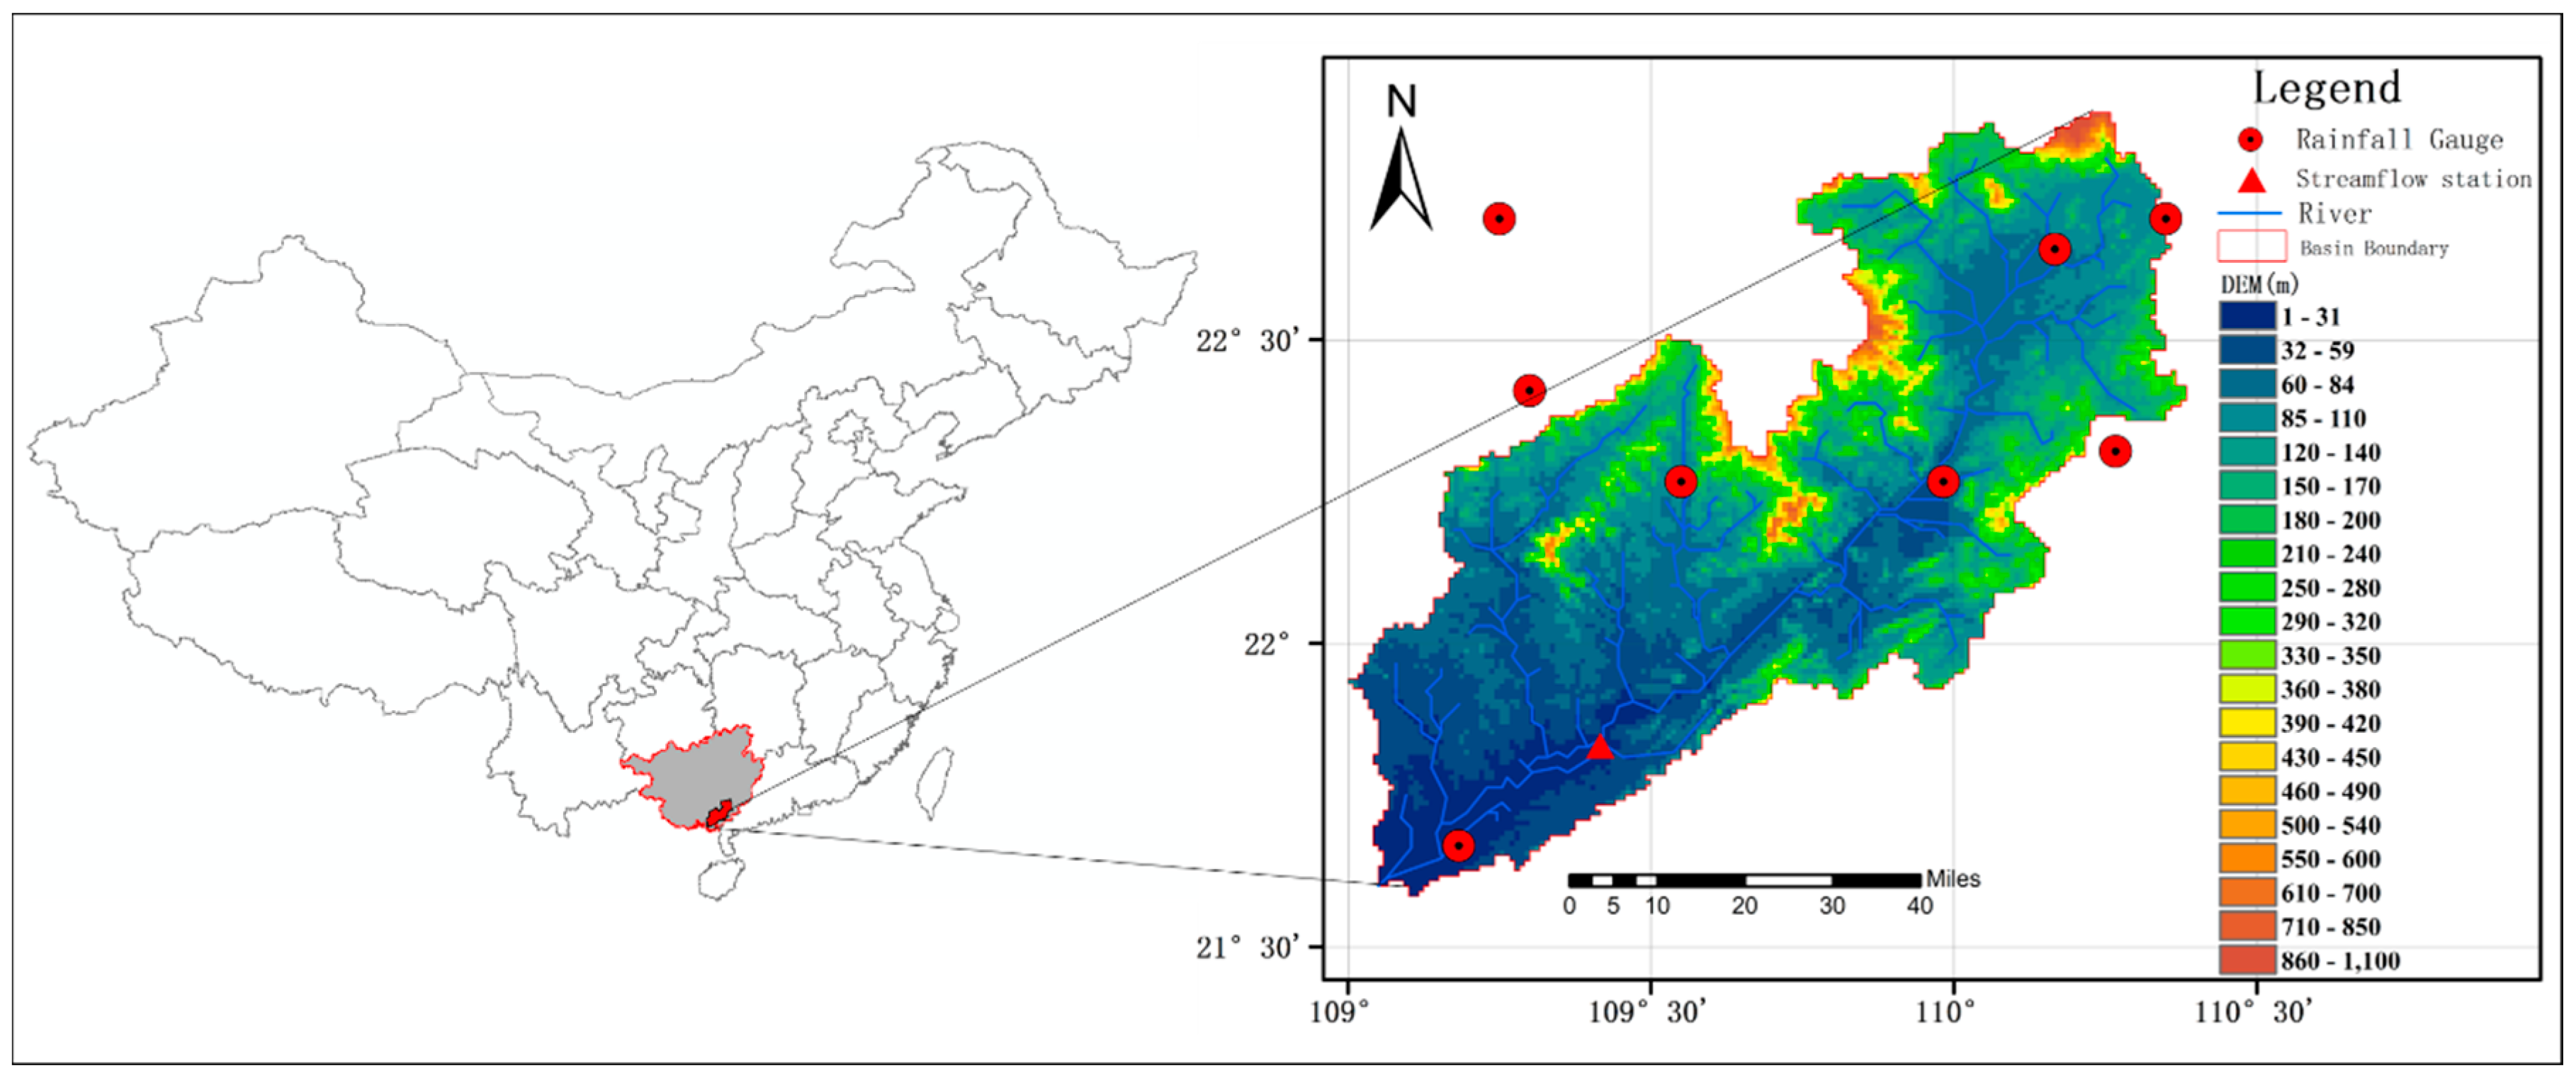
The Nanliu River basin is located in the south of the Tropic of Cancer in southern China with a longitude ranging from 109°30′ E to 110°53′ E and latitude varying from 20°38′ N to 23°07′ N (
Figure 1). The whole basin’s drainage area is ~8600 km
2. The Changle hydrologic station is located in the southwest with the drainage area about 6592 km
2, accounting for 72.5% of the total basin area. Topographically, the basin is complicated with mountains and hills distributed in most parts of the basin except for small flat areas along the Nanliu River and its tributaries. Climatically, the basin is humid and wet with an annual precipitation up to 1760 mm and average annual temperature ranging from 21.5 °C to 22.4 °C. The precipitation is not evenly distributed with most of the rainfall during rainy season from April to September. Economically, the basin is the most prosperous region in Guangxi province with a long history of more than two thousand years.
2.2. Data
The data used in this study include the daily gauge observations from eight national standard rain gauges, stream flow observations at the Changle station from 2014 to 2016, and the early run and final run IMERG product in the corresponding period. The rain gauges are collected and maintained by the China Meteorological administration (CMA) and were not transmitted on the international circuit of the Global Telecommunication System (GTS) [
20]. Thus, the rain gauge observations are independent from the final run gauge-corrected IMERG product. The stream flow gauge and evaporation at the Changle station from 2014 to 2016 were collected from China hydrological yearbook in which all the stream flow and evaporation data have undergone strict quantity control and have been used in previous studies [
21].
2.3. Methods
2.3.1. Hydrological Model
The hydrologic simulation is conducted through the well-known hydrologic model Xinanjiang that was developed in the 1970s to simulate the runoff generation [
7]. The Xinanjiang model is a conceptual lump model that has been widely used over China and other areas throughout the world for hydrological simulation and prediction. The unique feature of this model is the concept of runoff generation on repletion of storage with three runoff components, i.e., surface runoff, interflow and ground flow. A unit hydrograph or route technique is used to compute the runoff concentration to the outlet of the basin [
22]. This model has 15 parameters needed to be calibrated before using the model for flow simulation and forecast. In this study, the Shuffled Complex Evolution-University of Arizona (SCE-UA, [
23]) algorithm was used to calibrate the Xinanjiang model for this basin.
Table 1 lists the 15 calibrated parameters. It should be kept in mind that some small dams scatter in the basin and would have an impact on the stream flow and add uncertainties to the simulation. Since dam and human regulations are not addressed in the Xinanjing model, their impacts were not taken into account during calibration and simulation in this study.
2.3.2. Statistics Metrics
The accuracy of the satellite QPE product has great impact on the reliability of stream flow simulation via the hydrologic model. Direct comparison between IMERG QPE products and rain gauge observations will give insight to the error characteristics of QPE products, which will help to interpret the hydrologic performance of QPE products. To facilitate the quantitative comparison, the relative bias (RB), root mean square error (RMSE), and correlation coefficient (CC) are used to quantify error characteristics of these QPE products. These statistics metrics are defined as follows:
RB and CC are in the non-dimension and RMSE uses mm/day for measurement. In Equation (3), “Cov ()” means the covariance and σ denotes the standard deviation. The RB presents the degree to which the satellite QPE product deviates from the observations in percentage after multiplying by 100. In addition, the probability of detection (POD), critical success index (CSI), and false alarm ratio (FAR) are applied to analyze the ability of IMERG products in detecting different precipitation intensities. These indices are calculated based on hits (H), false alarm (F), and misses (M) where H, F, M are defined in
Table 2. The best values of POD, CSI and FAR are 1, 1, and 0, respectively, meaning that satellite QPE products are completely the same as observations. These contingency metrics are defined as follows:
3. Results and Analysis
This section focuses on evaluating the accuracy of the IMERG product in spatial and temporal scales and the performance in hydrological simulation. Firstly, this study accesses the accuracy of IMERG products using as forcing input of the Xinanjiang model. The spatial and temporal analyses are used to reveal how much of the IMERG products the spatial and temporal characteristics of precipitation capture in the basin. Secondly, the potential hydrologic utilities of IMERG products will be discussed through simulating stream flows with IMERG products as forcing data and then comparing the simulated stream flow with observations.
3.1. Assessment of IMERG Products
To facilitate the spatial comparison between IMERG products and gauge observations, the gauge observations were interpolated by the inverse distance weighting to yield the gridded gauge product (GGIDW, hereafter).
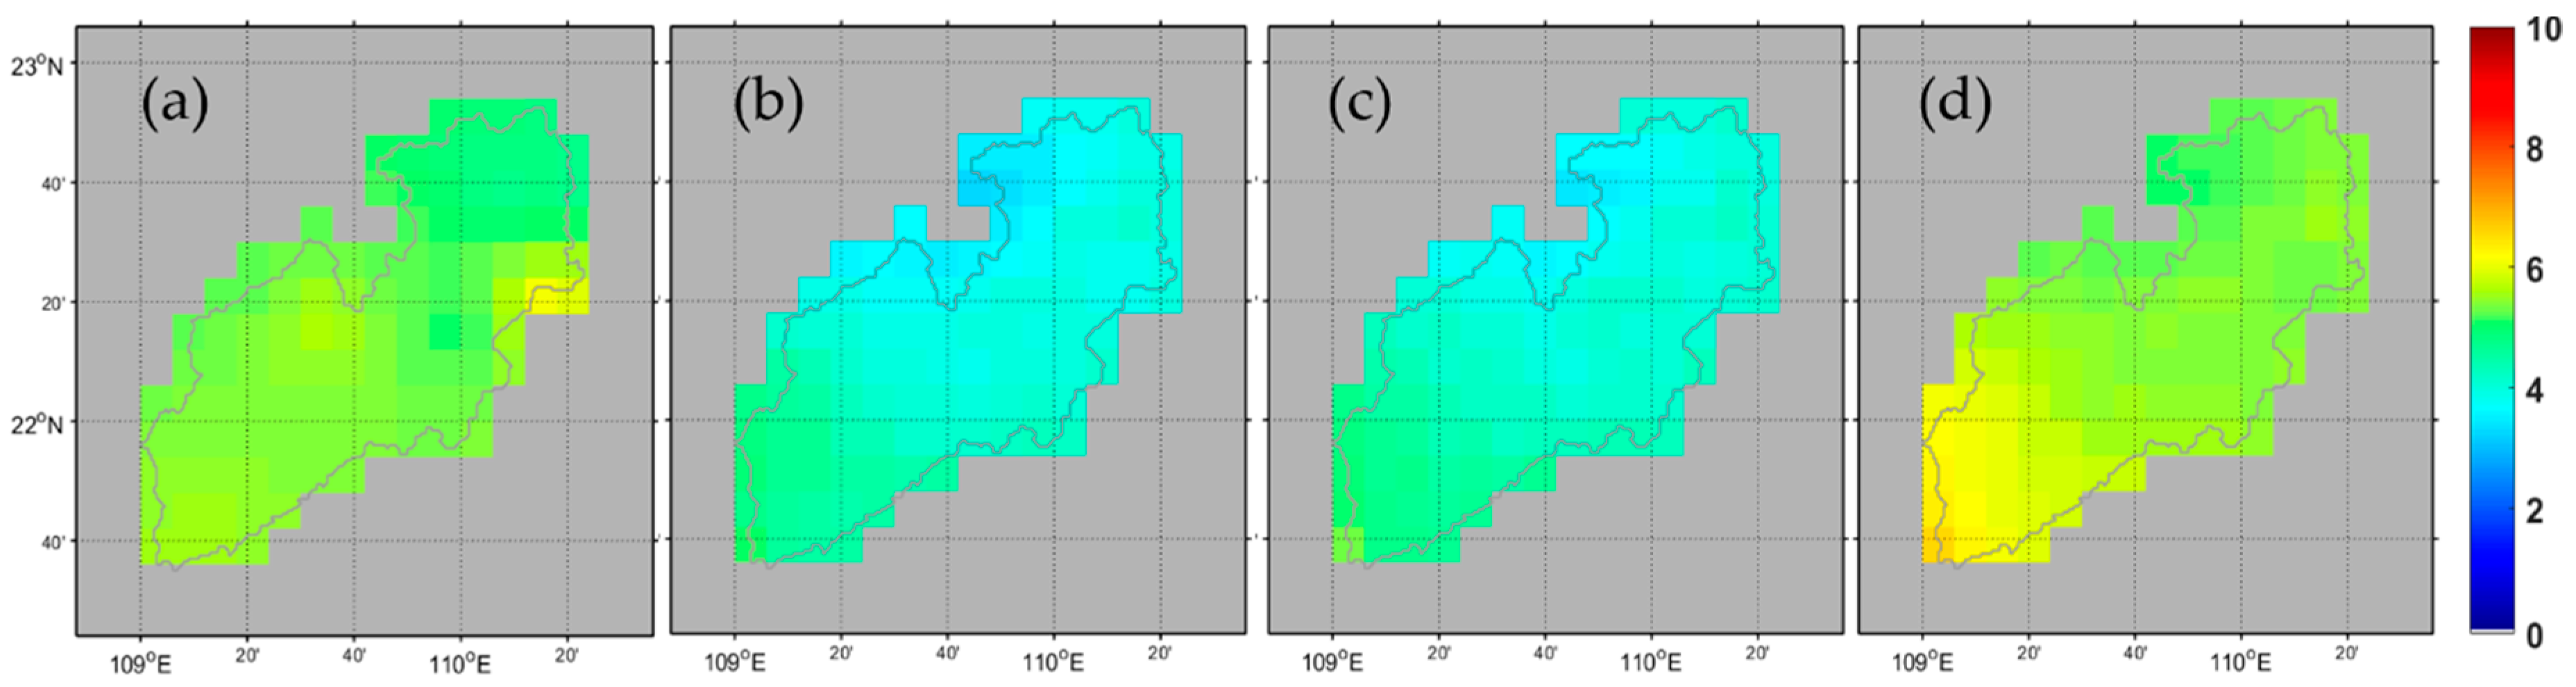
Figure 2 exhibits the spatial distribution of three-year daily mean precipitation over the Nanliu River for GGIDW and three IMERG satellite products. All these three IMERG products show a similar spatial distribution pattern in the whole basin. It can be seen in
Figure 2 that the rainfall intensity generally increases as the latitude and longitude decrease over the basin. It is noted that IMERG products show intensive precipitation in the southwest. IMERGFRCal demonstrates a distinct overestimation in the southwest, while the IMERGERUncal and IMERGFRUncal evidently underestimate precipitation almost in the whole basin. IMERGERUncal and IMERGFRUncal have a similar performance in total study region (
Figure 2c,d). It is noted that IMERGFRCal is more consistent with GGIDW in most of the area, with slight overestimation in the southwest region when compared to IMERGERUncal and IMERGFRUncal. It indicates that IMERGFRCal has gained pronounced improvement over IMERGFRUncal probably due to calibration with the gauge analysis provided by the Deutscher Wetterdienst (DWD) Global Precipitation Climatology Centre (GPCC) [
24]. However, such calibration algorithm still has limitations in capturing precipitation with serious overestimation in the southwest.
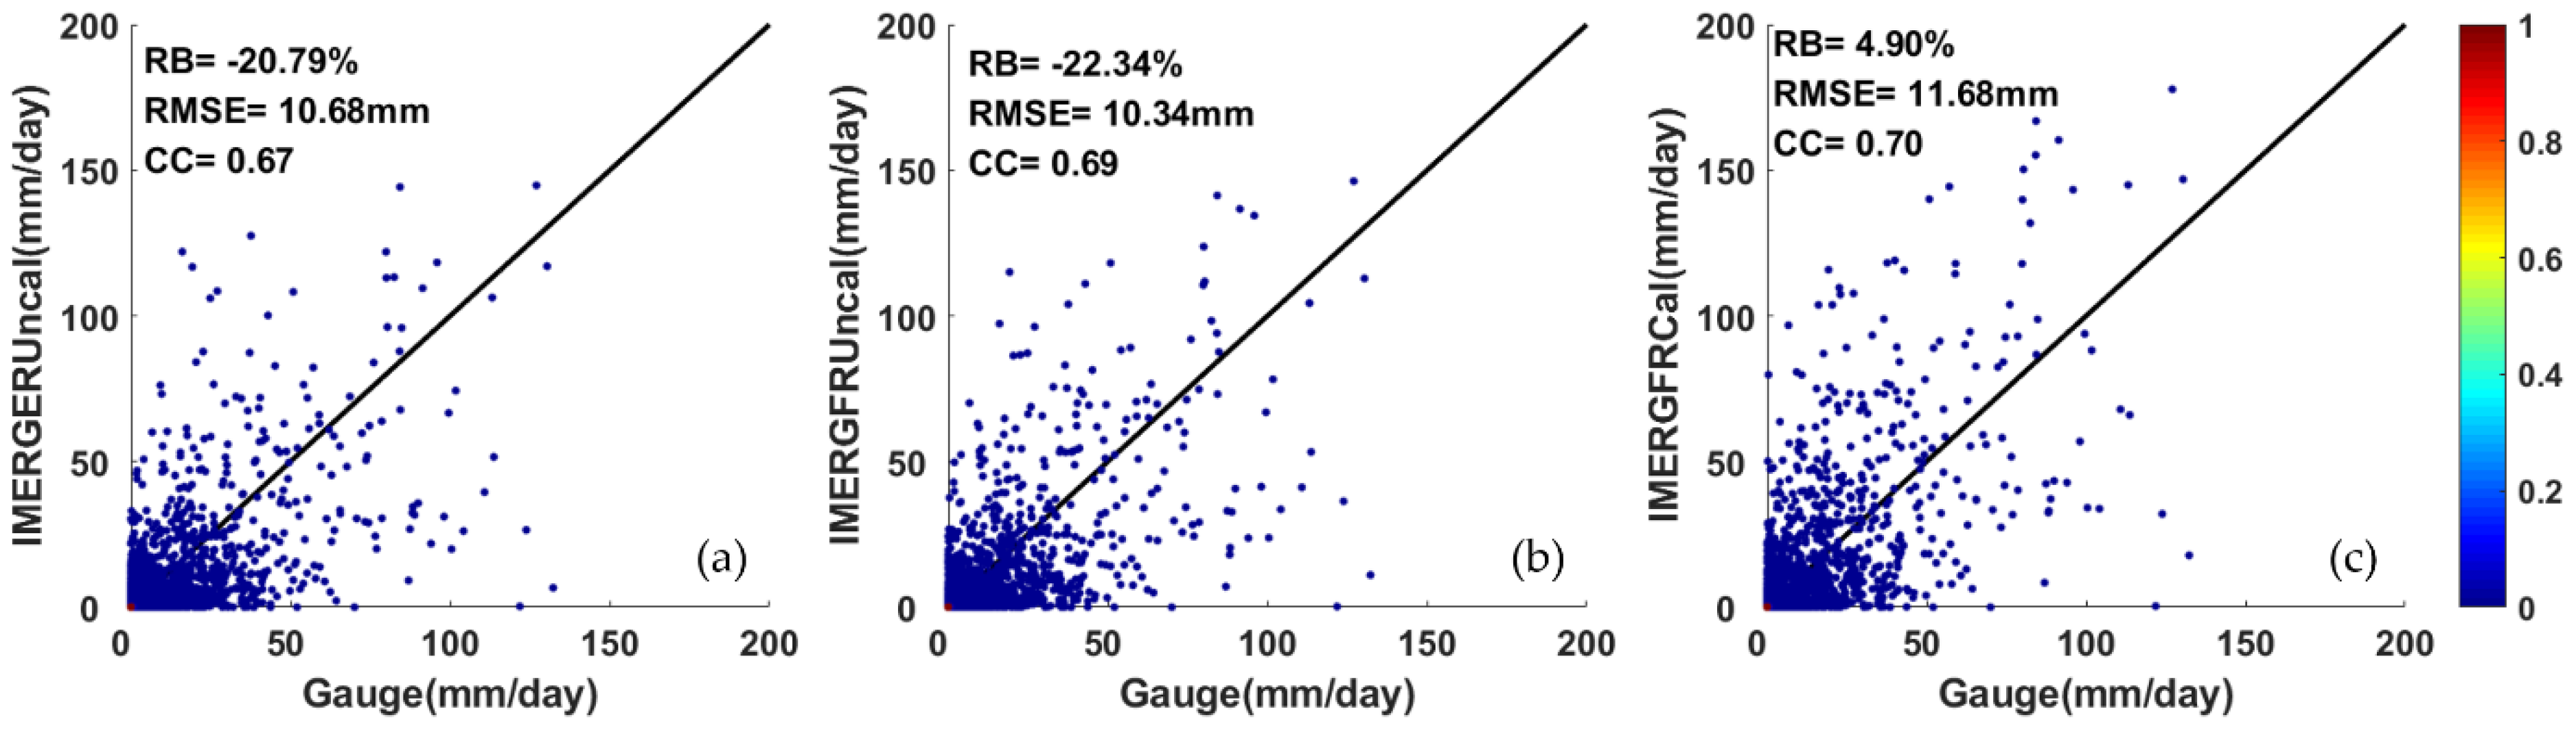
To get specific differences and error characteristics, only those grids that contain at least one rain gauge can be selected for statistical analysis.
Figure 3 and
Figure 4 show the daily and monthly scatter plots of IMERG products versus gauge observations, respectively. It is noted that IMERGFRCal, IMERGERUncal, and IMERGFRUncal have close CCs (0.70, 0.67, and 0.69, respectively), and RMSEs (11.92 mm, 10.68 mm and 10.68 mm, respectively). IMERGERUncal and IMERGFRUncal show similar performance in underestimating the precipitation at a daily scale with close RB (−20.79 versus −22.34%). In contrast, IMERGFRCal demonstrates the best capability to capture rainfall pattern with the highest CC (0.70) and slight overestimation of precipitation with the lowest RB (4.90%). This result is consistent with the daily mean rainfall spatially distribution shown in
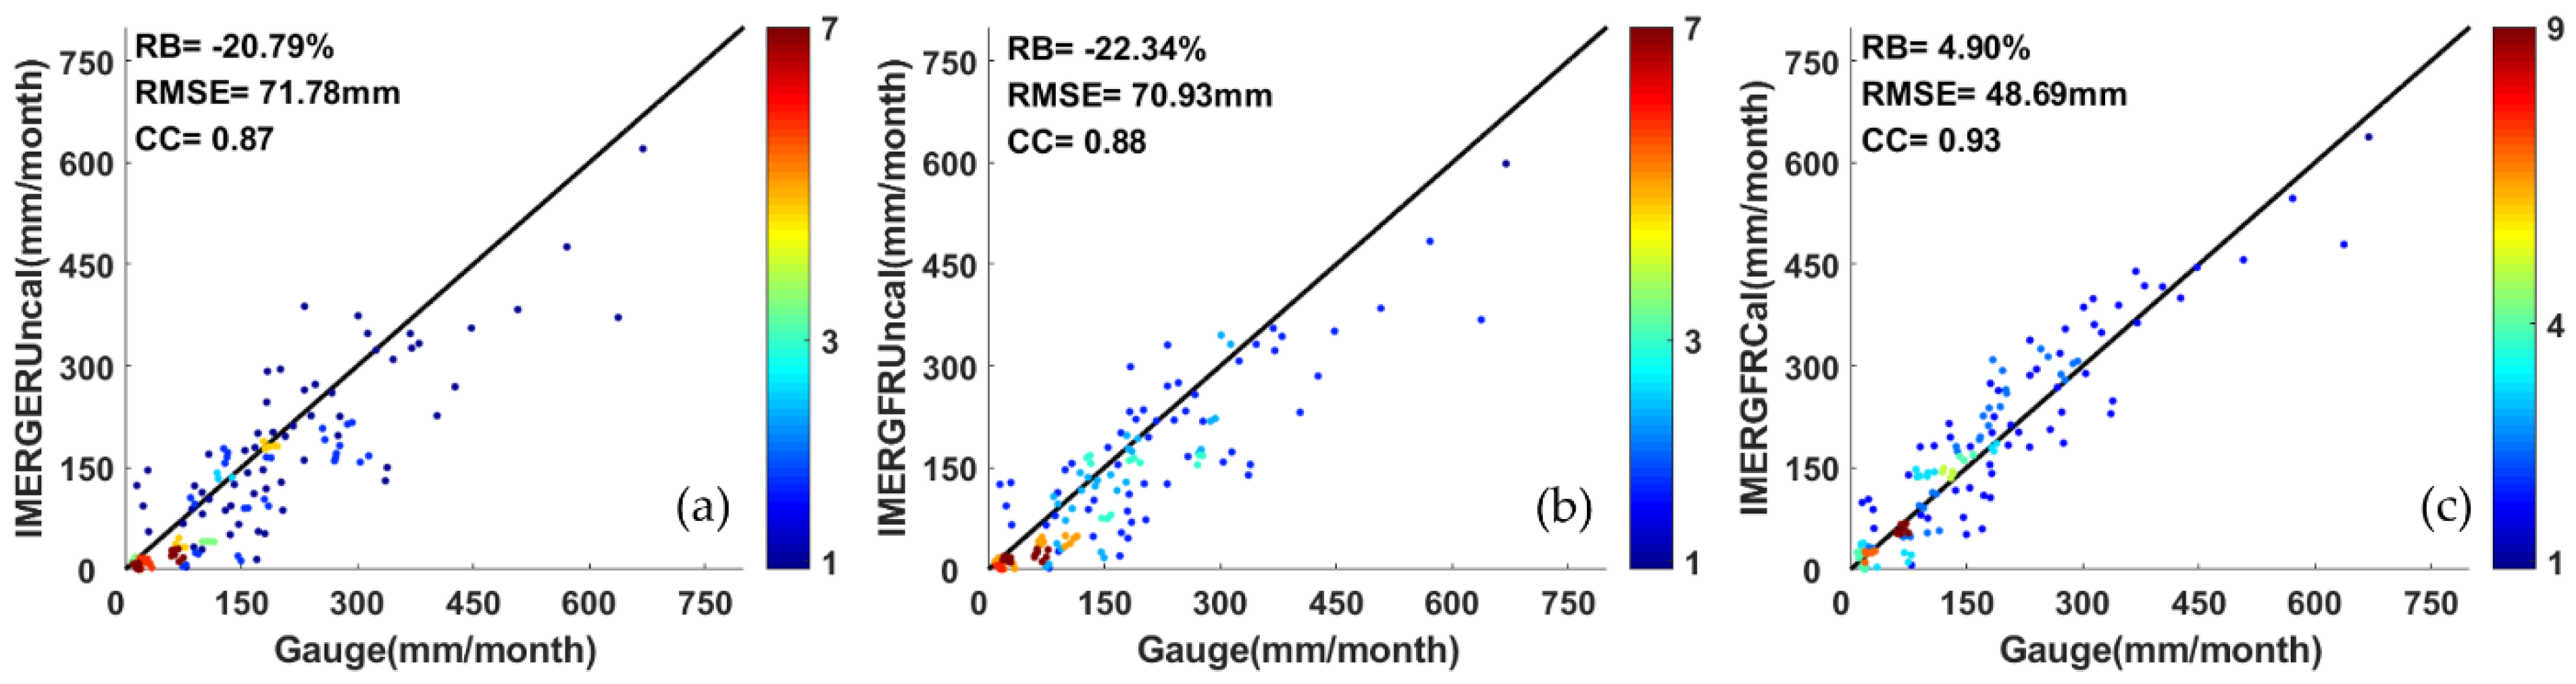
Figure 2. As illustrated in
Figure 4, IMERGFRCal shows much better performance at a monthly scale when compared to the rest of the other two IMERG products with higher CC (0.93), lower RMSE (48.69 mm), and small magnitude of RB (4.90%). IMERGERUncal and IMERGFRUncal perform similarly at a monthly scale with considerable underestimation (by −20.79%, −22.35%) and much larger RMSE (71.78 mm, 70.93 mm, respectively) and closed CC (0.87, 0.88, respectively). This indicates that the gauge calibration in IMERGFRCal can substantially reduce bias and get a much better capability of capturing precipitation at daily and monthly scales than IMERGERUncal and IMERGFRUncal.
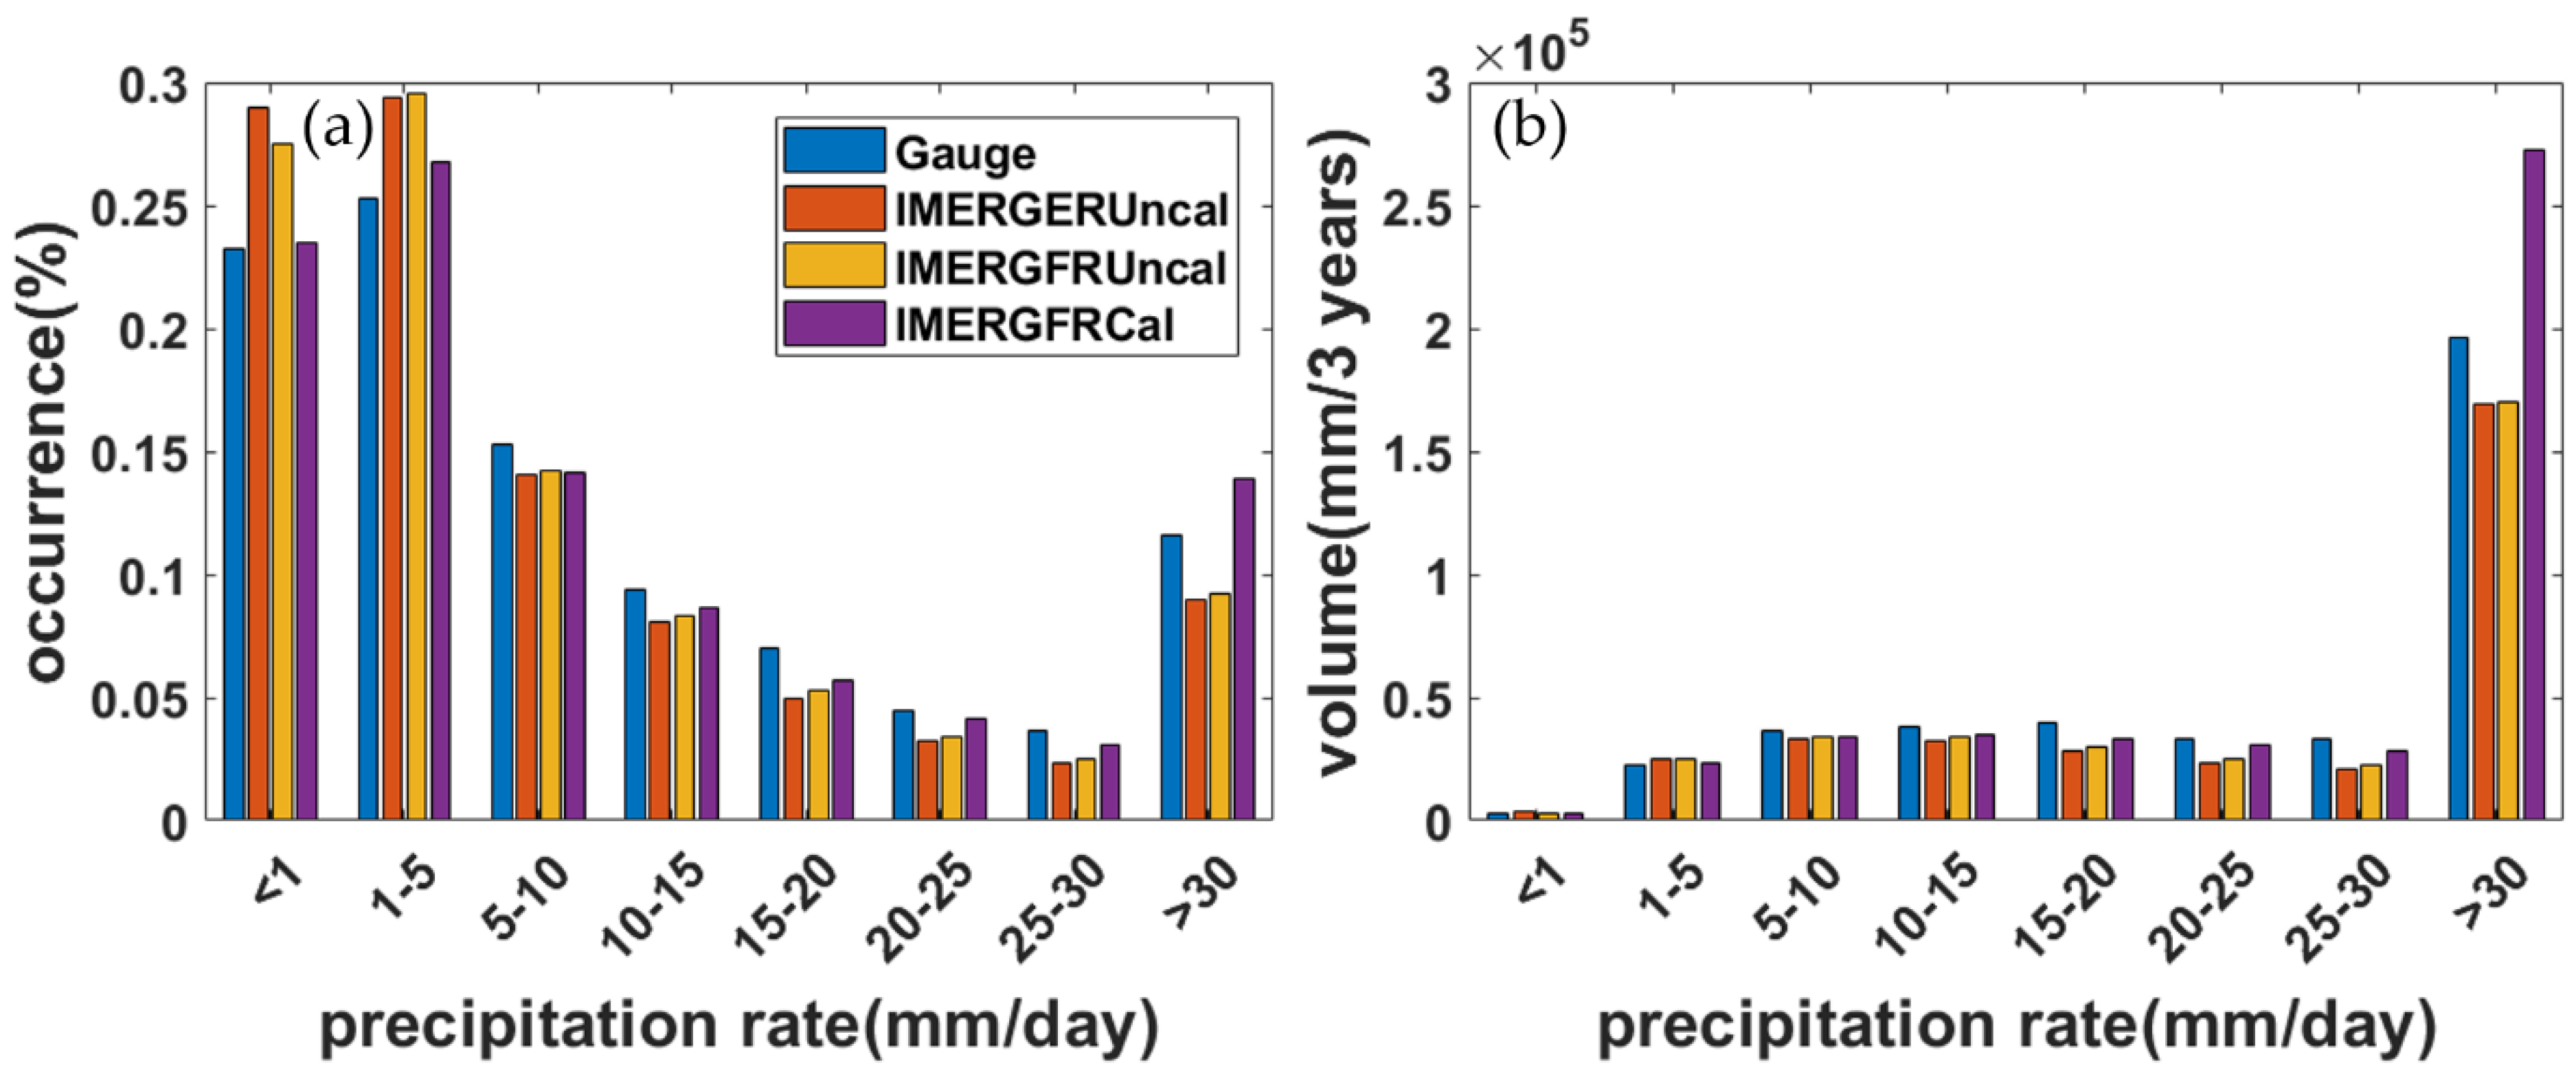
Figure 5 shows the probability distribution functions (PDFs) to reveal how well satellites are able to detect different rain rates in terms of occurrence (PDFc) and volume (PDFv) at a daily scale. It is noted that IMERG products and gauge observations demonstrate similar variation trends with higher precipitation occurrence for the precipitation rate of <5 mm/day. Additionally, similar precipitation PDFc and PDFv patterns can be found at all precipitation rates. Gauge observations show higher precipitation occurrence than IMERG products at precipitation rates from 5 mm/day to 30 mm/day, indicating all IMERG products underestimate the precipitation rate at this range but generate more rainfall at a precipitation rate of <1 mm/day, particularly for IMERGERUncal and IMERGFRUncal. When the precipitation rate is greater than 30 mm/day, IMERGFRCal has obviously the highest precipitation occurrence greater than other products. However, the other two IMERG products estimate less precipitation than GGIDW. This result implies that IMERGFRCal significantly overestimates heavy precipitation while the other two IMERG products underestimate the rainfall at this precipitation rate. It is worth noting that IMERGERUncal and IMERGFRUncal perform pretty close to each other at all precipitation rates with a little more precipitation contributed from IMERGERUncal. These results are consistent with the precipitation shown in
Figure 2. Additionally, it demonstrates the limited ability of satellite-only precipitation products to capture the light precipitation and the gauge-calibrated satellite-based precipitation product to detect the heavy precipitation events.
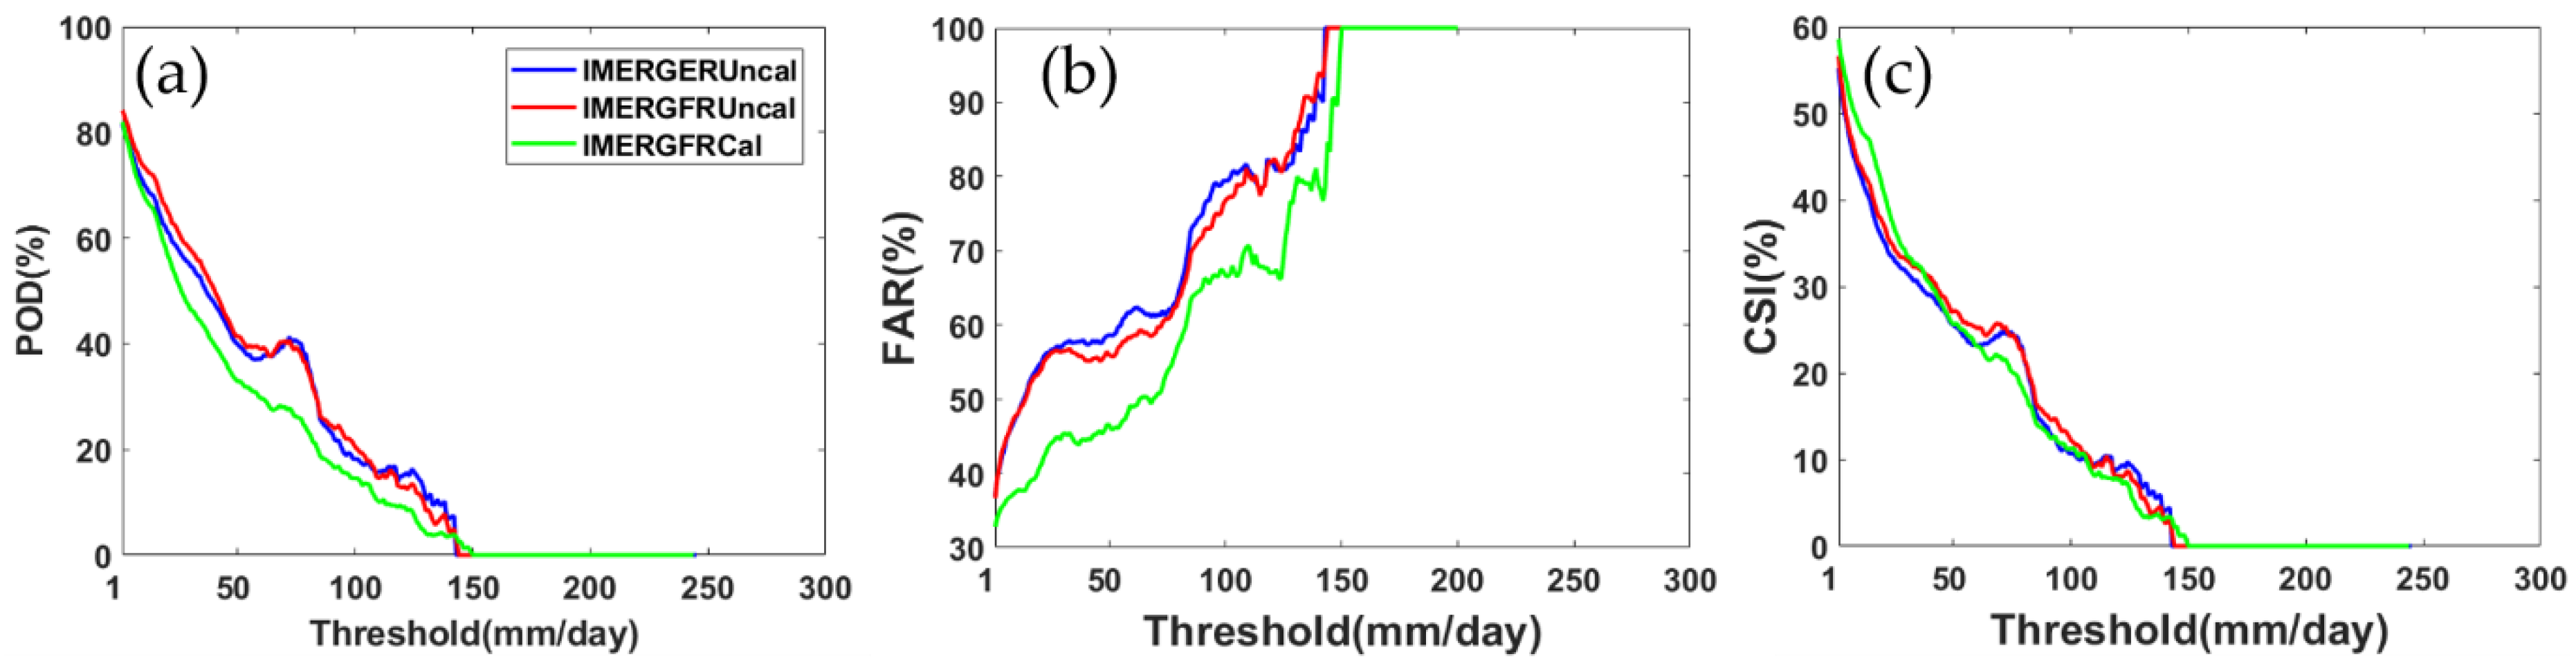
Figure 6 shows the contingency performance of IMERG products as a function of the rain rate. It is noted that the final run IMERG product performs much better than early run IMERG product with higher PODs and CSIs, and generally lower FARs. In addition, it can be found that IMERGERUncal shows a little better contingency scores than IMERGFRUncal with close PODs, FARs and CSIs, indicating the positive effectiveness of gauge-calibration in the final run. When the rain rate is greater than 150 mm/day, all IMERG products have poor PODs (CSIs) close to 0, and FARs close to 1, implying that few precipitation occurrences with rain rates greater than 150 mm/day.
3.2. Seasonal Statistics
Table 3 shows the seasonal performance of IMERG products in terms of CC, RB, and RMSE. It can be seen that all IMERG products perform well in every season with high CC (~0.70) except autumn. IMERGFRCal outperforms the other two satellite-only products with a much smaller magnitude of RB (−23.76% compared to −53.28% and −51.88%) and higher CC (0.57 compared to 0.51 and 0.53). Moreover, the satellite-only IMERG products underestimate precipitation and their performance is close to each other over all seasons. This is consistent with
Figure 2,
Figure 3 and
Figure 4. In contrast, IMERGFRCal outperforms IMERGERUncal and IMERGFRUncal in every season, especially with the smallest magnitude of RB (0.43%) in spring. Generally, IMERGFRCal shows significant improvement in estimating precipitation after the gauge-adjustment.
3.3. Daily Series Mean Rainfall
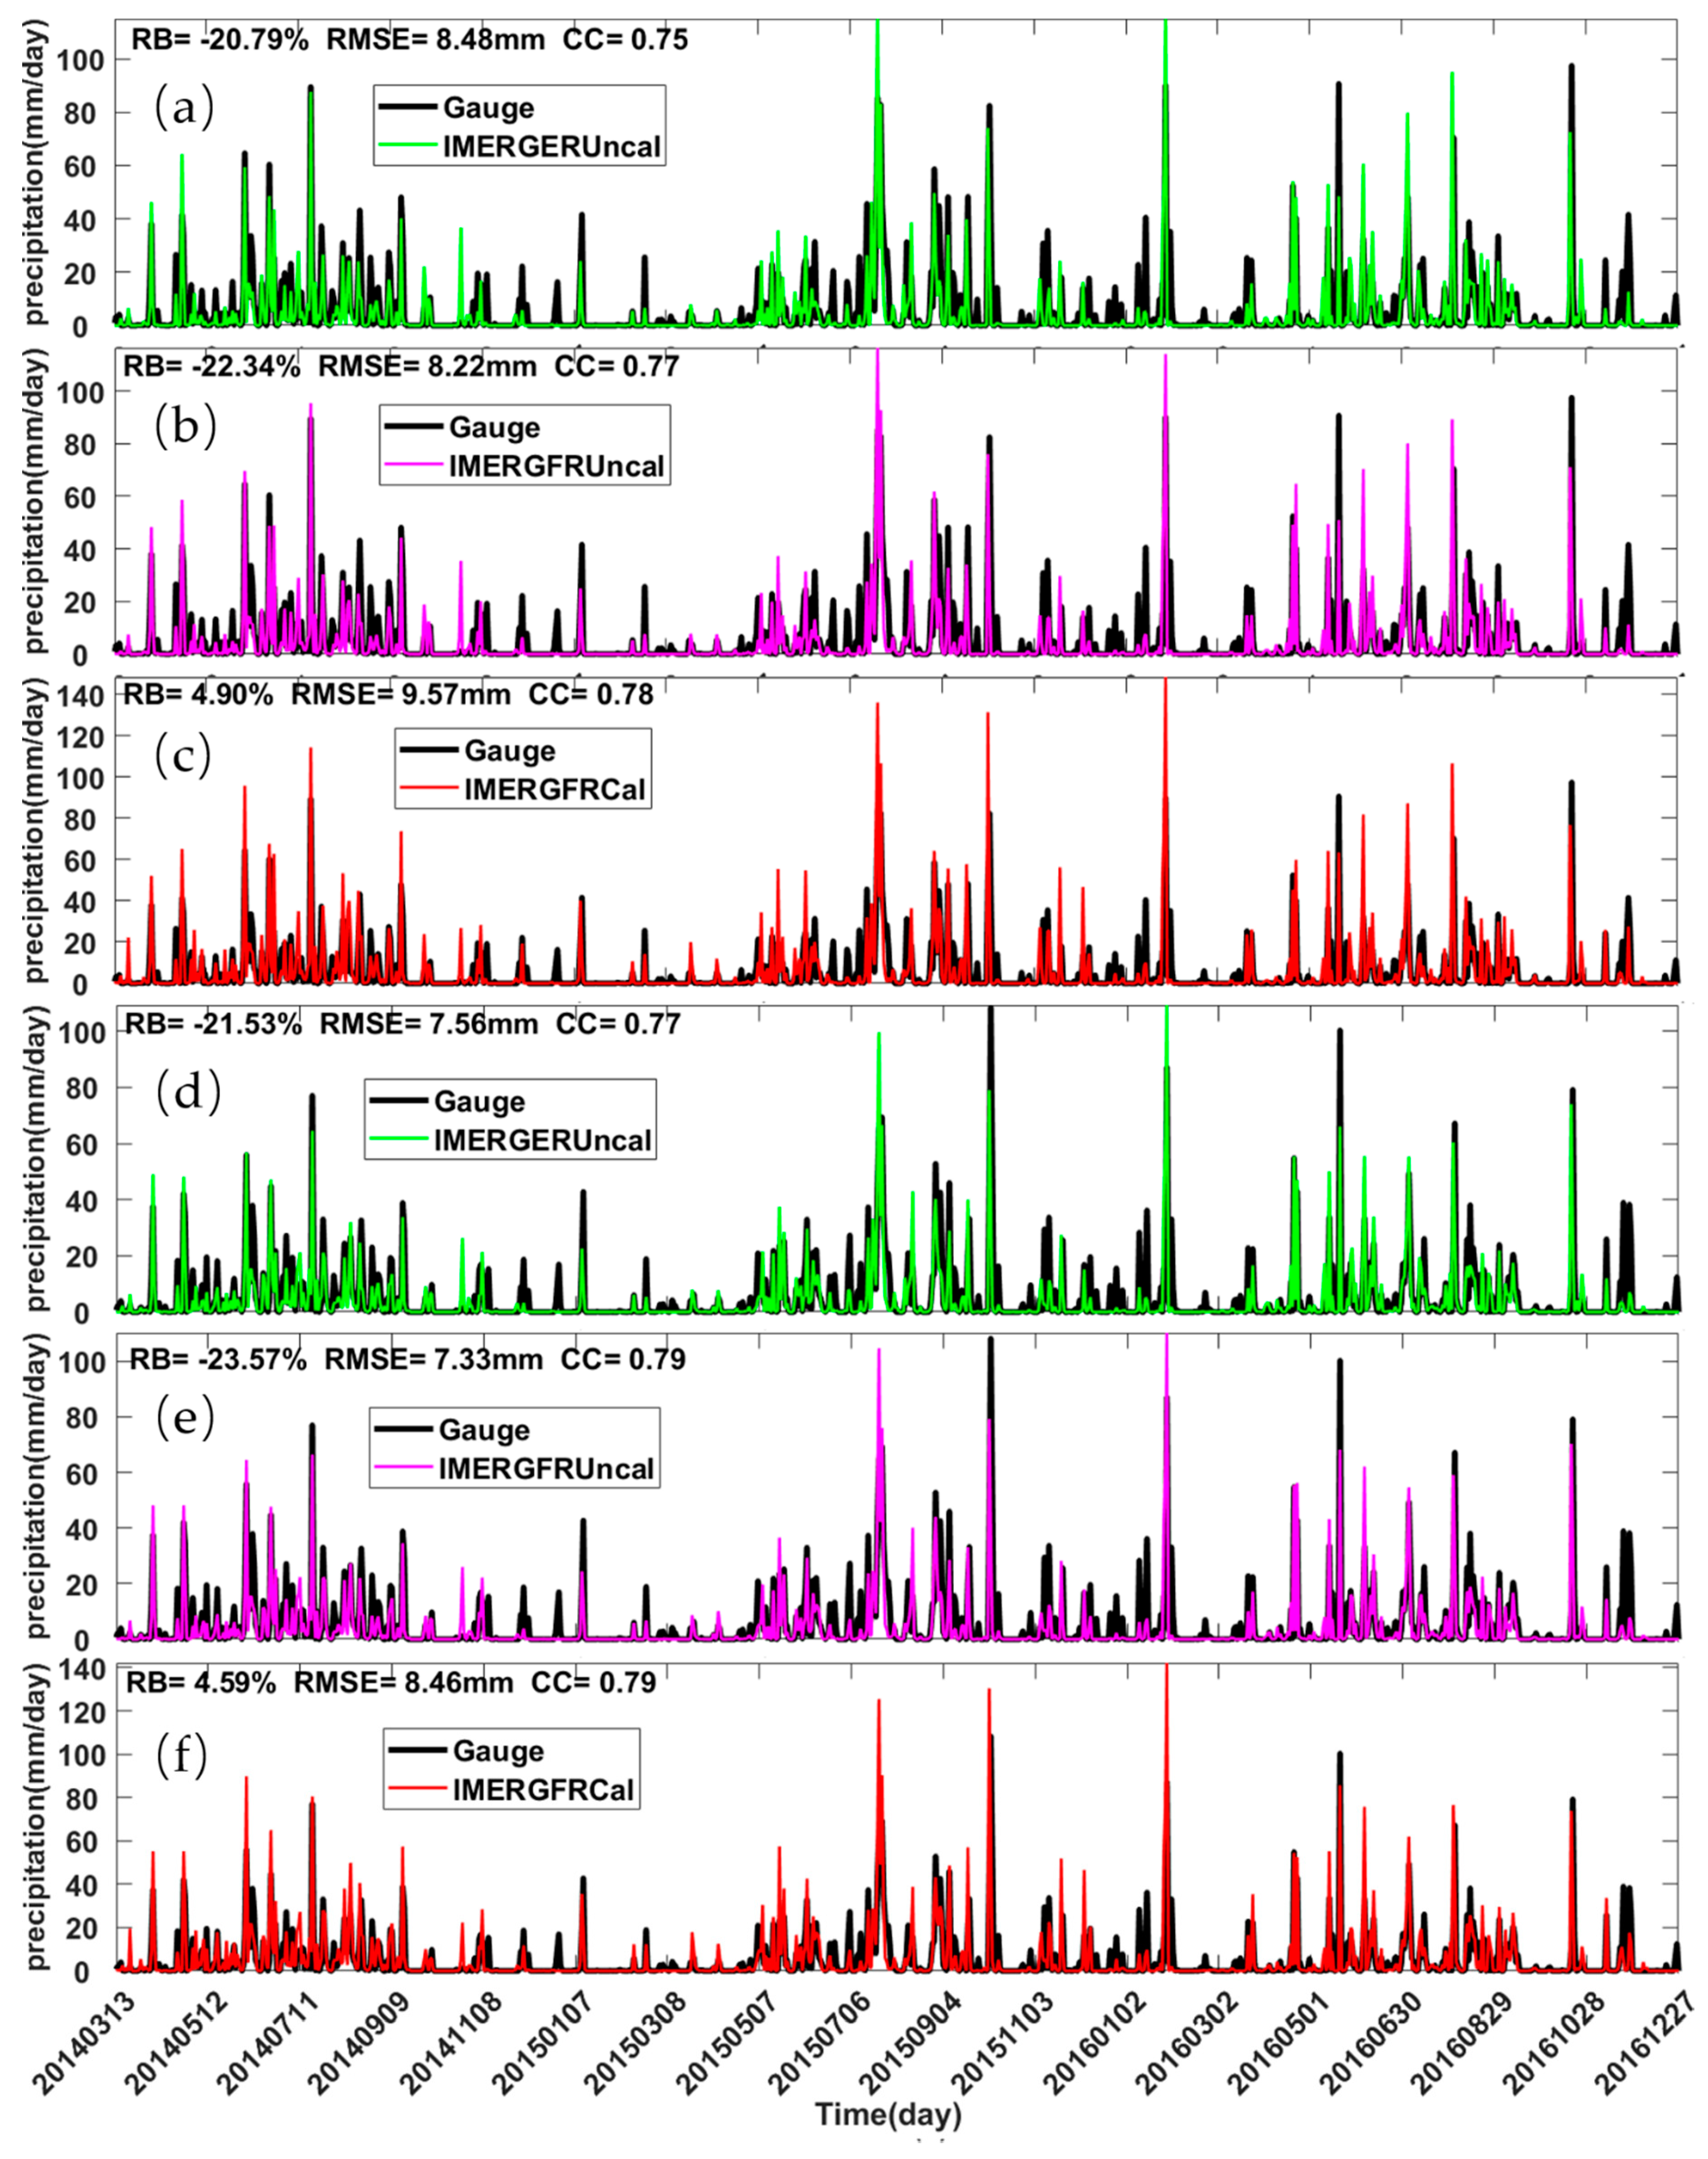
Figure 7 shows the daily mean precipitation of all IMERG products compared to gauge observations in terms of the grid-based average rainfall and basin-based mean precipitation with a high CC, small RMSE, and small magnitude of RB. It can be found that the IMERG products demonstrate similar performances in the series of grid-based average daily precipitation and that of basin-based mean rainfall. Additionally, all IMERG products have similar variation trends of precipitation with gauge observations with high CCs, indicating that all IMERG products capture well the daily mean precipitation pattern most of the time but show significant overestimation of heavy rain from April to September. IMERGFRCal has much better performance than the other two products both based on the grid-based average rainfall and basin-based mean precipitation with a lower RB (4.90% and 4.59%) and higher CC (0.78 and 0.79). Similar to previous reports, IMERGERUncal IMERGFRUncal show similar performances by slightly underestimating the precipitation with small magnitudes of RB (−0.21% and −0.23%).
3.4. Hydrologic Model Calibration
Daily mean precipitation obtained with interpolation of gauge observations using the IDW algorithm was inputted into the Xinanjiang model for model calibration from January 2010 to December 2013. As shown in
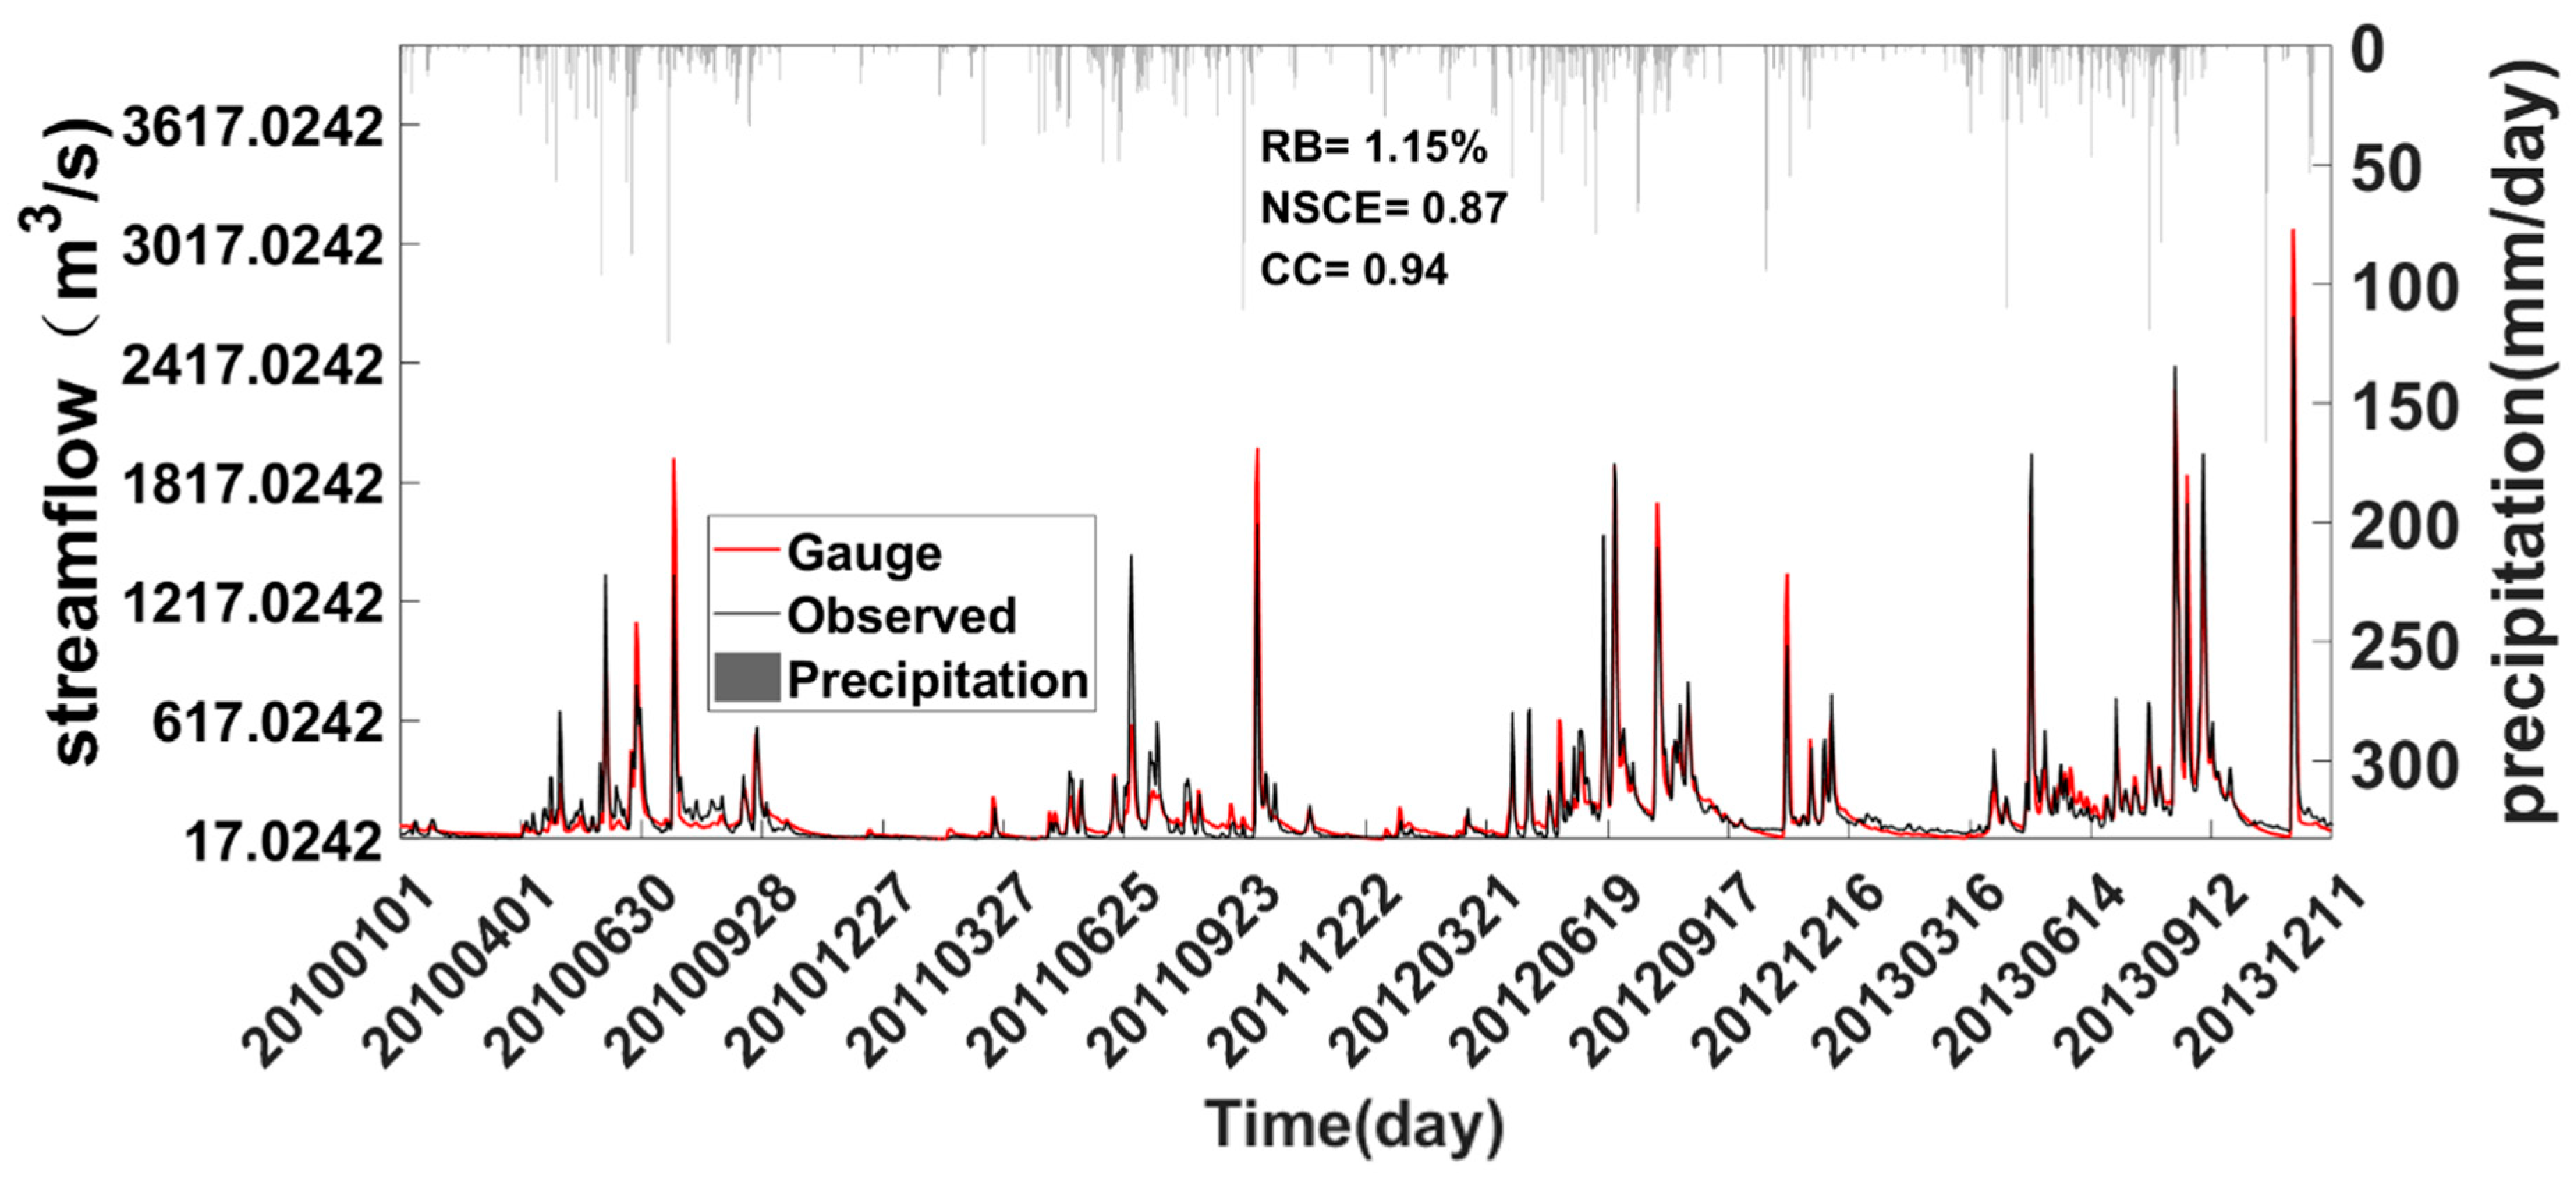
Figure 8, the simulated stream flows with rain gauge observations as forcing data agree well with the observed stream flows with a low RB (1.15%), high NSCE (0.87), and high CC (0.94), indicating that the calibrated Xinanjiang model is applicable to this basin for hydrological simulation.
3.5. Hydrologic Evaluation of IMERG Products
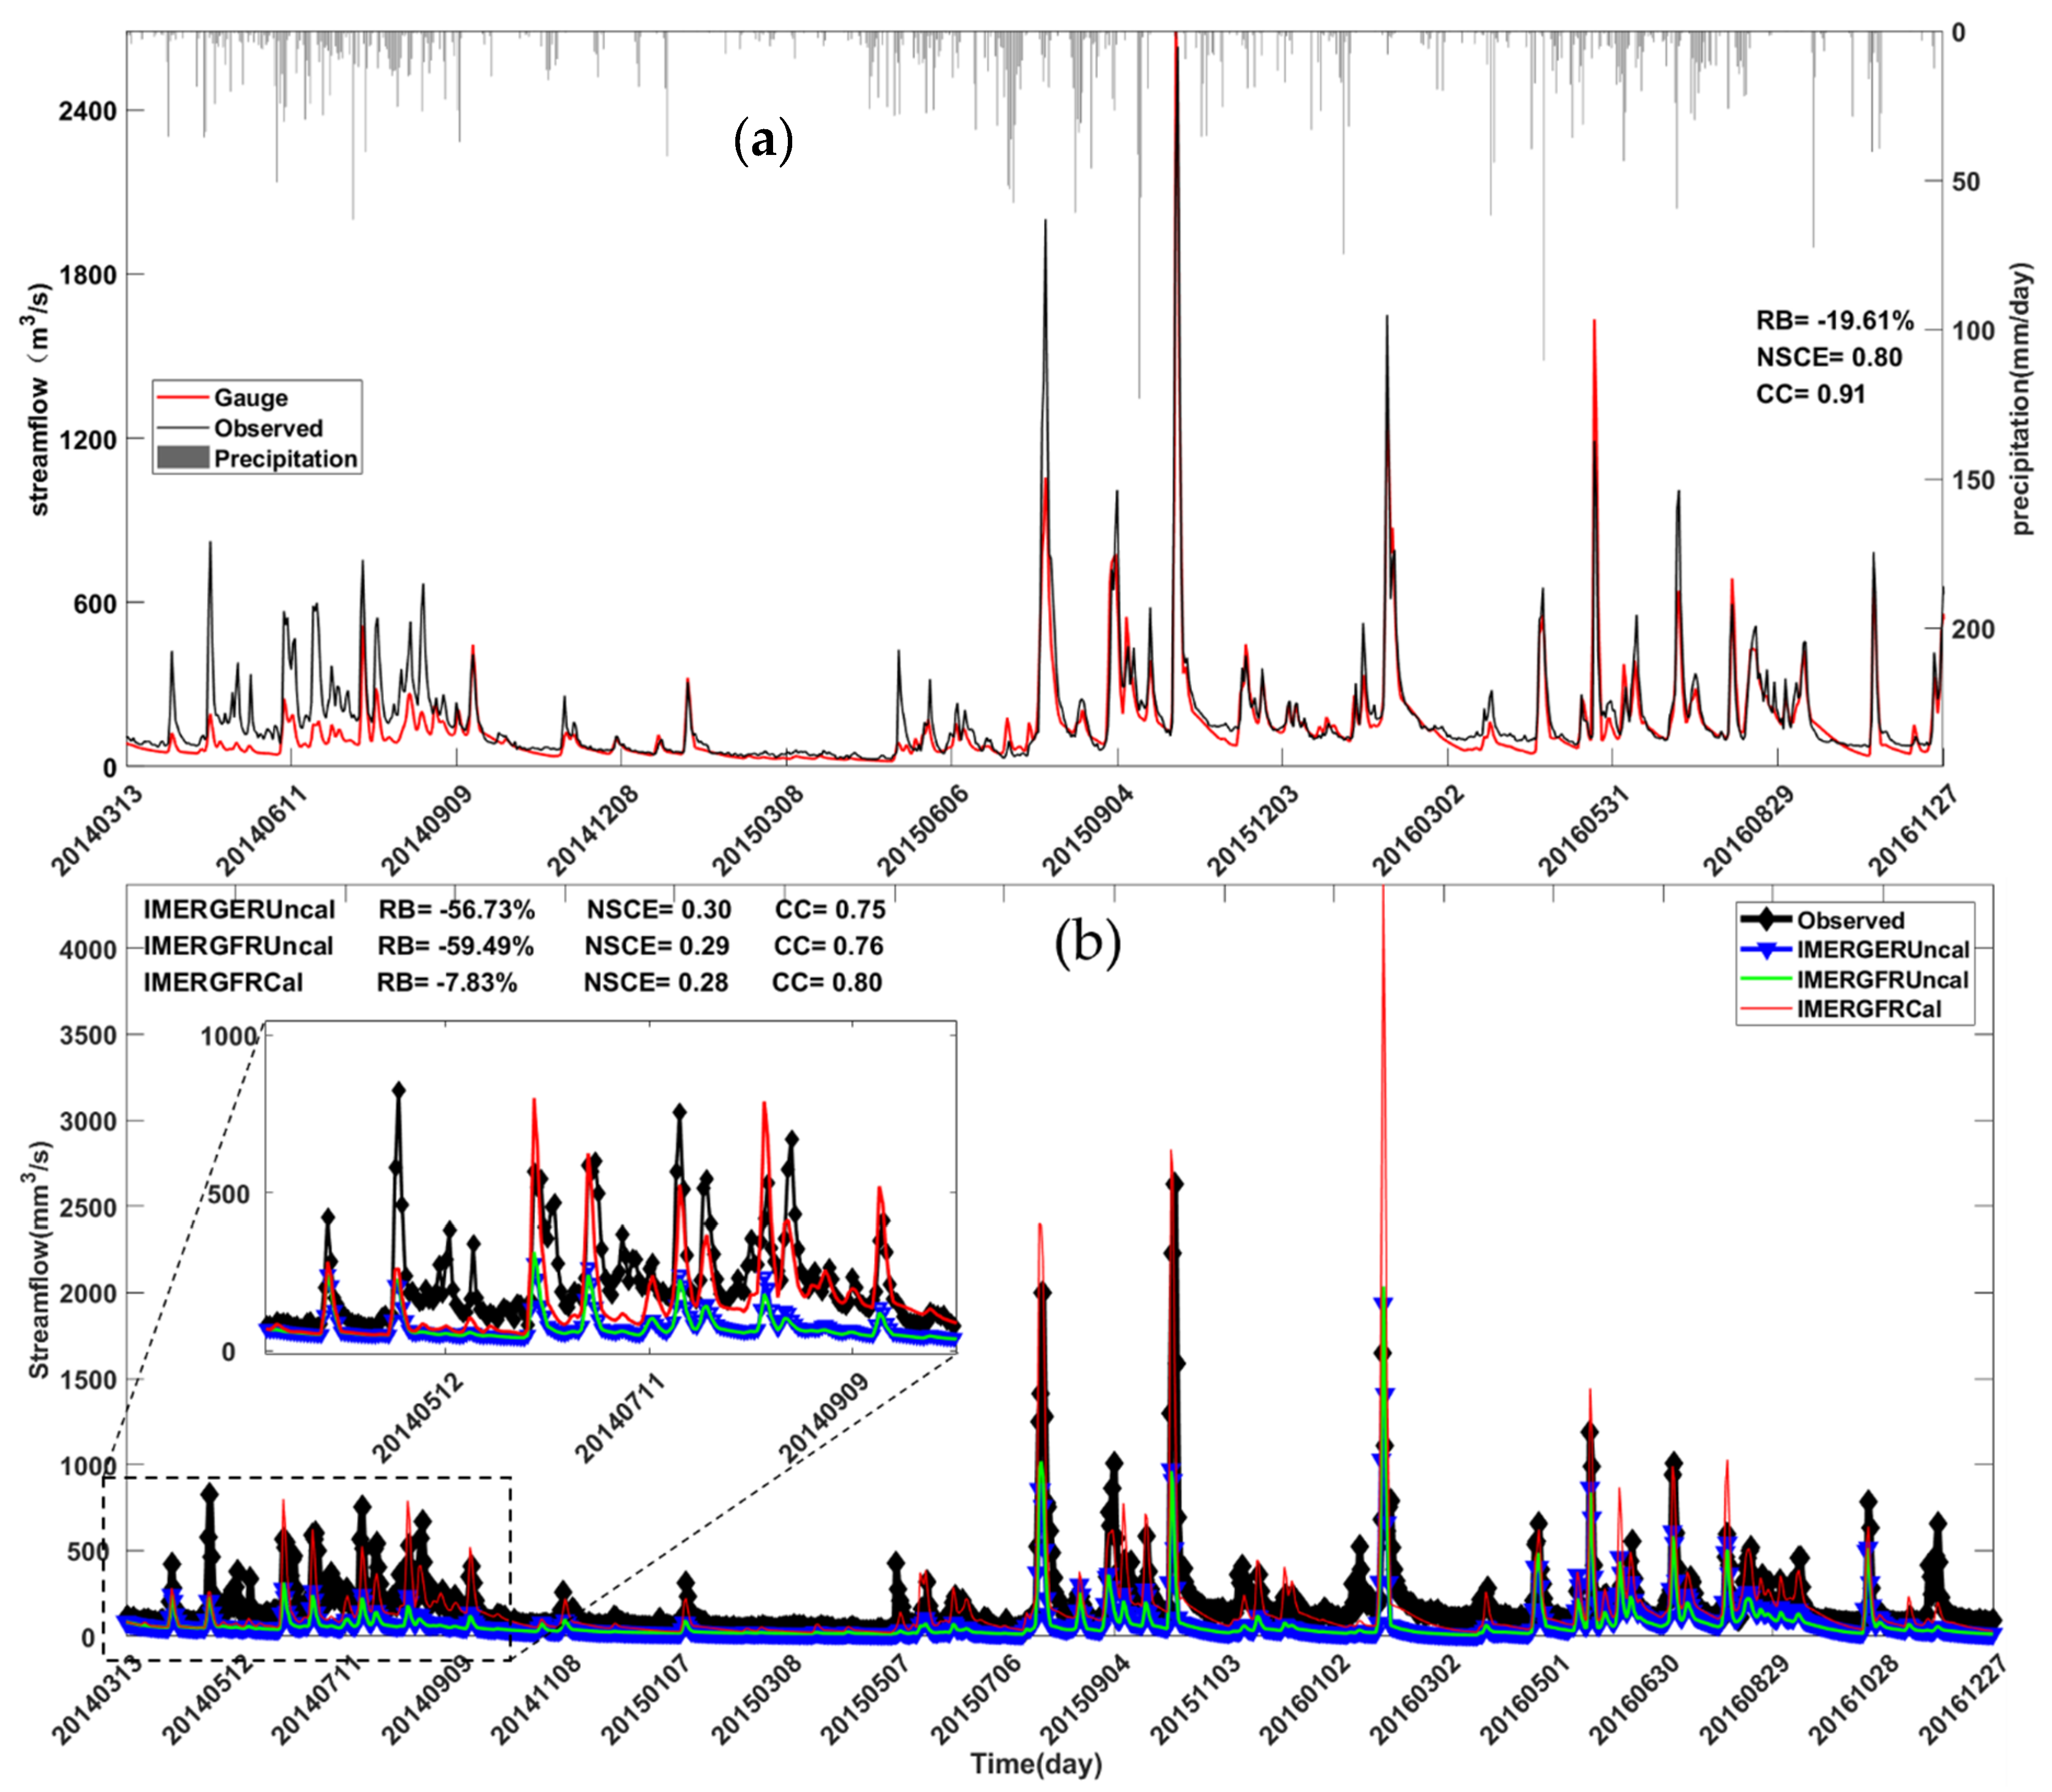
Figure 9 shows the comparison of daily-observed stream flows against simulated stream flows with the rainfall input from gauge and IMERG products. It is clearly shown that simulation with the rainfall input from gauge observations has the best performance with a high NSCE (0.80) and CC (0.91). In contrast, the IMERG products show poorer hydrological performance with low NSCEs (0.28 for IMERGFRCal, 0.30 for IMERGERUncal, and 0.29 for IMERGFRUncal, respectively). This is likely because of the considerable overestimation of heavy rain by IMERGFRCal from April to September as shown in
Figure 7 and the rest of the products underestimate the stream flow in almost the whole period. This is consistent with the result shown in
Figure 4. IMERGERUncal and IMERGFRUncal have almost the same simulated stream flows with a large magnitude of RB (−56.73% versus −59.49%), low NSCE (0.30 versus 0.29) and high CC (0.75 versus 0.76). Both of them significantly underestimated the stream flows during the whole period except IMERGFRCal during some periods in the rainy season. This agrees with the scatter plots as shown in
Figure 3 and
Figure 6. Overall, all IMERG products have limitations in hydrological utilities in the Nanliujiang Basin.
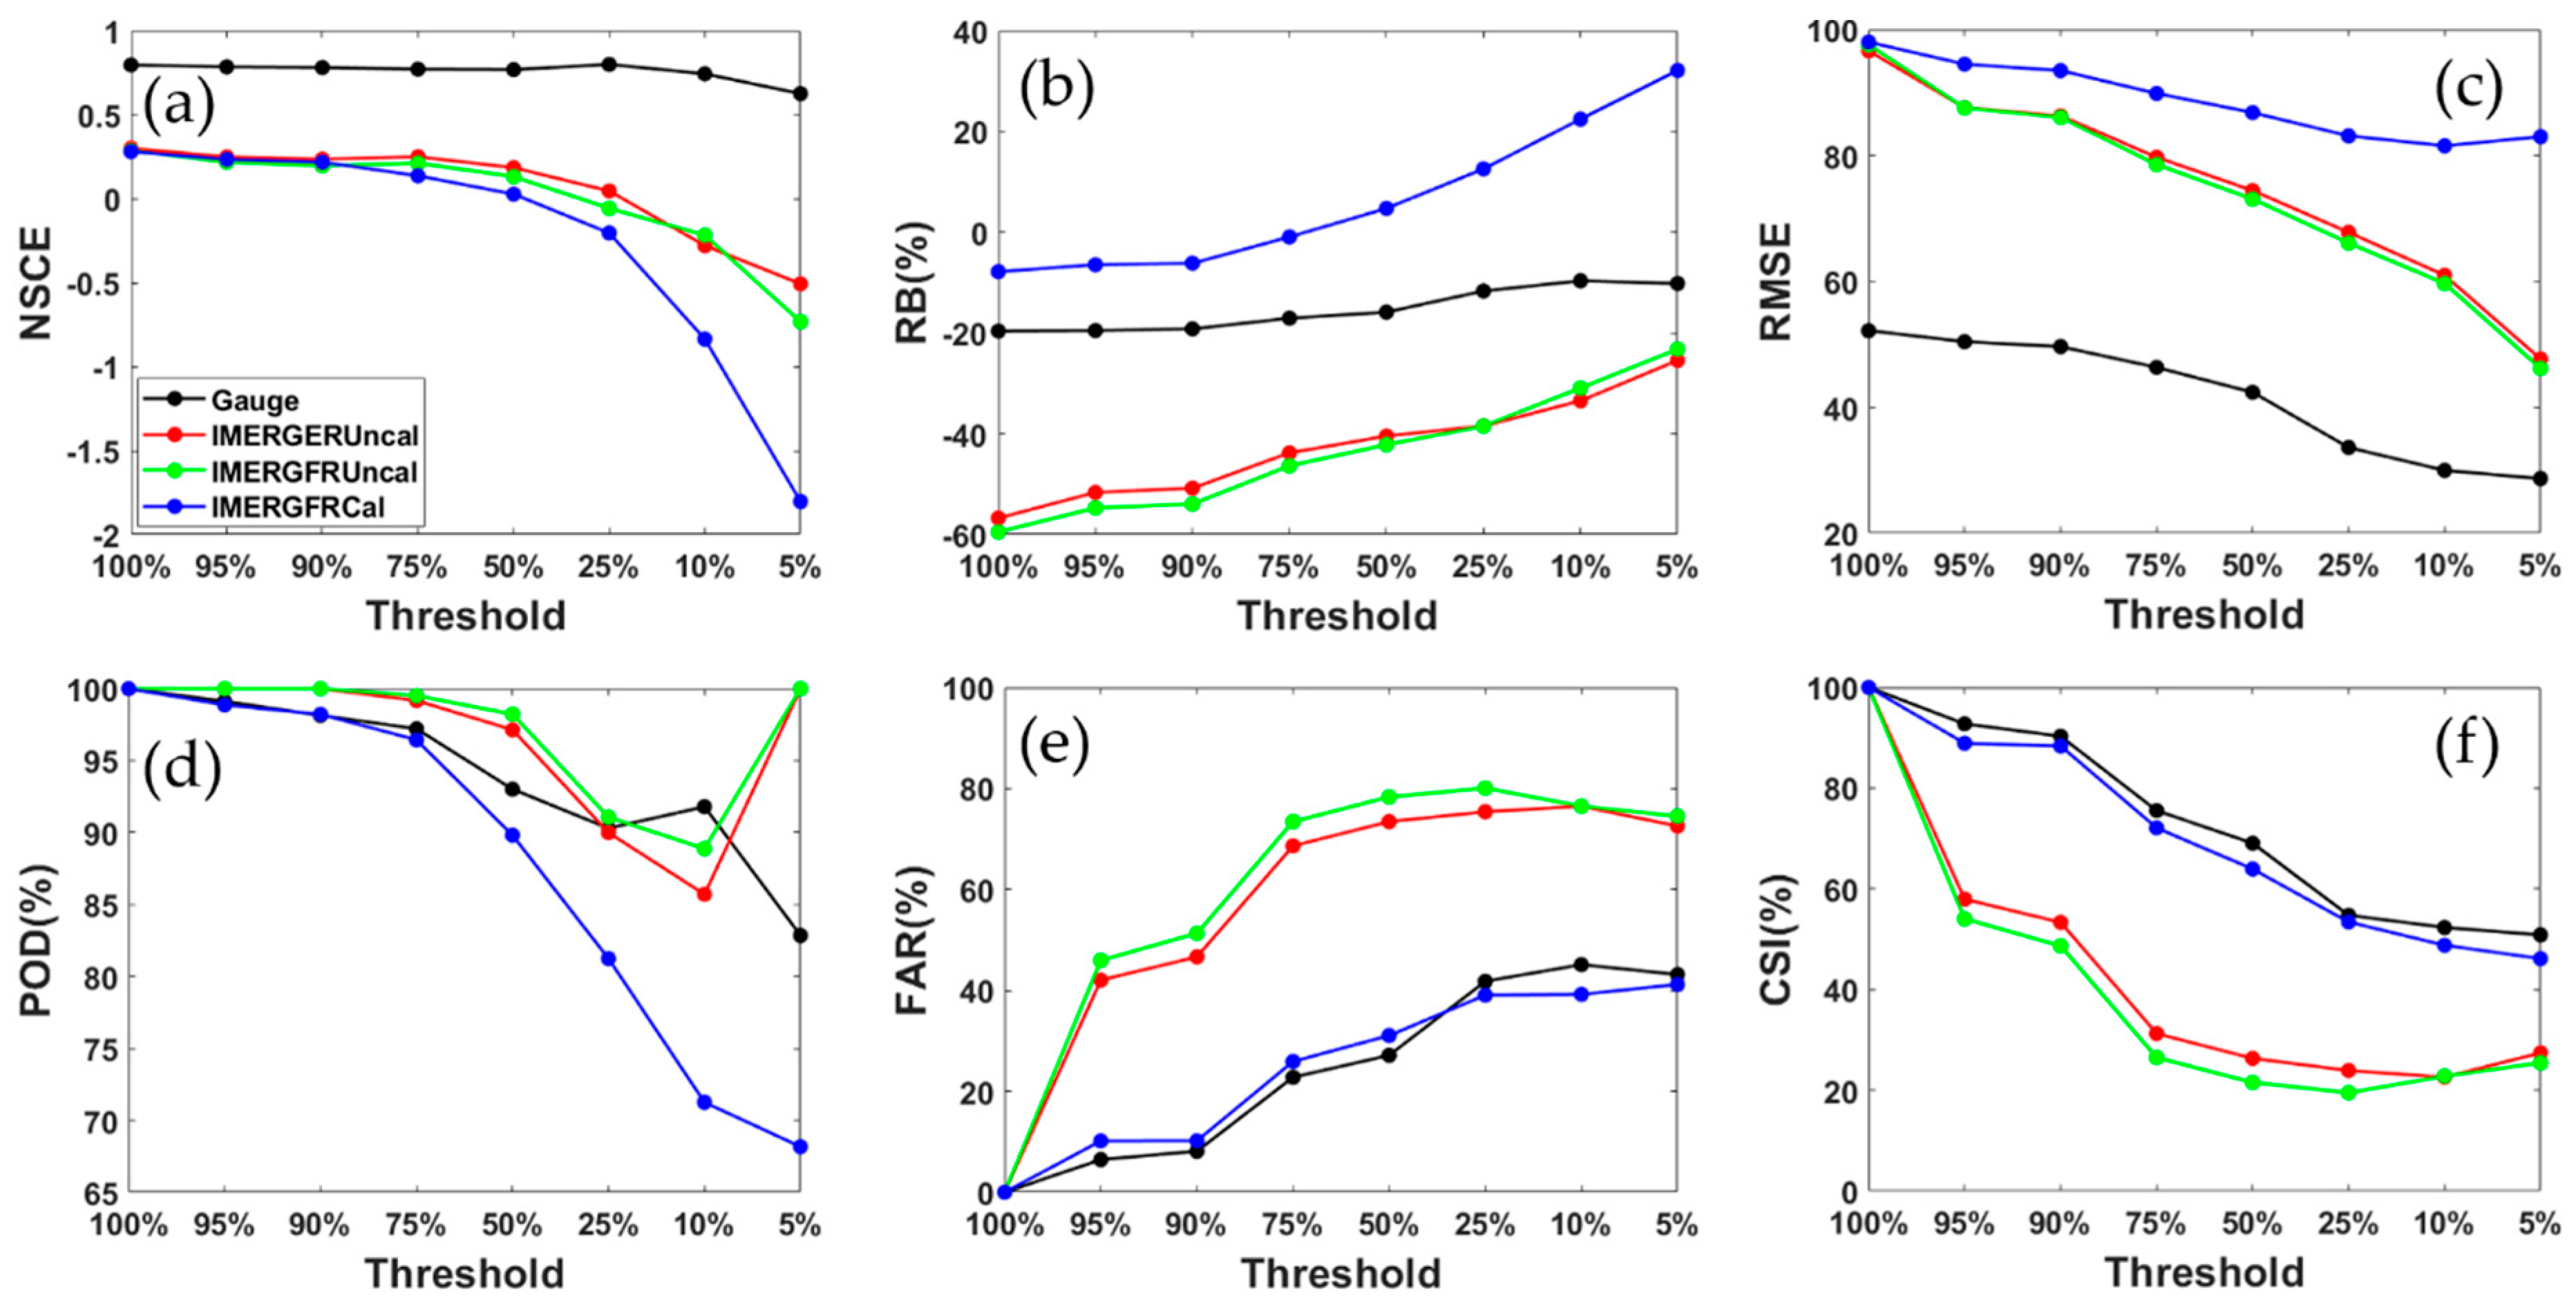
To further analyze the hydrological utilities of IMERG products, different stream flows as the threshold were used to compute the NSCE, RB (%), RMSE (m
3/s), POD, FAR, and CSI to reveal more error details (
Figure 10). It is noted that gauge-based simulated stream flow hydrographs have a higher NSCE and smaller magnitude of RB as the threshold of river discharge decreases. In contrast, all IMERG products get significantly worse NSCE over all river discharge thresholds, indicating that they are not suitable for hydrological simulation especially for flood simulation in this basin. IMERGERUncal and IMERGFRUncal show similar behaviors in terms of NSCE, RB, RMSE, POD, FAR, CSI, whereas IMERGERUncal demonstrates better performance than IMERGFRUncal with slightly higher NSCEs, CSIs, lower FARs, and RMSEs as the stream flow threshold increases. For IMERGFRCal, as shown in
Figure 10a, when the river discharge is greater than 25%, its NSCE dramatically decreases faster than other products. This phenomenon can be found in
Figure 10b–d. As shown in
Figure 10b, the satellite-only IMERG products and gauge observations show the decreasing magnitude of RB as the river discharge threshold increased. In contrast, IMERGFRCal shows an increasing RB from negative value to positive value as the stream flow threshold increases. This implies that IMERGFRCal significantly overestimates the stream observations in the flood season. IMERGERUncal and IMERGFRUncal show significant underestimation of stream flows and demonstrate better performance than IMERGFRCal in the heavy flood period. This result is consistent with
Figure 9 that shows the poor hydrological simulation ability of IMERG products in this basin in daily scales. This indicates that the gauge calibration algorithm in IMERG leads to overestimation of precipitation during heavy precipitation events and satellite-only products underestimate the light precipitation in this small basin.
Figure 11 gives monthly statistics of CC, RB, and RMSE with different precipitation sources to force the hydrologic model. All IMERG products have highly similar patterns with a high CC greater than 0.5. It is noted that the CC of river discharge of IMERG products decreases from January to the lowest CC in March. However, the corresponding precipitation from January to March shows a local minimum in February (
Figure 11a,d). IMERGFRCal has a smaller magnitude of RB than the satellite-only products. The RBs of precipitation of IMERGERUncal and IMERGFRUncal shows a similar pattern of RB for the river discharge (
Figure 11b,e). IMERGERUncal shows a slightly better performance than IMERGFRUncal from April to October while both of them significantly underestimate the stream flow in each month. The gauge observations also underestimate the river discharge almost in all months. However, IMERGFRCal performs well in simulating stream flows from June to October with a slight overestimation. Correspondingly, the hydrograph simulated with gauge observations is better than that with IMERGFRCal from November to January. In addition, IMERG products display much higher RMSE in January and October than other months in terms of monthly precipitation. It indicates that the precipitation observed from the IMERG products has a large spatial variation in these two months.
4. Summary and Conclusions
This study evaluates the V5B IMERG products (i.e., IMERGFRCal, IMERGERUncal, and IMERGFRUncal) through the direct comparison of precipitation against gauge observation and hydrological simulation using the Xinanjiang model based on daily and monthly scales from March 2014 to December 2016 in the Nanliu River basin. To quantify the accuracy of precipitation detection, the IMERG products are assessed against gauge observations with statistics indexes of CC, RB, RMSE, PDFs, and contingency scores (i.e., POD, FAR, CSI). Additionally, three IMERG products were inputted into the Xinanjiang hydrologic model to simulate the stream flows for comparison with observed stream flows in daily and monthly scales in terms of CC, RB, and RMSE. The main results are as follows:
(1) All IMERG products generally capture the precipitation patterns over the study period. IMERGFRCal is most consistent with gauge observations. IMERGERUncal and IMERGFRUncal underestimate much more rainfall than IMERGFRCal over the entire study period. Most overestimation of IMERGFRCal occurs when precipitation rates are greater than 30 mm/day. IMERGERUncal and IMERGFRUncal perform similarly to each other with a relative larger underestimation than IMERGFRCal. All IMERG products overestimate the light precipitation with rain rates less than 5 mm/day and underestimate precipitation rates from 5 mm/day to 30 mm/day. All these products have higher CCs in a daily scale to capture the precipitation patterns. These products show the best performance in spring and yield most underestimation in autumn with a moderate CC.
(2) All IMERG products have higher CCs in a daily scale to capture the precipitation patterns. These products show the best performance in spring and showconsiderable underestimation in autumn with a moderate CC ranging from 0.75 to 0.79.
(3) The river discharge simulation with the IMERG products as forcing data shows relatively poor hydrologic ability in this basin with NSCE < 0.4. IMERGFRCal overestimates stream flows during heavy rainfall events in the flood season, especially from July to August of 2015 and February of 2016. IMERGERUncal and IMERGFRUncal underestimate the river discharge over the entire study period by −49.52% and −51.05%, respectively.
(4) IMERGFRCal outperforms IMERGERUncal and IMERGFRUncal with a lower RB close to 0. It shows a significant overestimation of hydrological simulation in the heavy flood season. RBs of IMERGERUncal and IMERGFRUncal decrease steadily to 0 as the river discharge increases. The simulated stream flows of IMERGFRCal shows drastic fluctuations with a higher RMSE than the other two IMERG products. IMERGERUncal performs a little better than IMERGFRUncal with a slightly higher NSCE, RMSE, CSI, and lower FAR.
The algorithm with the gauge analysis product provided by the DWD GPCC generally improve the IMERG QPE products. As a successor of TRMM, GPM plays an important role in meteorology, hydrology, ecology, and other precipitation related researches. Since late 2014 after a couple of months of launching, the GPM level 3 product IMERG has been released in several versions with full expectations to get much improvement over the previous QPE products. As an effort of the GPM ground validation, this study evaluates the V5B early and final run IMERG products in a humid and wet basin in the coast of the Guangxi province over southern China. The results show that the early run IMERG product shows good abilities in capturing the variation patterns of precipitation but a poor potential of hydrologic utilization in the basin in southern China. Such results will imply that the IMERG products, especially the products without gauge adjustment may be used for precipitation-related applications (e.g., flood monitoring and forecast, hydrological modeling) in the other river basin throughout the world. Additionally, this indicates that IMERG products would still need further improvement for getting better accuracy of precipitation estimation.
Author Contributions
S.C. and J.H. conceived and designed the experiments; Z.L. and C.H. performed the experiments and analyzed the data; A.Z. and L.X. prepared the data and proofread the paper; X.T. and Z.Z. helped analysis the results; Z.L. and S.C. wrote the paper.
Funding
This work was partially supported by “100 Top Talents Program” (74110-52601108) at Sun Yat-Sen University, Guangzhou, Guangdong, China, the High-level Talents Training and Teacher Qualities and Skills Promotion Plan for Guangxi Colleges and Universities (8844), and by the National Natural Science Foundation of China (51579162, 41661021, 41875182, 41866001), Natural Science Foundation of Guangxi (2018JJA150110), Guangxi Natural fund of Innovative Team Project (2016JJF15001).
Acknowledgments
The authors would like to thank the GPM mission scientists and associated NASA personnel responsible for the GPM products. In addition, special thanks to Sheng Chen for his assistance and suggestions.
Conflicts of Interest
The authors declare no conflict of interest.
References
- Huffman, G.J.; Bolvin, D.T.; Nelkin, E.J.; Wolff, D.B.; Adler, R.F.; Gu, G.; Hong, Y.; Bowman, K.P.; Stocker, E.F. The TRMM multisatellite precipitation analysis (TMPA): Quasi-global, multiyear, combined-sensor precipitation estimates at fine scales. J. Hydrometeorol. 2007, 8, 38–55. [Google Scholar] [CrossRef]
- Joyce, R.J.; Janowiak, J.E.; Arkin, P.A.; Xie, P. CMORPH: A method that produces global precipitation estimates from passive microwave and infrared data at high spatial and temporal resolution. J. Hydrometeorol. 2004, 5, 487–503. [Google Scholar] [CrossRef]
- Hong, Y.; Hsu, K.-L.; Sorooshian, S.; Gao, X. Precipitation estimation from remotely sensed imagery using an artificial neural network cloud classification system. J. Appl. Meteorol. Climatol. 2004, 43, 1834–1853. [Google Scholar] [CrossRef]
- Guo, H.; Chen, S.; Bao, A.; Behrangi, A.; Hong, Y.; Ndayisaba, F.; Hu, J.; Stepanian, P.M. Early assessment of Integrated Multi-satellite Retrievals for Global Precipitation Measurement over China. Atmos. Res. 2016, 176–177, 121–133. [Google Scholar] [CrossRef]
- Gaona, M.F.R.; Overeem, A.; Leijnse, H.; Uijlenhoet, R. First-Year Evaluation of GPM Rainfall over the Netherlands: IMERG Day 1 Final Run (V03D). J. Hydrometeorol. 2016, 17, 2799–2814. [Google Scholar] [CrossRef]
- Asong, Z.; Razavi, S.; Wheater, H.; Wong, J. Evaluation of integrated multisatellite retrievals for GPM (IMERG) over southern Canada against ground precipitation observations: A preliminary assessment. J. Hydrometeorol. 2017, 18, 1033–1050. [Google Scholar] [CrossRef]
- Chen, S.; Hu, J.; Zhang, Z.; Behrangi, A.; Hong, Y.; Gebregiorgis, A.S.; Cao, J.; Hu, B.; Xue, X.; Zhang, X. Hydrologic Evaluation of the TRMM Multisatellite Precipitation Analysis Over Ganjiang Basin in Humid Southeastern China. IEEE J. Sel. Top. Appl. Earth Obs. Remote Sens. 2017, 8, 4568–4580. [Google Scholar] [CrossRef]
- Li, N.; Tang, G.; Zhao, P.; Hong, Y.; Gou, Y.; Yang, K. Statistical assessment and hydrological utility of the latest multi-satellite precipitation analysis IMERG in Ganjiang River basin. Atmos. Res. 2017, 183, 212–223. [Google Scholar] [CrossRef]
- Tan, M.L.; Santo, H. Comparison of GPM IMERG, TMPA 3B42 and PERSIANN-CDR satellite precipitation products over Malaysia. Atmos. Res. 2018, 202, 63–76. [Google Scholar] [CrossRef]
- Chen, F.; Li, X. Evaluation of IMERG and TRMM 3B43 Monthly Precipitation Products over Mainland China. Remote Sens. 2016, 8, 472. [Google Scholar] [CrossRef]
- Omranian, E.; Sharif, H.O. Evaluation of the Global Precipitation Measurement (GPM) Satellite Rainfall Products over the Lower Colorado River Basin, Texas. J. Am. Water Resour. Assoc. 2018, 54, 882–898. [Google Scholar] [CrossRef]
- Sahlu, D.; Nikolopoulos, E.I.; Moges, S.A.; Anagnostou, E.N.; Hailu, D. First evaluation of the Day-1 IMERG over the upper Blue Nile basin. J. Hydrometeorol. 2016, 17, 2875–2882. [Google Scholar] [CrossRef]
- Tian, F.; Hou, S.; Yang, L.; Hu, H.; Hou, A. How Does the Evaluation of the GPM IMERG Rainfall Product Depend on Gauge Density and Rainfall Intensity? J. Hydrometeorol. 2018, 19, 339–349. [Google Scholar] [CrossRef]
- Omranian, E.; Sharif, H.; Tavakoly, A. How well can global precipitation measurement (GPM) capture hurricanes? Case study: Hurricane Harvey. Remote Sens. 2018, 10, 1150. [Google Scholar] [CrossRef]
- Derin, Y.; Anagnostou, E.; Berne, A.; Borga, M.; Boudevillain, B.; Buytaert, W.; Chang, C.-H.; Delrieu, G.; Hong, Y.; Hsu, Y.C. Multiregional satellite precipitation products evaluation over complex terrain. J. Hydrometeorol. 2016, 17, 1817–1836. [Google Scholar] [CrossRef]
- Chen, S.; Hong, Y.; Cao, Q.; Kirstetter, P.-E.; Gourley, J.J.; Qi, Y.; Zhang, J.; Howard, K.; Hu, J.; Wang, J. Performance evaluation of radar and satellite rainfalls for Typhoon Morakot over Taiwan: Are remote-sensing products ready for gauge denial scenario of extreme events? J. Hydrol. 2013, 506, 4–13. [Google Scholar] [CrossRef]
- Oliveira, R.; Maggioni, V.; Vila, D.; Porcacchia, L. Using Satellite Error Modeling to Improve GPM-Level 3 Rainfall Estimates over the Central Amazon Region. Remote Sens. 2018, 10, 336. [Google Scholar] [CrossRef]
- Zhang, Z.; Tian, J.; Huang, Y.; Chen, X.; Chen, S.; Duan, Z. Hydrologic Evaluation of TRMM and GPM IMERG Satellite-Based Precipitation in a Humid Basin of China. Remote Sens. 2019, 11, 431. [Google Scholar] [CrossRef]
- Jiang, S.; Ren, L.; Xu, C.-Y.; Yong, B.; Yuan, F.; Liu, Y.; Yang, X.; Zeng, X. Statistical and hydrological evaluation of the latest Integrated Multi-satellitE Retrievals for GPM (IMERG) over a midlatitude humid basin in South China. Atmos. Res. 2018, 214, 418–429. [Google Scholar] [CrossRef]
- Yan, S.; Xiong, A. Validation and comparison of a new gauge-based precipitation analysis over mainland China. Int. J. Climatol. 2016, 36, 252–265. [Google Scholar]
- Zhao, Y.; Xie, Q.; Lu, Y.; Hu, B. Hydrologic Evaluation of TRMM Multisatellite Precipitation Analysis for Nanliu River Basin in Humid Southwestern China. Sci. Rep. 2017, 7, 2470. [Google Scholar] [CrossRef] [PubMed]
- Ren-Jun, Z. The Xinanjiang model applied in China. J. Hydrol. 1992, 135, 371–381. [Google Scholar] [CrossRef]
- Duan, Q.; Sorooshian, S.; Gupta, V. Effective and efficient global optimization for conceptual rainfall-runoff models. Water Resour. Res. 1992, 28, 1015–1031. [Google Scholar] [CrossRef]
- Huffman, G.J.; Bolvin, D.T.; Nelkin, E.J. Integrated Multi-satellitE Retrievals for GPM (IMERG) technical documentation. NASA/GSFC Code 2015, 612, 47. [Google Scholar]
Figure 1.
Study region and gauge distribution.
Figure 1.
Study region and gauge distribution.
Figure 2.
Three-year mean daily precipitation (mm/day) over the Nanliujiang Basin for (a) Gridded gauge product (GGIDW); (b) early run satellite-only IMERG product (IMERGERUncal); (c) final run satellite-only IMERG product (IMERGFRUncal); (d) final run gauge-corrected IMERG product (IMERGFRCal).
Figure 2.
Three-year mean daily precipitation (mm/day) over the Nanliujiang Basin for (a) Gridded gauge product (GGIDW); (b) early run satellite-only IMERG product (IMERGERUncal); (c) final run satellite-only IMERG product (IMERGFRUncal); (d) final run gauge-corrected IMERG product (IMERGFRCal).
Figure 3.
Scatter plots of the grid-based daily precipitation versus (a) IMERGERUncal, (b) IMERGFRUncal, and (c) IMERGFRCal at the selected grid boxes in the Nanliujiang Basin at daily scales.
Figure 3.
Scatter plots of the grid-based daily precipitation versus (a) IMERGERUncal, (b) IMERGFRUncal, and (c) IMERGFRCal at the selected grid boxes in the Nanliujiang Basin at daily scales.
Figure 4.
Scatter plots of the grid-based monthly precipitation versus (a) IMERGERUncal, (b) IMERGFRUncal, and (c) IMERGFRCal at the selected grid boxes in the Nanliujiang Basin at monthly scales.
Figure 4.
Scatter plots of the grid-based monthly precipitation versus (a) IMERGERUncal, (b) IMERGFRUncal, and (c) IMERGFRCal at the selected grid boxes in the Nanliujiang Basin at monthly scales.
Figure 5.
PDFs of precipitation (a) occurrence and (b) volume. The computation is conducted only with the grid cells where both the reference and global precipitation measurement (GPM) have nonzero precipitation.
Figure 5.
PDFs of precipitation (a) occurrence and (b) volume. The computation is conducted only with the grid cells where both the reference and global precipitation measurement (GPM) have nonzero precipitation.
Figure 6.
Contingency metrics of (a) probability of detection (POD), (b) false alarm ratio (FAR), and (c) critical success index (CSI) for precipitation in the Nanliu River basin.
Figure 6.
Contingency metrics of (a) probability of detection (POD), (b) false alarm ratio (FAR), and (c) critical success index (CSI) for precipitation in the Nanliu River basin.
Figure 7.
(a–c) Time series of daily precipitation based on grid-based observations from gauge and IMERG products; (d–f) time series of basin average daily precipitation derived from gauge observation interpolation and IMERG products.
Figure 7.
(a–c) Time series of daily precipitation based on grid-based observations from gauge and IMERG products; (d–f) time series of basin average daily precipitation derived from gauge observation interpolation and IMERG products.
Figure 8.
Calibration of the Xinanjiang model from January 2010 to December 2013. Rainfall inputs (gray bars) from gauge observations are plotted on the secondary coordinate.
Figure 8.
Calibration of the Xinanjiang model from January 2010 to December 2013. Rainfall inputs (gray bars) from gauge observations are plotted on the secondary coordinate.
Figure 9.
Daily simulations of river discharge with rainfall inputs from (a) gauge; (b) IMERG products. Rainfall inputs (gray bars) from gauge observations are plotted on the secondary ordinate in (a).
Figure 9.
Daily simulations of river discharge with rainfall inputs from (a) gauge; (b) IMERG products. Rainfall inputs (gray bars) from gauge observations are plotted on the secondary ordinate in (a).
Figure 10.
Binary analysis of daily stream flow using (a) Nash-Sutcliffe index (NSCE); (b) relative bias (RB) (%); (c) root mean square error (RMSE) (m3/s); (d) POD; (e) FAR; and (f) CSI as a function of percentage of stream flow. Percentage numbers’ axis presents low to high flows, in which 100% means all flows, 5% means only highest 5% flows included. The corresponding stream flow is 0, 42.5, 50, 80.2, 124, 207, 354, and 525 (m3/s).
Figure 11.
Monthly correlation coefficient (CC), RB (%), and RMSE (m3/s) for (a–c) input precipitation (first row) and (d–f) output stream flows (second row) across all 12 months for January (J), February (F), March (M), April (A), May (M), June (J), July (J), August (A), September (S), October (O), November (N), and December (D).
Table 1.
Calibrated parameters and calibrated values in the Nanliu River basin.
Table 1.
Calibrated parameters and calibrated values in the Nanliu River basin.
| No. | Parameters | Definition | Calibrated Value |
|---|
| 1 | WM | Areal mean tesion water capacity | 549.8761 |
| 2 | X | Ratio of the WUM to WM (0–1)
WUM: Average basin storage capacity of the upper layer | 0.9029 |
| 3 | Y | Ratio of the WLM to (1–X) WM (0–1)
WUM: Average basin storage capacity of the lower layer
(WM = WUM + WLM_WDM) | 0.0011 |
| 4 | KE | Ratio of potential evaporation to pan evaporation | 0.773 |
| 5 | B | Exponential number of storage capacity distribution curve | 0.5992 |
| 6 | SM | Areal mean free water storage capacity(mm) | 59.9938 |
| 7 | EX | A parameter in the distribution of free water storage capacity | 0.8717 |
| 8 | CI | A coefficient relating RI, a contribution to interflow, to free water storage (areal mean) (1/delta) | 0.1025 |
| 9 | CG | A coefficient relating RG, a contribution to groundwater, to free water storage (areal mean) (1/delta) | 0.0201 |
| 10 | CIMP | Proportion of impermeable area to the total area. | 0.0061 |
| 11 | C | Evapotranspiration coefficient from deep layer | 0.2869 |
| 12 | CKI | The interflow recession coefficient (0–1) | 0.9186 |
| 13 | CKG | The groundwater recession coefficient (0–1) | 0.9967 |
| 14 | CN | Number of cascade linear reservoir for runoff routing | 4.1202 |
| 15 | CNK | Scale parameter of cascale linear (delta) reservoir | 12.7238 |
Table 2.
Contingency table comparing precipitation detection by Gauge and Integrated Multi-satellite Retrievals for GPM (IMERG).
Table 2.
Contingency table comparing precipitation detection by Gauge and Integrated Multi-satellite Retrievals for GPM (IMERG).
| | Gauge Rain | Gauge Not-Rain |
|---|
| IMERG Rain | H | F |
| IMERG Not-Rainy | M | Z |
Table 3.
Grid-based seasonal statistics with IMERG products over the Nanliujiang River basin.
Table 3.
Grid-based seasonal statistics with IMERG products over the Nanliujiang River basin.
| Season | Index | CC | RB (%) | RMSE (mm/day) |
|---|
| Spring | IMERGERUncal | 0.7584 | −17.58 | 6.8362 |
| IMERGFRUncal | 0.7915 | −16.65 | 6.3184 |
| IMERGFRCal | 0.7778 | 0.43 | 7.1768 |
| Summer | IMERGERUncal | 0.6796 | −14.75 | 14.0142 |
| IMERGFRUncal | 0.7083 | −11.19 | 13.5639 |
| IMERGFRCal | 0.7175 | 9.09 | 15.2338 |
| Autumn | IMERGERUncal | 0.5084 | −53.28 | 12.1351 |
| IMERGFRUncal | 0.5358 | −51.88 | 11.8472 |
| IMERGFRCal | 0.5687 | −23.76 | 13.0305 |
| Winter | IMERGERUncal | 0.7248 | −20.85 | 6.9192 |
| IMERGFRUncal | 0.7309 | −19.38 | 6.8791 |
| IMERGFRCal | 0.745 | 11.84 | 8.6391 |
© 2019 by the authors. Licensee MDPI, Basel, Switzerland. This article is an open access article distributed under the terms and conditions of the Creative Commons Attribution (CC BY) license (http://creativecommons.org/licenses/by/4.0/).


