Article

Analysis of Greenhouse Gas Emissions in Centralized and Decentralized Water Reclamation with Resource Recovery Strategies in Leh Town, Ladakh, India, and Potential for Their Reduction in Context of the Water–Energy–Food Nexus

Chair of Urban Water Systems Engineering, Department of Civil, Geo and Environmental Engineering, Technical University of Munich, 80333 München, Germany
*
Author to whom correspondence should be addressed.
Water 2019, 11(5), 906; https://doi.org/10.3390/w11050906
Submission received: 2 February 2019 / Revised: 9 April 2019 / Accepted: 10 April 2019 / Published: 29 April 2019
(This article belongs to the Special Issue The Challenges of Water Management and Governance in Cities)

Abstract

:
With the constant increase of population and urbanization worldwide, stress on water, energy, and food resources is growing. Climate change constitutes a source of vulnerability, raising the importance of implementing actions to mitigate it. Within this, the water and wastewater sector represents an important source of greenhouse gas (GHG) emissions, during both the construction and operation phase. The scope of this study is to analyze the GHG emissions from the current and future water supply scheme, as well as to draw a comparison between possible water reclamation with resource recovery scenarios in the town Leh in India: a centralized scheme, a partly centralized combined with a decentralized scheme, and a household level approach. Precise values of emission factors, based on the IPCC Guidelines for National Greenhouse Gas Inventories, previous studies, and Ecoinvent database, have been adopted to quantify the different emissions. Potential sources of reduction of GHG emissions through sludge and biogas utilization have been identified and quantified to seize their ability to mitigate the carbon footprint of the water and wastewater sector. The results show that the future water supply scheme will lead to a significant increase of the GHG emissions during its operation. Further, it is shown that decentralizing wastewater management in Leh town has the least carbon footprint during both construction and operation phases. These results have implications for cities worldwide.

1. Introduction

Today, more than half of the world’s population lives in urban areas, and by 2050, 66% of the world’s population is projected to be urban [1]. Apart from being the centers of demographic growth, cities and urbanized regions are considered to be centers of economic activity and increased consumption of resources. It has been reported that a global “business as usual” scenario will lead to an increase of 30–50% of water, energy, and food demand by the year 2030 [2]. As a consequence, rapid urbanization requires a rigid integrated approach able to foster urgent synergies between sectors to limit adverse consequences of urbanization, mitigate trade-offs, and ensure sustainable urban development [3].
In light of the dialogues within the international community, many regional and local governments are committed to addressing global challenges through the Sustainable Development Goals (SDGs) defined by the United Nations (UN), such as ensuring equitable drinking water and adequate sanitation to all (SDG 6), achieving sustainable food production and resilient agricultural practices (SDG 2), reaching universal access to affordable and clean energy (SDG 7), as well as strengthening resilient and adaptive capacities to climate related disasters worldwide (SDG 13). However, this support started before the support of the SDGs in the framework of the 2030 Agenda For Sustainable Development—many countries have supported the UN global Agenda 21, 1991 [4], the Habitat Agenda, 1997, the establishment of the Cities Alliance, 1999, and the New Urban Agenda, which was adopted during the UN Conference on Housing and Sustainable Urban Development (Habitat III) in Quito, Ecuador, in 2016. The water sector was a core theme of this last conference, which promoted “the conservation and sustainable use of water by rehabilitating water resources within the urban, peri-urban, and rural areas, reducing and treating wastewater” [5].
The importance of the current challenges accompanying rapid urbanization are understood and supported in the international development agendas. Nevertheless, cities and urbanized areas should also be recognized as being sources of solutions to, rather than only the cause of, these challenges. If an urban area is well-managed and well-planned, urbanization could be a powerful tool for sustainable development for both developing and developed countries.
The Urban Water–Energy–Food (WEF) Nexus approach [6] responds to the urgent need for policies and implementation mechanisms, which are equipped with an approach to counter “silo-thinking” in vital urban sectors. This approach addresses the crucial metropolitan sectors of Water, Energy, and Food (WEF), to reach a more efficient and effective use of resource cycles in urban and peri-urban areas. A key factor for the success of the Urban WEF Nexus approach is its methodology for both vertically- and horizontally-integrated governance, and building upon existing urban development strategies for enhanced coordination. In doing so, the Urban WEF Nexus offers customized solutions to sustainably govern rural-urban linkages and resource interdependencies through comprehensive spatial perspectives. It provides salient future-oriented solutions in the context of the Habitat III debate, as well as for the shaping of the New Urban Agenda.

1.1. Water Reclamation with Resource Recovery as Key Nexus Potential

As mentioned previously, the water and wastewater sector will be facing important challenges in the future, due to the increase of population and resulting increase of water demand. Further, water pollution is becoming an important issue, which could partly be due to the unsafe handling of wastewater, resulting in a higher incidence of waterborne diseases [7]. Another further source of vulnerability is climate change, as the observed effects already show water availability declination, shifts in precipitation patterns, as well as the deterioration of water quality [8]. This puts an extra adaptation burden on water and wastewater utilities against predicted climate change impacts.
At the same time, ensuring safe drinking water and safe wastewater treatment and disposal also contribute to greenhouse gas (GHG) emissions, since the different water utilities, which are the companies or institutions responsible for managing water and wastewater, are particularly energy intensive [9]. Water losses can imply even higher energy consumption, and methane or nitrous oxide emissions from wastewater treatment plants can increase the carbon footprint of the water sector [10].
Energy consumption, which is necessary at different levels in the water and wastewater sector, is witnessing an increasing demand, since the water supplied and wastewater to be treated is increasing. That increase implies a simultaneous increase in the GHG emissions, contrary to their aims of having a smaller carbon footprint. Some studies demonstrate the important share of GHG emissions in the water sector. For instance, the GHG emissions from the water sector in the United States (U.S.) has a percentage of 5% of total GHG emissions of the country, in comparison to a higher value in the United Kingdom (U.K.), due to end uses of water in heating [11]. In 2015, the share of GHG emissions from wastewater treatment and discharge in both the United Kingdom and United States was around 0.3% [12].
By drawing special attention to the synergies between climate change mitigation and adaptation measures, especially in the water sector, an integrated approach may support the effective action of cities on climate change and the implementation of the SDGs. The opportunities that this sector offers are multiple in terms of recovery of water, energy, nutrients, and other materials from the water reclamation with resource recovery. Investing in more efficient technologies can lead the water utilities to decrease their need and expenses related to energy use, as well as improve the carbon balance of water and wastewater companies and contribute to climate change mitigation. This is important in developing economies, which are developing urban infrastructure systems, as well as developed economies, where infrastructure systems are very water- and-energy intensive and may need modifications in view of future climate change challenges.
In this paper, we discuss carbon footprint analysis for the developing economy context of India. Centralized and decentralized water reclamation with resource recovery strategies were compared using the case study of Leh Town, Ladakh, India, and highlight potential for greenhouse gas emission reductions in context of the WEF Nexus.

1.2. GHG Emissions in India

The Intergovernmental Panel on Climate Change (IPCC) was created in 1988 by the World Meteorological Organization (WMO) and the United Nations Environment Program (UNEP), to allow assessments on all aspects of climate change and its impacts and propose realistic strategies for response. The scientific proof brought by the IPCC Assessment Report of 1990 [13] played a decisive role in the creation of the United Nations Framework Convention for Climate Change (UNFCCC), which is considered to be the key international treaty to mitigate global warming and adapt to the outcomes of climate change.
UNFCCC divides countries into three main groups. Annex I Parties to the Convention mainly includes industrialized countries that are members of the Organization for Economic Co-operation and Development (OECD), plus countries with economies in transition (EIT parties), such as the Russian Federation, the Baltic States, and several Central and Eastern European States. Annex II Parties consist of the OECD members of Annex I, but not the EIT Parties. These are required to provide financial resources to support developing countries to undertake measures against climate change. Finally, Non-Annex I parties are mainly developing countries [14].
In accordance with Articles 4 and 12 of the Convention and the relevant decisions of the Conference of the Parties (COP), Annex I parties are required to submit yearly to the UNFCCC secretariat national GHG inventories of anthropogenic emissions by sources and removals by sinks of GHG not under control by the Montreal Protocol: this is an international treaty that entered into force in 1989, and is designed to protect the ozone layer by eliminating the production of different substances that are responsible for ozone depletion [15]. These inventories are subject to an annual technical review process. In addition, these parties submit information on the implementation of the Convention, counting national activities to mitigate and adapt to climate change [16]. All non-Annex I Parties are also required to submit a national inventory of emissions by sources, to the extent its capacities permit.
The IPCC provides practical guidelines for countries to prepare GHG inventories. The 2006 IPCC Guidelines for National Greenhouse Gas Inventories includes the reporting methodology of emissions from the sectors of Energy, Industrial Processes and Product Use, Agriculture, Forestry and Other Land Use, Waste, and others. According to India’s inventory on GHG emissions [17], the wastewater handling percentage increased from 47.4% in 1994 to 78.5% in 2010 of the GHG emissions of the waste sector, which had a share of 2% in 1994 and 4% in 2010 of the total GHG emissions of the country. In comparison, Germany demonstrates a stable value of GHG emissions from the wastewater treatment and discharge sector, with 9% in 1990 in comparison to 10% in 2015. The high percentage of GHG emissions from the wastewater sector in India proves the importance of developing studies targeting the wastewater sector, in order to identify sources of GHG emissions and potential for climate change mitigation.
This paper hypothesizes that in the context of a city in a developing economy, where existing water infrastructures are inadequate to meet basic needs and services, implementing a decentralized approach for wastewater treatment leads to less GHG emissions than a centralized wastewater treatment strategy. The study uses the town of Leh in India as a case study and hypothesizes that this analysis can lead to propose future opportunities of energy, water, and GHG saving potentials. The objectives of the study in Leh are to undertake the following:
  • Study the current and planned wastewater management;
  • Investigate and analyze different scenarios of possible water reclamation with resource recovery;
  • Propose opportunities of improvement that can lead to energy, water, and GHG emission saving potential in the water and wastewater sector.

1.3. State-of-the-Art on GHG Emissions Estimation in the Wastewater Sector

The ongoing global warming trend is strongly related to the ongoing emissions of CO2 and other GHG to the atmosphere, such as Nitrous Oxide (N2O) and Methane (CH4) [18]. The Global Warming Potential (GWP) is the index widely being used to compare the greenhouse effect of different gases. CO2 has, by definition, a GWP of 1 [19]. CH4 contributes significantly to the greenhouse effect. Its effect has a considerable lifespan of 12 years and a GWP of around 34 times higher than CO2 [20]. This potent gas is responsible for 20% of anticipated warming. Similarly, and due to increasing human activities and their impact on the global environment, N2O is increasing in the atmosphere at a rate of around 0.3% per year. With a GWP of 298 CO2-equivalent over a 100-year time horizon and a lifetime of 120 years, N2O is responsible for 6% of anticipated warming [21].
Water and wastewater management is facing different challenges in the coming years, as the energy use in the water sector is growing [11]. An important source of GHG is the electricity used, which depends on the process of production (from renewable sources or burning of fossil fuels). Depending on the energy mix of the country, electricity production can emit a more or less important amount of CO2. India’s electricity emissions increased from 901.7 g CO2/kWh in 2005 to 926 g CO2/kWh in 2012, which are values higher than the global averages [22]. A reason for that is the dependence of India on its large coal reserves for energy production and electricity generation. [23] proposes three impact categories, namely embodied energy, carbon footprint, and eutrophication potential, and key contributors to these environmental impact categories, to assess the environmental sustainability of wastewater treatment plants (WWTPs) during construction and operation [23].
The IPCC (2006) suggested a method to calculate GHG from wastewater treatment while stressing the importance of choosing country specific data, when available, and default values in the opposite case. [24] developed an energy consumption model to quantify the energy consumption and the relative GHG emissions from sewage sludge treatment processes, while taking into account the data from sewage sludge treatment plants in Osaka, Japan. Other studies use life cycle assessment methods for this aim. However, no general calculation method, besides the one developed by the IPCC, has yet been set up to compute the GHG emissions from the wastewater sector. Generally there is a lack of a proper and generalized methodology to study the interlinkages between water and energy use and intensity and GHG emissions in the wastewater sector, which poses a hindrance in comparing different water infrastructure systems across various regions [25]. This study aims to address this research gap.
Emissions can be distinguished into those occurring during the construction phase and the ones resulting during the operation. For the purposes of this paper, they are differentiated as follows into sources of methane (CH4) and nitrous oxide (N2O) emissions.

1.3.1. Sources of CH4 Emissions

The common sources of CH4 emissions in wastewater management are from sewers and from WWTPs. CH4 emissions from sewers occur during conversion of organic carbon by methanogenic archaea, which are microorganisms that can reduce CO2 with H2 to CH4 under anaerobic conditions, released to the atmosphere through manholes and atmospheric discharge points. Both the CH4 emissions from gravity [26] and pressurized sewers [27] have been studied. However, the latter is considered to have a higher risk of production, because no air/water interface to diffuse oxygen into the liquid phase and promote aerobic conditions is present. In general, unless air or oxygen is used to control sulphide, anaerobic conditions are typically the predominant ones. Hence, sewers are optimal conditions for methanogenesis. Even if the IPCC, 2006, indicates that closed underground sewers, which are predominant in urban water infrastructure, do not imply important CH4 emissions, studies have shown the contrary. [27] relate that the sewage CH4 can contribute to an extra share ranging between 12–100% of GHG emissions to the ones from a WWTP. However, conventional methods for estimating these emissions are lacking. [27] also demonstrate a strong positive correlation between methane and sulphide production. The longer the sewers, the more production of methane and sulphide [27].
CH4 produced in WWTP is approximated to 0.85% of the influent COD [20]. While [28] reveal a CH4 percentage of 75% as CO2 equivalent (CO2 eq) in the total GHG emissions from wastewater management, [29] find that the proportion of CH4 generation can constitute 12% of the total GHG emissions of the WWTP, three-quarters of which was found to be from the anaerobic digestion of the primary and secondary sludge. CH4 sources from WWTP could include:
  • Dissolved CH4 that is produced and transported from the collection system and that is then stripped a the WWTP headworks or in the aerobic reactors;
  • Dissolved CH4 that is produced from anaerobic digestion and is left in the reject water that is recycled to the aerobic tanks, where a fraction of the dissolved CH4 is ultimately stripped;
  • CH4 gas produced in anaerobic digestion that escapes via gas piping leaks;
  • CH4 gas produced in anaerobic digestion that is not fully combusted in cogeneration [30] or thermally destructed by flaring;
  • CH4 gas escaping from digested sludge storage facilities [29]; and
  • Anaerobic lagoon treatment systems.

1.3.2. Sources of N2O Emissions

The N2O emissions can occur from different sources. N2O emissions from sewers: [31] tried to fill in this gap knowledge by providing a presumptive emission factor for gravity sewage systems around 1.4–1.8 g N2O person−1 year−1. N2O emissions can also emanate from biological wastewater treatment. The proportion of N2O contribution to a WWTP’s total GHG emissions has been estimated to account for 78% [29]. During biological wastewater treatment, N2O emissions can be the result of processes, including nitrification and denitrification through the following pathways [32]: (1) Autotrophic nitrification: (NH2OH) oxidation in the conversion of ammonia (NH3) to nitrite (NO2) and during the reduction of nitric oxide (NO) produced through ammonia oxidizing bacteria (AOB) denitrification; and (2) heterotrophic denitrification during the oxidation of nitrate NO3- to N2. IPCC includes a default emission factor for N2O from wastewater treatment, which only takes into consideration the population, despite the various studies directly linking the N2O emissions and the operational conditions of the wastewater treatment plant [33]. They should be accounted in the optimization strategies of GHG emission minimization. N2O emissions from effluent discharge in receiving waters: N2O can also be indirectly emitted from the conversion of the nitrogen in the effluent of a WWTP by nitrifying and denitrifying bacteria, depending on the nitrogen removal in the treatment plant [20].

1.3.3. Other CO2, CH4, and N2O Emissions

Aside from CO2, CH4, and N2O emissions from biological conversions, other sources of these emissions can include: (1) Onsite stationary fossil fuel combustion sources, which encompass engine generators, pumping equipment and driving processes at water treatment and pumping facilities; (2) electricity use; and (3) sludge disposal off-site due to vehicle fuel consumption for transport.

1.4. Water Reclamation with Resource Recovery

With the aim of reducing energy and costs, decreasing the stress on natural resources, and achieving a more circular economy, recovering resources from treated wastewater can be helpful. Water reuse practices over the world have proved that resource recovery is far beyond just a matter of technology. The products of this process have to meet some requirements, such as the ability to be sold and to fit to the purpose of the usage [34]. The recovery of resources from wastewater can be categorized into three main groups: water, energy, and nutrients, which are described in the following in detail.

1.4.1. Water

Reclaimed water is defined as the effluent from a WWTP, which has undergone a set of physical, chemical, and biological treatments to remove suspended solids, dissolved solids, pathogens, organic substance, nutrients, and metals [35]. It can be exploited for different purposes. Agricultural irrigation is the most common water reuse [36]. In the urban water use context, many successful pilot projects all over the world have implemented water reclamation and water reuse. In the industrial sector, reclaimed water can be used for cooling. Groundwater recharge and potable reuse have also received much interest [37].
In order to achieve the quality standards of the treated water for reuse, microbial and chemical contaminants can be removed by combinations of advanced oxidation processes, activated carbon and biofiltration, or integrated membranes, such as ultrafiltration followed by reverse osmosis [37].
Water and energy interaction are an important component to consider in designing reuse schemes. Decentralized reclamation can, in fact, reduce the energy needed for pumping reclaimed water over a long distance and tailor water qualities to the identified purposes [38].
The need for water reclamation in India is recognized through political frameworks. However, detailed treatment standards and types of water reuse applications have not been developed yet. The Ministry of Urban Development has addressed the issues in several advisories in recent years for recycling and reuse of wastewater. However, it was not until the last revision and update of the Manual on Sewerage and Sewage Treatment Systems [39] that guidelines were specified for the water quality for the treated water based on its intended reuse [40]. CPHEEO defines quality parameters for the non-potable water reuse in India. Different standards are defined for water reuse for toilet flushing, fire protection, vehicle washing, non-contact storage, horticulture, and golf courses [39].

1.4.2. Energy

Energy plays an important role in resource recovery, since electricity is used for the treatment of wastewater and it can also be recovered from the treatment process. Similarly, heat can also be recovered and used on site. It can sometimes exceed the energy needs of the plant. Hence, the discussions about energy use in the treatment processes are now moving from achieving energy efficiency to achieving energy neutrality or realizing a production which surpasses energy demand [34].
Meda et al., [41] state that the used water counts different forms of energy: potential energy, chemically-bound energy, and thermal energy. The two most important energy recovery paths from the water reclamation process are [34] anaerobic digestion and heat recovery–anaerobic digestion (AD) of the sludge, which can be burnt in a cogeneration unit. The resulting heat and electricity can be utilized for specific needs of the plant. AD typically converts the readily biodegradable portion of the solids. This portion can be enhanced through pre-treatment and co-digestion. The first opens the cells of the bacteria in the activated sludge, which allows for the release of the contents of the cells and makes them available to the anaerobic bacteria for conversion to biogas. Thermal hydrolysis, sonication, mechanical disintegration, and electrical pulse treatment are all technologies used in the pre-treatment of sludge. Co-digestion, on the other hand, is based on the addition of readily biodegradable feedstock, such as fats, oils, and grease, which can be locally collected, to the digester. These are afterwards co-digested with the sludge, increasing the biogas yield. In terms of heat recovery, [42] state that recovered heat from used water treatment plants can be used either for district heating, sludge drying, or thermophilic heating. While the implementation of these options depends greatly on the current price of carbon; district heating is considered to be the most promising in terms of carbon reduction potential [42]. Thermal energy can be concentrated using heat pumps, which can be characterized by different thermal capacities, to be used on-site in the process or off-site [43]. Other energy recovery paths include microbial fuel cells, a technology that uses bacteria as the catalysts to ensure the oxidation of organic and inorganic matter and generate a current.

1.4.3. Nutrients

The isolated management of the WEF resources has caused unsustainable and open nutrient loops. Synthetic fertilizers are produced from finite resources and energy intensive processes to ensure the bioavailable nutrients for agricultural soils. Following fertilizer production and food consumption, humans concentrate these nutrients in wastewater. However, in place of being reused and recycled, effluent of WWTPs is regularly discharged to freshwater sources, contributing simultaneously to eutrophication [44]. Therefore, WWTPs should be seen as reliable sources of nutrients and water used for agriculture through irrigation.
Phosphorus use is primarily recurrent in agricultural fertilizers. Almost 83% of the world’s reserves are concentrated in Morocco, China, South Africa, and the United States [45]. Although phosphorus production is predicted to enter a long decline once it reaches its peak in 2033, its consumption level is predicted to be increasing [46]. Nitrogen is another important component used in agriculture. Its production is energy intensive and produces consequent GHG emissions [47].
These nutrients can be recovered from raw wastewater sources, semi-treated wastewater effluents, and biosolids from treatment byproducts. The latter can be applied to the land after treatment, leading to soil conditioning and synthetic fertilizer use reduction. The most important concerns of this recovery path are mainly health and safety issues, as well as odor and public acceptance [48]. Urine separation is another possible path of recovery that ensures nutrient loads of WWTPs are reduced significantly. This maximizes nutrient recovery from wastewater, as up to 80% of nitrogen and 50% of phosphorous of domestic water are contained in urine [49]. The major challenge relative to this technology is the requirement of intensive support and engagement from local communities, which is sometimes difficult to handle [50]. Other uncommon methods for resource recovery include controlled struvite crystallization, which is based on extracting struvite from sludge digester liquors because of its high concentrations of phosphorus, ammonium, and magnesium. This path can be economically feasible, however it can block valves, pumps, and pipes [51].

1.5. Decentralized Water Reclamation with Resource Recovery

Centralized wastewater management strategies face many different challenges to cover the needs of communities in terms of collecting and safely managing the generated wastewater, especially in low-income countries [52]. They are very water and energy intensive and either do not function well, or at all, with reduced availability of water and energy. They are also very capital intensive. As an alternative, decentralized water reclamation with resource recovery can contribute to reducing drinking water consumption, and is more cost-efficient than centralized systems [53], especially in less dense areas [54].
A decentralized approach for water reclamation with resource recovery offers many opportunities, including water reuse. Decentralized systems are defined as the collection, treatment, and distribution of water and wastewater near the point of use or generation [55]. They are more likely to reduce collection transport distances and use a smaller piping system installed at a shallower depth [56], all of which leads hypothetically to less use of energy and construction material, simultaneously reducing the relative GHG emissions in comparison to a centralized approach. In this section, different decentralized water reclamation with resource recovery options alongside potential GHG emissions are discussed.
“Decentralized Wastewater Treatment Systems” (DEWATS) refers to a modular systems approach, which provides treatment for wastewater flows ranging from 1 m3 and 1000 m3 per day per unit. They can also offer the possibility of achieving energy recovery for cooking, lighting, or power generation. These systems include 4 steps, encompassing the sedimentation, the anaerobic digestion, the aerobic and facultative decomposition, and the post treatment [57].

1.5.1. Constructed Wetlands

Constructed wetlands (CW) systems are systems that are designed and built to utilize the natural process for wastewater treatment, in addition to multiple ecosystem services (flood control, climate regulation, supporting biological diversity, and others [58,59]. This technology is able to treat to a good quality domestic, industrial, and municipal wastewater, storm water, and agricultural land runoff, as well as landfill leachate [60]. There are two types of CWs: Free Water Surface (FWS) or Subsurface Flow (SF). From this latter, Vertical Subsurface Flow CWs (VSSF) and Horizontal Subsurface Flow CWs (HSSF) can be distinguished. Due to the different removal efficiencies of these types of treatment, they are usually combined. A common design consists of two steps [58]:
  • Several VSSF beds to remove organics and suspended solids and ensure nitrification; and
  • Two or three HSSF beds to ensure denitrification and the further removal of organic and suspended solids. The pre-treatment step is necessary before the CW to avoid clogging, which is an obstruction of the free pore spaces due to the accumulation of solids. Conventional treatment settling time requires a retention time extended up to 4 h [61].

1.5.2. Fecal Sludge Management

Fecal sludge (FS) includes all liquid and semi-liquid components of pit and vaults, which accumulate in on-site sanitation installations [62]. These latter are systems of sanitation within the immediate surroundings of the occupier, such as septic tanks, private latrines or toilets, and aqua privies. In some cases, the Fecal Sludge Management (FSM) can be conducted on site and by extended in-pit consolidation and storage. In other cases, such as septic tanks, single pit, or vault installation, the sludge has to be collected and treated off site [63]. FS is known to be more concentrated in suspended and dissolved solids. It can be treated in a separate system, such as a waste stabilization pond, aerated pond, upflow anaerobic sludge blanket, activated sludge reactor, anaerobic biogas reactor [62], or co-treated with the sludge produced from a WWTP. It can constitute undigested or partially digested slurry or solids resulting from storage or treatment of blackwater or excreta. FSM encounter many challenges in terms of (1) sludge collection due to cost intensive mechanized vehicles and narrow streets, (2) health hazard for handlers and the public nearby in case of traditional and uncontrolled FSM, and (3) potential lack of treatment facilities, which leads to environmental damage. FSM involves the activities of collection, treatment, and reuse or storage.

2. Case Study Area Leh Town, Ladakh, and Basis for GHG Emission

Leh town, located on the banks of the upper Indus River, is the capital of the Ladakh district in the most northern Indian state, Jammu and Kashmir. Being in the Indian Himalayas, Ladakh is characterized by a cold high-altitude desert with precipitation averaging around 61 mm/annum, occurring in the format of both rain and snow [64].
Ladakh’s valley is weighted down with well-maintained latera and terminal moraines. Therefore, in the event the melting of the glacier or during rain, water drains in the valley and is considered a primordial source of drinking water and irrigation water. Groundwater is available as an unconfinement condition in the deposits of gravel mixed with salt and sand material. However, groundwater is facing high risk of contamination due inefficient or absent wastewater disposal strategies [65].
A cold arid climate characterizes the desert of Ladakh. Severe cold is typical during dry winters, whereas during summer, moderate hot and dry weather distinguishes the climate in Leh. The temperature can drop to −40 °C during winter and escalate to 35 °C during the summer season [66], with an annual daily average of 7.3 °C. A slight but noticeable warming trend has been signaled over the years while analyzing temperature datasets. This development was accompanied during the last decades by an inverse relationship regarding the precipitations patterns. The change in climatic pattern is predicted to have an important impact on the ecology, vegetation, the hydrology, as well as the human activities, such as agriculture [67].
Leh town is divided into 21 administrative wards and is classified as a Class III Urban Agglomeration and has a Nagar Panchayat or a Notified Area Council (NAC), which is an urban political unit in India comparable to a municipality. The population as per the Indian census increased from 28,639 in 2001 to 30,870 in 2011, resulting in a growth rate of 7.8%. In addition to the permanent resident population, a significant number of floating population exists. The tourism industry and army forces are the two main reasons for the latter, which is constituted of migrant laborers, who are mainly present in the short summer seasons from June to September [64].
Historically, agriculture has been an important part of the economy of the Ladakh region. Trading dairy, wool, and pashmina goat fiber, as well as farming barley and wheat, has been sufficient for subsistence for about 8800 years for the local communities [68]. The economy in Leh has, however, gradually shifted during the last decades. The opening to tourism in 1974 has generated many job opportunities and contributed to 50% of the region’s Gross Domestic Product (GDP) as of 2010 [69]. The number of tourists has drastically increased by almost 280% from 2007 to 2017 [70]. This number is highly fluctuant yearly and seasonally, as tourists are mainly present during the summer, which almost matches the agricultural activity of the area [68].
To ensure the water supply to Leh town inhabitants, significant amounts of energy are being used to pump water from groundwater aquifers to the city. Water is for instance extracted from the Indus River Aquifer and is pumped over 300 m in vertical distance upwards and several kilometers horizontally to be stored in reservoirs, and later distributed by gravity in Leh town [71].
Due to the remote location of Leh town, it is, similarly to the whole Ladakh region, not connected to the Indian grid. Currently, the Ladakh region is supplied power from diesel generators (about 12 MW) of the army and paramilitary forces and micro hydroelectricity units (about 14 MW). Therefore, a large amount of diesel is still being used for supplying Leh-Ladakh’s daily energy demands. This amount is estimated currently at 8000 L of diesel a day to cover the power needs of Ladakh [72]. The used fuel is imported from the outside, which outweighs both the expenses of the region, and the resulting GHG emissions from fuel combustion. In fact, on a regional level, Ladakh’s power requirement is increasing by an annual rate of 7%. [72] predicts this to be around 140.5 MW by 2025.
The increasing energy demand has led the authorities to build a hydro power plant, Nimoo Bazgo Hydroelectric Plant, commissioned in 2014 with a capacity of 45 MW. Leh town is facing repeated power cuts despite this. Solar radiation is one of the most abundant energy resources in Ladakh, at around 7–7.5 kWh m−2 day−1. This causes higher than the average irradiance on horizontal surfaces in India (5.6 kWh m−2 day−1) [72]. In Leh, the solar radiation available is of the same order (5.54 kWh m−2 day−1). Currently the full potential of this resource is yet to be exploited and can constitute a suitable off-grid and household scale technology [73]. Direct applications can be to:
  • Lift the irrigation water from Indus river tributaries;
  • Distribute drinking water to remote areas;
  • Ensure heating and hot water for buildings.
A further resource for energy is the geothermal energy. [74] stress the existence of geothermal resource potential at suitable depths, which in the Ladakh region can be explored and developed.
Due to the lack of information for the GHG emissions inventory at a region or a town level, emissions from the state Jammu and Kashmir are related to in the following. The 2013–2014 Emissions Inventory of CO2 reports emission in in Jammu and Kashmir as 0.68% of India’s annual emissions [75], where the most important emitting sector is the energy sector, and the least is the waste sector.

2.1. Wastewater Management Situation in Leh

A sanitation system can be defined as to be able “to protect and promote human health by providing a clean environment and breaking the cycle of disease” [76] highlights the importance that these systems are sustainable: economically viable, accepted in the society, and suitable technically and institutionally.
The World Health Organization (WHO)/United Nations Children’s Fund (UNICEF)’s Joint Monitoring Programme (JMP) for water supply, sanitation, and hygiene, allows one to access open source country specific data online [77]. It shows the evolution of access to sanitation between 2000 and 2015 in the rural and urban areas of India, analyzed by the service level provided. The trend shows an overall increase of access to sanitation through use of improved latrines, septic tanks, and sewer systems. Septic tanks are the most used type of sanitation in rural and urban areas, whereas improved latrine coverage has declined in urban areas. JMP also enables benchmarking and comparison of the sanitation service levels across countries. In order to reach safely managed sanitation service (SDG 6.2), improved sanitation facilities should be ensured, so that the excreta produced is either [78]:
  • Treated and disposed in situ;
  • Stored temporarily and then emptied and transported to treatment off-site; or
  • Transported through a sewer with wastewater and then treated off-site.
On the other hand, the share open defecation has substantially decreased both on a rural and urban level in India from 2000 to 2015, with the increase of safely managed facilities or basic sanitation facilities. Open defecation is, however, still very recurrent in urban areas, with a share of over 50% in 2015.
According to [79], the access to sanitation in Leh is mainly based on “Ladakhi dry toilets”, a traditional form of pit toilets, with a percentage of 74%. Flush or pour toilets are the second most important sanitation type with a share of 14%. The number of toilets according to the 2011 census data is around 4000 for a population of 30,870. However, 4% of the households still are not equipped with private toilets and rely on open defecation or public toilets. Districts like Leh Ladakh, Kargil, Ramban, and Jammu, where more than 60% of the households are dependent upon on-site sanitation facilities, need priority interventions. Also, in extreme cold climates, the fecal sludge and septage tends to freeze inside the containments and the decomposition processes comes to a halt below 0 °C. Since the septage will not decompose, the volume inside the tank or pit will be higher and it becomes necessary to desludge septic tanks in cold areas, such as Leh and Kargil, where temperatures drop as low as −20 °C to −40 °C in winter nights [80].
Currently, Leh encounters a lack of wastewater management structure to manage the increasing wastewater amounts. Many houses in the town have soak pits and septic tanks that gather the wastewater. However, this infrastructure is poorly managed and rarely emptied. Therefore, it can be assumed that seepage occurs from these pits and tanks infiltrating and polluting the upper stretches of groundwater in Leh [71]. A higher density of septic tanks is more likely to increase the probability of pollution [81].
Overflowing septic tanks may cause leeching into the ground, and septic tanks or soak pits that are poorly designed can increase the risk of contamination of groundwater. The Municipal Committee of Leh (MCL) realized the need to improve the management of the septic tanks through yearly desludging, as well as building a fecal sludge treatment plant (FSTP) [82]. The FSTP was designed by BORDA and CDD society and realized by MCL and the Blue Water Company. It targets the hotels that would not be connected to the proposed centralized treatment plant in Leh. The collection of the sewage is through a vacuum truck, which runs depending on clients need. The FSTP of Leh, which was inaugurated in August 2017, is a DEWATS solution that is based on the Planted Drying Bed Technology. It has a capacity of 12 m3/day within a built up area of 60 m2/m3. The FSTP must run optimally in Leh’s extreme climatic conditions, especially during the cold winter temperatures and low sludge inflow [82]. The collected sludge, after passing through a screen chamber, flows by gravity to one of the 10 Planted Drying Beds. Here, the solid and liquid separation occurs and the digestion of a fraction of the solids is completed. The treated liquid is then directed to one of the two Horizontal Planted Gravel Filters. The final step is disinfection, where the water is places in a Polishing Pond. The sludge retained in the first drying bed accumulates and is dried. Once it reaches 0.9 m it can be removed and used as an organic soil conditioner.
The authorities in Leh have also started the construction of a centralized sewerage system that will service around 50% of Leh town, with a WWTP planned near the banks of the River Indus. A consulting firm was commissioned in 2009 to design the sewage line, main pumping station, and the WWTP, with the aim to collect sewage, transport it to a treatment plant, treat it, and dispose it without causing any health and environmental problems. The treated water is to be reused for agricultural irrigation partially and the rest discharged to the River Indus. The technology chosen for the water treatment is the activated sludge followed by a settling tank [83]. However, no disinfection step, which is necessary for water reuse for agricultural irrigation, is planned in the project. The excess produced sludge is to be dried using vast drying beds with no further valorization.
The estimated population for the design of the centralized WWTP in Leh was based on computing the average of five population estimation methods, while taking the census data from 1921 to 2001 and using the arithmetic progression method, geometrical increase method, incremental increase method, state urban method, and the geometrical method [83]. However, this has led to an overestimation of the estimated population for the year 2001, at 35,496, in comparison to 30,870 stated in the last census [79].

2.2. Scope of This Paper

This study undertakes a comparative analysis of GHG emissions emitted from the operation of the water supply scheme and the potential scenarios of water reclamation with resource recovery strategies in the town of Leh, India, in order to identify potential pathways of GHG emissions reduction. The carbon footprint and emissions assessment constitute primordial fundamentals in low-carbon research [84]. However, the ubiquitous term “carbon footprint”, which is widely used, seems to not have a clear definition [85]. According to the Parliamentary Office of Science and Technology, 2006, calculating carbon footprint is summing up the total amount of CO2 and other greenhouse gases emitted during the life cycle of a process.
In this study, the total carbon footprint is the sum of individual GHGs, in which carbon dioxide (CO2), methane (CH4), and nitrous oxide (N2O), are expressed in CO2 equivalent (CO2 eq). The conversion of CH4 and N2O emissions to CO2 eq will be realized by using their GWP, according to [86]. The GHG emissions are estimated for the water scheme, and in the proposed future water reclamation with resource recovery schemes in Leh during an assessment period of one year. Measuring the carbon footprint takes into consideration the difference between the wastewater to be generated and handled during the winter and the summer.
The GHG emissions from the water supply scheme included in this study are those from the abstraction of the water, treatment of the water, and distribution of drinking water. The GHG emitted from the operation of the wastewater sector and accounted for in the context of this study are those from the collection, treatment, and discharge of the wastewater, and transport and sludge disposal when applicable.
The GHG emissions estimated are the ones from the current water supply scheme run by the Public Health Engineering Department (PHE), which is the governmental institution responsible for ensuring water supply and wastewater management of the town of Leh, during the assessment period of one year. The analysis will be based on previous research results of current and future fuel consumption related by [87]. The GHG emitted from the operation of the wastewater sector is evaluated from three proposed scenarios of future water reclamation with resource recovery schemes in Leh, which take into consideration the complete or partial coverage of the proposed sewage treatment plant, and which are described as follows:
Scenario 1: Water Reclamation with Resource Recovery through a Centralized WWTP
The final design of the centralized wastewater collection and treatment solution is aimed at the year 2040, with a design population that has been recognized to be overestimated [65,83]. As the available data about the running costs of the WWTP are related to the final design year of 2040, the GHG emissions will be computed for the design year and population in 2040 (sub-scenario 1). A more realistic population estimation will be calculated for the year 2040, alongside the relative GHG emissions (sub-scenario 2). For the two sub-scenarios, the population connected will be the estimated population living in households during the year, as well as the floating population during the summer.
Different methods of population estimation exist, which take into consideration various parameters of population growth, leading to different results [88]. In order to highlight a more realistic estimation of the design population related by [83], a new population estimation will be computed as the average of the arithmetic progression method, the geometrical increase method, the incremental increase method, the state urban method, and the geometrical method, while taking as reference the census years from 1921 to 2011. It is the same method proposed by Tetra Tech, however it converges.
Scenario 2: Partial Management of the Wastewater from the Areas that can be Connected to the WWTP, Combined with Decentralized Water Reclamation with Resource Recovery
This scenario supposes a more realistic approach, where only some parts of Leh will be serviced through the centralized scheme. The unconnected parts of the city are subdivided into pockets where wastewater is treated using a decentralized water reclamation solution. The chosen treatment technology is Subsurface CWs due to their economic, technical, and climatic appropriateness.
Scenario 3: Partial Water Reclamation with Resource Recovery from the Areas that can be Connected to the WWTP, Combined with Household Level Treatment Solutions
Similarly to scenario 2, only a part of the town is connected to the WWTP. The rest of the households are hypothetically equipped with a septic tank, which is desludged once a year. The fecal sludge is transported by vacuum trucks to an FSTP, where it is treated. Wastewater generation is assumed to be similar to scenario 2. The emissions from the connected area to the WWTP will be based on interpolating the population connected to the WWTP with the results of the WWTP’s designed population GHG emissions from scenario 1. The three scenarios are depicted in Figure 1 below.
It is supposed that 80% of the daily consumed water becomes wastewater. The water use is 135 L/day/capita for the part of Leh connected to the WWTP for scenario 1.84 L/day/HH and 76 L/day/tourist during the summer for scenarios 2 and 3, according to [89]. All the hotels and guesthouses are assumed to be full during the summer. The number of tourists is, hence, equal to the number of beds. The number of beds is taken from the results of a survey completed in 2015. Wastewater generation takes into account the permanent residents during the year, combined with the surplus wastewater production during the summer.

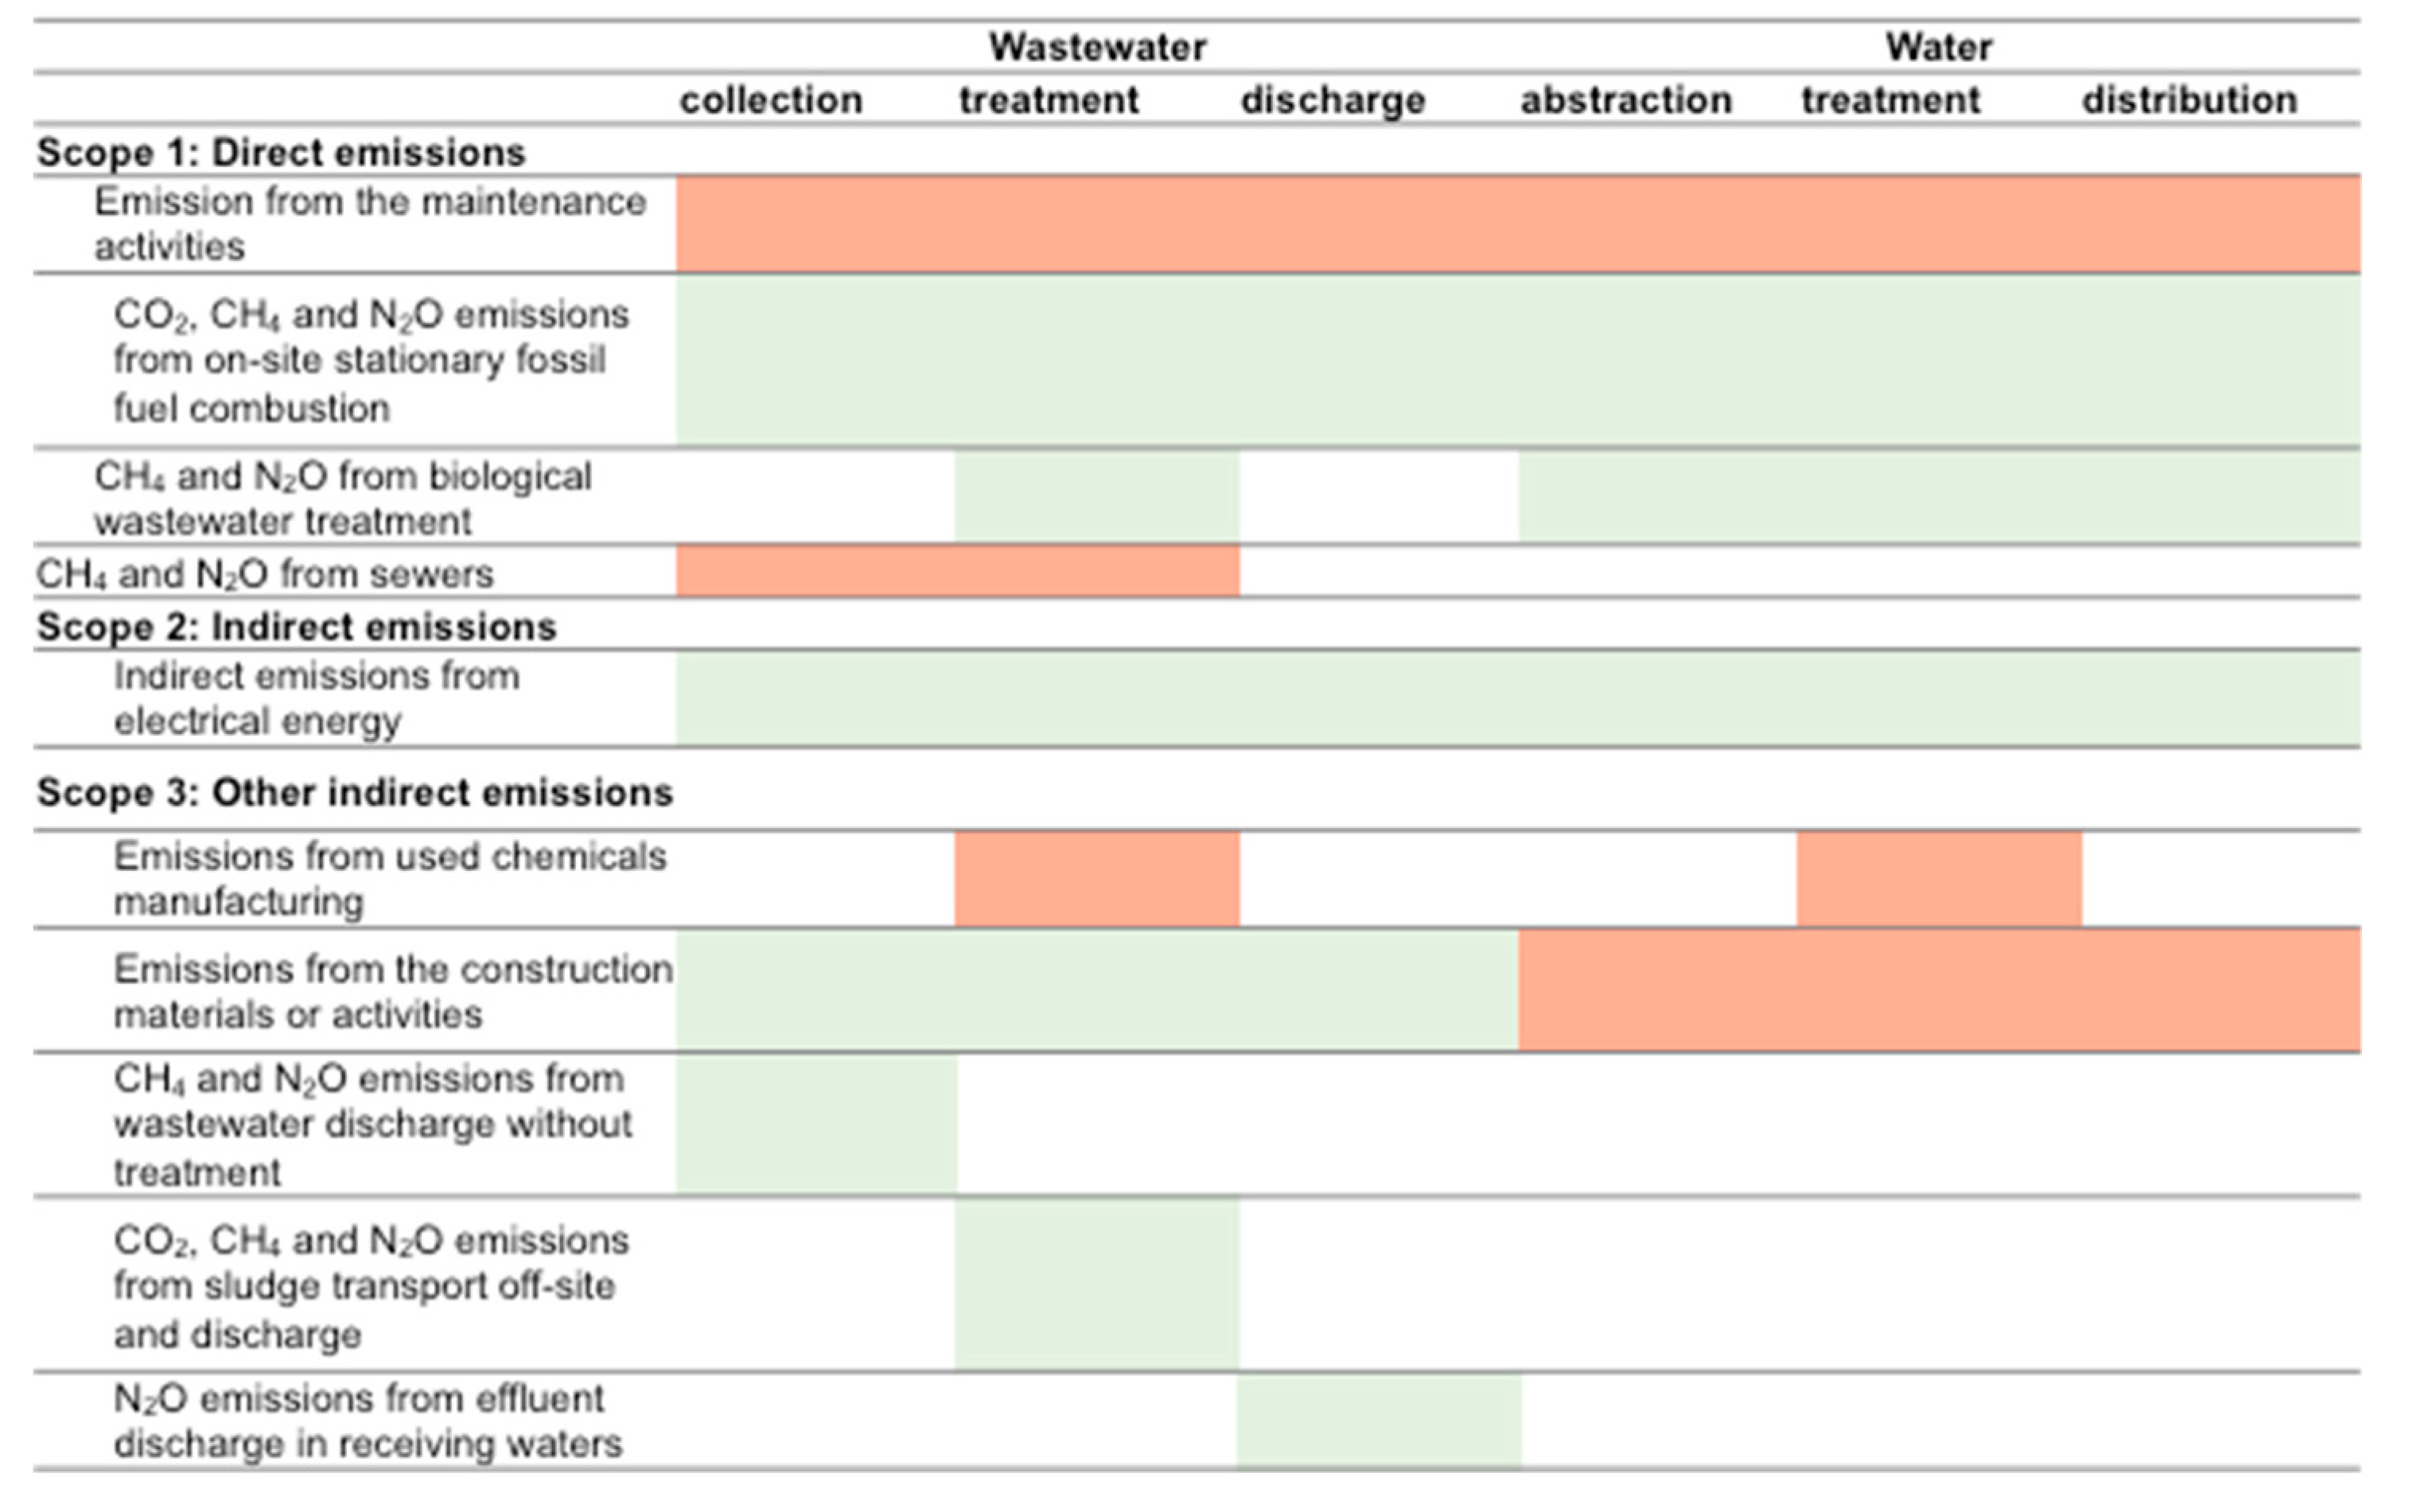
2.3. GHG Emissions Assessment

As seen above, different sources of GHG emissions can occur while ensuring drinking water supply or safely managing the wastewater. The GHG Protocol orders the different emissions in three categories or “scopes”, in order to avoid counting the emissions multiple times. Scope 1, or “Direct emissions”, are those from sources owned or under the control of the water utility. The second scope, also called “indirect emissions”, are the emissions from the consumption of electricity. The third scope encompasses “Other indirect emissions”, which are the product of the water utility’s activities [90]. Figure 2 includes the emissions in the wastewater sector comprised in the assessment, according to the scope. The ones assessed in the context of this study are highlighted in green, while those that exist, and which are not accounted for in this study, are highlighted in red.

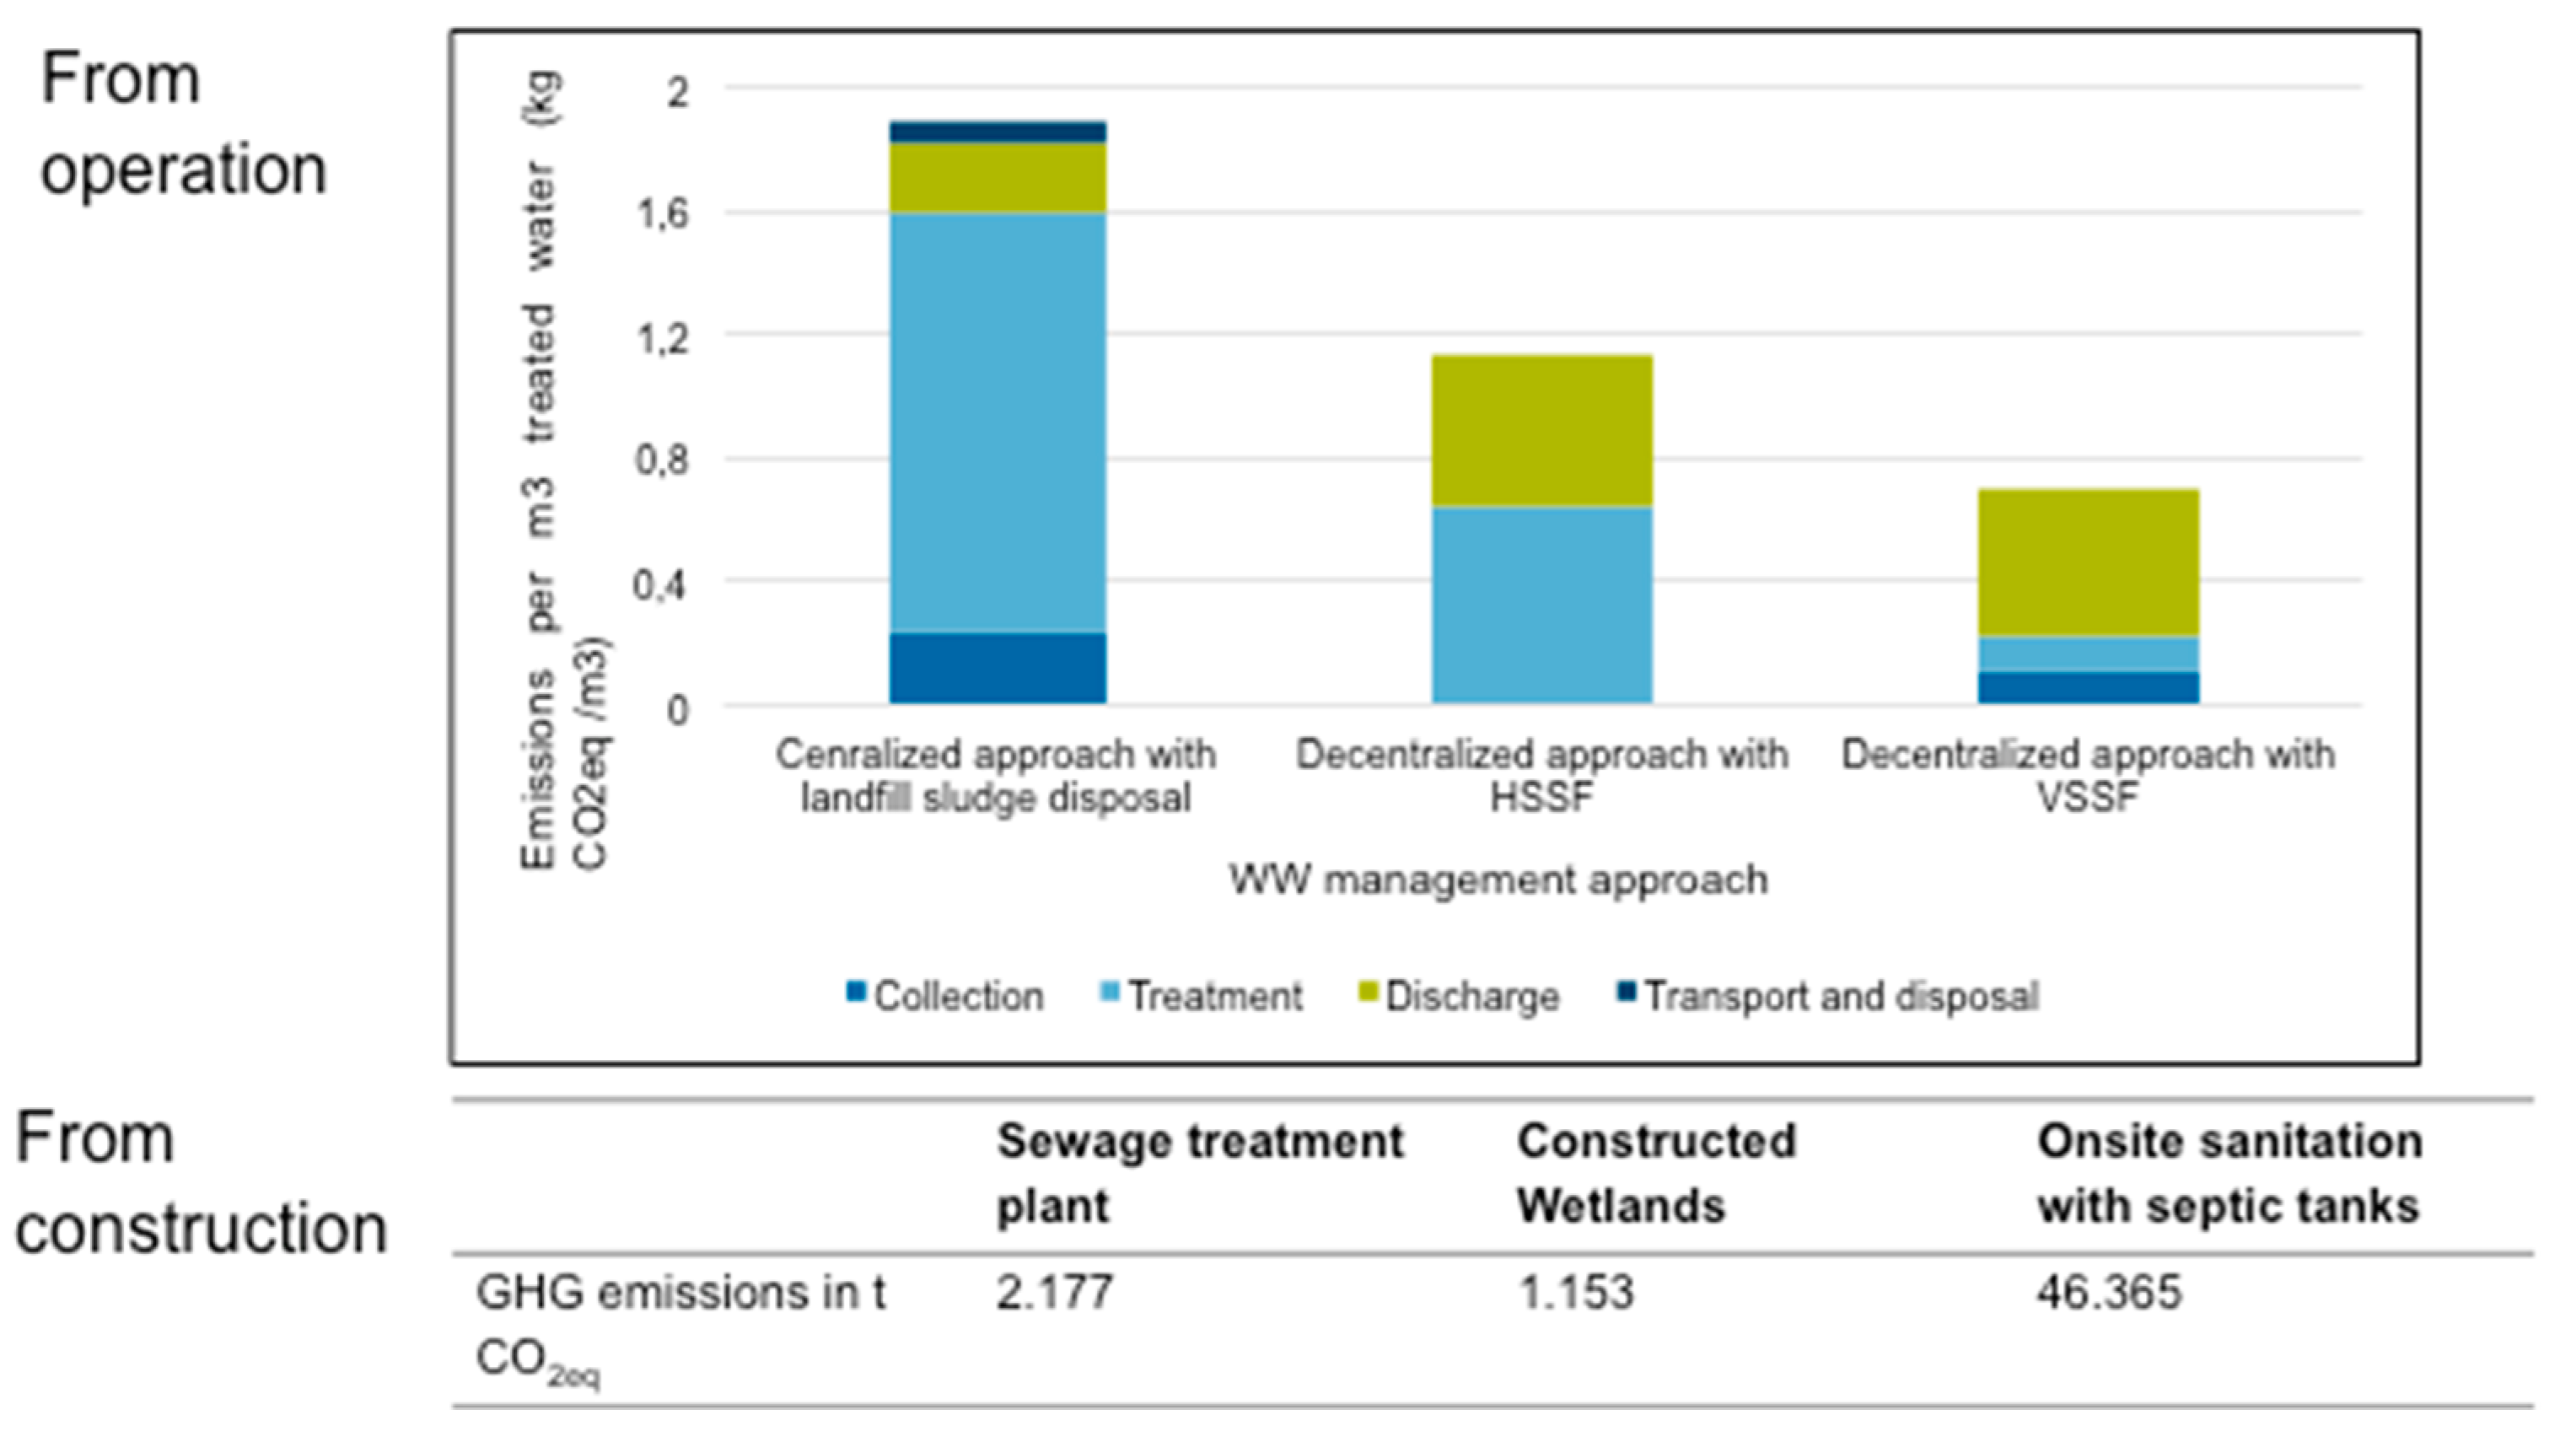
2.3.1. GHG Emissions from Operation of the Water Reclamation with Resource Recovery Scenarios

The overall methodology of the assessment is based on using emission factors, which quantify the emissions for every potent gas from their different sources of emission. This methodology is the same as used in the 2006 IPCC Guidelines for National Greenhouse Gas Inventories [20]. The chapter “Energy” will mainly be used for GHG emissions from electricity and fossil fuels usage during the collection, treatment, and discharge of the wastewater; or transport of sludge. Chapter 5 “Wastes” of the “2006 IPCC Guidelines for National Greenhouse Gas Inventories”, which includes wastewater treatment and discharge, used for the choice of emission factors of GHG emissions related to wastewater treatment and discharge in the WWTP, and the wastewater treatment in septic tanks. The emission factors from wastewater treatment in CWs are derived from [91,92].

2.3.2. GHG Emissions from Construction Works

In order to account for the carbon footprint from the construction works of the different scenarios, datasets from the Ecoinvent 3.3 database have been used [93]. The assessment from the construction phase mainly includes the carbon footprint from excavation using hydraulic diggers and the production of cement and concrete used. In order to analyze the emissions from Scenario 1 or the connected parts of Leh serviced by the WWTP in scenarios 2 and 3, the Energy Performance and Carbon Emissions Assessment and Monitoring (ECAM) tool was used [94]. The ECAM tool is an open access web-based tool, developed by the German International Development Agency (GIZ) project Water and Wastewater Companies for Climate Mitigation (WaCCliM). It enables water utilities to:
  • Assess the origin of their GHG emissions and their relative weight;
  • Identify potential areas for improvement, regarding energy savings; and
  • Forecast the reduction impact of future measures and monitor the results after their implementation.
As the WWTP of Leh is still not built, the objective of using the ECAM tool is to estimate the future GHG emissions from the operation of the planned WWTP, as well as identifying high sources of emissions during the collection, treatment, and discharge of the wastewater, and pointing out the GHG emissions from the current water supply scheme in Leh.

2.4. GHG Reduction Potential

In order to value the potential of reducing GHG emissions from the wastewater sector, valorization sludge and biogas, through electricity production and usage as a cooking fuel, will be discussed in scenario 1 and scenario 2 in the following. Electricity production from biogas is computed through the formula of [95].
The biogas potential related to the chosen serviced population can be estimated for the assessment year, as follows; the biogas is supposed to be produced during the whole year. The production estimation takes into account the availability of organic matter during summer and winter. [96] specify that the biogas requirement per meal in India is 0.07 m3/meal. If three meals are typically consumed per day, 0.21 m3 of biogas per person per day is needed; if only two meals are consumed, 0.14 m3 daily per person is required. However, due to the technical challenges of transporting the biogas from the point of biogas production to the households, losses should be accounted before utilizing it. The losses from small-scale biogas plants can be due to cracks in biogas digesters and tubing or can be done intentionally when the biogas surpasses the needs. Only the losses from the cracks are assumed here to estimate the maximum potential of utilizing biogas. The value of losses is supposed according to [97] for a value of 5%. The cooking fuel used in domestic cookers in Leh is supposed to be natural gas. This estimation is rough, as the use of other types of cooking fuel would lead to different related GHG emissions.

3. Results and Analysis

3.1. Water Supply Sector Emissions

The Public Health and Environment (PHE) institution is responsible for ensuring the drinking water supply to the population of Leh. The water abstraction and distribution system as of 2017 is composed of:
  • Four stages of pumping stations extracting around 1.5 MLD of water and using around 560 L of fuel daily [87];
  • Spring water [87];
  • Six borewells extracting 1.24 MLD of groundwater daily and using around 86 L of diesel daily for running the pumps [87].
PHE also operates 10 water tankers in Leh town during the year. It extracts 80% of the water from tubewells, whereas the rest comes from spring sources. The average distance driven is 70 km per day for all operating water tankers. The resulting daily fuel consumption is then 17.5 L. The future water supply scheme proposed by PHE is designed to supply about 10 MLD of water per day by 2042 to the town from the Indus aquifer, as well as through using the six same borewells. It is reported that the proposed future scheme would lead to a consumption of around 3600 L of diesel per day for the 4 pumping stages, 86 L/day of diesel for the 6 borewells, as well as 17.5 L from operating the water tankers [87].
After abstraction and pumping of the water from the Indus Aquifer, it is conveyed to storage reservoirs. From there, the residents receive the supplied water by gravity through private household connections and public standposts. The water receives no treatment before distribution. Hence, there are no GHG emissions related to the treatment. As the distribution system is combined with the abstraction system, the resulting GHG emissions can be described together.
The water supply is currently the source of 658 t CO2 eq per year, with the biggest share from the fuel used for pumping the water from the Indus River Aquifer (around 556 t CO2 eq per year), followed by the water extraction from the borewells (83 t CO2 eq per year), and finally the water tankers (17 t CO2 eq per year). The proposed future supply scheme which would allow to supply an amount of 135 L/day/capita for the estimated population by 2042 would imply an increase of 540% of CO2 eq emitted during the operation of the pumping system, in comparison to the current water supply scheme. This value certainly highlights the need to propose potential possibilities, according to which the carbon footprint from the operation of the water supply scheme can be decreased.
To make a comparison between Leh’s current figure in terms of GHG emissions in the water supply scheme and other countries or cities, data were taken from the literature review, were normalized, and compared according to the GHG emissions per m3 of supplied water. The current scheme in Leh shows the second highest value of GHG emissions per m3 of supplied drinking water in comparison to China [10], the United Kingdom [98], the United States [99], Durban in South Africa [100], and Oslo in Norway [101]. This could be explained, similarly to Australia, by the energetic mix in both locations, which is based on burning fossil fuels to cover the energy requirements, diesel fuel in the case of Leh, and coal and oil in the case of Australia [102]. This high value can also be justified in the case of Leh by the need to pump the water from the Indus river aquifer south of the town, up to 345 m elevation change to the northern part of the town.
PHE’s water supply scheme is seen as inappropriate, since it is allowing supply of water for only a few hours per day. This is not sufficient for the summer season, when tourists increase the stress on the available and supplied water by PHE. Consequently, many households, guesthouses, and hotels own private borewells and use a pumping unit on site to extract groundwater for their daily consumption [89]. If fossil fuels are used for pumping, the GHG emissions from ensuring sufficient water supply is even higher. The absence of regulation for drilling private borewells in Leh does not only lead to a potential pollution of the groundwater due to the proximity of drinking water wells to septic tanks [71], but also these practices constitute a catalyzer to climate change. It is then necessary to suggest possibilities of GHG reduction through utilizing renewable energies or through minimizing the energy needed for pumping in the water supply scheme.
Ref. [101] propose a comparison of electricity usage patterns during pumping and treatment of drinking water in different cities of India. This allows a comparison in terms of GHG emissions from the electricity used, as well as from fuel usage in the case of Leh. Over 95% of the GHG emissions in the case of Hyderabad and Shimla are due to the extraction and pumping of water [103], while it is of 100% in the case of Leh. The GHG emissions from water supply in Leh are in the same range of the ones of Hyderabad, while Shimla, which is situated in a hill station in the Himalayan Mountains, has to source the water from long distances and pump it uphill. This explains the high value of GHG emissions per m3 supplied.

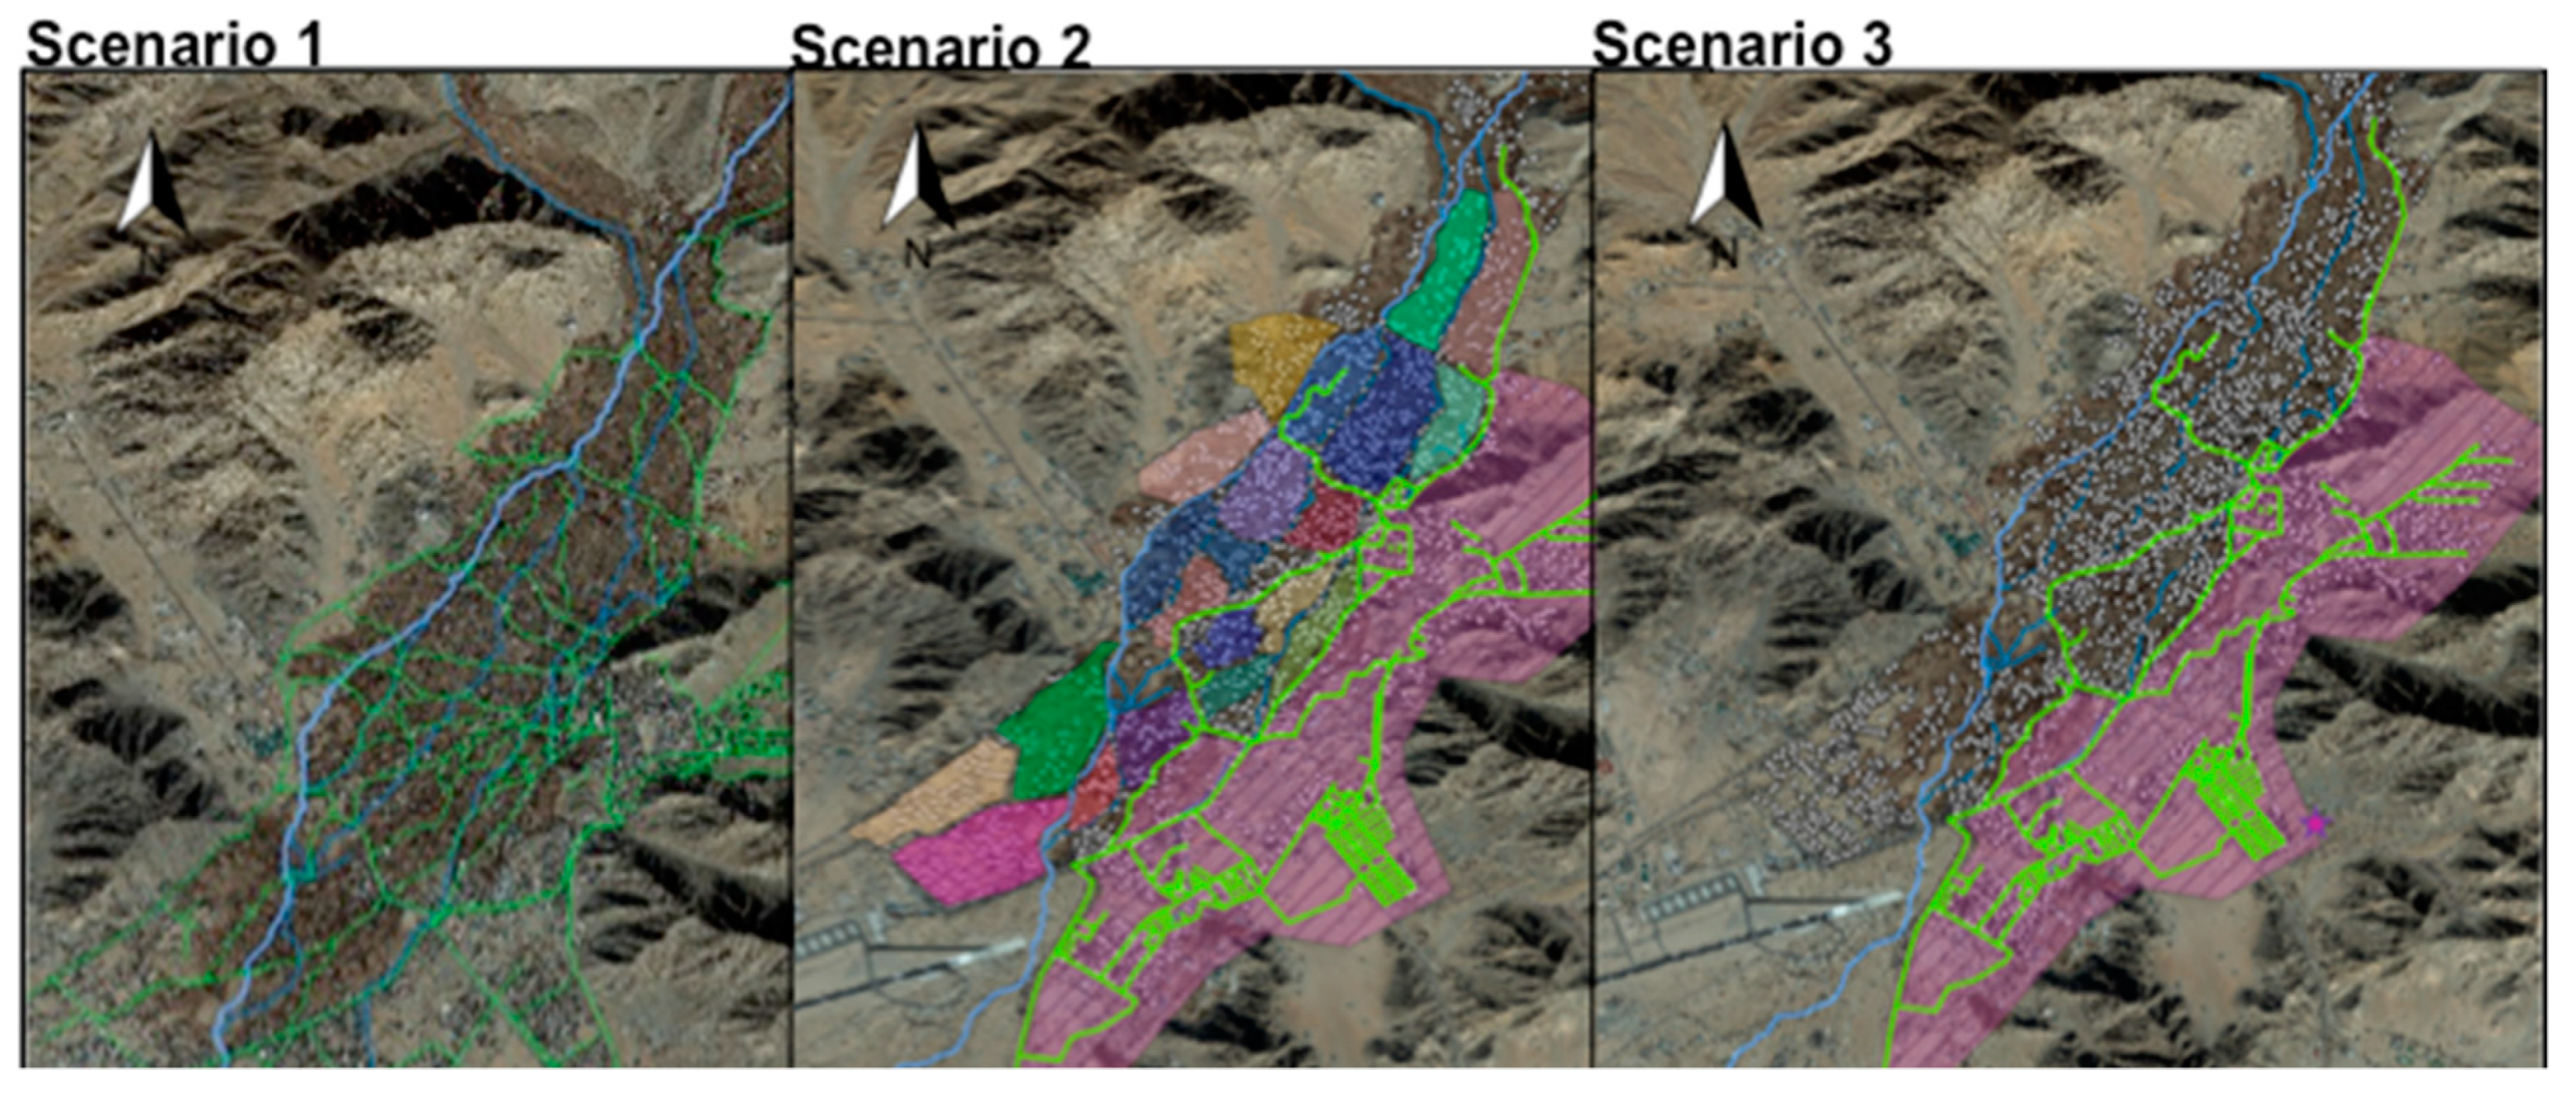
3.2. Wastewater Sector Emissions

The GHG emissions from the operation of water reclamation with resource recovery schemes in Leh is discussed and compared between three scenarios of:
  • Fully centralized scheme
  • Combined decentralized and centralized scheme
  • Combined household level and centralized scheme
Scenario 1: Fully Centralized Scheme
Computing the new population projection while including the census of 2011 shows an overestimation ranging from 15,000 to 20,000 people by year 2040 in comparison to the design population estimated by Tetra Tech. Consequently, the WWTP is more likely to operate under the designed capacity. The two estimations will be taken into account in the analysis to provide a range of GHG emissions for the centralized water reclamation with resource recovery scheme.
The first scenario is based on hypothetically connecting the total population of Leh town to the WWTP. It is also supposed that the electricity needed for running electromechanical engines, for pumping purposes, and for aerating the activated sludge tanks being supplied directly from a local electricity supplier through a connection to the power grid.
According to the Tetra Tech report, the estimated population used to design the system is at 120,836, while the new estimated population computed in this study is 52,313 during the year and 68,007 during the summer, including the floating population. The discrepancy between the two population estimations could be explained by the fact that the neighboring villages of Choglamsar, Saboo, and Stok, with a total population of 26,471 as of 2001 census [79], will most probably not be able to connect to the sewerage line.
The results show that the step that contributes most to the GHG emissions is the wastewater treatment step. This could mainly be due to the high electrical energy requirement for aerating the activated sludge tank. It has been reported by [104] that the aeration processes in activated sludge can consume up to 60% of the total plant power requirements. Further, around 80% of GHG emissions are owing to the electrical energy that would be used on site or for collecting the wastewater, followed by N2O emissions emitted during biological treatment and discharge of treated wastewater.
The results in terms of GHG emissions from the two population estimation scenarios show a big discrepancy, since these are in the function of the inflow wastewater to the plant and can greatly affect the results. It is shown that if more people are connected to the WWTP, the GHG emissions will be higher. On the other hand, the design capacity of the WWTP (population estimation 1) is much higher than the projected one from the new population estimation 2. The lower value of wastewater inflow could lead to operation issues, especially if the pumps run dry or operate near to the shut-off head. This could actually cause overheating and degradation of the quality of the pumps [39]. For this reason and to avoid issues from running the WWTP under capacity, it can be suggested to allow hotels to connect to the plant and simultaneously increase the wastewater inflow to the plant, or to decrease the capacity of the planned WWTP.
Ref. [105] state that a typical Biological Nutrient Removal activated sludge WWTP for 100,000 PE may be the source of around 5300–7400 t CO2/year of GHG emissions. Their study took in fact into account plant power requirements and energy recovery, as well as energy embodied in the chemicals consumed and transport requirement or disposal of biosolids produced. This is roughly comparable to the value of 4600–7500 t CO2/year of population equivalent to 90,000 and 120,000 in this study, where energy recovery and embodied chemical energy are not accounted for.

3.2.1. Sludge Disposal

The design of the planned WWTP in Leh does not include a valorization of the produced sludge. It is only proposed to stabilize it through drying it in solar drying beds [83]. Here, different possibilities of sludge disposal will be discussed, as well as their impact on the carbon footprint of the plant.
The discussion will be based on the sludge production from the design population estimation (92,951 during the winter and 120,836 during the summer) to have a maximum value of the possible GHG emissions. The results of the inventory include the sum of the transport of the sludge, as well as the disposal method. The discussed methods are transport of the sludge and disposal of it to a landfill, and transport of the sludge and application of it to the land.
The transport is assumed to be using a truck of a capacity of 5000 kg. The estimated dry weight of the sludge to be sent to the disposal site is at 26,859 kg for the sub-scenario 1. The landfill is estimated to be at a distance of 7.6 km from the WWTP. The land application is supposed to be in the agricultural areas of Leh. The distance from the WWTP to the agricultural area is roughly 10 km. The need to apply the sludge is assumed to be during the summer months only, hence the transport of the sludge to the land is supposed to be completely fulfilled in 6 trips.
After analyzing the results, the total carbon footprint from transporting the sludge is less than 1% from both disposal scenarios and can be supposed as negligible. Land application is a better alternative to manage the sludge produced from the WWTP, as an alternative to the landfill. Although this last leads to lower N2O emissions than land application, it produces an important amount of CH4 due to the anaerobic conditions in the landfill. Hence, it is recommended to valorize the produced sludge, by land application for example, instead of disposing it in a landfill, as it offers a potential of 64,076 kg CO2 eq saving. Land application of the sludge should only be done after biological, chemical, or thermal treatment of the sludge to reduce its fermentability and health hazards.
In utilizing sludge for land application, the concentration of toxic elements, such as Zinc, Copper, Nickel, Cadium, Lead, and Mercury, must not exceed certain limits [106]. Land application of the sludge can enhance the fertility of soil and increase the crop yield of agricultural lands. It can also be used to regenerate barren lands to productivity or to provide the vegetative layer needed for controlling soil erosion. A significant amount of sewage sludge should be applied to land to provide sufficient nutrients and organic matter for supporting the vegetation until achieving a self-sustainable ecosystem (7 to 450 t dry weight/ha) [107]. The produced sludge can be used in Leh town to recover the fertility of the barren land, located in the proximity of the WWTP. If 7 t dry weight/ha of sludge is applied to the land, almost three ha of barren land can be regenerated.

3.2.2. Biogas Potential and Usage

The estimated biogas production during the period of assessment for the two population estimation scenarios is as follows. The produced biogas, if not valorized or flared, would lead to higher CH4 emissions in the air. The valorization of the biogas produced from a WWTP can be achieved through different paths [108]. If the electricity is used on site to cover a percentage of electrical energy requirements, this would lead to GHG reduction potential of 907 t CO2 eq (sub-scenario 1) and 510 t CO2 eq for (sub-scenario 2).
The production of electricity through an internal combustion engine requires a pre-treatment to remove traces of Hydrogen Sulfide (H2S) and humidity, which can both lead to damaging the equipment and increasing the heating power of biogas [109]. However, onsite electricity consumption of the produced biogas could cover a share of 13% the electricity needed, allowing savings for costs of the electricity. Alternatively, if the biogas from sub-scenario 1 is used as a cooking fuel, it would cover the need of a range of 7000–8000 persons for preparing three meals a day for one year for sub-scenario 1, or 4000–5000 persons for covering the fuel needed for cooking three meals a day for one year for sub-scenario 2. The biogas produced can be sold to interested clients in the surroundings of the WWTP for daily usage, for instance to the inhabitants of the military area. If the biogas produced is used as a cooking fuel, between 110 and 210 t CO2 eq will be saved per year, depending on whether two or three meals a day are consumed.
Scenario 2: Combined Decentralized and Centralized Scheme
The parts of Leh that will not be connected to the centralized sewerage system can hypothetically be serviced by defining decentralized pockets with an alternative collection and CW treatment option. The pockets defined in this study can be divided into two groups, according to the number of households in each pocket: 18 small size pockets of less than 60 households as of 2015, and 3 big size pockets of households number higher than 100 as of 2015. In addition to these pockets, the areas that will also be connected to the WWTP encompass 2992 households as of 2015, as well as a bed capacity of 2452. The different size pockets have the following wastewater generation:
  • between 1000 L/d and 2000 L/d in 11 pockets
  • between 1000 L/d and 24,000 L/d in 7 pockets
  • higher than 24,000 L/d in 4 pockets
Two sub-scenarios are studied to draw a comparison between the gravity sewers and vacuum sewers for collecting the wastewater in the different pockets. One of the first differences is the electrical energy requirement for the second, which is estimated by [110] to be in the range of 0.2–0.7 kWh/m3. In order not to underestimate the GHG emissions from these systems, the highest value was chosen for the inventory. Due to this electrical energy requirement, the vacuum sewer would emit 64 t CO2 eq, in comparison to zero GHG emissions from operation of the gravity sewer.
The collection step is the largest contributor to the GHG emissions in the case if vacuum sewers are used. If gravity sewers are used, the treatment process is the largest contributor to GHG emissions, similar to scenario 1. The treatment step includes both for HSSF CWs and for VSSF CWs emissions from the biological degradation of organic matter. The VSSF CWs require electrical energy to lift the water during the treatment, but despite this, the emissions from HSSF remain higher than the ones from VSSF. This can be explained by the higher CH4 emissions factor reported by [92] for the HSSF (a median value of 7.4 mg CH4–C m−2 h−1) in comparison to the ones of VSSF with a value of 2.9 mg CH4–C m−2 h−1. In addition to that, the result is also due to the fact that HSSF needs more area per PE than VSSF [111].
While comparing the emissions per m3 of treated wastewater in the pockets and in the areas connected to the WWTP, the results of emissions per m3 during the treatment for the connected area to the WWTP are higher than those of the decentralized pockets. This can again be explained by the high electrical energy requirement of the WWTP.

3.2.3. Biogas Potential and Usage

In terms of biogas potential for the different pockets, the produced biogas if not valorized or flared would lead to a higher CH4 emission in the air. If all the biogas produced in the pockets is utilized for cooking, it would lead to approximately 90–100 persons having enough cooking fuel for three meals a day for one year, or 135–145 persons for two meals a day for one year. Using biogas instead of LPG can lead to a saving potential of around 3 t CO2 eq from the same number of people using LPG for covering their energy requirement for cooking fuel for one year. Allowing the use of biogas can be a great incentive for the population to support the installation of a decentralized water reclamation with a resource recovery solution, which can simultaneously produce biogas. The biogas could be utilized at hotels or guesthouses, for example, in return for a higher share of investment for installing the decentralized solution or for covering the operation and maintenance costs.
Scenario 3: Combined Household Level and Centralized Scheme
The water reclamation with resource recovery scheme in this scenario is based on combining a household level on-site wastewater treatment approach with a centralized FSTP that treats and stabilizes the fecal sludge, alongside the centralized treatment through the WWTP of the similarly connected areas, as in scenario 2. Every household and hotel is hypothetically equipped with a septic tank.
The results of GHG emissions from the population with on-site sanitation shows that the sludge disposal is the largest contributor to GWP with a value of 331 t CO2 eq, in comparison to the on-site treatment of the generated wastewater (260 t CO2 eq) and the sludge transport to the FSTP (260 t CO2 eq). The CH4 emissions from septic tanks are higher (92% of total emissions) than N2O emissions, which account only for 8%. This can be explained by the anaerobic digestion occurring in the septic tank, which results in the production of CH4 [112]. CH4 emissions from septic tanks are considered as a big contributor to global warming, since CH4 has a GWP of 34 over 100 years [86], especially if there is no utilization of the CH4 produced. A possible strategy for reducing the CH4 emissions from septic tanks would be to capture it, in order to utilize it as a cooking fuel or simply flare it. Flaring biogas can actually decrease the carbon footprint by converting all CH4 to CO2 [101]. However, the flare for a household plant has nearly the same costs as a flare for a large plant of 20,000 inhabitants. Therefore, the specific costs per person are high for flares implemented in small systems at the household level. Since septic tanks lead to CH4 emissions, and since flares are neither economical nor practical at the small scale, installing septic tanks could have an important negative impact on climate change if this pre-treatment method is adopted [113].
Comparison of the Scenarios
Since the first scenario deals with the future planned centralized sewerage system for the projected population by 2040, while the second and the third scenarios analyze the wastewater management for the population by 2015, the comparison of different emissions from different scenarios will be completed by defining a comparison ratio of the produced emissions divided by the cubic meter of treated wastewater in each scenario. This is also important, since for the first scenario, only the households are supposed to be connected, while in the two others, the wastewater produced from the households, guesthouses, and hotels is managed.
Figure 3 highlights the comparison of the GHG emissions per cubic meter of treated wastewater in scenario 1 (sub-scenario 1), scenario 2 (if the collection is ensured with gravity sewers and the treatment is with VSSF), and scenario 3. The comparison of the 3 scenarios shows that the combination of the proposed centralized system combined with a household-level wastewater treatment solution has the highest ratio of GHG emissions per m3, in comparison to scenario 1 and scenario 2. Scenario 2 shows the lowest carbon footprint during operation. This could be explained by the fact that for scenario 2 and 3, the wastewater treated by the decentralized treatment solution or by onsite treatment is much lower than the volume of water treated by the WWTP from the connected areas. Hence, it is more appropriate to calculate the ratios of GHG emissions of centralized, decentralized, and household level wastewater management separately.
When comparing these in terms of GHG emissions per m3 of treated wastewater, the highest ratio is allocated to the centralized approach, followed by the decentralized approach using CWs. A decentralized approach could lead to a lower carbon footprint during its operation. The household approach has been omitted from this comparison due to the very high values in comparison to the other approaches.

3.2.4. GHG Emissions from Plant Construction

Aside from the carbon footprint of the operation of the different water reclamation with resource recovery solutions, the construction phase can also have a considerable impact on GHG emissions, especially when comparing the construction requirement of a high capacity WWTP in comparison to decentralized or household scale water reclamation with resource recovery alternatives. The analysis of the GHG emissions from the excavation works and production of cement concrete, plum concrete, and mortar concrete in the installation of gravity mains, rising mains, pumping station, and WWTP show an overall value of 2177 t CO2 eq. With a percentage of more than 20%, the share of installation of the gravity sewage lines account for 625 t CO2 eq. The excavation activities and the concrete requirement from the WWTP account for over 60% of the total carbon of the centralized sewage scheme, with a value of 1127 t CO2 eq. This does not include the emissions due to the use of reinforcement steel also used for the construction of the WWTP, which has a share of 33% of the carbon footprint of a WWTP’s construction and its dismantling [93]. Taking this into account would lead to an even higher carbon footprint. The same occurs when the transport of materials to the site of construction, and the electricity used for construction are also considered.
On the other hand, if the lifetime of the plant is 30 years, the GHG emissions related to the construction of the WWTP, sewage system, and the main pumping station would account only for 2% of the GHG emissions from the projected electricity used for pumping the wastewater and treating it for 120,000 people (sub-scenario 1). Other studies demonstrate that GHG emissions from the use of raw materials and energy during the construction of two real WWTPs corresponds to 10–20% of the total GHG emissions of the WWTP for a service life of 30 years [114].
The carbon footprint of scenarios 2 and 3 will be even higher if the WWTP is built with the same capacity as scenario 1 but having to treat a smaller share of the generated wastewater. Further, upscaling the construction of septic tanks for a total population as in scenario 1 leads to total emissions of 46,365 t CO2 eq, whereas upscaling the construction of CWs for 120,000 people will lead to a total of 1153 t CO2 eq. CWs allow the least carbon footprint during the construction phase, in comparison to the WWTP, as the carbon footprint of installing septic tanks for the same volume of wastewater to treat is by far the highest (46,365 t CO2 eq). Constructing household sanitation systems is, hence, the largest emitter in comparison to decentralized and fully centralized water reclamation with resource recovery schemes.

4. Discussion

The results of the GHG emissions inventory in the operation of a water supply scheme, and the possible proposed water reclamation with resource recovery approaches presented in this study, show important sources of GHG emissions, as well as opportunities for valorization of byproducts of the water reclamation with resource recovery process. In this chapter, further GHG emission reduction opportunities will be discussed.
As part of the PHE project to ensure drinking water for Leh town, 6 borewells, located in Khankshal, Laödon, Jumabach, Tukcha, Agling, and Murtsey are used to pump water from the groundwater to supply the public stand posts. The borewells pump water from a depth between 6 and 27 m daily and provide a total amount of 1.674 billion L/day. The consumption of the diesel needed for this is estimated to be 31,089 L per year [87], which is equivalent to an emission of 83 t CO2 eq per year. The energy productivity of diesel fuel pumps can highly be increased by replacing these latter with solar photovoltaic pumps [72]. In fact, as seen above, the availability of solar irradiation in Ladakh can play an important role in substituting the used fuel and its related yearly costs.
Furthermore, solar pumping would allow for a system that operates without any GHG emissions. Solar pumping is already being used in many locations worldwide, due to the economic and environmental implications of using a fossil fuel powered systems [115]. A common use of solar pumping is for irrigation [116]. On a broader scale and based on field experience on multiple installed systems, [117] has proved their technical maturity and reliability. Hence, design of solar pumping systems for the 6 borewells in Leh is proposed.
So far, the carbon footprint from the water supply scheme and the water reclamation with resource recovery schemes have been discussed separately. However, a fully decentralized water reclamation with resource recovery scheme could positively influence the carbon footprint from the water supply scheme—[118] recommends different water supply levels for Indian towns, depending on the type on their sewerage systems. A decentralized water reclamation with resource recovery strategy in Leh, similar to scenarios 2 or 3 in this study, will lead to a requirement of only 70 L/day instead of 135 L/day per capita. According to the information and data received from PHE in 2017, 8 million liters per day will be extracted from the future water supply scheme in Leh town using two pumps, to supply the water for 59,259 people. Afterwards, three other stages, each equipped with two pumps, will run daily to lift the water up. The GHG emissions from using fuel were calculated above, and it is around 3672 t CO2 eq per year. This is roughly equivalent to a value of 1.26 g CO2 eq per liter of supplied water. Hence, in case Leh is not provided with a centralized sewerage system, a water supply of 4.2 million liters per day is required. which is equivalent to only 1928 t CO2 eq per year. A decentralized water reclamation with a resource recovery approach will, thus, allow a saving potential of 1744 t CO2 eq per year.

4.1. Overcoming the Biogas Challenge

India has been experiencing a rapid increase in installed biogas plants since 2013 [119]. However, in high altitude regions, such as Jammu and Kashmir State, where the town of Leh is located, the trends seems to be unsatisfactory, as the number of plants constitutes only 0.06% (2.739 plants) of the total plants installed in the country, as of March 2013 [119]. The most prominent challenge in biogas technology in high altitude areas is climatic conditions, mainly the temperature, where severe winter conditions can limit the gas production [120]. This is mainly because the methanogenic bacteria, responsible for biogas production, are very sensitive to temperature changes, and these regions are not able to ensure permanent heating provisions and automatic temperature control.
To overcome these challenges, research has led to the development of floating drum biogas plants, while using bricks in the process of fabrication of the digester, insulating around it with straw, enclosing it within a greenhouse, and using hot water to mix the feeding. This set-up has led to a higher biogas production rate of 1.6 to 2.6 m3/day [121]. Another challenge that can endanger the optimal operation for the digester is the low sludge rate production during the winter. However, the sludge for the digester can be collected and conserved during winter and afterwards be used to initiate the digester to boost the anaerobic process. Hence, operationalizing biogas production has very significant energy security potential in Leh.

4.2. Limitations of the Study

The analysis of carbon footprint shows that municipal WWTPs have a small impact at a global scale, constituting 0.45% of the yearly average pro capita CO2 eq emissions in Europe [114]. Nevertheless, it is a good method to detect sources of GHG emissions and target them to suggest GHG reduction potential, which could help decrease the carbon footprint of urban areas. However, it cannot provide sufficient proof for decision-making, as an ecological evaluation through a life cycle assessment (LCA) offers a more complete method for assessing the impacts of processes on different impact categories [114], such as human toxicity, smog, global warming, and eutrophication [122].
On the other hand, during the construction of the different scenarios, only excavation and cement and concrete production have been taken into consideration, as these were considered to be the largest contributors to the carbon footprint of the construction phase. The resulting calculated carbon footprints are underestimated. However, the results give a very good basis of comparison between the different scenarios.
Further, while emission factors have been assumed to reach an approximation of GHG emissions, these may lack precision and accuracy, since they are not always verified by measurements. While many studies certify that they underestimate the real GHG emissions in the case of wastewater treatment, [26] found that in the context of the GHG emissions study for a WWTP, the measured emissions were almost 36% lower than the estimated emissions based on emission factors. A sensitivity analysis could be helpful to arrive at a range of estimated GHG emissions. Nevertheless, using emission factors allows for a concise comparison between the studied scenarios.

5. Conclusions

This study compared the carbon footprint of the operation of the current and future water supply scheme in Leh town. Further, it analyzed sources of emissions from different water reclamation with resource recovery scenarios in Leh, being fully centralized, or a combination of this with a decentralized treatment scheme or a household level treatment scheme. The results show that the electricity requirement for the planned WWTP will lead to high GHG emissions. In addition, a fully household-level on-site treatment scheme could lead to the highest value of GHG emissions per m3 during the construction and the operation phase. Thus, this scheme is not encouraged for managing the wastewater in Leh, due to the uncertainty of the safe management of the sludge produced, and due to absence of regulations. Fixing a desludging frequency and operating maintenance activities is important to avoid health and environmental hazards.
The results of this study show that a fully decentralized water reclamation with resource recovery scheme, based on VSSF CWs, can in fact allow the least GHG emissions during operation. This is further supported by the low carbon footprint from the construction of decentralized water reclamation with resource recovery schemes (1153 t CO2 eq) in comparison to an onsite water reclamation with resource recovery scheme generalized to the whole town (46,365 t CO2 eq), or a centralized water reclamation with resource recovery option through the WWTP (2177 t CO2 eq), to manage the wastewater from 120,000 PE in Leh.
The study also highlighted GHG emissions reduction potential, including utilizing the produced biogas and sludge. If electricity is produced and utilized on site from the biogas produced in scenario 1, a range from 500 to 900 t CO2 eq can be saved from using power grid electricity. Similarly, utilizing the sludge for land application could provide a saving potential of 64 t CO2 eq in this scenario, in comparison to sending it to a landfill. Alternatively, using biogas as cooking fuel in scenario 2 could allow a saving potential of 3 t CO2 eq for substituting the LPG need for cooking.
Further, a solar pumping system has been proposed to replace the current diesel fueled pumps to extract groundwater used for water supply, which would allow a saving potential of 83 t CO2 eq per year. This system is also recommended to be adopted by private hotels and households, as it may imply fuel cost savings and a better water supply reliability. In addition, decentralizing water reclamation with resource recovery can also lead to a saving potential of 1744 t CO2 eq due to the lower water supply requirements. The results obtained with the available data and upscaled to the treatment capacity of the proposed WWTP or obtained from the normalization of GHG emissions to the cubic meter of treated wastewater should be examined critically due to the uncertainties of emission factors used and to the non-consideration of future urban development patterns. Also, the projected energy consumption for the water supply sector and the planned WWTP are uncertain. However, the results clearly underline the importance to engage in discussions to reevaluate and propose measures to be implemented to achieve more sustainable urban water management in Leh. Supporting decentralized water reclamation with resource recovery pilot projects can demonstrate the necessity of upscaling these types of solutions in the context of Leh.

Author Contributions

In the writing of this paper, M.L. contributed to the conceptualization of the research; design of the research methodology; utilization of the ECAM software; formal analysis and validation; original draft preparation and visualization of the results. J.E.D. and D.G. contributed to conceptualization of the research; design of the research methodology; writing, reviewing and editing the paper; supervision of the research work; and project administration and funding acquisition of the research project under which this research was conducted.

Funding

This research was funded by the Bavarian State Ministry of Environment and Consumer Protection, Munich, Germany, under the “Urban Water-Energy-Food Nexus” research project, grant number 76e0100000217.

Acknowledgments

We gratefully acknowledge the technical support to the paper content provided by Mohammed Al-Azzawi. This work was supported by the German Research Foundation (DFG) and the Technical University of Munich (TUM) in the framework of the Open Access Publishing Program.

Conflicts of Interest

The authors declare no conflict of interest. The funders had no role in the design of the study; in the collection, analyses, or interpretation of data; in the writing of the manuscript, or in the decision to publish the results.

References

  1. United Nations. World Urbanization Prospects: The 2014 Revision. Available online: https://esa.un.org/unpd/wup/Publications/Files/WUP2014-Report.pdf (accessed on 20 February 2018).
  2. McDonald, R.I.; Weber, K.; Padowski, J.; Flörke, M.; Schneider, C.; Green, P.A.; Montgomery, M. Water on an urban planet: Urbanization and the reach of urban water infrastructure. Glob. Environ. Chang. 2014, 27, 96–105. [Google Scholar] [CrossRef] [Green Version]
  3. GIZ; ICLEI. Operationalizing the Urban NEXUS Towards Resource-Efficient and Integrated Cities and Metropolitan Regions. Available online: http://www2.giz.de/wbf/4tDx9kw63gma/UrbanNEXUS_Publication_ICLEI-GIZ_2014_kl.pdf (accessed on 20 February 2018).
  4. Stakeholder Forum for a Sustainable Future. Review of Implementation of Agenda 21. Available online: https://sustainabledevelopment.un.org/content/documents/1126SD21 Agenda21_new.pdf (accessed on 20 February 2018).
  5. United Nations. New Urban Agenda, Conference on Housing and Sustainable Urban Development (Habitat III). Available online: http://habitat3.org/wp-content/uploads/NUA-English-With-Index-1.pdf (accessed on 20 February 2018).
  6. Hoff, H. Understanding the Nexus. In Proceedings of the 2011 Nexus Conference, Bonn, Germany, 16–18 November 2011. [Google Scholar]
  7. Vörösmarty, C.J.; Green, P.; Salisbury, J.; Lammers, R.B. Global Water Resources: Vulnerability from Climate Change and Population Growth. Science; American Association for the Advancement of Science: Washington, DC, USA, 2000. [Google Scholar] [CrossRef]
  8. Bates, B.C.; Kundzewicz, Z.W.; Wu, S.; Palutikof, J.P. Climate Change and Water. In Proceedings of the Intergovernmental Panel on Climate Change, Geneva, Switzerland, 1 June 2008. [Google Scholar]
  9. Copeland, C. Energy-Water Nexus: The Water Sector’s Energy Use. Available online: https://fas.org/sgp/crs/misc/R43200.pdf (accessed on 20 February 2018).
  10. Smith, K.; Liu, S.; Chang, T. Contribution of Urban Water Supply to Greenhouse Gas Emissions in China. J. Ind. Ecol. 2016, 20, 792–802. [Google Scholar] [CrossRef]
  11. Rothausen, S.G.S.A.; Conway, D. Greenhouse-gas emissions from energy use in the water sector. Nat. Clim. Change 2011, 1, 210–219. [Google Scholar] [CrossRef]
  12. UNFCCC. Reporting of GHG Data. Available online: http://unfccc.int/ghg_data/new_reporting_requirements/items/9560.php (accessed on 20 February 2018).
  13. Houghton, J.T.; Jenkins, G.J.; Ephraums, J.J. Climate Change: The IPCC Scientific Assessment; Intergovernmental Panel on Climate Change by Working Group I: Cambridge, UK; New York, NY, USA; Melbourne, Australia, 1990.
  14. UNFCCC. United Nations Framework Convention on Climate Change. Available online: https://unfccc.int/resource/docs/convkp/conveng.pdf (accessed on 20 February 2018).
  15. UNEP. Handbook for the Montreal Protocol on Substances that Deplete the Ozone Layer; United Nations Environment Programme: Nairobi, Kenya, 2006; Available online: http://ozone.unep.org (accessed on 20 February 2018).
  16. UNFCC. UNFCCC Data Interface. Available online: http://di.unfccc.int/comparison_by_category (accessed on 20 February 2018).
  17. UNFCCC. Guide for Peer Review of National GHG Inventories. Available online: https://unfccc.int/files/national_reports/non-annex_i_natcom/application/pdf/final_guide_for_peer_review_report_final_webuploa d.pdf (accessed on 20 February 2018).
  18. Anderson, T.R.; Hawkins, E.; Jones, P.D. CO2, the greenhouse effect and global warming: From the pioneering work of Arrhenius and Callendar to today’s Earth System Models. Endeavour 2016, 40, 178–187. [Google Scholar] [CrossRef] [PubMed]
  19. Harvey, L.D.D. A guide to global warming potentials (GWPs). Energy Policy 1993, 21, 24–34. [Google Scholar] [CrossRef]
  20. IPCC. 2006 IPCC Guidelines for National Greenhouse Gas Inventories, Prepared by the National Greenhouse Gas Inventories Programme; Eggleston, H.S., Buendia, L., Miwa, K., Ngara, T., Tanabe, K., Eds.; IGES: Hayama/Kanagawa, Japan, 2006. [Google Scholar]
  21. IPCC. Climate Change: The Physical Science Basis; Cambridge University Press: Cambridge, UK, 2007. [Google Scholar]
  22. IEA. World Energy Outlook; International Energy Agency: Paris, France, 2015. [Google Scholar]
  23. Cornejo, P.K. Environmental Sustainability of Wastewater Treatment Plants Integrated with Resource Recovery: The Impact of Context and Scale. Available online: http://scholarcommons.usf.edu/etd (accessed on 20 February 2018).
  24. Soda, S.; Iwai, Y.; Sei, K.; Shimod, Y.; Ike, M. Model analysis of energy consumption and greenhouse gas emissions of sewage sludge treatment systems with different processes and scales. Water Sci. Technol. 2010, 61, 365. [Google Scholar] [CrossRef] [PubMed]
  25. Nair, S.B.G.; Malano, H.N.; Arora, M.; Nawarathna, B. Water–energy–greenhouse gas nexus of urban water systems: Review of concepts, state-of-art and methods. Resour. Conserv. Recycl. 2014, 89, 1–10. [Google Scholar] [CrossRef]
  26. De Graaff, M.S.; Zandvoort, M.; Roest, K.; Frijns, J.; Janse, T.; van Loosdrecht, M.C.M. Quantification of Methane and Nitrous Oxide Greenhouse Gas Emissions from the Urban Water Cycle. IWA World Water Congress. Available online: http://livelink.kwrwater.nl/livelink/livelink.exe/open/50222954 (accessed on 20 February 2018).
  27. Guisasola, A.; de Haas, D.; Keller, J.; Yuan, Z. Methane formation in sewer systems. Water Res. 2008, 42, 1421–1430. [Google Scholar] [CrossRef] [PubMed]
  28. Foley, J.; Lant, P.A.; Yuan, Z.; Keller, J.; Donlon, P. Fugitive greenhouse gas emissions from wastewater systems. In Proceedings of the 6th IWA World Water Congress, Vienna, Austria, 7–12 September 2008. [Google Scholar]
  29. Daelman, M.R.J.; De Baets, B.; van Loosdrecht, M.C.M.; Volcke, E.I.P. Influence of sampling strategies on the estimated nitrous oxide emission from wastewater treatment plants. Water Res. 2013, 47, 3120–3130. [Google Scholar] [CrossRef] [PubMed]
  30. Daelman, M.R.J.; van Voorthuizen, E.M.; van Dongen, U.G.J.M.; Volcke, E.I.P.; van Loosdrecht, M.C.M. Methane emission during municipal wastewater treatment. Water Res. 2012, 46, 3657–3670. [Google Scholar] [CrossRef] [PubMed]
  31. Short, M.D.; Daikeler, A.; Peters, G.M.; Mann, K.; Ashbolt, N.J.; Stuetz, R.M.; Peirson, W.L. Municipal gravity sewers: An unrecognised source of nitrous oxide. Sci. Total Environ. 2014, 468–469, 211–218. [Google Scholar] [CrossRef] [PubMed]
  32. Wunderlin, P.; Mohn, J.; Joss, A.; Emmenegger, L.; Siegrist, H. Mechanisms of N2O production in biological wastewater treatment under nitrifying and denitrifying conditions. Water Res. 2012, 46, 1027–1037. [Google Scholar] [CrossRef]
  33. Foley, J.; de Haas, D.; Yuan, Z.; Lant, P. Nitrous oxide generation in full-scale biological nutrient removal wastewater treatment plants. Water Res. 2010, 44, 831–844. [Google Scholar] [CrossRef]
  34. Holmgren, K.E.; Li, H.; Verstraete, W.; Cornel, P. State of the Art Compendium Report on Resource Recovery from Water; International Water Association (IWA) Publishers: London, UK, 2014. [Google Scholar]
  35. Jjemba, P.K.; Weinrich, L.A.; Cheng, W.; Giraldo, E.; Lechevallier, M.W. Regrowth of potential opportunistic pathogens and algae in reclaimed-water distribution systems. Appl. Environ. Microbiol. 2010, 76, 4169–4178. [Google Scholar] [CrossRef] [PubMed]
  36. Lazarova, V.; Bahri, A. Water Reuse Practices for Agriculture. Water Reuse: An International Survey of Current Practice, Issues and Needs; IWA publishing: London, UK, 2008; pp. 199–227. [Google Scholar]
  37. Drewes, J.E.; Khan, S.J. Water Reuse for Drinking Water Augmentation Chapter 16; Water Quality and Treatment, 6th Edition. 16.1-16.48; Edzwald, J., Ed.; American Water Works Association: Denver, CO, USA, 2011. [Google Scholar]
  38. Lazarova, V.; Peregrina, C.; Dauthuille, P. Water-Energy Interactions in Water Reuse; IWA Publishing: London, UK, 2012. [Google Scholar]
  39. CPHEEO. Manual on Sewerage and Sewage Treatment. Available online: https://www.sswm.info/sites/default/files/reference_attachments/CPHEEO-2012-Manual-on-sewerage-and-sewage-treatment.-Part-A-Engineering.pdf (accessed on 20 February 2018).
  40. WSP; IWMI. Recycling and Reuse of Treated Wastewater in Urban India: A Proposed Advisory and Guidance Document; International Water Management Institute: Colombo, Sri Lanka, 2016. [Google Scholar]
  41. Meda, A.; Lensch, D.; Schaum, C.P. Chapter 2: Energy and Water: Relations and Recovery Potential. In Water-Energy Interactions in Water Reuse; IWA Publishing: London, UK, 2012; pp. 21–35. [Google Scholar]
  42. Hawley, C.; Fenner, R. The potential for thermal energy recovery from wastewater treatment works in Southern England. J. Water Clim. Chang. 2012, 3, 287–299. [Google Scholar] [CrossRef]
  43. Schmid, F. Sewage Water: Interesting Heat Source for Heat Pumps and Chillers. Available online: http://www.bfe.admin.ch/php/modules/publikationen/stream.php?extlang=en&name=en _508290240.pdf (accessed on 20 February 2018).
  44. Mortensen, J.G.; Gonzaíez-Pinzo, R.; Dahm, C.N.; Wang, J.; Zeglin, L.H.; Van Horn, D.J. Advancing the Food-Energy−Water Nexus: Closing Nutrient Loops in Arid River Corridors. Environ. Sci. Technol. 2016. [Google Scholar] [CrossRef] [PubMed]
  45. Childers, D.L.; Corman, J.; Edwards, M.; Elser, J.J. Sustainability Challenges of Phosphorus and Food: Solutions from Closing the Human Phosphorus Cycle. BioScience 2011, 61, 117–124. [Google Scholar] [CrossRef] [Green Version]
  46. WERF. Nutrient Recovery State of the Knowledge as of 2011; Water Research Foundation: Denver, CO, USA, 2011. [Google Scholar]
  47. Zhang, W.; Dou, Z.-X.; He, P.; Ju, X.-T.; Powlson, D.; Chadwick, D.; Sayer, J. New technologies reduce greenhouse gas emissions from nitrogenous fertilizer in China. Proc. Natl. Acad. Sci. USA 2013, 110, 8375–8380. [Google Scholar] [CrossRef] [PubMed] [Green Version]
  48. Mo, W.; Zhang, Q. Energy-nutrients-water nexus: Integrated resource recovery in municipal wastewater treatment plants. J. Environ. Manag. 2013, 127, 255–267. [Google Scholar] [CrossRef]
  49. Jönsson, H. Source separation of human urine separation efficiency and effects on water emissions, crop yield, energy usage and reliability. In Proceedings of the First International Conference on Ecological Sanitation, Nanning, China, 5–8 November 2001. [Google Scholar]
  50. Verstraete, W.; Van de Caveye, P.; Diamantis, V. Maximum use of resources present in domestic “used water”. Bioresour. Technol. 2009, 100, 5537–5545. [Google Scholar] [CrossRef] [PubMed]
  51. Muñoz, I.; Milà-i-Canals, L.; Fernández-Alba, A.R. Life Cycle Assessment of Water Supply Plans in Mediterranean Spain. J. Ind. Ecol. 2010, 14, 902–918. [Google Scholar] [CrossRef]
  52. Parkinson, J.; Tayler, K. Decentralized wastewater management in peri-urban areas in low-income countries. Environ. Urb. 2003, 15, 75–90. [Google Scholar] [CrossRef]
  53. Engin, G.O.; Demir, I. Cost analysis of alternative methods for wastewater handling in small communities. J. Environ. Manag. 2006, 79, 357–363. [Google Scholar] [CrossRef] [PubMed]
  54. US EPA. Response to Congress on Use of Decentralized Wastewater Treatment Systems; United States Environmental Protection Agency: Washington, DC, USA, 1997.
  55. Crites, R.; Tchobanoglous, G. Small and Decentralized Wastewater Management Systems; WCB/McGraw-Hill: New York, NY, USA, 1998. [Google Scholar]
  56. Nelson, K. Water Conservation, Reuse, and Recycling. In An Iranian-American Workshop; National Academies Press: Washington, DC, USA, 2005. [Google Scholar]
  57. Gutterer, B.; Sasse, L.; Panzerbieter, T.; Reckerzügel, T. Decentralised Wastewater Treatment System (DEWATS) and Sanitation in Developing Countries: A Practical Guide. Available online: http://www.cabdirect.org/abstracts/20103140120.html;jsessionid=9D0874D07B97A0501DC93F272AD3E4B2 (accessed on 20 February 2018).
  58. Vymazal, J.; Brix, H.; Cooper, P.F.; Haberl, R.; Perfler, R.; Laber, J. Removal Mechanisms and Types of Constructed Wetlands. Available online: http://mit.biology.au.dk/~biohbn/cv/pdf_files/Con_Wet_Was_Treat_Eur(1998)17-66.pdf (accessed on 20 February 2018).
  59. Mitsch, W.J.; Gosselink, J.G. Wetlands; Wiley: New York, NY, USA, 2007. [Google Scholar]
  60. Kadlec, R.H.; Knight, R.L. Treatment Wetlands; CRC Press/Lewis Publishers: Boca Raton, FL, USA, 1996. [Google Scholar]
  61. Albold, A.; Wendland, C.; Mihaylova, B.; Ergünsel, A.; Galt, H. Constructed Wetlands Sustainable Wastewater Treatment for Rural and Peri-Urban Communities in Bulgaria. Available online: https://www.gwp.org/globalassets/global/toolbox/case-studies/europe/bulgaria.-constructed-wetlands-for-rural-and-peri-urban-waste-water- treatment-431.pdf (accessed on 20 February 2018).
  62. Hemkend-Reis, B.; Henseler, M.; Güdel, K.; Lehnhard, Y. Faecal Sludge Management (FSM). Available online: https://www.sswm.info/sites/default/files/reference_attachments/EAWAG SANDEC 2008 Module 5 FSM Lecture.pdf (accessed on 20 February 2018).
  63. WHO; UNICEF. Global Water Supply and Sanitation Assessment 2000 Report. Available online: http://www.who.int/water_sanitation_health/monitoring/jmp2000.pdf (accessed on 20 February 2018).
  64. Dolma, K.; Rishi, M.S.; Lata, R. Evaluation of Groundwater Quality and its Suitability for Drinking Purposes—A Case of Leh Town, Ladakh (J&K), India. Int. J. Sci. Eng. Res. 2015, 6, 576–590. [Google Scholar]
  65. Dolma, K.; Rishi, M.S.; Lata, R. An Appraisal of Centralized Waste Water Treatment Plant with Respect to Leh Town. Int. J. Sci. Res. 2015, 4, 2011–2016. [Google Scholar]
  66. Kasturirangan, K. Natural Resource Management Ladakh Region. A Remote Sensing Based Study; Regional Remote Sensing Service Centre: Dehradun, India, 2003. [Google Scholar]
  67. Chevuturi, A.; Dimri, A.P.; Thayyen, R.J. Climate change over Leh (Ladakh), India. Theor. Appl. Climatol. 2018, 131, 531–545. [Google Scholar] [CrossRef]
  68. Sherratt, K. Social and Economic Characteristics of Ladakh, India. Available online: https://www.geolsoc.org.uk/~/media/shared/documents/Events/Past Meeting Resources/Himalaya 14 Cultural Background to Ladakh.pdf (accessed on 20 February 2018).
  69. Pelliciardi, V. Tourism Traffic Volumes in Leh District: An Overview. Ladakh Stud. 2010, 11/10, 14–23. [Google Scholar]
  70. Leh Tourism Department. Statistics of Number of National and International Tourists in Leh Town; Ladakh Autonomous Hill Development Council: Leh, Jammu & Kashmir, India, 2017. [Google Scholar]
  71. Gondhalekar, D.; Nussbaum, S.; Akhtar, A.; Kebschull, J. Planning Under Uncertainty: Climate Change, Water Scarcity and Health Issues in Leh Town, Ladakh, India; Springer: Cambridge, UK, 2015; pp. 293–312. [Google Scholar]
  72. Santra, P. Scope of Solar Energy in Cold Arid Region of India at Leh Ladakh. Ann. Arid Zone 2015, 54, 109–117. [Google Scholar]
  73. Daultrey, S.; Gergan, R. Living with Change: Adaptation and Innovation in Ladakh. Climate Adaptation Series. Available online: http://www.intrepidexplorers.co.uk/download/i/mark_dl/u/4011885869/4607751139/Dau ltrey and Gergan 2011-Living with change.pdf (accessed on 20 February 2018).
  74. Harinarayana, T.; Abdul Azeez, K.K.; Murthy, D.N.; Veeraswamy, K.; Eknath Rao, S.P.; Manoj, C.; Naganjaneyulu, K. Exploration of geothermal structure in Puga geothermal field, Ladakh Himalayas, India by magnetotelluric studies. J. Appl. Geophys. 2006, 58, 280–295. [Google Scholar] [CrossRef]
  75. Farooq, M.; Shah, I.K.; Mushtaq, S.M.; Khaki, B.A.; Marazi, A.A.; Shah, N.; Mushtaq, M. Emission Inventory of CO2 in Jammu and Kashmir—A Sectoral Analysis; Government of Jammu & Kashmir: Srinagar, Jammu & Kashmir, India, 2016.
  76. SuSanA. Towards More Sustainable Sanitation Solutions. Available online: http://www.susana.org/_resources/documents/default/3-267-7-1452594644.pdf (accessed on 20 February 2018).
  77. WHO; UNICEF. Progress on Drinking Water, Sanitation And Hygiene: 2017 Update and SDG Baselines. Available online: http://www.wipo.int/amc/en/mediation/rules (accessed on 20 February 2018).
  78. WHO; UNICEF. Countries WASH Data. Available online: https://washdata.org/data (accessed on 20 February 2018).
  79. India Census. India Census 2011. Available online: http://www.censusindia.gov.in/2011-prov-results/indiaatglance.html (accessed on 20 February 2018).
  80. Government of Jammu & Kashmir. Faecal Sludge Septage Management. Available online: http://jkhudd.gov.in/pdfs/FSM Policy_J&K.pdf (accessed on 20 February 2018).
  81. CRWQCB. A Review of the Nitrate Problems in the Ground Waters of the Santa Ana Region and Their Relationship to High Density Developments on Septic Tank-Subsurface Disposal Systems. Available online: http://www.waterboards.ca.gov/santaana/water_issues/programs/septic_tanks/docs/nit%0Arate_study.pdf (accessed on 20 February 2018).
  82. BORDA. Fact Sheet: Faecal Sludge Treatment Plant (FSTP). Available online: https://smartnet.niua.org/content/ded33e3d-535f-4946-af0a-556244a79537 (accessed on 20 February 2018).
  83. Tetra Tech. Detailed Project Report for Sewerage System of Leh Town; Tetra Tech: New Delhi, India, 2009. [Google Scholar]
  84. Gao, T.; Liu, Q.; Wang, J. A comparative study of carbon footprint and assessment standards. Int. J. Low Carb. Technol. 2014, 9, 237–243. [Google Scholar] [CrossRef]
  85. Wiedmann, T.; Minx, J. A Definition of “Carbon Footprint.” Ecological Economics Research Trends. Available online: http://citeseerx.ist.psu.edu/viewdoc/download?doi=10.1.1.467.6821&rep=rep1&type=pdf (accessed on 20 February 2018).
  86. IPCC. Climate Change 2013: The Physical Science Basis; Cambridge University Press: Cambridge, UK, 2013. [Google Scholar]
  87. Bonanno, G. Water Resources Sustainability Assessment in Leh Town, Ladakh, India, and Alternative Solutions Using the Water-Energy-Food Nexus. Master’s Thesis, Technical University of Munich, Munich, Germany, 2018. [Google Scholar]
  88. Bunday, B.D. Methods for population estimation by random sampling. Powder Technol. 1975, 12, 283–286. [Google Scholar] [CrossRef]
  89. Akhtar, A.; Gondhalekar, D. Impacts of tourism on water resources in Leh town. Ladakh Stud. 2013, 30, 25–37. [Google Scholar]
  90. WBCSD; WRI. The Greenhouse Gas Protocol. A Corporate Accounting and Reporting Standard; World Business Council for Sustainable Development: Geneva, Switzerland; World Resources Institute: Washington, DC, USA, 2001. [Google Scholar]
  91. Mander, U.; Kuusemets, V.; Lõhmus, K.; Mauring, T.; Teiter, S.; Augustin, J. Nitrous oxide, dinitrogen and methane emission in a subsurface flow constructed wetland. Water Sci. Technol. 2003, 48, 135–142. [Google Scholar] [CrossRef] [PubMed]
  92. Mander, U.; Dotro, G.; Ebie, Y.; Towprayoon, S.; Chiemchaisri, C.; Nogueira, S.F.; Mitsch, W.J. Greenhouse gas emission in constructed wetlands for wastewater treatment: A review. Ecol. Eng. 2014, 66, 19–35. [Google Scholar] [CrossRef]
  93. Wernet, G.; Bauer, C.; Steubing, B.; Reinhard, J.; Moreno-Ruiz, E.; Weidema, B. The ecoinvent database version 3 (part I): Overview and methodology. Int. J. Life Cycle Assess. 2016, 1218–1230. [Google Scholar] [CrossRef]
  94. GIZ; IWA. Energy Performance and Carbon Emissions Assessment and Monitoring (ECAM) Tool. Available online: http://wacclim.org/ecam/index.php (accessed on 20 February 2018).
  95. Dos Santos, I.F.S.; Barros, R.M.; Tiago Filho, G.L. Electricity generation from biogas of anaerobic wastewater treatment plants in Brazil: An assessment of feasibility and potential. J. Clean. Prod. 2016, 126, 504–514. [Google Scholar] [CrossRef]
  96. Ravindranath, N.H.; Ramakrishna, J. Energy options for cooking in India. Energy Policy 1997, 25, 63–75. [Google Scholar] [CrossRef]
  97. Vu, T.K.V.; Vu, D.Q.; Jensen, L.S.; Sommer, S.G.; Bruun, S. Life Cycle Assessment of Biogas Production in Small-scale Household Digesters in Vietnam. Asian Australas. J. Anim. Sci. 2015, 28, 716–729. [Google Scholar] [CrossRef] [Green Version]
  98. DEFRA. Future Water: The government’s Water Strategy for England; District Statistics & Evaluation Office: Norwich, UK, 2008. [Google Scholar]
  99. Hutson, S.S.; Barber, N.L.; Kenny, J.F.; Linsey, K.S.; Lumia, D.S.; Maupin, M.A. Estimated Use of Water in the United States in 2000. Available online: https://pubs.usgs.gov/circ/1344/pdf/c1344.pdf (accessed on 20 February 2018).
  100. Friedrich, E.; Pillay, S.; Buckley, C. Environmental life cycle assessments for water treatment processes—A South African case study of an urban water cycle. Water Sa 2009, 35, 2731–2760. [Google Scholar] [CrossRef]
  101. Venkatesh, G.; Brattebø, H. Energy consumption, costs and environmental impacts for urban water cycle services: Case study of Oslo (Norway). Energy 2011, 36, 792–800. [Google Scholar] [CrossRef]
  102. Ball, A.; Ahmad, S.; Mccluskey, C.; Pham, P.; Ahn, I.; Dawson, L.; Nowakowski, D. Australian Energy Update 2016. Available online: https://www.industry.gov.au/Office-of-the-Chief-Economist/Publications/Documents/aes/2016-australian-energy-statistics.pdf (accessed on 20 February 2018).
  103. Miller, L.A.; Ramaswami, A.; Asce, M.; Ranjan, R. Contribution of Water and Wastewater Infrastructures to Urban Energy Metabolism and Greenhouse Gas Emissions in Cities in India. J. Environ. Eng. 2013, 139, 738–745. [Google Scholar] [CrossRef]
  104. Gikas, P. Towards energy positive wastewater treatment plants. J. Environ. Manag. 2017, 203, 621–629. [Google Scholar] [CrossRef] [PubMed]
  105. De Haas, D.; Hartley, K. Greenhouse gas emissions from BNR plant-do we have the right focus? In Proceedings of the Sewage Management-Risk Assessment and Triple Bottom Line, Queensland, Australia, 7 June 2004. [Google Scholar]
  106. Pescod, M.B. Wastewater Treatment and Use in Agriculture. Food and Agriculture Organization of the United Nations. Available online: http://www.fao.org/docrep/t0551e/t0551e00.htm#Contents (accessed on 20 February 2018).
  107. US EPA. Process Design Manual: Land application of Sewage Sludge and Domestic Septage; US Environmental Protection Agency, Office of Research and Development: Washington, DC, USA, 1995. [Google Scholar]
  108. Sophie, B. The State of the Promotion of Biogas from Wastewater Plants in France and Europe. Available online: http://www2.agroparistech.fr/IMG/pdf/syn08-eng-Bonnier.pdf (accessed on 20 February 2018).
  109. Suzuki, A.B.P.; Fernandes, D.M.; Pereira Faria, R.A.; Vidal, T.C.M. Use of biogas in internal combustion engines. Brazil. J. Appl. Technol. Agric. Sci. 2011, 41, 221–237. [Google Scholar] [CrossRef]
  110. Mohr, M.; Iden, J.; Beckett, M. Guideline: Vacuum Sewer Systems. Available online: http://www.unescap.org/sites/default/files/Guideline_VacuumSewerSystems_Fraunhofer IGB_2016_0.pdf (accessed on 20 February 2018).
  111. Cooper, P.F. The performance of vertical flow constructed wetland systems with special reference to the significance of oxygen transfer and hydraulic loading rates. Water Sci. Technol. 2005, 51, 81–90. [Google Scholar] [CrossRef] [PubMed]
  112. Leverenz, H.L.; Tchobanoglous, P.E.G.; Jeannie, P.E.; Darby, L. Evaluation of greenhouse gas emissions from septic tanks. Available online: www.werf.org (accessed on 20 February 2018).
  113. Hoffmann, H.; Platzer, C.; Winker, M.; Münch, E.V. Technology Review of Constructed Wetlands; von Muench, E., Ed.; GIZ GmbH: Eschborn, Germany, 2011. [Google Scholar]
  114. Genzowsky, K.; Rohn, A.; Bolle, F.-W.; Merkel, W. Methodenentwicklung zur Bewertung von Siedlungswasserwirtschaftlichen und Wasserwirtschaftlichen Anlagen Hinsichtlich ihres Ökologischen Fußabdrucks; IWW Zentrum Wasser: Aachen, Germany, 2011. [Google Scholar]
  115. Tharani, K.; Dahiya, R. Comparative analysis of DG and solar PV water pumping systems. AIP Conf. Proc. 2016, 20019. [Google Scholar] [CrossRef]
  116. Odeh, I. Introducing new design and performance points for photovoltaic water pumping systems based on long-term field data analysis. J. Renew. Sustain. Energy 2013, 5, 23135. [Google Scholar] [CrossRef]
  117. Posorski, R. Photovoltaic water pumps, an attractive tool for rural drinking water supply. Sol. Energy 1996, 58, 155–163. [Google Scholar] [CrossRef]
  118. CPHEEO. Manual on Water Supply and Treatment; Ministry of Drinking Water and Sanitation, Government of India: New Delhi, India, 1999.
  119. Lohan, S.K.; Dixit, J.; Kumar, R.; Pandey, Y.; Khan, J.; Ishaq, M.; Kumar, D. Biogas: A boon for sustainable energy development in India’s cold climate. Renew. Sustain. Energy Rev. 2015, 43, 95–101. [Google Scholar] [CrossRef]
  120. Balasubramaniyam, U.; Zisengwe, L.S.; Meriggi, N.; Buysman, E. Biogas Production in Climates with Long Cold Winters. Available online: http://www.build-a-biogas-plant.com/PDF/BALASUBRAMANIYAM-2008-Biogas-Production-in-Climates-with-long-cold-Winters.pdf (accessed on 20 February 2018).
  121. Bansal, N.K. A Technoeconomic Assessment of Solar-Assisted Biogas Systems. Energy Sour. 1988, 10, 213–229. [Google Scholar] [CrossRef]
  122. Stranddorf, H.K.; Hoffmann, L.; Schmidt, A.; FORCE Technology Denmark. Impact Categories, Normalisation and Weighting in LCA. Available online: https://www2.mst.dk/udgiv/publications/2005/87-7614-574-3/pdf/87-7614-575-1.pdf (accessed on 20 February 2018).
Figure 1. Three scenarios for water reclamation with resource recovery in Leh, India.
Water 11 00906 g001
Figure 2. Types of emissions captured in this study.
Water 11 00906 g002
Figure 3. GHG emissions per m3 of treated water in the 3 scenarios.
Water 11 00906 g003

