Projected Rainfall Erosivity Over Central Asia Based on CMIP5 Climate Models
by
 , ,
, ,
Eldiiar Duulatov
1,2,3 ,
,
Xi Chen
1,2,*, 
Amobichukwu C. Amanambu
1,2,4,
Friday U. Ochege
1,2,5,
Rustam Orozbaev
3,6,
Gulnura Issanova
7,8,9 and
Gulkaiyr Omurakunova
1,2 1
State Key Laboratory of Desert and Oasis Ecology, Xinjiang Institute of Ecology and Geography, Chinese Academy of Sciences, Urumqi 830011, China
2
University of Chinese Academy of Science, Beijing 100049, China
3
Institute of Geology, National Academy of Sciences of Kyrgyz Republic, 30 Erkindik, Bishkek 720040, Kyrgyzstan
4
Department of Geography, University of Florida, Gainesville, FL 32611-7315, USA
5
Department of Geography and Environmental Management, University of Port Harcourt, East-West Rd., PMB 5323 Choba, Port Harcourt, Rivers State, Nigeria
6
Applied Geology Department, American University of Central Asia, 7/6 Aaly Tokombaev, Bishkek 720060, Kyrgyzstan
7
Faculty of Geography and Environmental Sciences, Al-Farabi Kazakh National University, Ave. Al-Farabi 71, Almaty 050040, Kazakhstan
8
Institute of Natural Sciences and Geography, Abai Kazakh National Pedagogical University, Ave. Dostyk 13, Almaty 050010, Kazakhstan
9
Research Centre for Ecology and Environment of Central Asia (Almaty), Ave. Al-Farabi 75 V, Almaty 050060, Kazakhstan
*
Author to whom correspondence should be addressed.
Water 2019, 11(5), 897; https://doi.org/10.3390/w11050897
Submission received: 23 February 2019
/
Revised: 23 April 2019
/
Accepted: 24 April 2019
/
Published: 28 April 2019
(This article belongs to the Special Issue Rainfall Erosivity in Soil Erosion Processes)
Abstract
:Climate change-induced precipitation variability is the leading cause of rainfall erosivity that leads to excessive soil losses in most countries of the world. In this paper, four global climate models (GCMs) were used to characterize the spatiotemporal prediction of rainfall erosivity and assess the effect of variations of rainfall erosivity in Central Asia. The GCMs (BCCCSM1-1, IPSLCM5BLR, MIROC5, and MPIESMLR) were statistically downscaled using the delta method under Representative Concentration Pathways (RCPs) 2.6 and 8.5 for two time periods: “Near” and “Far” future (2030s and 2070s). These GCMs data were used to estimate rainfall erosivity and its projected changes over Central Asia. WorldClim data was used as the present baseline precipitation scenario for the study area. The rainfall erosivity (R) factor of the Revised Universal Soil Loss Equation (RUSLE) was used to determine rainfall erosivity. The results show an increase in the future periods of the annual rainfall erosivity compared to the baseline. For all GCMs, with an average change in rainfall erosivity of about 5.6% (424.49 MJ mm ha−1 h−1 year−1) in 2030s and 9.6% (440.57 MJ mm ha−1 h−1 year−1) in 2070s as compared to the baseline of 402 MJ mm ha−1 h−1 year−1. The magnitude of the change varies with the GCMs, with the largest change being 26.6% (508.85 MJ mm ha−1 h−1 year−1), occurring in the MIROC-5 RCP8.5 scenario in the 2070s. Although annual rainfall erosivity shows a steady increase, IPSLCM5ALR (both RCPs and periods) shows a decrease in the average erosivity. Higher rainfall amounts were the prime causes of increasing spatial-temporal rainfall erosivity.
1. Introduction
Soil is a fragile resource that requires time to recover. Without soil, agricultural production is inconceivable, and the sustenance of the well-being of people will be impossible [1]. Soil erosion is the combination of natural and anthropogenic processes foremost to changes in soil functions in the geosystem, quantitative and qualitative degradation of soil composition, properties, and regimes, and reduction of the natural and economic importance of lands [2]. Soil erosion by water is the most common type of soil erosion, affecting about 11 million km2 in the world [3]. Among the continents, Asia ranks first in soil erosion severity [3,4]. Soil degradation also brings enormous economic damage, disrupts the ecological balance and worsens social conditions of people [5]. The scientifically grounded and rational use of lands largely depends on the correct identification and establishment of the degree or category of erosion of the soil cover and accurate accounting for their correct nomenclature and classification. Thus, one of the most important tasks of this century is to ensure water and food security through effective agricultural productivity and reduced soil erosion [6,7].
Currently, agriculture remains an essential sector of the economy of Central Asia, providing 5.2% of gross domestic product (GDP) in Kazakhstan, 7.5% in Turkmenistan, 18.5% in Uzbekistan, 20.8% in Kyrgyzstan and 23.3% in Tajikistan [8], which employs between 20–50% of the Central Asian workforce [9]. Consequently, a better understanding of the impact of climate change on soil erosion processes is also paramount to the economy of Central Asia.
It should be noted that in recent years, climatic conditions in the Central Asian countries have changed owing to the reduction of glacier areas of the Tien Shan [10,11,12] and Pamir-Alay [13,14] mountain systems in the south and the drying up of the Aral Sea [15,16] in the north. In this regard, the shortage of water for irrigation, degraded natural vegetation covers, erosion processes and salinization are on the rise, while the productive capacity of irrigated lands is decreasing [8]. Humanity faces an urgent problem—the preservation of existing natural landscapes, which includes, improving and multiplying its types.
Rainfall erosivity is associated with the influential kinetic energy of raindrops, which often separates soil elements and transports them along with surface runoff [17]. Rainfall erosivity is the most significant factor and offers conservation actions by models of soil erosion prediction [18]. The rainfall erosivity (R) factor is usually adopted in soil erosion calculation models, such as the Universal Soil Loss Equation (USLE) [19] and its revised version (RUSLE) [20]. Rainfall erosivity in USLE (RUSLE) is defined as the long-term average product of total rainfall energy and maximum precipitation intensity over 30 min (EI30) for storm events [19,20]. Data on the pluviograph for at least 20 years is required to calculate the original rainfall erosivity [20]. However, such data (EI30) is not available in many countries and regions, and the processing of this data is quite tedious and time-consuming [21,22]. This also applies to Central Asia, where precipitation data with good temporal coverage is still scarce. However, numerous studies have established a statistical regression equation between R and variable rainfall, such as annual rainfall [4,23,24,25]. More recently, there has been evidence of the influence of climate change on rainfall erosivity in various parts of the globe [7,17,26,27,28].
Climate change is one of the most significant environmental issues of the 21st century [29,30]. Climate changes that are related to soil erosion mainly include changes in temperature and precipitation [31]. Climate change may influence rainfall erosivity alteration in precipitation patterns [17,32]. The characteristics of precipitation (amount of precipitation, its intensity and spatial-temporal distribution) directly affect soil erosion [33]. Similarly, an increase in temperature indirectly affects soil erosion [31]. The addition of water vapor to the atmosphere has an impact on the nature of climate circulation, thereby altering the intensity, frequency of extreme precipitation [7]. In arid and semi-arid climates, such as in Central Asia, there will be a more significant increase in temperature and rainfall events than in many other regions of the world [34,35].
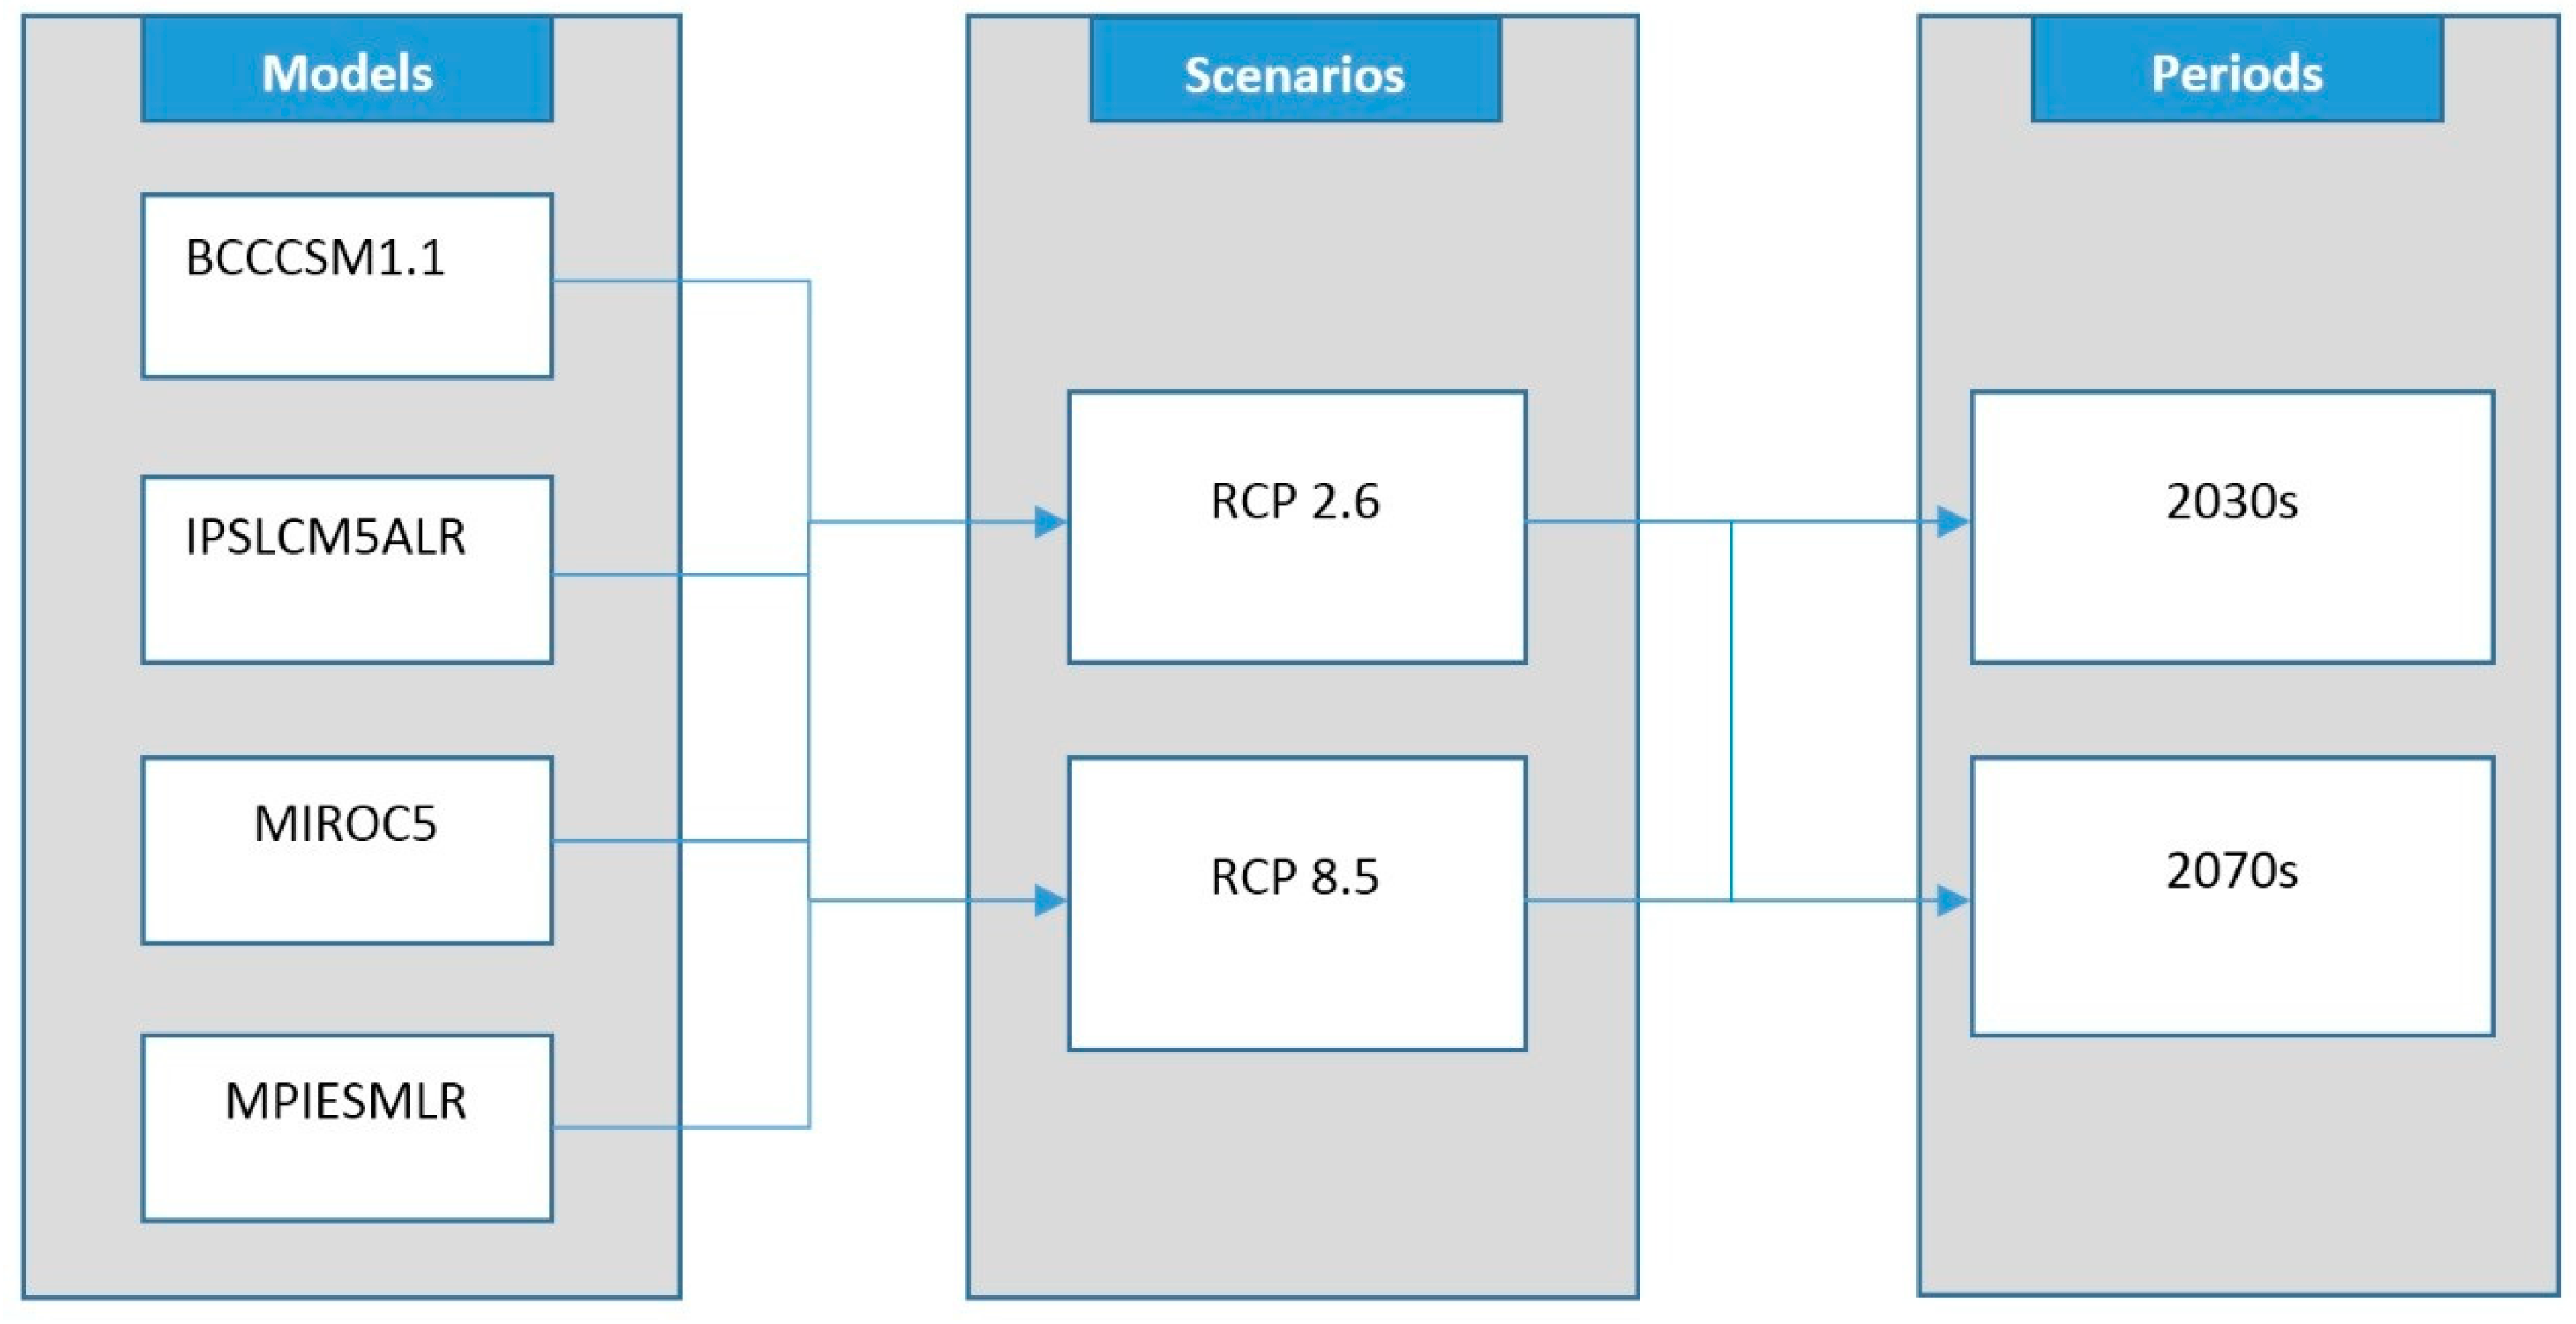
The spatial and temporal projection of future rainfall erosivity in a changing climate in Central Asia has not been studied. Thus, the objective of this paper is to predict the value of rainfall erosivity and erosivity density in the 2030s and 2070s. We used WorldClim data [36] and the climate projections from four GCMs, Beijing Climate Center, Climate System Model 1.1 (BCCCSM1.1), Institut Pierre Simon Laplace Model CM5A-LR (IPSLCM5ALR), Model for Interdisciplinary Research On Climate version 5 (MIROC5), and the Max Planck Institute for Meteorology (MPIESMLR), with RCP2.6, and RCP8.5 scenarios.
2. Materials and Methods
2.1. Study Area
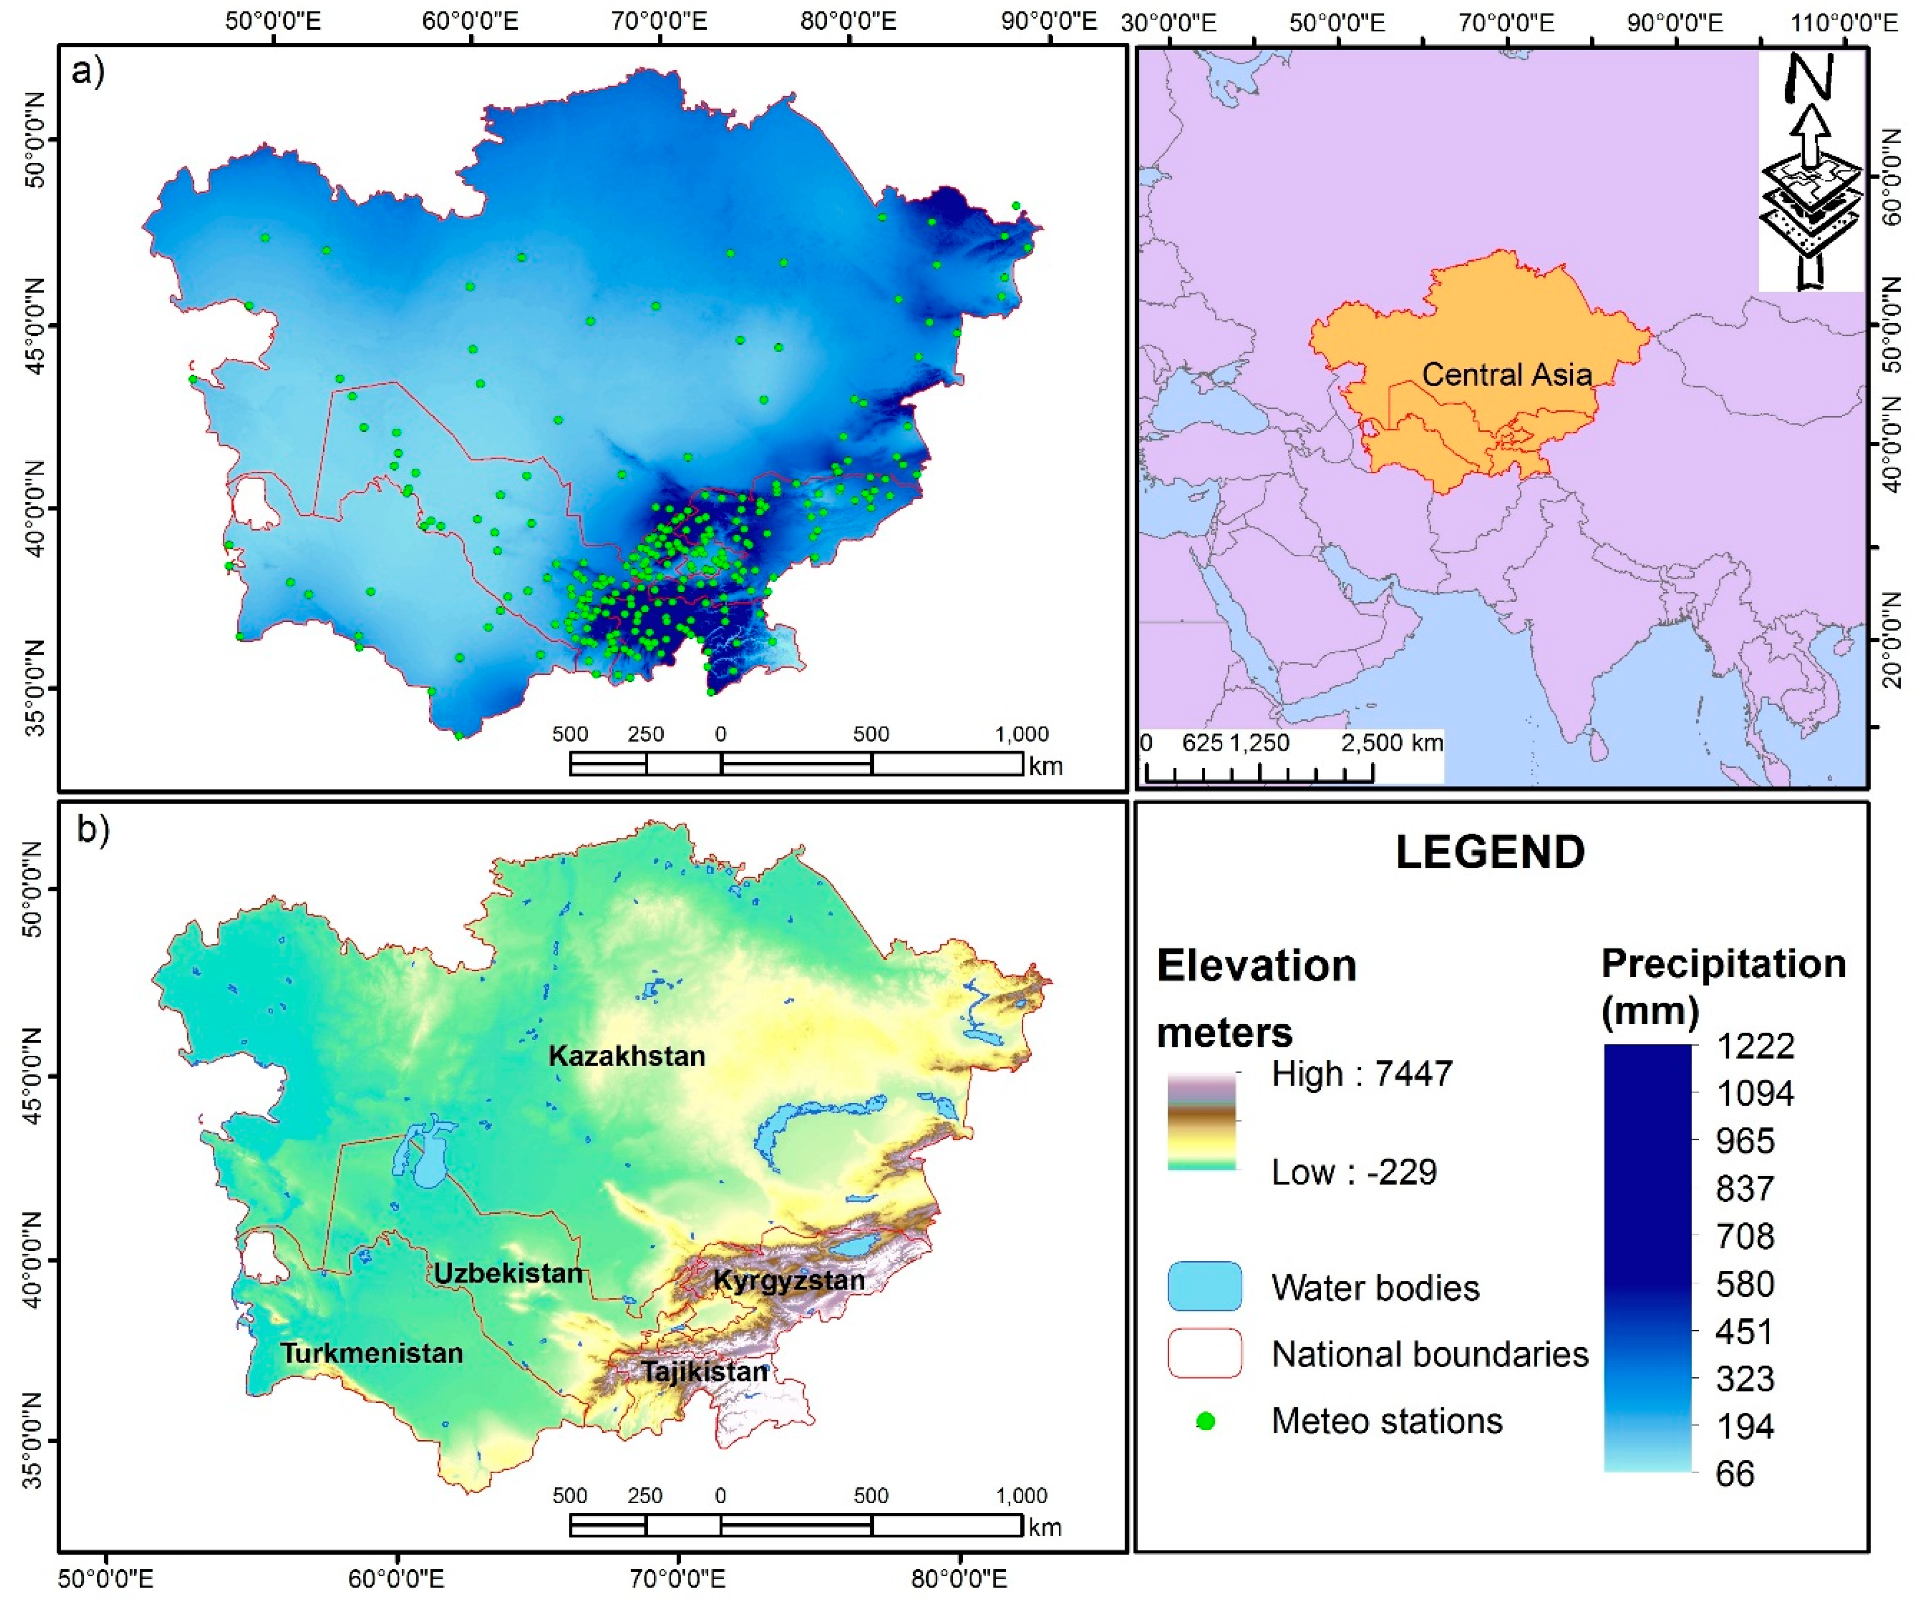
Central Asia occupies a vast territory on the Asian continent and includes the Kyrgyz Republic, the Republic of Tajikistan, the Republic of Turkmenistan, the Republic of Uzbekistan and the Republic of Kazakhstan entirely [37]. These five countries cover an area of 4 million km2 (46°45′28.13″–87°21′47.81″ E, 35°5′2.24″–52°33′30.49″ N) [38], with a combined population of 65 million people [8]. The nations comprising Central Asia were once part of the Soviet Union. In physical-geographical terms, the region is a separate natural-historical region, sharply differing from adjacent areas by its natural conditions. All local types of Central Asian climates can be divided into three types: (1) The climate of the temperate zone, (2) climates of the dry subtropical zone and (3) the mountain climates of Tien Shan, Pamir-Alai, Pamir and Kopetdag with a well-marked altitudinal zonation [37]. Average annual precipitation in Central Asia is 254 mm, the minimum is 66 mm, and the maximum is 1222 mm (Figure 1a), elevation ranges from −229 to up to 7447 m (Figure 1b). Significant differences in the height of parts of this territory—from the areas lying below the ocean level to the highest mountain peaks—make here variety of climate and landscape forms. Having a long and orographically complex territory with extensive lowlands and highest mountain elevations in the south, southeast, Central Asia is characterized by a variety of climatic conditions. The climate of Central Asia is distinguished by a high continentality, marked by a great amplitude of fluctuations in air temperature and a meagre amount of precipitation [37].
2.2. Climate Data
Compared to the Coupled Model Intercomparison Project Phase 3 (CMIP3), CMIP5 is a notable improvement because it uses a new set of emission scenarios called RCPs [17,39]. Projected precipitation data from GCMs BCCCSM1-1, IPSLCM5ALR, MIROC5, and MPIESMLR for the RCP2.6 and RCP8.5 greenhouse emission scenarios were used [39] (Table 1; Figure 2). The GCMs were selected because of their relative independence, good performance in precipitation simulation for Central Asia [40] and Tibetan Plateau [33]. Global precipitation with 1 km2 horizontal resolution was obtained from the WorldClim database [36]. In assessing future changes in the erosion of rainfall and possible consequences, the predicted rainfall data for the “near” (2020–2049) and “far” future (2060–2089) have been retrieved from the Climate Change Agriculture and Food Security (CCAFS, http://www.ccafs-climate.org) portal. The data were statistically downscaled to 1 km2 horizontal resolution using the delta method [41], based on the sum of interpolated anomalies to high-resolution monthly climate surfaces from WorldClim [36]. These anomalies were then interpolated using thin plate spline interpolation [41]. These datasets were used as input data for this study.
2.3. Estimation of Rainfall Erosivity
In this paper, the rainfall erosivity (R) factor from the RUSLE model was chosen to estimate the changes in rainfall erosivity. Rainfall erosivity was calculated using the precipitation values of gridded GCMs, comparing it with WorldClim data. [19,20] described the original method of calculating erosivity as:
where is the mean annual rainfall erosivity (MJ mm ha−1 h−1 year−1), is the number of years of data, is the number of erosive events in the year and is the rainfall erosivity index of a storm . The event’s rainfall erosivity index is defined as:
where is the unit rainfall energy (MJ ha−1) and is the rainfall depth (mm) during a time period . is the maximum rainfall intensity during a 30 min period of the rainfall event (mm h−1).
where is the rainfall intensity during the period (mm h−1).
The information needed to calculate the R factor using the proposed method is usually difficult to obtain in many parts of the world. Therefore, various studies have been conducted to derive regression equations for the derivation of R factor. These simplified methods offer exceptional ease of studying the spatial and temporal variability of rainfall erosivity. Researchers [23] proposed the following equations for estimating the R factor using annual precipitation or Modified Fournier Index (MFI) in the absence of data on rainfall intensity for a particular site:
where is rainfall erosivity factor (MJ mm ha−1 h−1 year−1), is the average mean annual precipitation.
where is the rainfall erosivity (MJ mm ha−1 h−1 year−1). is Modified Fournier Index, given below [42,43].
where is annual precipitation (mm), and is the monthly rainfall.
2.4. Annual Erosivity Density Ratio
According to Kinnell [44], the erosivity density coefficient is the ratio of rainfall erosivity (R) factor to precipitation. In practice, it measures the erosivity per unit of precipitation (mm) and is expressed as MJ ha−1 h−1 (9).
where is the erosivity density, is the average annual rainfall erosivity and is the average annual precipitation.
2.5. Model Evaluation Rainfall Erosivity
To evaluate the R factor of the baseline output, we made use of precipitation data from Central Asia temperature and precipitation (CATP) data (1879–2003), version 1 from the National Snow and Ice Data Center (NSIDC) [45]. This dataset contains monthly climatic data. The performance of the rainfall erosivity model was assessed by comparing the rainfall erosivity of observation data (from 269 meteorological stations) with that of the baseline data using coefficient of determination (R2), root mean squared error (RMSE) and Nash–Sutcliff Efficiency (NSE) [46] Equations (10), (11) and (12) respectively.
where is the baseline rainfall erosivity, is the observed rainfall erosivity and is the mean of observed and baseline rainfall erosivity.
3. Results
3.1. Rainfall Erosivity Under Baseline and Projected Climate
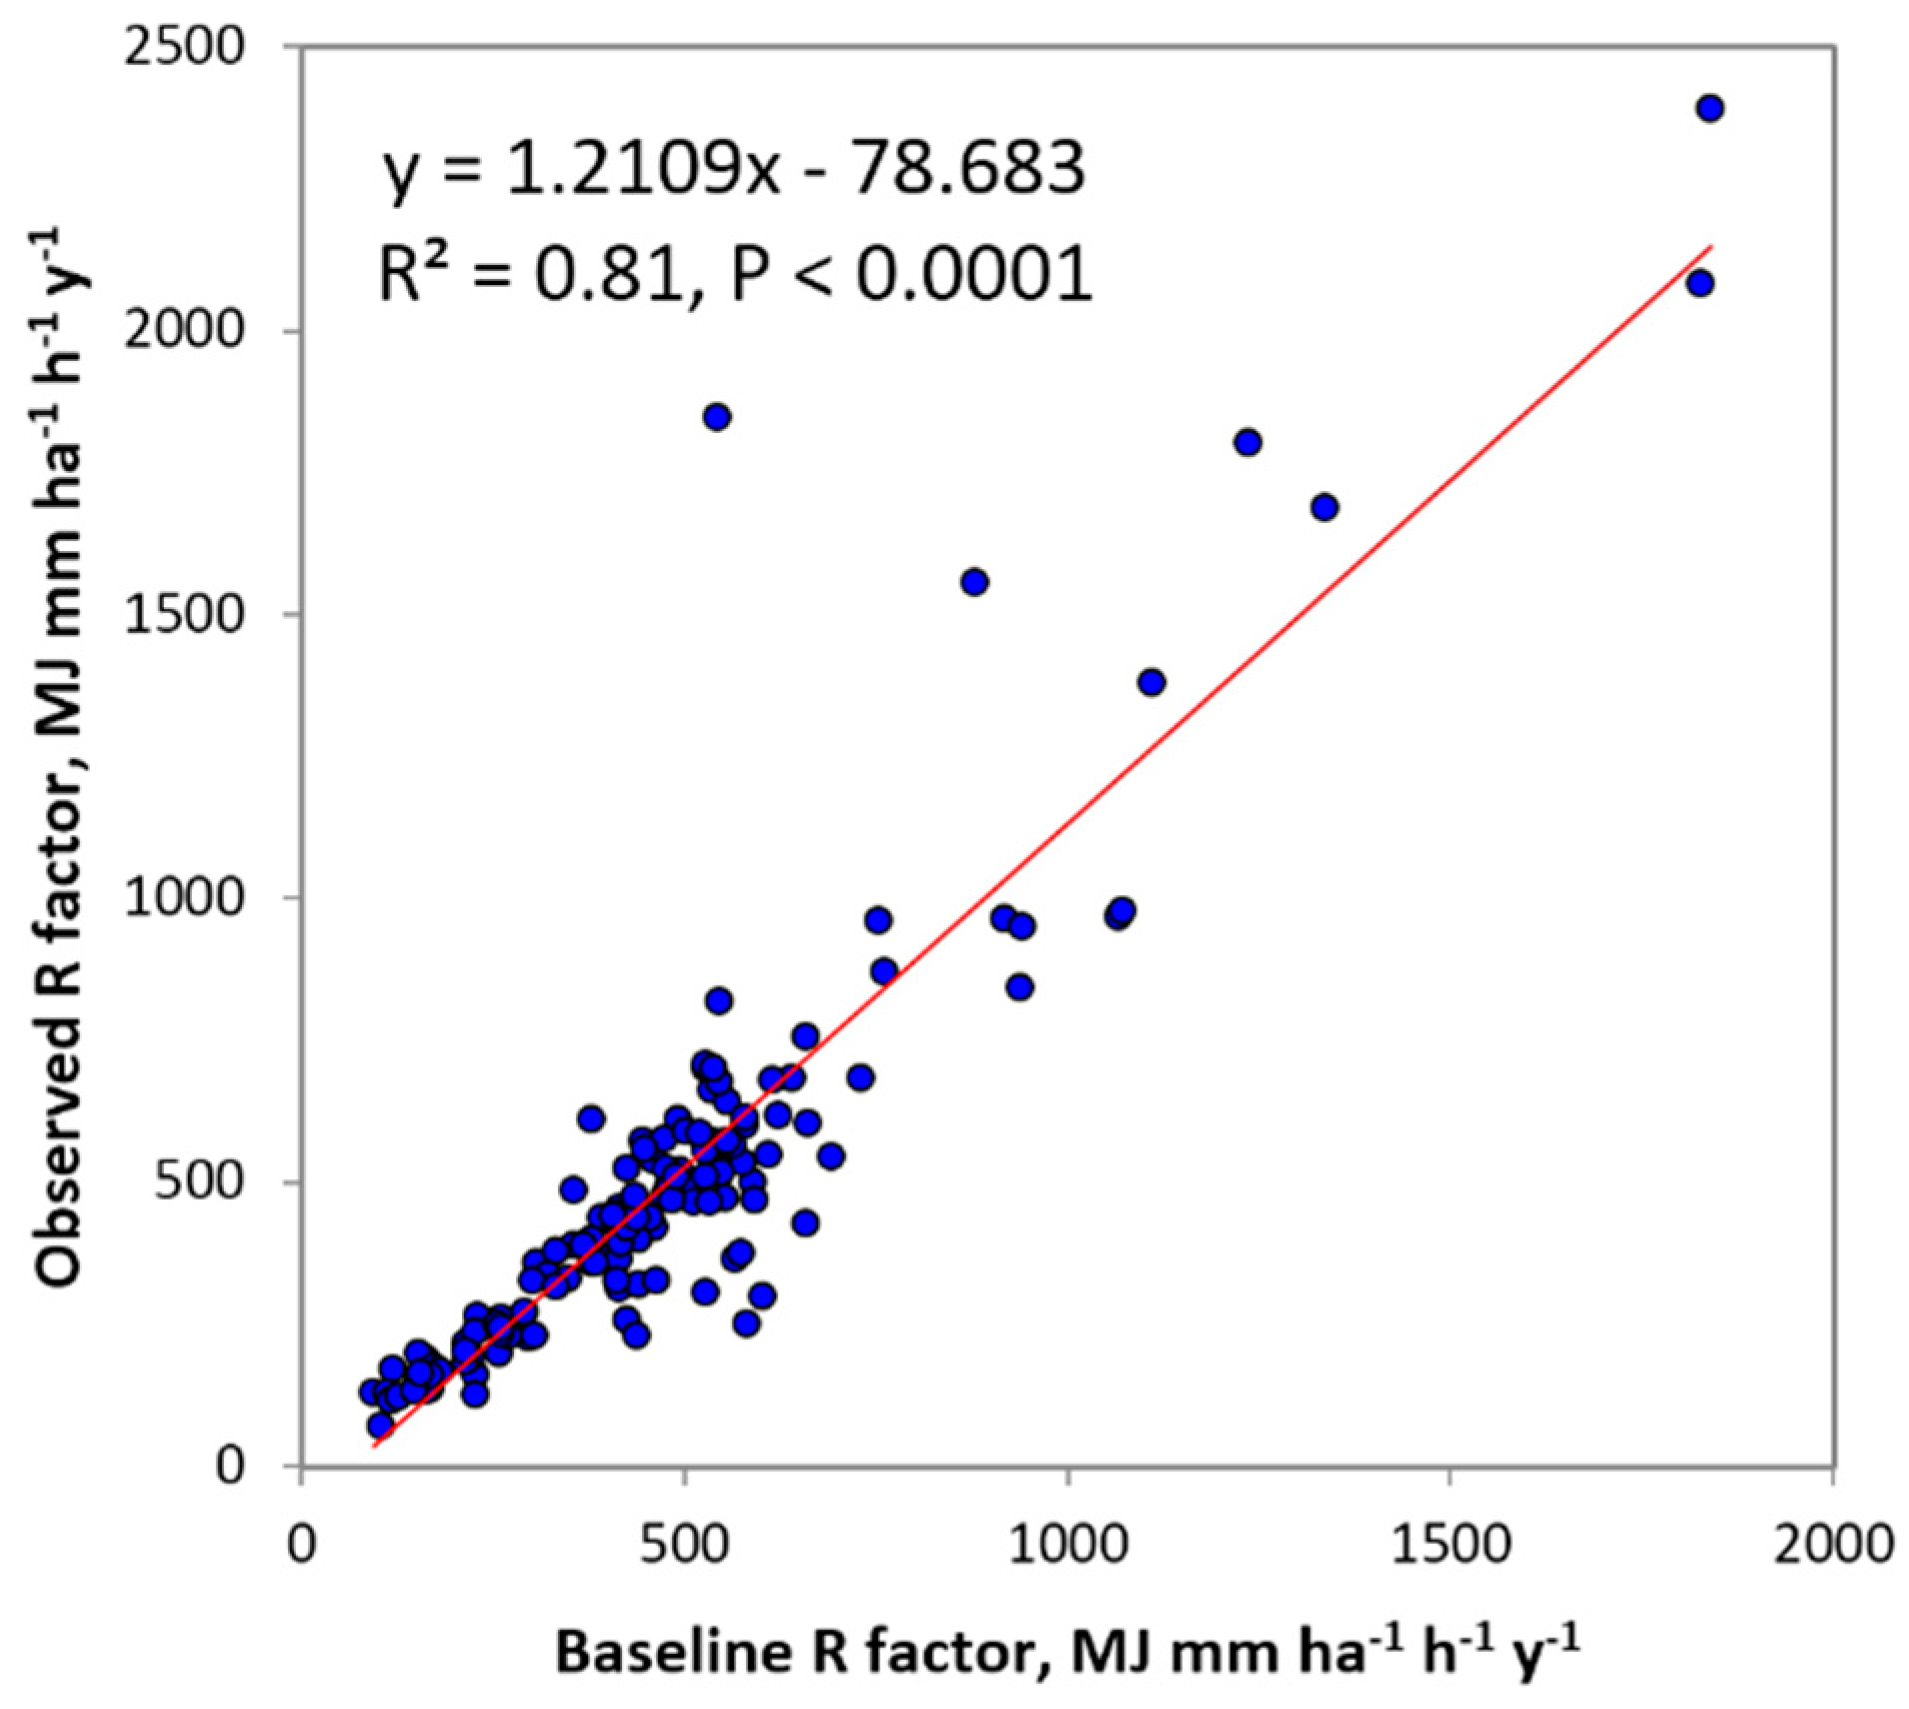
The WorldClim (baseline) and observation precipitation were statistically compared. The correlation coefficient of about 0.91 was found between the baseline and observed average monthly precipitation. The average annual rainfall erosivity for observation data ranges from 71.7–2390.3 MJ mm ha−1 h−1 year−1 with mean 497.8 MJ mm ha−1 h−1 year−1 and standard deviation 359 MJ mm ha−1 h−1 year−1. While baseline data shows the range of rainfall erosivity to be 95–1838.9 MJ mm ha−1 h−1 year−1 with mean and standard deviation 476.8 and 267.1 MJ mm ha−1 h−1 year−1, respectively. In comparison, the baseline and observed rainfall erosivity produced 0.81, 156.7 MJ mm ha−1 h−1 year−1 and 0.60 for R2, RMSE and NSE, respectively. This represents a good model performance. Figure 3 illustrates the evaluation of rainfall erosivity of both observation and baseline estimates.
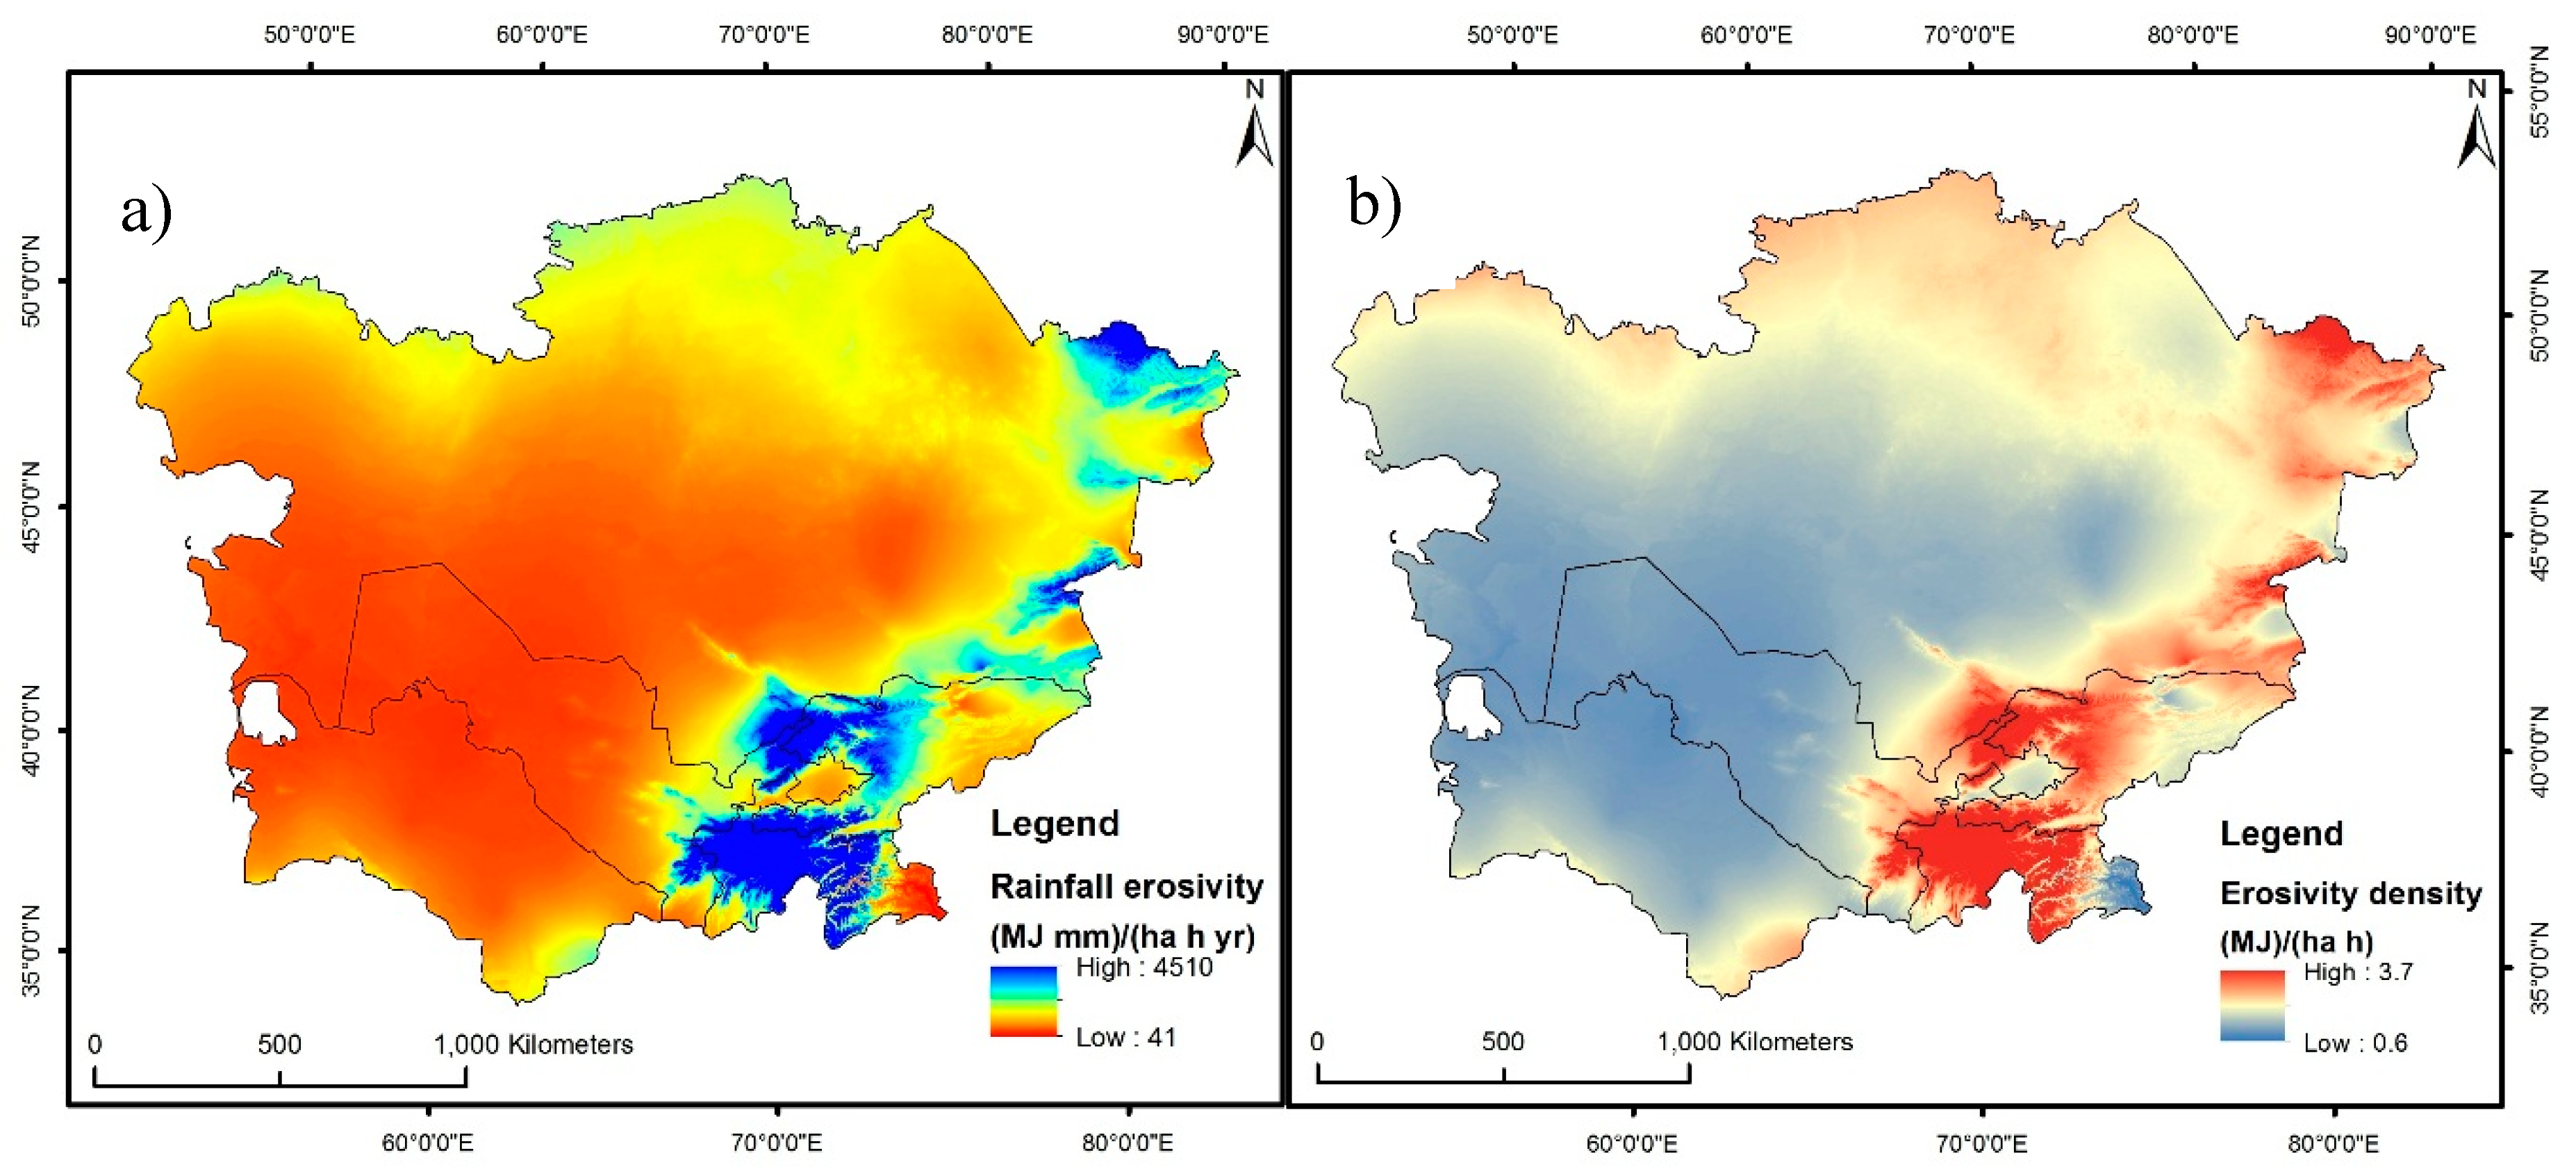
The highest annual R factor was found in the southeastern part of Central Asia, with moderate values in the northern regions, but decreased westwards, where the lowest values were recorded. On the other hand, the values gradually increased towards Tajikistan but reduced in the western parts occupied by Turkmenistan. The spatial distribution of the R factor constantly varied concerning annual precipitation in Central Asia. The estimated average annual rainfall erosivity for the baseline period ranges from 41 MJ mm ha−1 h−1 year−1 to 4510 MJ mm ha−1 h−1 year−1, in the west and southeast, respectively (Figure 4a).
The MIROC5 RCP2.6 and 8.5 show higher rainfall erosivity, perhaps due to the strongly projected spatial difference in rainfall with these scenarios. In all the GCMs and baseline precipitation, the R factor in Tajikistan, Kyrgyzstan, east Uzbekistan, and east Kazakhstan is higher but lower in Turkmenistan, northwest Uzbekistan, southwest and central Kazakhstan (Figure 5). Also, Figure 6 shows the relative difference between the four projected scenarios and the baseline.
Table 2 presents the effects of rainfall on historical and projected rainfall erosivity and erosivity density in Central Asia. GCM ensembles show that rainfall erosivity increases from the baseline in all ensembles, except BCCCSM1.1-8.5 in 2070s and IPSLCM5ALR both RCPs (2030 and 2070). The average value of all scenarios shows that precipitation increased in the 2030s to 262 mm and 2070s to 268 mm, from the baseline (254 mm). Nevertheless, MIROC5 (the 2030s and 2070s, both RCP) predicted a higher increase in precipitation than other models with similar scenarios and periods.
Precipitation, erosivity and density differ accordingly given that the GCMs exhibited consistent variations as shown in Table 2. Although average precipitation and rainfall erosivity demonstrate a steady increase in all the GCMs in combination with the baseline precipitation output, IPSLCM5ALR however shows a decline in average precipitation and erosivity in both periods.
3.2. Rainfall Erosivity at the National Level
In the baseline period, Kyrgyzstan had an estimated average rainfall erosivity of 869.7 MJ mm ha−1 h−1 year−1. The MIROC5 and MPIESMLR scenarios (RCP2.6 and RCP8.5), respectively project an increase in the mean rainfall erosivity ranged from 27.9–50.1% and from 0.9–27%. The BCCCSM1.1 scenarios also projected a mean increase of 6.3% for all periods and a decrease (−7.8%) for the BCCCSM1.1-8.5 in the 2070s.
In Kazakhstan, we calculated the mean values of rainfall erosivity of 374.3 MJ mm ha−1 h−1 year−1 during the baseline period. From MIROC5, BCCCSM1.1 and MPIESMLR (both scenarios), we noted an increase of 5.3% to 27.3%, 11.6% to 23.2 and 0.6% to 15.7%, respectively, in mean rainfall erosivity in this country with a slight increase in the northern part and a substantial increase in the eastern part of this country. We also found results using IPSLCM5ALR for both scenarios, with decreases ranging from −0.3% to 1.6%, except RCP8.5 (the 2070s) with an increase of 1.5%.
The average rainfall erosivity in Turkmenistan for the baseline period was 188.4 MJ mm ha−1 h−1 year−1. This country has the lowest rainfall erosivity among all Central Asian countries. The ensemble scenarios of IPSLCM5ALR and BCCCSM1.1 (RCP2.6 and RCP8.5) predict decrease from −10.1% to −19%, and from −7.1% to −16% respectively. However, BCCCSM1.1-2.6 (2070s) predicts about 10.5% increase in rainfall erosivity. The MPIESMLR and MIROC5 results indicate changes from 2.3% to 14.3, and from 3.7% to 19.6%, while MIROC5-2.6 (2070s) decreased (−4.7%) during the two-time slices for the two emission scenarios.
For Tajikistan, an average rainfall erosivity of 1447.7 MJ mm ha−1 h−1 year−1 in the baseline period was revealed. The increase was observed in the MIROC5 and MPIESMLR scenarios thereby, indicating the highest rainfall erosivity in the study area. However, there is also a decrease in the average rainfall erosivity in this country for IPSLCM5ALR (both scenarios and both periods), BCCCSM1.1-8.5 (both periods) and MPIESMLR-2.6 (the 2030s) compared to the baseline. For both scenarios, MIROC5 projected increases in erosivity from 34.3% to 56.3%. IPSLCM5ALR estimated decreases from −8.2% to −26.2%.
Uzbekistan had an average baseline rainfall erosivity of 282.1 MJ mm ha−1 h−1 year−1. The MIROC5 scenarios (RCP2.6 and RCP8.5) projected an average increase ranging from 2.1–24.1%. The MPIESMLR projected a mean increase ranging from 7–15.3%, except for a decrease of −2.7% for the RCP2.6 (the 2030s). IPSLCM5ALR projected decreases in the mean annual rainfall erosivity from −7.7% to 28.2%. In general, all scenarios estimated an increase and decrease in rainfall erosivity over Uzbekistan (Table 3). Our result (<280 MJ mm ha−1 h−1 year−1) is comparable with [18], which reported low average erosivity values (<250 MJ mm ha−1 h−1 year−1) in Kazakhstan, Turkmenistan, and Uzbekistan.
3.3. Annual Erosivity Density
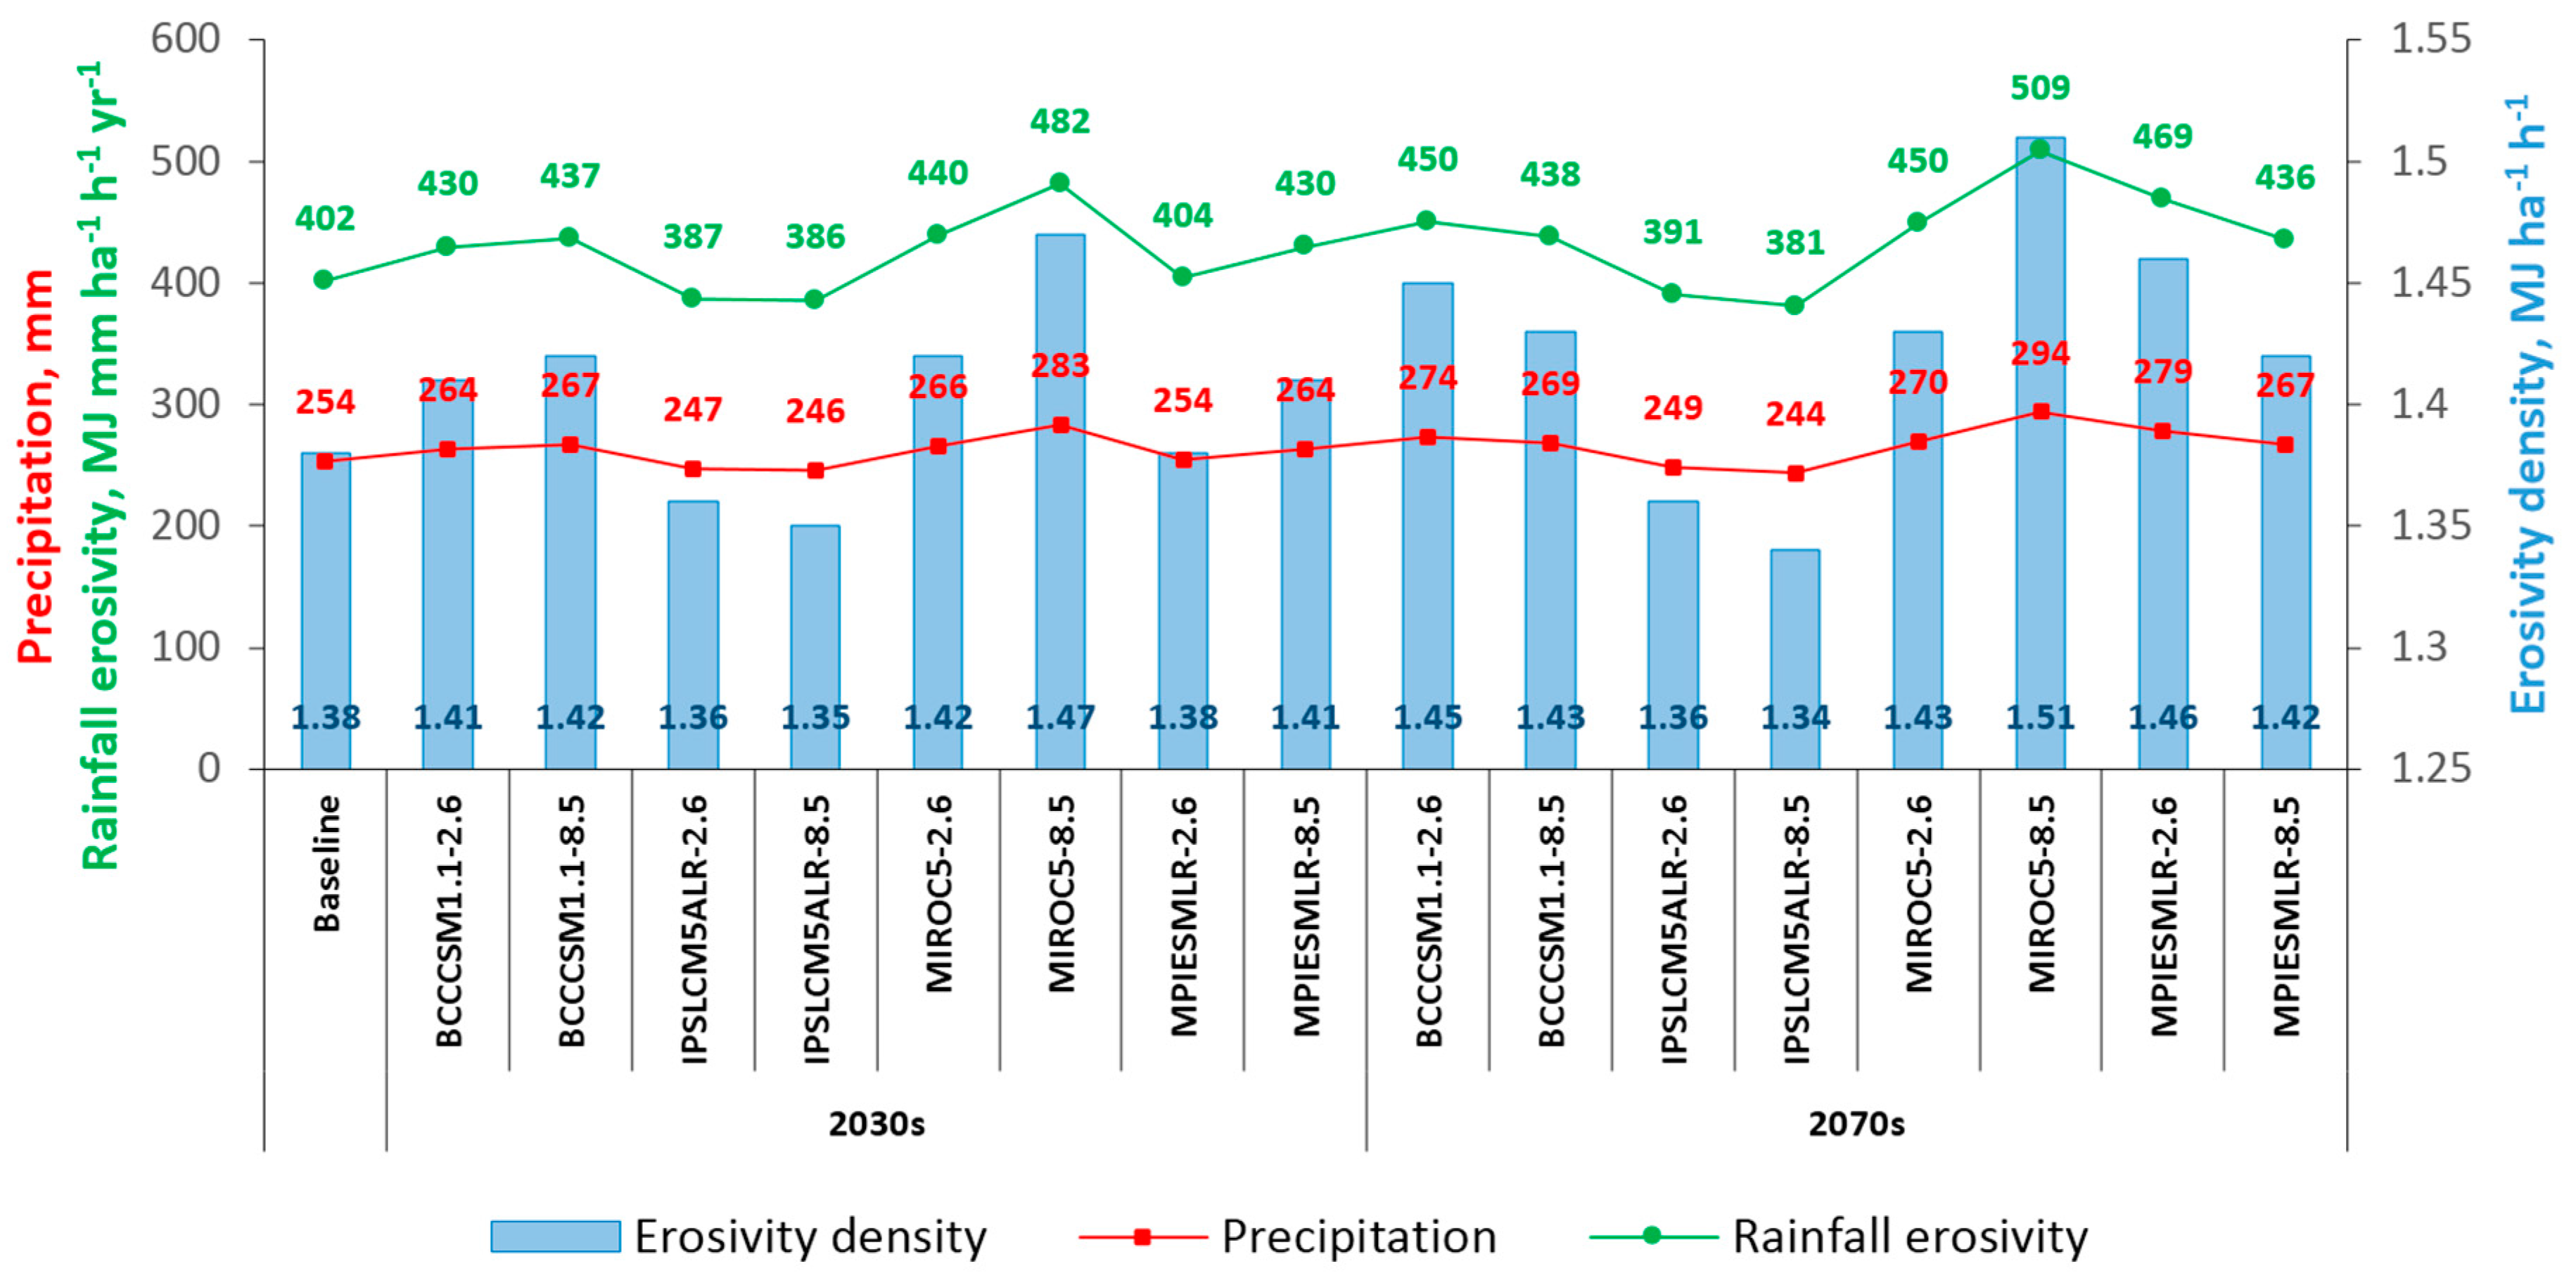
Separately projected annual erosivity results (Figure 5) are divided by a corresponding average rainfall data to derive average erosivity density ratio. Density values of erosivity above 1 suggest that a certain amount of precipitation may lead to relatively higher rainfall erosivity [47]. The annual erosivity density for baseline period has a mean value of 1.38 MJ ha−1 h−1, with variability ranging from 0.62–3.69 MJ ha−1 h−1 (Figure 4b). The projected variation of erosivity density is also very high as the MIROC5-8.5 has the highest mean erosivity density with 1.47 and 1.51 MJ ha−1 h−1 in the 2030s and 2070s, respectively. Followed by MPIESMLR-2.6 with 1.46 MJ ha−1 h−1 in 2070s, BCCCSM1.1-2.6 and BCCCSM1.1-8.5 with 1.45 and 1.43 in 2070s. However, IPSLCM5ALR-2.6 and IPSLCM5ALR-8.5 (both periods) have the lowest mean erosivity density with an average of 1.35 MJ ha−1 h−1 (Table 2; Figure 7 and Figure 8).
4. Discussion
The influence of climate change on rainfall erosivity is expressed by variations in total precipitation, as shown in the result section. The Tien Shan, Pamir-Alay and Pamir mountains experience more torrential rainfall compared to the surrounding low-lying deserts. Changes in precipitation mainly depend on changes in the water content in the atmosphere, which is transferred from the oceans to the earth through large-scale atmospheric circulation [40]. Atmospheric circulation over Central Asia is characterized by the predominance of the west-east transfer of air masses when the main moisture that gives precipitation comes from the North Atlantic Ocean [37,48,49,50]. Most of the low-latitude region (40° N) is marked by low-pressure anomalies [50]. As the air masses move from the Atlantic Ocean, they lose moisture to become dry air mass as they approach the territory—causing little or no precipitation in summer [37]. El Niño Southern Oscillation (ENSO) has affected precipitation changes over the arid regions of Central Asia by the southwestward flow of water vapor coming from the Arabian Sea and tropical Africa [48,49,51]. ENSO-induced precipitation is related to large-scale atmospheric circulation changes caused by sea surface temperature (SST) [52]. Previous studies have shown that changes in SST have a significant impact on the transport of water vapor from the oceans to land [40,53]. The main feature in the distribution of precipitation in Central Asia is their small annual amount of the lower part of the territory, resulting in vast deserts. At the same time, on the shores of the Caspian Sea, and especially Balkhash Lake, precipitation is generally low. Only in the mountains—on the outer windward slopes, where the air masses experience a forced rise, resulting to cooling, reaching a state of saturation—does the orographic increase in precipitation occur 3–5 times or more compared to the surrounding deserts [37]. This fact explains the spatial distribution of precipitation in Central Asia and, in turn, may clarify why some parts have higher erosion than other parts. This results in precipitation variability that consequently influences erosion.
As stated by [17], erosion will be affected by changes in precipitation patterns and quantities due to climate change. Studies in the Eurasian continent predicted a significant increase or decrease in erosivity for the future climate. For example, [26] found that 81% of the territory in Europe is projected to have an increase in rainfall erosivity and 19% rainfall erosivity projected to decrease by 2050 (HadGEM2, RCP4.5 scenario). Likewise, however, our study predicts some spatial variability in erosivity for Central Asia concerning the anthropogenic influence on the amount of precipitation based on different GCMs (Table 2 and Table 3, Figure 5, Figure 6 and Figure 8).
Also, the dynamic influence of climate change on soil erosion is another essential factor that is uncertain; however, it may depend on the interacting impacts of the associated factors. Nonetheless, future soil erosion rates are expected to increase due to increased precipitation and rainfall erosivity. Moreover, this has been confirmed in other prediction studies (e.g., [17,27,28,54]), an increase in precipitation and intensity will significantly impact soil erosion rates. The highest percentage of rainfall erosivity occurs in medium and high regions of Tajikistan, Kyrgyzstan, Eastern Uzbekistan, and East Kazakhstan. Besides, this suggests that there will be more occasions for soil losses at medium and high altitudes than has ever been experienced in the past. Consequently, high soil erosion may lead to high sedimentation in rivers, lakes, and reservoirs, and these are critical for flooding and water pollution [4]. Small percent variations are usually expected in developed areas, which generally have gentle slopes and less hilly areas. The variability of our results shows the disagreements in scenarios, periods and climate models, but may also show persistent uncertainty in our models.
Preservation of fertile soils by agricultural lands, pastures, and forests is the primary condition for the sustainable development of humanity. The possible increase in rainfall erosivity in Tajikistan and Kyrgyzstan may affect a significant part of agricultural production in Central Asia due to increased soil loss and reduced soil fertility and water availability. On the other hand, a reduction in the rainfall erosivity over Turkmenistan and western Uzbekistan can strengthen the trend of agricultural development in these areas. However, climate change can significantly affect land cover, which can balance or reinforce some erosion trends. To predict future soil erosion trends, these feedbacks between precipitation and land cover should be evaluated.
5. Conclusions
In this research, we estimated the potential influence of climate change on rainfall erosivity and erosivity density in Central Asia using baseline data (1960–1990) and projected precipitation data (2020–2049 and 2060–2089). The projected precipitation was taken from the downscaled data of four GCM, BCCCSM1.1, IPSLCM5ALR, MIROC5, and MPIESMLR, based on two scenarios, RCP2.6, and RCP8.5. The mean erosion of rainfall in Central Asia was calculated and compared with climate scenario predictions. The mean rainfall erosivity within the baseline period was 497.8 MJ mm ha−1 h−1 year−1, as compared to 476.8 MJ mm ha−1 h−1 year−1 from the observed rainfall data for 269 meteorological stations points. The Tajikistan and Kyrgyzstan are predicted to be the most affected countries regarding rainfall erosivity. Increasing trends in annual rainfall erosivity from baseline climate up to the GCMs and the climate scenarios experienced variations in rainfall erosivity. There is a positive change in the average annual rainfall erosivity of 5.6% and 9.6% in the 2030s and 2070s respectively compared to the baseline (1960–1990).
The BCCCSM1.1 scenarios projected both increases and decreases in mean rainfall erosivity in Kyrgyzstan (−7.8% to 6.3%), Tajikistan (−26.3% to 3.8%), Turkmenistan (−19% to 10.5%), Uzbekistan (−17.7% to 9%) and increases in Kazakhstan (11.6% to 23.2%). The IPSLCM5ALR scenarios project decreases in mean rainfall erosivity in Kyrgyzstan (−14.5% to −35.5%), Tajikistan (−8.2% to −26.2%), Turkmenistan (−7.1% to −16.7%), Uzbekistan (−7.7% to −28.2%) and both increases and decreases in Kazakhstan (−1.6% to 1.5%). The MIROC5 scenarios project increases in Kyrgyzstan (27.9% to 50.1%), Kazakhstan (5.3% to 27.3%), Tajikistan (34.3% to 56.3%), Uzbekistan (2.1% to 24.1%), and both increases and decrease in Turkmenistan (−4.7% to 19.6%). The MPIESMLR scenarios project in mean rainfall erosivity increases in Kyrgyzstan (0.9% to 27%), Kazakhstan (0.6% to 15.7%), Turkmenistan (2.3% to 14.3%) and both increases in decreases in Tajikistan (−2.2% to 24.4%), Uzbekistan (−2.7% to 15.3%). The average values of erosion variations presented in this study are average changes in countries, while within these countries we found both increases and decreases, which emphasize some spatial variability of rainfall erosivity and soil erosion in Central Asia.
The aggregate average annual precipitation and erosion activity for all climate models for all scenarios show steady growth compared with the baseline climate, only IPSLCM5ALR (RCP2.6 and 8.5) shows a decrease in the average erosivity for the 2030 and 2070 scenarios. Higher amounts of rainfall were the main factor for the spatiotemporal variability in rainfall erosivity. Public policies aimed at preserving soil and water resources should be encouraged and applied at the national land survey level. Further study is required to consider other essential influences that intensify the erosivity; particularly the future land cover changes.
Author Contributions
E.D. carried out conceptualization, data collection, model simulation; X.C. supervised this study, E.D. and A.C.A. developed the methodology; E.D., F.U.O., R.O., A.C.A., G.I. and G.O. wrote the manuscript. All authors read, edited the final version of this manuscript.
Funding
This study supported by the Strategic Priority Research Program of the Chinese Academy of Sciences, Pan-Third Pole Environment Study for a Green Silk Road (Grant No. XDA20060303) and Funds for International Cooperation and Exchange of the National Natural Sciences of China (Grant No. 41761144079).
Acknowledgments
The authors would express sincere gratitude to the WorldClim data portal, Climate Change Agriculture and Food Security (CCAFS) and the National Snow and Ice Data Center (NSIDC) for providing climate data.
Conflicts of Interest
The authors declare no conflict of interest.
References
- Mamytov, A.M.; Roychenko, G.I. Soil Zoning of Kyrgyzstan; Izd-vo AN Kirg: Frunze, Kyrgyzstan, 1961. (In Russian) [Google Scholar]
- Khitrov, N.B.; Ivanov, A.L.; Zavalin, A.A.; Kuznetsov, M.S. Problems of Degradation, Protection and Ways of Recovery Productivity of Agricultural Land. Vestnik Orel GAU 2007, 6, 29–32. (In Russian) [Google Scholar]
- Oldeman, L. The global extent of soil degradation1. In Szabolcs I, Eds1 Soil Resilience and Sustainable Land Use1; Greenland, D.J., Ed.; CAB International: Wallingford, UK, 1994; pp. 99–1181. [Google Scholar]
- Yang, D.; Kanae, S.; Oki, T.; Koike, T.; Musiake, K. Global potential soil erosion with reference to land use and climate changes. Hydrol. Process. 2003, 17, 2913–2928. [Google Scholar] [CrossRef]
- Dobrovolsky, G.V. Degradation and Protection of Soils; Dorovolsky, G.V., Ed.; Moscow State University Publishing House: Moscow, Russia, 2002; p. 654. [Google Scholar]
- Oliveira, P.T.S.; Nearing, M.A.; Wendland, E. Orders of magnitude increase in soil erosion associated with land use change from native to cultivated vegetation in a Brazilian savannah environment. Earth Surf. Process. Landf. 2015, 40, 1524–1532. [Google Scholar] [CrossRef]
- Almagro, A.; Oliveira, P.T.S.; Nearing, M.A.; Hagemann, S. Projected climate change impacts in rainfall erosivity over Brazil. Sci. Rep. 2017, 7, 8130. [Google Scholar] [CrossRef] [PubMed]
- Hamidov, A.; Helming, K.; Balla, D. Impact of agricultural land use in Central Asia: A review. Agron. Sustain. Dev. 2016, 36, 6. [Google Scholar] [CrossRef]
- Qushimov, B.; Ganiev, I.; Rustamova, I.; Haitov, B.; Islam, K. Land degradation by agricultural activities in Central Asia. In Climate Change and Terrestrial Carbon Sequestration in Central Asia; Taylor & Francis: London, UK, 2007; pp. 137–147. [Google Scholar]
- Duishonakunov, M.; Imbery, S.; Narama, C.; Mohanty, A.; King, L. Recent glacier changes and their impact on water resources in Chon and Kichi Naryn Catchments, Kyrgyz Republic. Water Sci. Technol. Water Supply 2014, 14, 444–452. [Google Scholar] [CrossRef]
- Aizen, V.B.; Kuzmichenok, V.A.; Surazakov, A.B.; Aizen, E.M. Glacier changes in the Tien Shan as determined from topographic and remotely sensed data. Glob. Planet. Chang. 2007, 56, 328–340. [Google Scholar] [CrossRef]
- Kenzhebaev, R.; Barandun, M.; Kronenberg, M.; Chen, Y.; Usubaliev, R.; Hoelzle, M. Mass balance observations and reconstruction for Batysh Sook Glacier, Tien Shan, from 2004 to 2016. Cold Reg. Sci. Technol. 2017, 135, 76–89. [Google Scholar] [CrossRef]
- Chevallier, P.; Pouyaud, B.; Mojaïsky, M.; Bolgov, M.; Olsson, O.; Bauer, M.; Froebrich, J. River flow regime and snow cover of the Pamir Alay (Central Asia) in a changing climate. Hydrol. Sci. J. 2014, 59, 1491–1506. [Google Scholar] [CrossRef]
- Hagg, W.; Braun, L.N.; Kuhn, M.; Nesgaard, T.I. Modelling of hydrological response to climate change in glacierized Central Asian catchments. J. Hydrol. 2007, 332, 40–53. [Google Scholar] [CrossRef]
- Lioubimtseva, E.; Henebry, G.M. Climate and environmental change in arid Central Asia: Impacts, vulnerability, and adaptations. J. Arid Environ. 2009, 73, 963–977. [Google Scholar] [CrossRef]
- Issanova, G.; Jilili, R.; Abuduwaili, J.; Kaldybayev, A.; Saparov, G.; Yongxiao, G. Water availability and state of water resources within water-economic basins in Kazakhstan. Paddy Water Environ. 2018, 16, 183–191. [Google Scholar] [CrossRef]
- Amanambu, A.C.; Li, L.; Egbinola, C.N.; Obarein, O.A.; Mupenzi, C.; Chen, D. Spatio-temporal variation in rainfall-runoff erosivity due to climate change in the Lower Niger Basin, West Africa. Catena 2019, 172, 324–334. [Google Scholar] [CrossRef]
- Panagos, P.; Borrelli, P.; Meusburger, K.; Yu, B.; Klik, A.; Jae Lim, K.; Yang, J.E.; Ni, J.; Miao, C.; Chattopadhyay, N.; et al. Global rainfall erosivity assessment based on high-temporal resolution rainfall records. Sci. Rep. 2017, 7, 4175. [Google Scholar] [CrossRef] [PubMed]
- Wischmeier, W.H.; Smith, D.D. Predicting rainfall erosion losses-a guide to conservation planning. In Predicting Rainfall Erosion Losses—A Guide to Conservation Planning; USDA, Science and Education Administration: Hyattsville, MD, USA, 1978. [Google Scholar]
- Renard, K.G.; Foster, G.R.; Weesies, G.; McCool, D.; Yoder, D. Predicting Soil Erosion by Water: A Guide to Conservation Planning with the Revised Universal Soil Loss Equation (RUSLE); United States Department of Agriculture: Washington, DC, USA, 1997; Volume 703.
- Lai, C.; Chen, X.; Wang, Z.; Wu, X.; Zhao, S.; Wu, X.; Bai, W. Spatio-temporal variation in rainfall erosivity during 1960–2012 in the Pearl River Basin, China. Catena 2016, 137, 382–391. [Google Scholar] [CrossRef]
- Lee, J.-H.; Heo, J.-H. Evaluation of estimation methods for rainfall erosivity based on annual precipitation in Korea. J. Hydrol. 2011, 409, 30–48. [Google Scholar] [CrossRef]
- Renard, K.G.; Freimund, J.R. Using monthly precipitation data to estimate the R-factor in the revised USLE. J. Hydrol. 1994, 157, 287–306. [Google Scholar] [CrossRef]
- Angulo-Martínez, M.; Beguería, S. Estimating rainfall erosivity from daily precipitation records: A comparison among methods using data from the Ebro Basin (NE Spain). J. Hydrol. 2009, 379, 111–121. [Google Scholar] [CrossRef]
- Naipal, V.; Reick, C.H.; Pongratz, J.; Van Oost, K. Improving the global applicability of the RUSLE model-adjustment of the topographical and rainfall erosivity factors. Geosci. Model Dev. 2015, 8, 2893–2913. [Google Scholar] [CrossRef]
- Panagos, P.; Ballabio, C.; Meusburger, K.; Spinoni, J.; Alewell, C.; Borrelli, P. Towards estimates of future rainfall erosivity in Europe based on REDES and WorldClim datasets. J. Hydrol. 2017, 548, 251–262. [Google Scholar] [CrossRef]
- Plangoen, P.; Babel, M.S.; Clemente, R.S.; Shrestha, S.; Tripathi, N.K. Simulating the impact of future land use and climate change on soil erosion and deposition in the Mae Nam Nan sub-catchment, Thailand. Sustainability 2013, 5, 3244–3274. [Google Scholar] [CrossRef]
- Gupta, S.; Kumar, S. Simulating climate change impact on soil erosion using RUSLE model− A case study in a watershed of mid-Himalayan landscape. J. Earth Syst. Sci. 2017, 126, 43. [Google Scholar] [CrossRef]
- Campbell, J.L.; Driscoll, C.T.; Pourmokhtarian, A.; Hayhoe, K. Streamflow responses to past and projected future changes in climate at the Hubbard Brook Experimental Forest, New Hampshire, United States. Water Resour. Res. 2011, 47. [Google Scholar] [CrossRef]
- Carter, J.G.; Cavan, G.; Connelly, A.; Guy, S.; Handley, J.; Kazmierczak, A. Climate change and the city: Building capacity for urban adaptation. Prog. Plan. 2015, 95, 1–66. [Google Scholar] [CrossRef]
- Li, Z.; Fang, H. Impacts of climate change on water erosion: A review. Earth-Sci. Rev. 2016, 163, 94–117. [Google Scholar] [CrossRef]
- Mondal, A.; Khare, D.; Kundu, S. Change in rainfall erosivity in the past and future due to climate change in the central part of India. Int. Soil Water Conserv. Res. 2016, 4, 186–194. [Google Scholar] [CrossRef]
- Teng, H.; Liang, Z.; Chen, S.; Liu, Y.; Rossel, R.A.V.; Chappell, A.; Yu, W.; Shi, Z. Current and future assessments of soil erosion by water on the Tibetan Plateau based on RUSLE and CMIP5 climate models. Sci. Total Environ. 2018, 635, 673–686. [Google Scholar] [CrossRef]
- Immerzeel, W.; Pellicciotti, F.; Bierkens, M. Rising river flows throughout the twenty-first century in two Himalayan glacierized watersheds. Nat. Geosci. 2013, 6, 742–745. [Google Scholar] [CrossRef]
- Unger-Shayesteh, K.; Vorogushyn, S.; Merz, B.; Frede, H.-G. Introduction to “water in Central Asia—Perspectives under global change”. Glob. Planet. Chang. 2013, 100, 1–152. [Google Scholar] [CrossRef]
- Hijmans, R.J.; Cameron, S.E.; Parra, J.L.; Jones, P.G.; Jarvis, A. Very high resolution interpolated climate surfaces for global land areas. Int. J. Climatol. 2005, 25, 1965–1978. [Google Scholar] [CrossRef]
- Alamanov, S.; Lelevkin, V.; Podrezov, O.; Podrezov, A. Climate Changes and Water Problems in Central Asia; UNEP and WWF: Moscow, Russia, 2006. (In Russian) [Google Scholar]
- Chen, X.; Zhou, Q. Ecological and Environmental Remote Sensing in Arid Zone–A Case Study of Central Asia; Science Press: Beijing, China, 2015. [Google Scholar]
- Taylor, K.E.; Stouffer, R.J.; Meehl, G.A. An overview of CMIP5 and the experiment design. Bull. Am. Meteorol. Soc. 2012, 93, 485–498. [Google Scholar] [CrossRef]
- Luo, M.; Liu, T.; Meng, F.; Duan, Y.; Bao, A.; Frankl, A.; De Maeyer, P. Spatiotemporal characteristics of future changes in precipitation and temperature in Central Asia. Int. J. Climatol. 2019, 39, 1571–1588. [Google Scholar] [CrossRef]
- Ramirez-Villegas, J.; Jarvis, A. Downscaling Global Circulation Model Outputs: The Delta Method Decision and Policy Analysis Working Paper No. 1; International Center for Tropical Agriculture (CIAT): Cali, Colombia, 2010. [Google Scholar]
- Arnoldus, H. Methodology Used to Determine the Maximum Potential Average Annual Soil Loss Due to Sheet and Rill Erosion in Morocco; FAO Soils Bulletins (FAO): Rome, Italy, 1977. [Google Scholar]
- Arnoldus, H. An approximation of the rainfall factor in the Universal Soil Loss Equation. In An Approximation of the Rainfall Factor in the Universal Soil Loss Equation; John Wiley and Sons Ltd.: Chichester, UK, 1980; pp. 127–132. [Google Scholar]
- Kinnell, P. Event soil loss, runoff and the Universal Soil Loss Equation family of models: A review. J. Hydrol. 2010, 385, 384–397. [Google Scholar] [CrossRef]
- Williams, M.; Konovalov, V. Central Asia Temperature and Precipitation Data, 1879–2003; USA National Snow and Ice Data Center: Boulder, CO, USA, 2008.
- Nash, J.E.; Sutcliffe, J.V. River flow forecasting through conceptual models part I—A discussion of principles. J. Hydrol. 1970, 10, 282–290. [Google Scholar] [CrossRef]
- Panagos, P.; Ballabio, C.; Borrelli, P.; Meusburger, K. Spatio-temporal analysis of rainfall erosivity and erosivity density in Greece. Catena 2016, 137, 161–172. [Google Scholar] [CrossRef]
- Chen, X.; Wang, S.; Hu, Z.; Zhou, Q.; Hu, Q. Spatiotemporal characteristics of seasonal precipitation and their relationships with ENSO in Central Asia during 1901–2013. J. Geogr. Sci. 2018, 28, 1341–1368. [Google Scholar] [CrossRef]
- Hu, Z.; Zhou, Q.; Chen, X.; Qian, C.; Wang, S.; Li, J. Variations and changes of annual precipitation in Central Asia over the last century. Int. J. Climatol. 2017, 37, 157–170. [Google Scholar] [CrossRef]
- Hu, Z.; Chen, X.; Chen, D.; Li, J.; Wang, S.; Zhou, Q.; Yin, G.; Guo, M. “Dry gets drier, wet gets wetter”: A case study over the arid regions of central Asia. Int. J. Climatol. 2018, 39, 1072–1091. [Google Scholar] [CrossRef]
- Mariotti, A. How ENSO impacts precipitation in southwest central Asia. Geophys. Res. Lett. 2007, 34. [Google Scholar] [CrossRef]
- Dai, A.; Wigley, T. Global patterns of ENSO-induced precipitation. Geophys. Res. Lett. 2000, 27, 1283–1286. [Google Scholar] [CrossRef]
- Liu, S.; Duan, A. Impacts of the global sea surface temperature anomaly on the evolution of circulation and precipitation in East Asia on a quasi-quadrennial cycle. Clim. Dyn. 2017, 51, 4077–4094. [Google Scholar] [CrossRef]
- Litschert, S.E.; Theobald, D.M.; Brown, T.C. Effects of climate change and wildfire on soil loss in the Southern Rockies Ecoregion. Catena 2014, 118, 206–219. [Google Scholar] [CrossRef]
Figure 1.
Study area: (a) Mean annual precipitation from WorldClim and (b) elevation from Shuttle Radar Topography Mission Digital Elevation Model (SRTM DEM, 90 m).
Figure 1.
Study area: (a) Mean annual precipitation from WorldClim and (b) elevation from Shuttle Radar Topography Mission Digital Elevation Model (SRTM DEM, 90 m).

Figure 2.
Climate change scenarios used in the paper.

Figure 3.
Scatter plot between observed and baseline annual rainfall erosivity.

Figure 4.
(a) Baseline rainfall erosivity and (b) erosivity density.

Figure 5.
Rainfall erosivity projections for the period 2030s and 2070s according to RCP2.6 and 8.5 scenarios driven by the BCCCSM1.1, IPSLCM5ALR, MIROC-5, MPIESMLR GCM models.
Figure 5.
Rainfall erosivity projections for the period 2030s and 2070s according to RCP2.6 and 8.5 scenarios driven by the BCCCSM1.1, IPSLCM5ALR, MIROC-5, MPIESMLR GCM models.

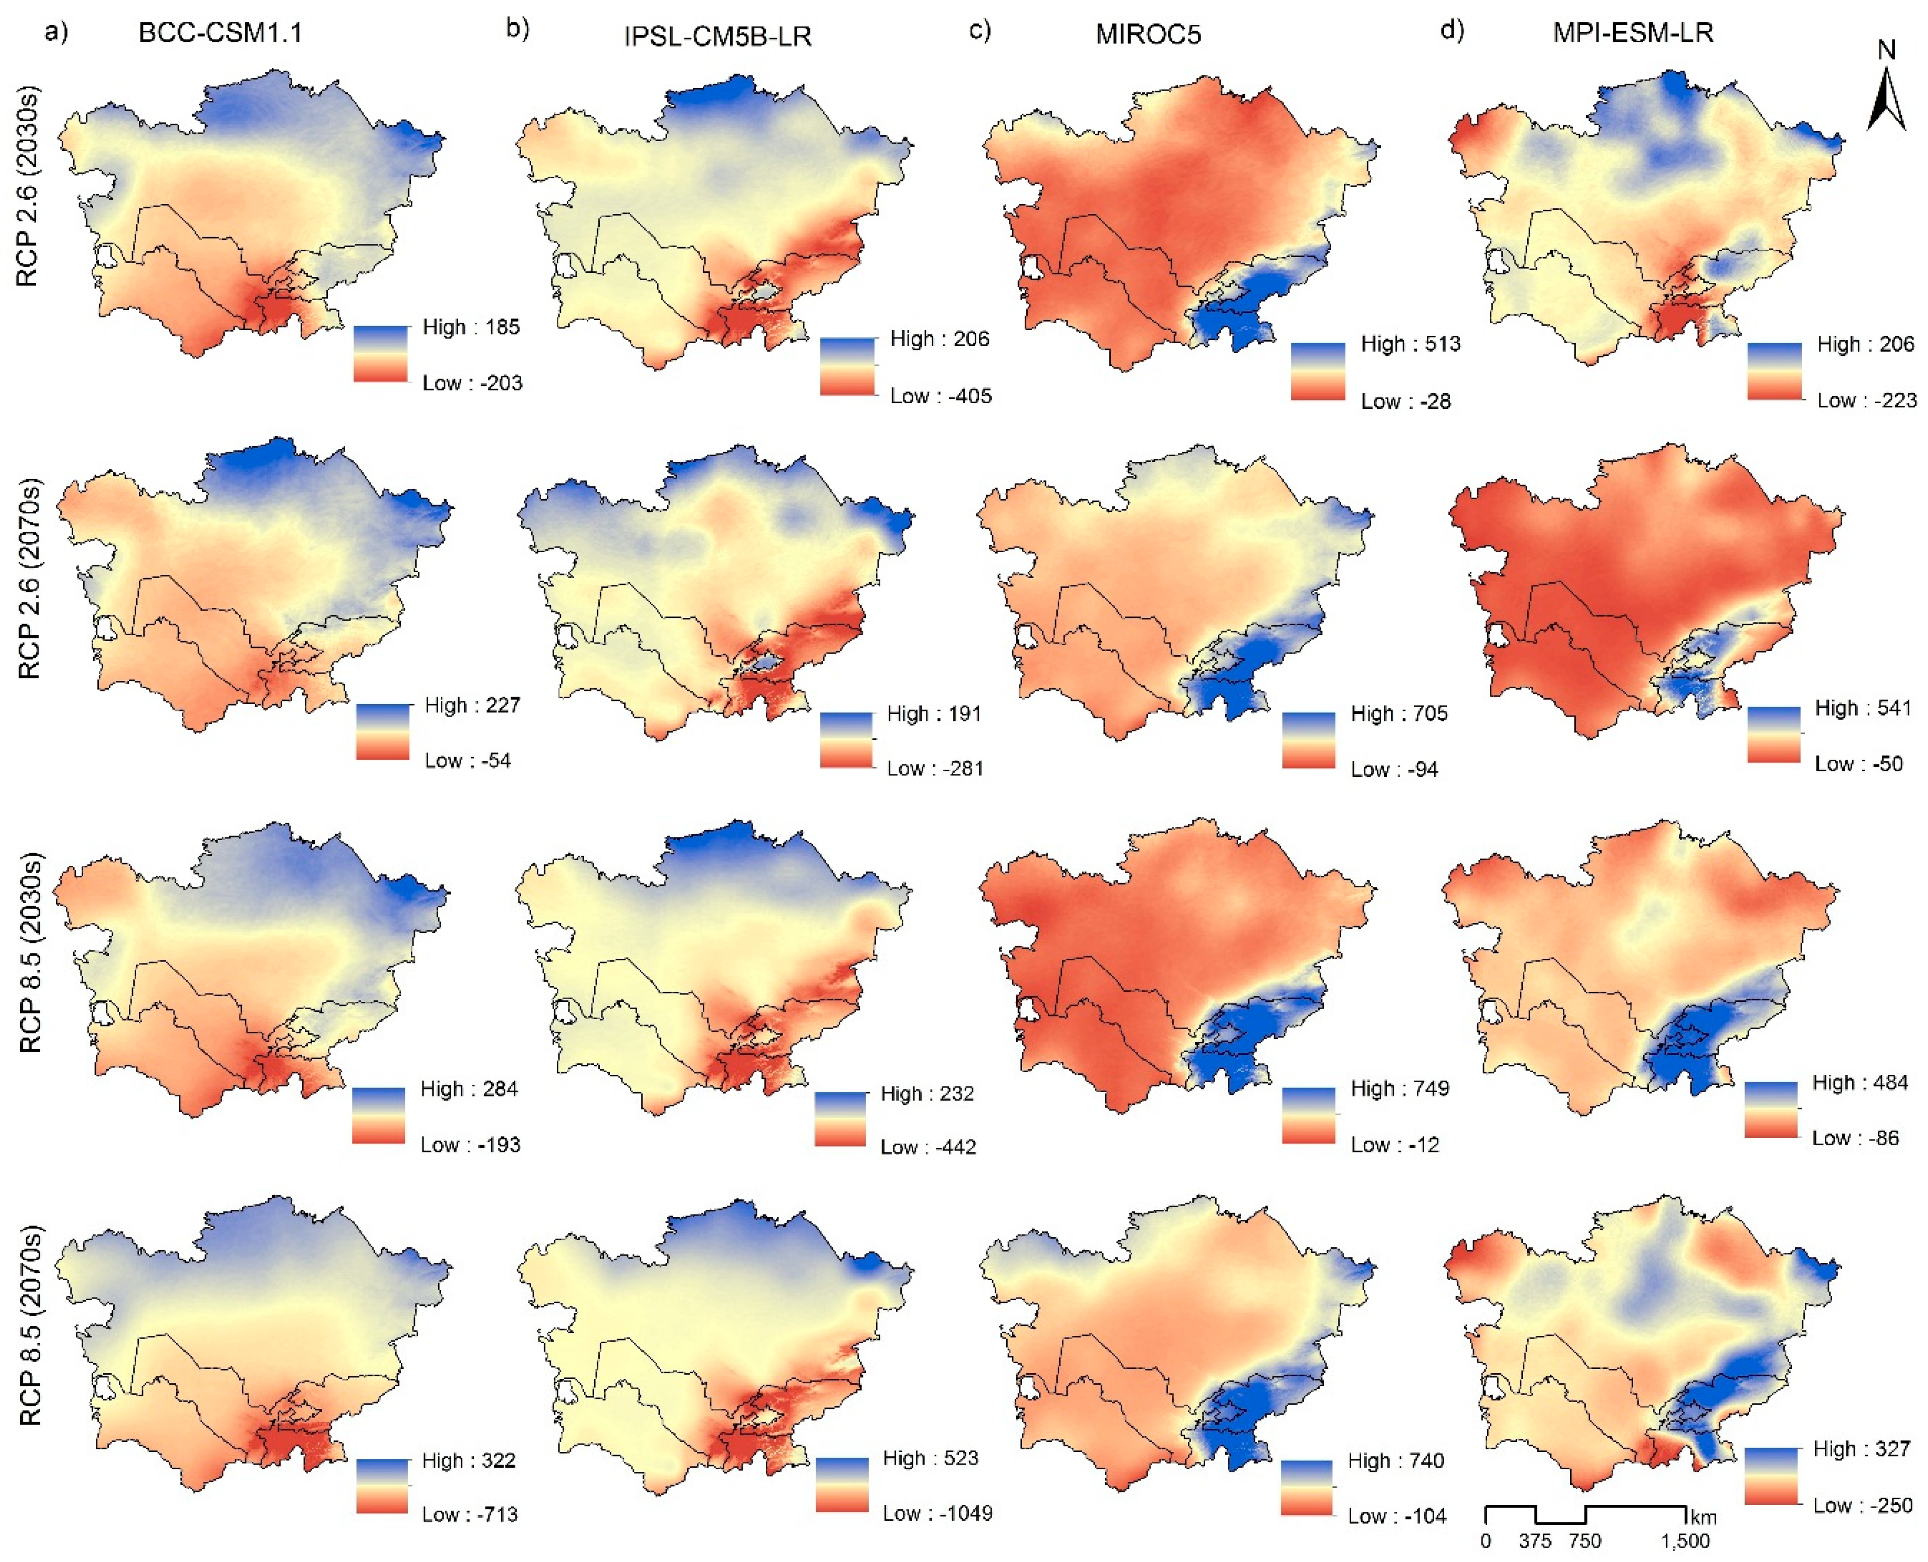
Figure 6.
Absolute differences of rainfall erosivity (MJ mm ha−1 h−1 year−1) between 2030, 2070 projections and baseline data.
Figure 6.
Absolute differences of rainfall erosivity (MJ mm ha−1 h−1 year−1) between 2030, 2070 projections and baseline data.

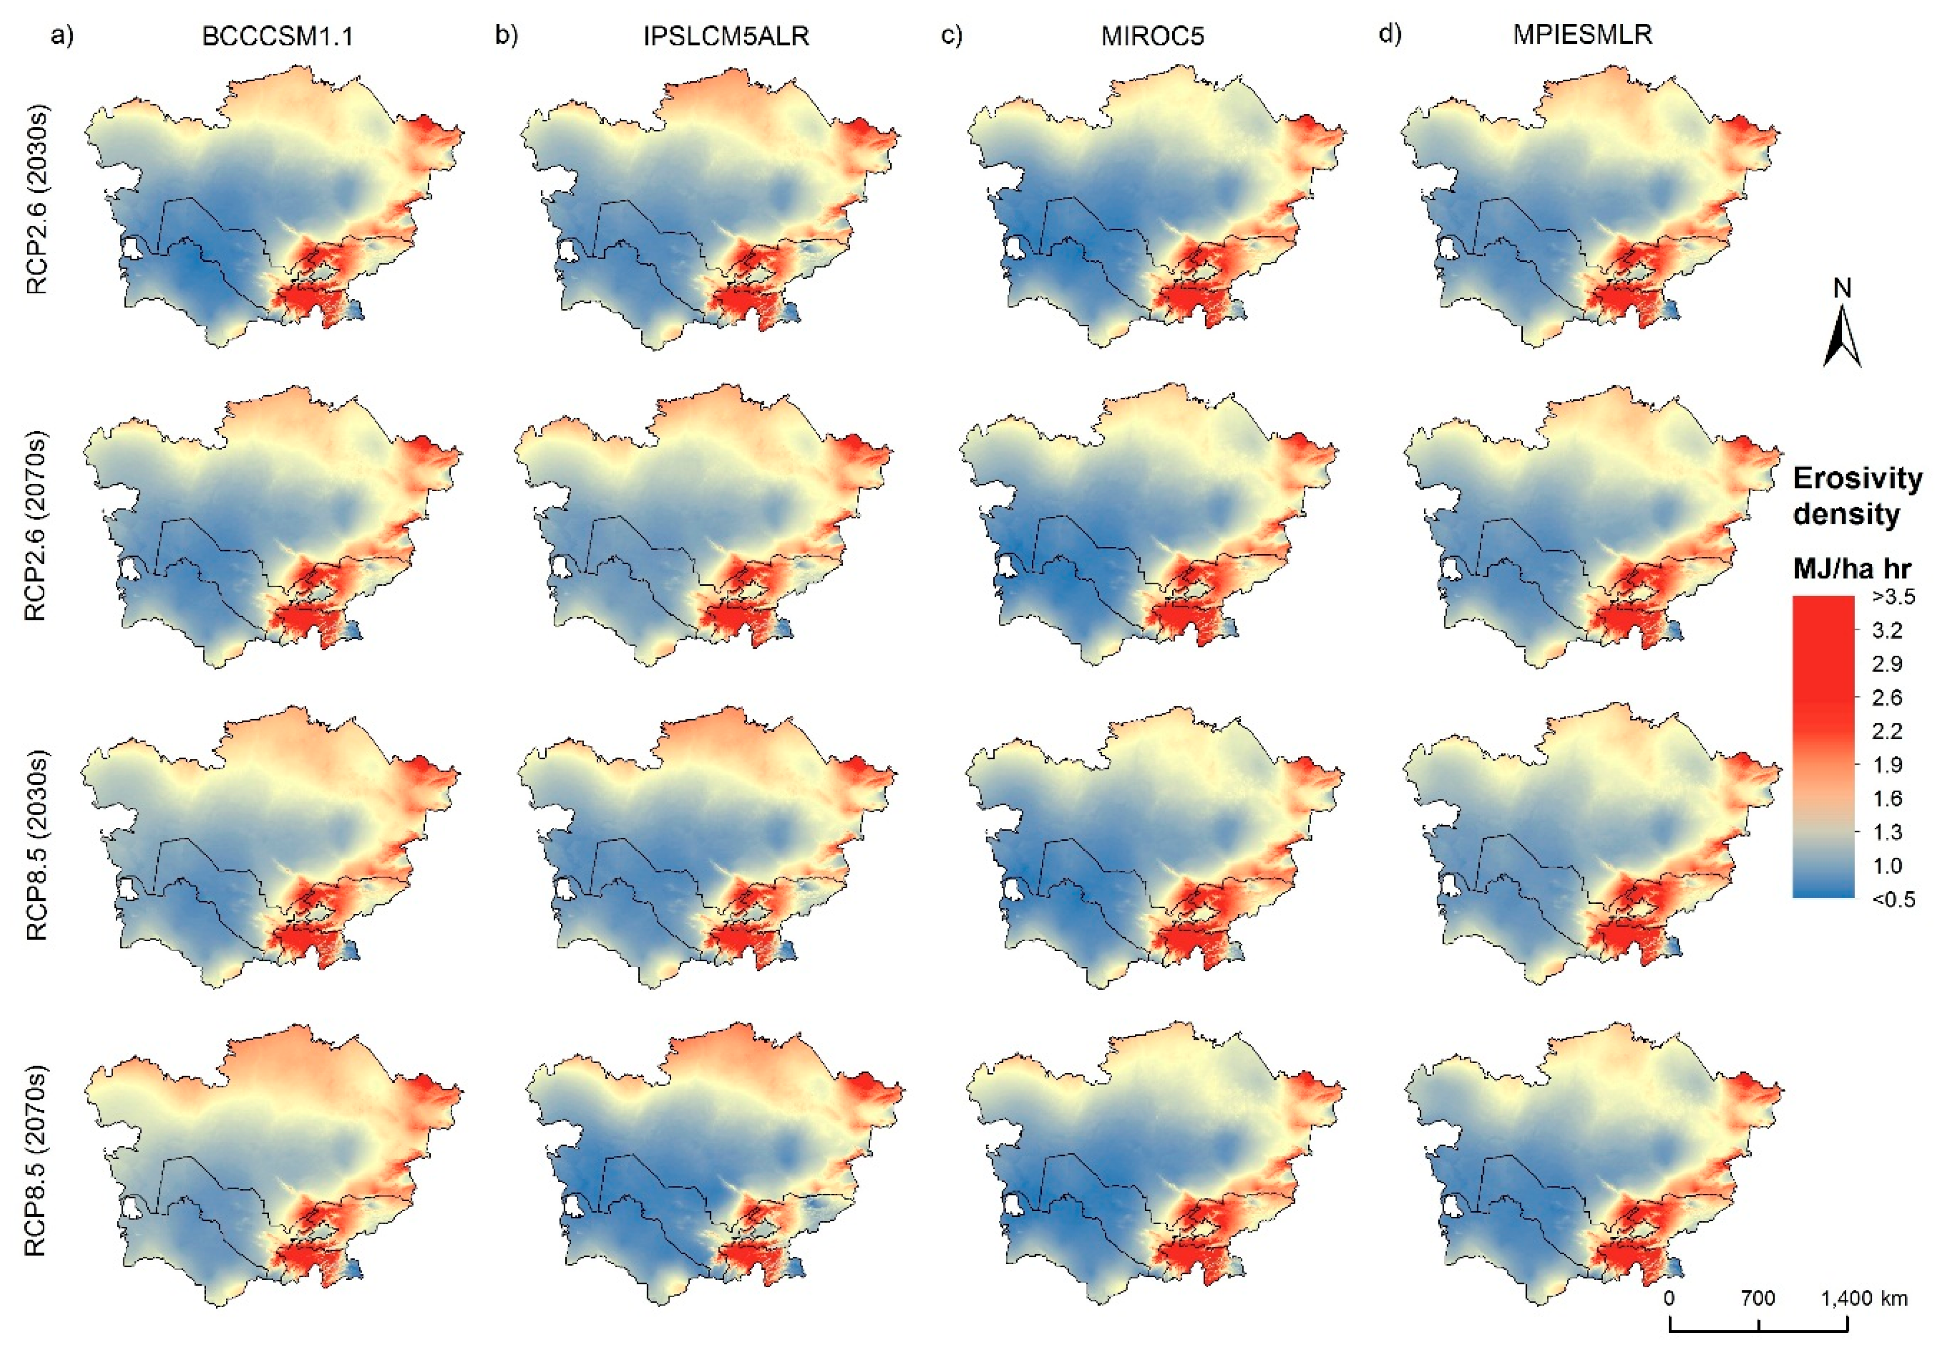
Figure 7.
Erosivity density for different scenarios for the period 2030s and 2070s according to RCP2.6 and 8.5 scenarios driven by the BCCCSM1.1, IPSLCM5ALR, MIROC-5, MPIESMLR GCM models.
Figure 7.
Erosivity density for different scenarios for the period 2030s and 2070s according to RCP2.6 and 8.5 scenarios driven by the BCCCSM1.1, IPSLCM5ALR, MIROC-5, MPIESMLR GCM models.

Figure 8.
Annual precipitation, R factor and erosivity density for different scenarios and periods.


Table 1.
Global Climate Models (GCMs), from the Climate Change Agriculture and Food Security (CCAFS, http://www.ccafs-climate.org) portal.
Table 1.
Global Climate Models (GCMs), from the Climate Change Agriculture and Food Security (CCAFS, http://www.ccafs-climate.org) portal.
| Model | Institute | Country | Resolution |
|---|---|---|---|
| BCCCSM-1.1 | Beijing Climate Center, Climate System Model 1.1 | China | ~2.8125° × 2.8125° |
| IPSLCM5ALR | Institut Pierre Simon Laplace Model, New Atmospheric Physic at Low Resolution | France | 3.75° × ~1.9° |
| MIROC-5 | Model for Interdisciplinary Research On Climate | Japan | 1.4° × 1.4° |
| MPIESMLR | Max Plank Institute for Meteorology | Germany | 1.875° × ~1.9° |
Table 2.
Changes in average rainfall erosivity and erosivity density under climate change across Central Asia.
Table 2.
Changes in average rainfall erosivity and erosivity density under climate change across Central Asia.
| Climate Models | Precipitation | Rainfall Erosivity (MJ mm ha−1 h−1 year−1) | Change (%) | Erosivity Density | Change (%) |
|---|---|---|---|---|---|
| Baseline | 253.57 | 402.07 | 0.0 | 1.38 | 0.0 |
| 2030s | |||||
| BCCCSM1.1-2.6 | 263.5 | 430.01 | 6.95 | 1.41 | 2.2 |
| BCCCSM1.1-8.5 | 267.12 | 437.07 | 8.7 | 1.42 | 2.9 |
| IPSLCM5ALR-2.6 | 247.31 | 386.65 | −3.84 | 1.36 | −1.4 |
| IPSLCM5ALR-8.5 | 246.48 | 386.37 | −3.9 | 1.35 | −2.2 |
| MIROC5-2.6 | 266.4 | 439.64 | 9.34 | 1.42 | 2.9 |
| MIROC5-8.5 | 283.19 | 481.98 | 19.87 | 1.47 | 6.5 |
| MPIESMLR-2.6 | 254.36 | 404.09 | 0.5 | 1.38 | 0.0 |
| MPIESMLR-8.5 | 263.94 | 430.14 | 6.98 | 1.41 | 2.2 |
| Average | 261.54 | 424.49 | 5.58 | 1.4 | 1.6 |
| 2070s | |||||
| BCCCSM1.1-2.6 | 273.95 | 450.35 | 12.01 | 1.45 | 5.1 |
| BCC-CSM1.1-8.5 | 268.61 | 437.77 | 8.88 | 1.43 | 3.6 |
| IPSLCM5ALR-2.6 | 248.82 | 391.22 | −2.7 | 1.36 | −1.4 |
| IPSLCM5ALR-8.5 | 243.9 | 381.36 | −5.15 | 1.34 | −2.9 |
| MIROC5-2.6 | 270.33 | 449.88 | 11.89 | 1.43 | 3.6 |
| MIROC5-8.5 | 294.11 | 508.85 | 26.56 | 1.51 | 9.4 |
| MPIESMLR-2.6 | 278.9 | 469.3 | 16.72 | 1.46 | 5.8 |
| MPIESMLR-8.5 | 267.4 | 435.84 | 8.4 | 1.42 | 2.9 |
| Average | 268.25 | 440.57 | 9.58 | 1.43 | 3.3 |
Table 3.
Rainfall erosivity in Central Asia by country. Mean baseline and estimated (MJ mm ha−1 h−1 year−1) by BCCCSM1.1, IPSLCM5ALR, MIROC5 and MPIESMLR with RCP2.6 and RCP8.5 emission scenarios models. Projected change to baseline (%).
Table 3.
Rainfall erosivity in Central Asia by country. Mean baseline and estimated (MJ mm ha−1 h−1 year−1) by BCCCSM1.1, IPSLCM5ALR, MIROC5 and MPIESMLR with RCP2.6 and RCP8.5 emission scenarios models. Projected change to baseline (%).
| KGZ | KZT | TJK | TKM | UZB | ||
|---|---|---|---|---|---|---|
| Baseline (1961–1990) | 869.7 | 374.3 | 1447.7 | 188.4 | 282.1 | |
| RCP2.6 (2030s) | BCCCSM-1.1 | 903.8 | 420.3 | 1395.9 | 167.7 | 258 |
| Change, % | 6.3 | 11.6 | 0.4 | −10.1 | −8.1 | |
| IPSLCM5ALR | 744.1 | 377.5 | 1290.8 | 164.7 | 240.5 | |
| Change, % | −17.2 | −0.3 | −11 | −11.2 | −11.9 | |
| MIROC5 | 1057 | 400.6 | 1697.1 | 196.9 | 295.6 | |
| Change, % | 27.9 | 5.3 | 36.9 | 3.7 | 2.1 | |
| MPIESMLR | 870.1 | 380.8 | 1388.3 | 191.2 | 272.5 | |
| Change, % | 0.9 | 0.6 | −2.2 | 2.3 | -2.7 | |
| RCP2.6 (2070s) | BCCCSM-1.1 | 910 | 436.2 | 1450.2 | 200.9 | 291.9 |
| Change, % | 6.3 | 17.7 | 3.8 | 10.5 | 9 | |
| IPSLCM5ALR | 769 | 375.1 | 1350.5 | 172.9 | 263.4 | |
| Change, % | −14.5 | −1.5 | −8.2 | −7.1 | −7.7 | |
| MIROC5 | 1062.6 | 416.8 | 1699.9 | 179.9 | 297 | |
| Change, % | 28.8 | 9.8 | 34.3 | -4.7 | 2.4 | |
| MPIESMLR | 1081.9 | 432.5 | 1702.5 | 216.9 | 329 | |
| Change, % | 27 | 15.7 | 24.5 | 14.3 | 15.3 | |
| RCP8.5 (2030s) | BCCCSM-1.1 | 909.6 | 430.9 | 1386.2 | 165 | 256.6 |
| Change, % | 6.3 | 14.9 | −5.7 | −11.1 | −10 | |
| IPSLCM5ALR | 736.4 | 380.2 | 1254.8 | 171 | 227.6 | |
| Change, % | −17.4 | −1.6 | −15.4 | −7.3 | −17.7 | |
| MIROC5 | 1216.8 | 435.9 | 1818.4 | 212 | 336.9 | |
| Change, % | 49.7 | 17 | 51.3 | 13.5 | 19.4 | |
| MPIESMLR | 1041.7 | 385.2 | 1664.4 | 202.8 | 320 | |
| Change, % | 22 | 4.6 | 20.8 | 8.8 | 14.5 | |
| RCP8.5 (2070s) | BCCCSM-1.1 | 794 | 456.8 | 1150.6 | 146.9 | 228.4 |
| Change, % | −7.8 | 23.2 | −26.3 | −19 | −17.7 | |
| IPSLCM5ALR | 581.3 | 400 | 1082 | 154.2 | 182.8 | |
| Change, % | −35.5 | 1.5 | −26.2 | −16.7 | −28.2 | |
| MIROC5 | 1224.1 | 473.1 | 1800.4 | 215.3 | 340 | |
| Change, % | 50.1 | 27.3 | 56.3 | 19.6 | 24.1 | |
| MPIESMLR | 988 | 409.6 | 1484.7 | 195.4 | 294.5 | |
| Change, % | 15.7 | 11.1 | 9 | 7.6 | 7 | |
KGZ-Kyrgyzstan, KZT-Kazakhstan, TJK-Tajikistan, TKM-Turkmenistan, UZB-Uzbekistan.
© 2019 by the authors. Licensee MDPI, Basel, Switzerland. This article is an open access article distributed under the terms and conditions of the Creative Commons Attribution (CC BY) license (http://creativecommons.org/licenses/by/4.0/).
Share and Cite
MDPI and ACS Style
Duulatov, E.; Chen, X.; Amanambu, A.C.; Ochege, F.U.; Orozbaev, R.; Issanova, G.; Omurakunova, G. Projected Rainfall Erosivity Over Central Asia Based on CMIP5 Climate Models. Water 2019, 11, 897. https://doi.org/10.3390/w11050897
AMA Style
Duulatov E, Chen X, Amanambu AC, Ochege FU, Orozbaev R, Issanova G, Omurakunova G. Projected Rainfall Erosivity Over Central Asia Based on CMIP5 Climate Models. Water. 2019; 11(5):897. https://doi.org/10.3390/w11050897
Chicago/Turabian StyleDuulatov, Eldiiar, Xi Chen, Amobichukwu C. Amanambu, Friday U. Ochege, Rustam Orozbaev, Gulnura Issanova, and Gulkaiyr Omurakunova. 2019. "Projected Rainfall Erosivity Over Central Asia Based on CMIP5 Climate Models" Water 11, no. 5: 897. https://doi.org/10.3390/w11050897
Note that from the first issue of 2016, this journal uses article numbers instead of page numbers. See further details here.