Does Activated Silver Reduce Recontamination Risks in the Reservoirs of Ceramic Water Filters?

1
Swiss Federal Institute of Aquatic Science and Technology (Eawag), Department Sanitation, Water and Solid Waste for Development (Sandec), Ueberlandstrasse 133, 8600 Dübendorf, Switzerland
2
Safe Water and AIDS Project (SWAP), P.O. Box 3323, Kisumu 40100, Kenya
*
Author to whom correspondence should be addressed.
Water 2019, 11(5), 1108; https://doi.org/10.3390/w11051108
Submission received: 18 April 2019
/
Revised: 10 May 2019
/
Accepted: 24 May 2019
/
Published: 27 May 2019
(This article belongs to the Section Water Use and Scarcity)
Abstract
:Efforts to provide safe water are challenged by recontamination and regrowth of pathogens in treated water during storage. This study evaluated the potential of metallic silver with a chemically etched surface to reduce recontamination risks during water storage in ceramic water filters. Batch experiments were conducted in the laboratory with water storage buckets containing three configurations of varying amounts of silver. Field trials in a rural area in Kenya assessed the effect of the same configurations in the storage buckets of locally produced ceramic pot filters without colloidal silver coating. The tests revealed that the etched silver slightly reduced microbiological recontamination risks during water storage despite the low diffusion of silver ions (<5 µg Ag/L). The effect was strongly influenced by water chemistry parameters. A statistically significant difference in the removal of E. coli (Δ Log Removal Value (LRV) = 0.6) and total coliforms (Δ LRV = 1.7) was found between households using a filter with silver in the water reservoir and those using a filter without silver. Multivariate regression of water handling factors and hygiene practices on filter performance revealed that the presence of silver in the reservoir and cleaning the filter element with a brush were associated with a better filter performance.
1. Introduction
Diarrheal diseases pose a significant health risk, particularly for children below the age of five. Major causes are inadequate sanitation, contaminated drinking water, and inadequate hygiene. In 2012, 842,000 diarrhea deaths were estimated to be caused by this cluster of risk factors, which amounts to 1.5% of the total disease burden and to 58% of diarrheal diseases. In children under 5 years old, 361,000 deaths could have been prevented [1]. More than 700 million people do not have access to an improved source of drinking water [2], and Onda et al. estimate that globally more than 1.8 billion people use water that is unsafe [3]. In Kenya, about 40% of the population has no access to safe drinking water [4].
Even if clean water can be collected at the source, unhygienic conditions often lead to the recontamination of water during transport and handling. In his meta-analysis covering 57 studies, Wright found that the bacteriological quality of drinking water is often worse at the point of consumption than at the source [5]. Further, the regrowth of pathogens during the storage of water contributes to the challenge of maintaining high water quality at the point of consumption. Momba and Kaleni measured the regrowth of total coliforms, E. coli, Salmonella spp., and Clostridium perfringens in household water storage containers made of polyethylene and galvanized steel and found that while both types of household containers supported the regrowth of these microorganisms, more total coliforms regrew on polyethylene than on galvanized steel containers [6].
Regrowth and recontamination, unfortunately, also lead to a deterioration of the water quality in the safe storage containers of water filters. Brown attributed lower disinfection rates in ceramic filters to post-contamination in the treated water storage containers of the filters [7], and Murphy pointed out that improper cleaning practices caused the recontamination of the safe storage container [8]. As a consequence, concern has been voiced that the recontamination of treated water during storage and handling could degrade the health improvements brought about by consuming safe water.
Silver has been used in drinking water treatment to enhance disinfection. Colloidal silver is applied in the production of ceramic filters to improve the microbiological efficiency of the filter element. Various application procedures exist: the filtration element is either painted with AgNO3, or dipped into such a solution [9]. However, the effectiveness of impregnating the filtration element with silver on pathogen removal is disputed. An assessment of the pathogen removal efficiency of locally produced ceramic filters in Cambodia found a 2 Log reduction of Escherichia coli, as well as a 2 Log reduction of bacteriophage MS2. Although filter elements were treated with AgNO3, they did not show increased effectiveness [10]. In contrast to this, Oyanedel-Craver found that colloidal-silver treatments of the ceramic filter improved their performance, depending upon the amount of colloidal silver applied [11].
Silver concentrations leaching from the filters vary broadly, depending on filter production parameters, including the form, amount, and concentration of silver applied for the filter coating, as well as the natural water chemistry. Mittelmann et al. found that the release of Ag+ in water depended upon pH and ionic strength. The diffusion of silver from disks coated with AgNO3 or nAg fell below 100 µg/L after 10 h in 10 mM NaNO3 aqueous solution at pH 7. Lowering pH to 5 resulted in a 3-fold increase in effluent silver concentrations. Initial peak concentrations of 200–400 µg/L were detected when both sides of a disc were painted with colloidal silver and 40 µg/L when only the top surface was painted [12]. Rayner detected the following dissolved silver concentrations after a throughput of 130 Liters: 1 to 198 µg/L if filters were painted with 0.03 mg/g nAg and 797–2698 µg/L if filters were painted with 0.3 mg/g Ag+ [13]. Also, Van der Laan et al. measured an initial silver leaching of 10–15 µg/L, which dropped to 5 µg/L after the filtration of 200 Liters of water [14].
Mellor et al. evaluated the effect of a ceramic torus painted with colloidal silver that was placed into the water storage container of a ceramic water filter on preventing recontamination in the lower reservoir. They compared the impact on water quality obtained by three different designs: a ceramic water filter, a ceramic water filter with a silver-impregnated torus, and a ceramic water filter combined with point-of-use chlorination. The silver-impregnated torus was painted with 200 ppm silver nanoparticle solution. Measured effluent silver concentrations varied between 10–50 µg/L. No statistically significant difference in the bacterial disinfection rate was found between the three designs [15].
Researchers from the University of Virginia developed a ceramic tablet embedded with silver nanopatches for point of use water disinfection, and evaluated its performance in South Africa and Tanzania. The tablets were made by mixing a silver nitrate solution with clay and sawdust. Both microbiological removal efficiency and the diffusion of silver depended upon the amount of silver embedded, the type of clay used, and the proportion of sawdust mixed into the clay [16]. Field applications in South Africa achieved a reduction of total coliforms of 1 to 4 Log, while the total silver concentration in the water ranged from 0 µg/L to more than 30 µg/L [16,17,18].
Silver has to be applied with caution for water disinfection due to the potential oral toxicity of silver ions and silver nanoparticles [19,20]. The use of silver nanoparticles is particularly critical as they can penetrate biological membranes and accumulate in organs, and there serve as a constant source that releases silver ions, which can damage cell structures and processes [21,22]. In their review on the oral toxicity of silver, Hadrup et al. found various dose-dependent toxic effects in animal experiments, such as weight loss, hypoactivity, altered neurotransmitter levels, altered liver enzymes, altered blood values, enlarged hearts, and immunological effects. On the basis of the findings of their review, they suggest a tolerable daily intake (TDI) value of silver of 2.5 µg/kg of body weight per day [20]. This indicates that drinking water should contain less silver than 25 µg/L, considering the reduced body weight of small children and their fluid requirements [23] and the potential additional uptake of silver from other sources.
This study was conducted to assess the potential of metallic silver with a chemically etched surface, from which we expected a very low diffusion of silver ions into the water [24,25], to reduce recontamination risks during drinking water storage. In addition, the purpose of this study was to assess whether the quality of drinking water stored in uncoated ceramic water filters, used by families living in rural areas in Kenya, can be maintained if the filters contain activated silver.
The silver insert used during our study consisted of a silver wire with a modified surface that is produced by the company Silversan AG in Switzerland. The silver surface is modified through chemical etching, which oxidizes and transforms the ionic surface structure. This process forms regions with crystalline and amorphous silver compounds that are in direct contact with the metallic core of the silver wire. When the wire is in contact with water, only very low concentrations of silver ions, less than 5 µg Ag/L, should be released from the surface [24,25].
2. Materials and Methods
Laboratory experiments were conducted in Switzerland and field trials in a rural setting in Kenya. The methods used are described in the following two sections. Three modifications of water storage containers (buckets or ceramic water filters) were tested in all settings under laboratory and field conditions: control C did not contain any silver, setup SR contained a piece of activated silver in the reservoir, and configuration SRT contained a piece of activated silver in the tap as well as in the reservoir. Configuration SRT was included in the experiment to assess whether a barrier in the tap, which could be an entry point for pathogens, provides additional protection against recontamination. The length of silver pieces used in the various configurations are specified in Table 1 and in Section 2.2.
While polyvinyl chloride (PVC) containers were used in the laboratory, locally produced ceramic filters were assessed during the field experiments in Kenya. The ceramic filters were purchased from the Kenya Ceramic Project, which produced the filter designed by Potters for Peace. Except for the laboratory evaluation in Kenya, ceramic filters without colloidal silver coating were used during all experiments to avoid the potential additional leaching of silver from the colloidal silver coating into the treated water.
2.1. Laboratory Experiments in Switzerland
A total of three experiments were conducted in the laboratory in Switzerland. Tap water that was fecally contaminated by inoculation was used during the first experiment, while creek water containing natural levels of E. coli and total coliforms and creek water mixed with tap water were used during the second and third experiments. Neither tap nor creek water contained any chlorine. Experiments with different sources of water were conducted to assess whether the type of water used affects silver diffusion, and thus disinfection. Water was put into PVC containers and stored in the containers for a duration of up to one week since drinking water in low income households may occasionally be stored over several days. Water samples of 100 mL were taken from each container twice per day. The water temperature during all laboratory tests in Switzerland was kept constant at 20 °C. Table 1 presents an overview of the experimental configurations.
During all experiments, standard membrane filtration was used to measure E. coli and total coliforms. Water samples of 100 mL were collected in sterile Whirlpacks, passed through filtration funnels with Millipore cellulose membranes with a pore size of 0.45 µm, plated on Nissui compact dry plates, and incubated for 24 h at 37 °C.
Flow cytometric measurements were carried out to measure changes in total cell counts during storage. This measurement was conducted to see whether a broad range of bacteria are disinfected or whether only coliform bacteria are sensitive to disinfection with silver. Samples (500 µL) were stained with a combination of SYBR Green I and propidium iodide (SGPI) at 10 µL mL−1 (10, 000 × final dilution of SYBR Green I; 3 μM final concentration of propidium iodide), followed by 10 min. incubation in the dark at 37 °C. When necessary, the water samples were diluted immediately prior to flow cytometric measurements with 0.22 µm filtered commercially available bottled water (Evian, France) to 10% v/v of the initial concentration [26]. After incubation, the concentration of intact cells was measured by flow cytometry.
The diffusion of silver was measured over a duration of 12 days. Samples of 10 mL were taken directly from the reservoir, mixed with 100 µl of nitric acid and measured using atomic absorption spectroscopy (AAS). Samples with a detected concentration of more than 20 µg Ag/L were diluted 1:10, and measurements were repeated.
2.2. Field Trials
The lab experiments were followed by field trials to assess whether water handling practices and hygiene conditions in households in Kenya have a significant impact on the recontamination of water during storage in ceramic filters. The field experiments were conducted in four rural villages near Kisumu, Kenya: Kandhere, Kowi, Kanyambuyi, and Kanyawegi. The water sources in this area are mostly highly contaminated earth pans and surface water. Health indicators in this area are very poor and include a high incidence of diarrhea.
Prior to data collection and intervention, households were informed about the goal and procedures of the study, and informed consent was obtained from every participant. The study protocol was reviewed and approved by the Ethics Review Committee of Maseno University in Kenya and the Ethics Commission of the Swiss Federal Institute of Technology.
After the collection of baseline information, 90 households were selected randomly through a lottery box from a list of 119 households living in the area. Inclusion criteria were the participation of only one household per compound, availability during the time of the study, and the use of surface water as the main drinking water source. The household was excluded from the study if the ceramic filter they had obtained from the project team was sold or discarded. The households were split into three groups. Group 1 served as a control group and received a ceramic filter without silver. Group 2 was given a filter with a 5 cm piece of activated silver in the reservoir of the filter. The third group of households was given a filter containing a 5 cm piece of activated silver in the reservoir and another piece of 3 cm inside the tap. None of the ceramic filters used during the household intervention contained coating with colloidal silver. Filters and group attribution were randomly assigned by letting participants pull the number of the filter, between 1 and 90. Broken filters were replaced immediately and did not lead to exclusion from the study. Instructions on filter handling were provided during community meetings before distributing filters. Only filters with a flow rate of less than 2 L/h were handed out. Every household was visited three times over a period of 9 weeks. During each visit, interviews were conducted with the person responsible for water treatment, mostly in Luo, by trained interviewers and digitally recorded using a coded questionnaire on tablets. The quantitative questionnaire contained questions on demographics, access to water, WASH practices (water treatment, filter handling, etc.), health and socio-economic status. A separate section was used to record observations on the presence and condition of water, hygiene and sanitation infrastructure.
The water filter’s performance was assessed during each visit. Water samples were taken from the raw water receptacle and from the tap of the ceramic water filter after letting the water run for two seconds. Samples were filtered on site using the membrane filtration methodology described above. After processing, Nissui compact dry plates were taken to the laboratory in Kisumu and incubated at 37 °C. Colonies of E. coli and total coliforms were counted after 24 h of incubation.
During the final household visit, the measurements also included residual chlorine to assess whether households had complied with the instruction to not chlorinate water during the experiment and to identify a potential confounding effect of chlorination. Residual chlorine was measured using a chlorine rapid test, Lovibond N,N-diethIy-p-phenylenediamine (DPD) No.1, in both raw water and filtrate of each filter. After the final round of data collection, all filters in the control group (those filters without silver) were upgraded with activated silver both in the reservoir and in the tap.
2.3. Data Analysis
Data was imported into IBM SPSS Statistics 24.0 for statistical analysis. Behavior factors were correlated with water quality (concentrations of E. coli and total coliforms) and Log removal values (LRV) for E. coli and total coliforms in bivariate analysis. Factors with a significant correlation in one of the groups or one of the household visits were included in regression analysis. Multivariate linear regression was calculated with LRVs of E. coli and total coliforms as outcome variables. ANOVA was used to test for the significance of differences in mean values between groups and between household visits.
3. Results and Discussion
3.1. Effect of Activated Silver on Water Quality During Laboratory Experiments
Experiment 1 was conducted in fecally contaminated tap water containing more than 1000 CFU/100 mL of E. coli and total coliforms. E. coli were completely inactivated in both batches containing silver after about 12 h, while the inactivation of total coliforms in those batches took about 65 h. No inactivation of either E. coli or total coliforms was observed in the control configurations, which contained no silver.
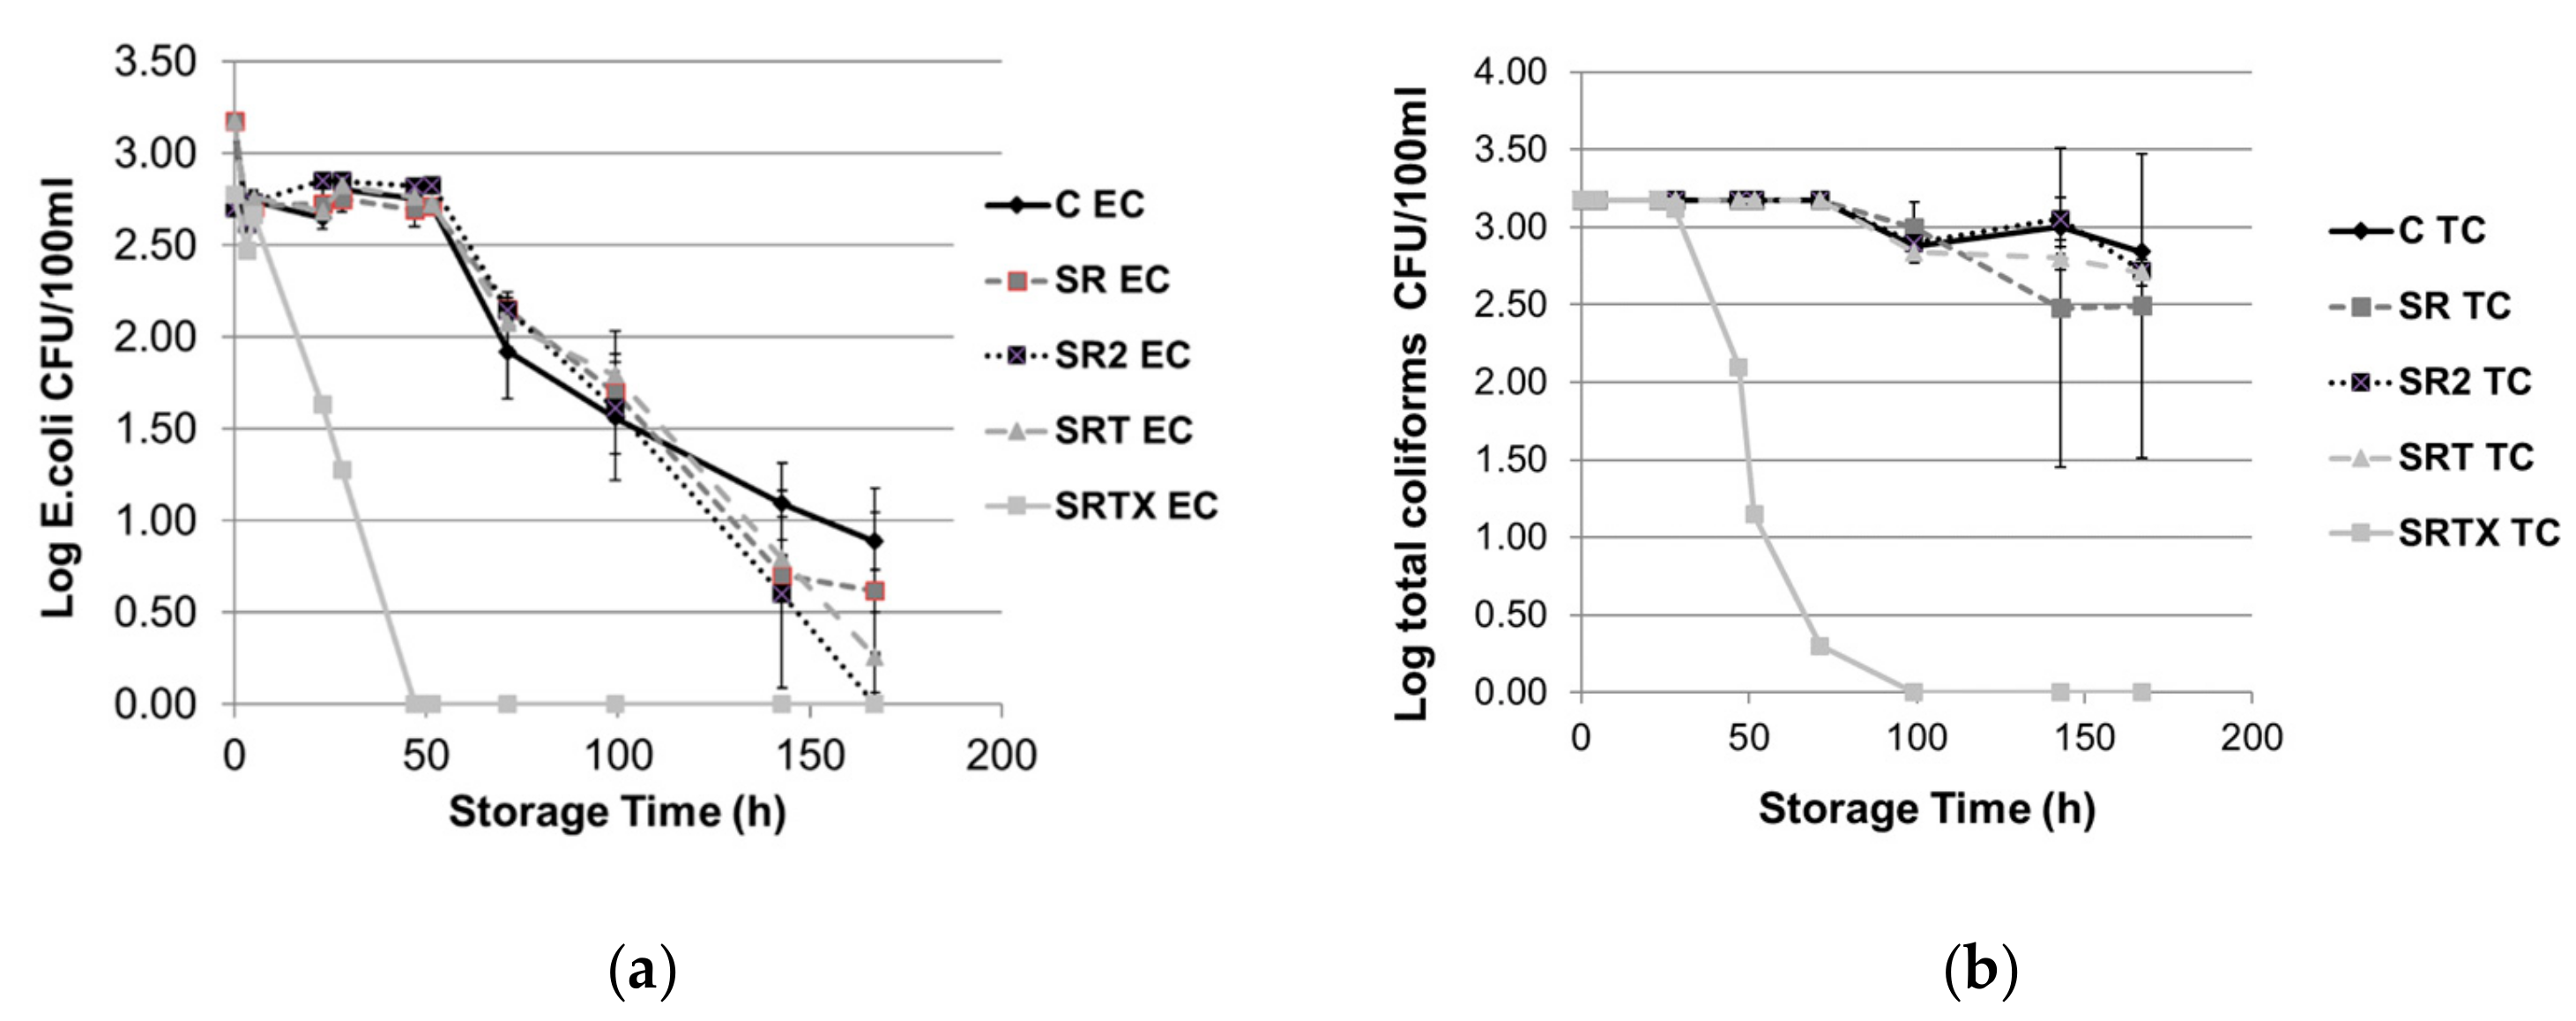
Experiment 2 was conducted with natural creek water from the Chriesbach in Dübendorf, Switzerland. Figure 1 displays the results obtained in this experiment. Only one batch, SRTX with 5 cm of silver in the reservoir and 3 cm in the tap achieved a LRV of 2.78 for E. coli in 50 h (complete inactivation) and a LRV of 3.18 for total coliforms in 100 h (complete inactivation), while the other configurations did not differ from the control, achieving a LRV of max. 0.68 in 165 h. Silver diffusion measurements revealed that the higher inactivation in batch SRTX of experiment 2 was caused by an inhomogeneity in the material used, leading to a much higher diffusion of silver in that batch.
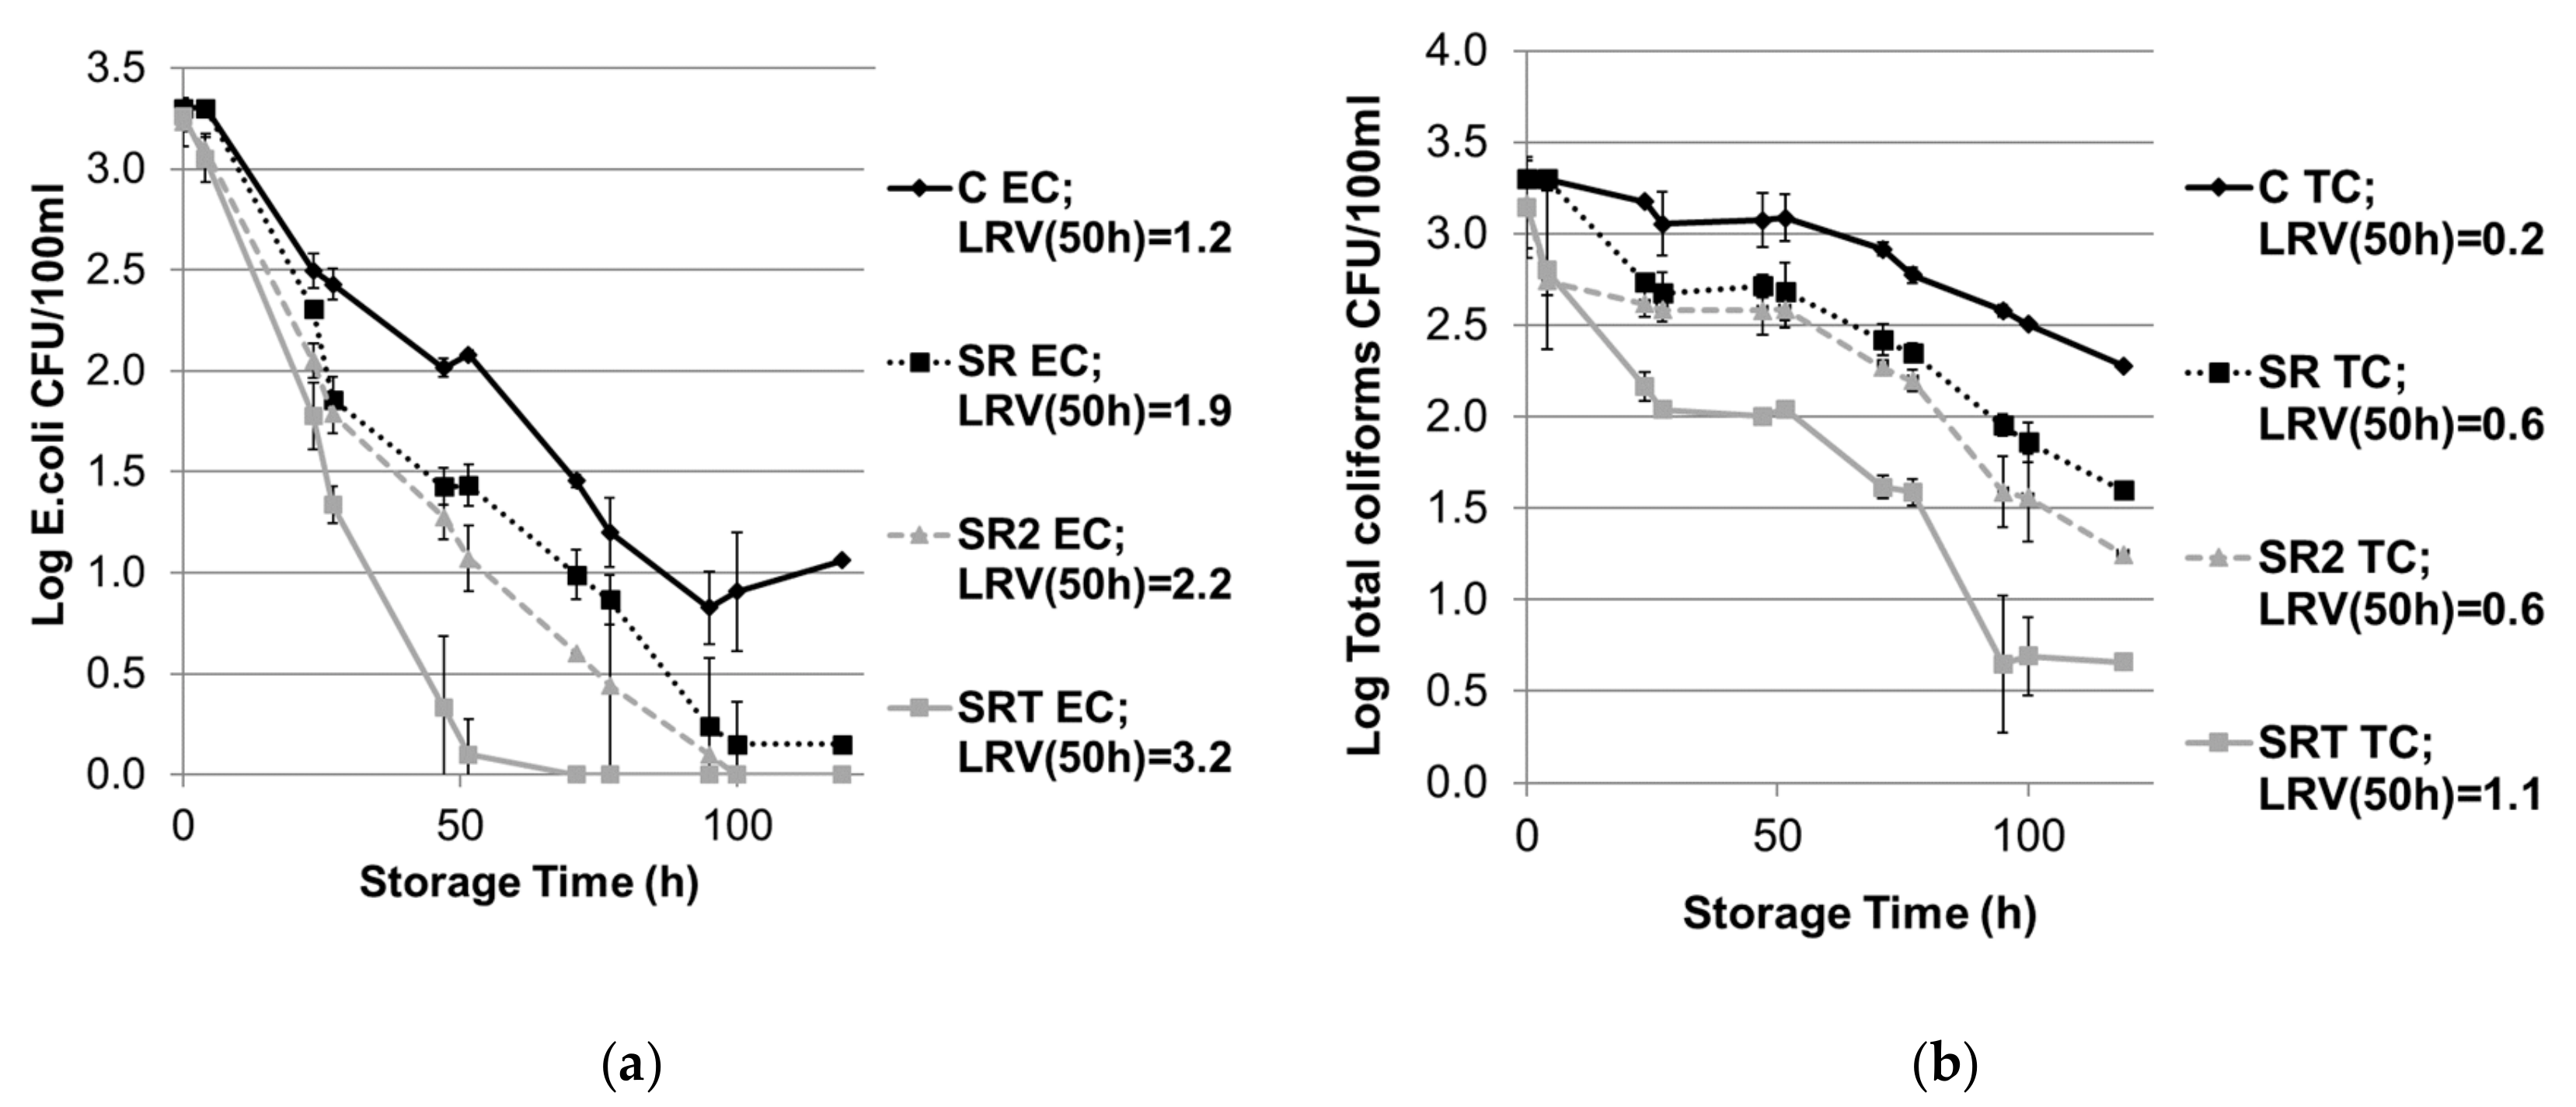
Experiment 3 was implemented with water containing a 1:1 mix of creek water and tap water to reduce the amount of organic material in the test water. Batches with Silversan in the reservoir were equipped with higher amounts. Figure 2 displays inactivation of E. coli and total coliforms and LRVs obtained after 24 h of storage during this experiment.
Comparing inactivation rates in laboratory batches containing 8 cm of Silversan in the reservoir with batches containing 5 cm of Silversan in the reservoir and 3 cm of Silversan in the tap revealed that batches with silver in the reservoir and in the tap had higher inactivation rates than batches containing the same amount of silver but located only in the reservoir. This indicates that not only did the amount of silver dissolving into the water have an influence on inactivation but that contact between pathogens and the activated silver could have an impact on disinfection.
The effect obtained in the laboratory was highly dependent upon the water quality used for the experiments. While good inactivation rates were observed in tap water, the use of open surface water sources with higher loads of organic material reduced the inactivation rates. Since neither organic carbon nor other water chemistry parameters were measured during our experiments, further evaluations are required to quantify the influence of water chemistry on disinfection through activated silver. Our results are in line with Zhang et al.’s finding that, compared to solutions with low organic matter content and monovalent ions, lower disinfection performances of nanosilver suspensions were obtained in seawater, followed by water containing high concentrations of organic matter, followed by synthetic water containing high concentrations of divalent cation [27].
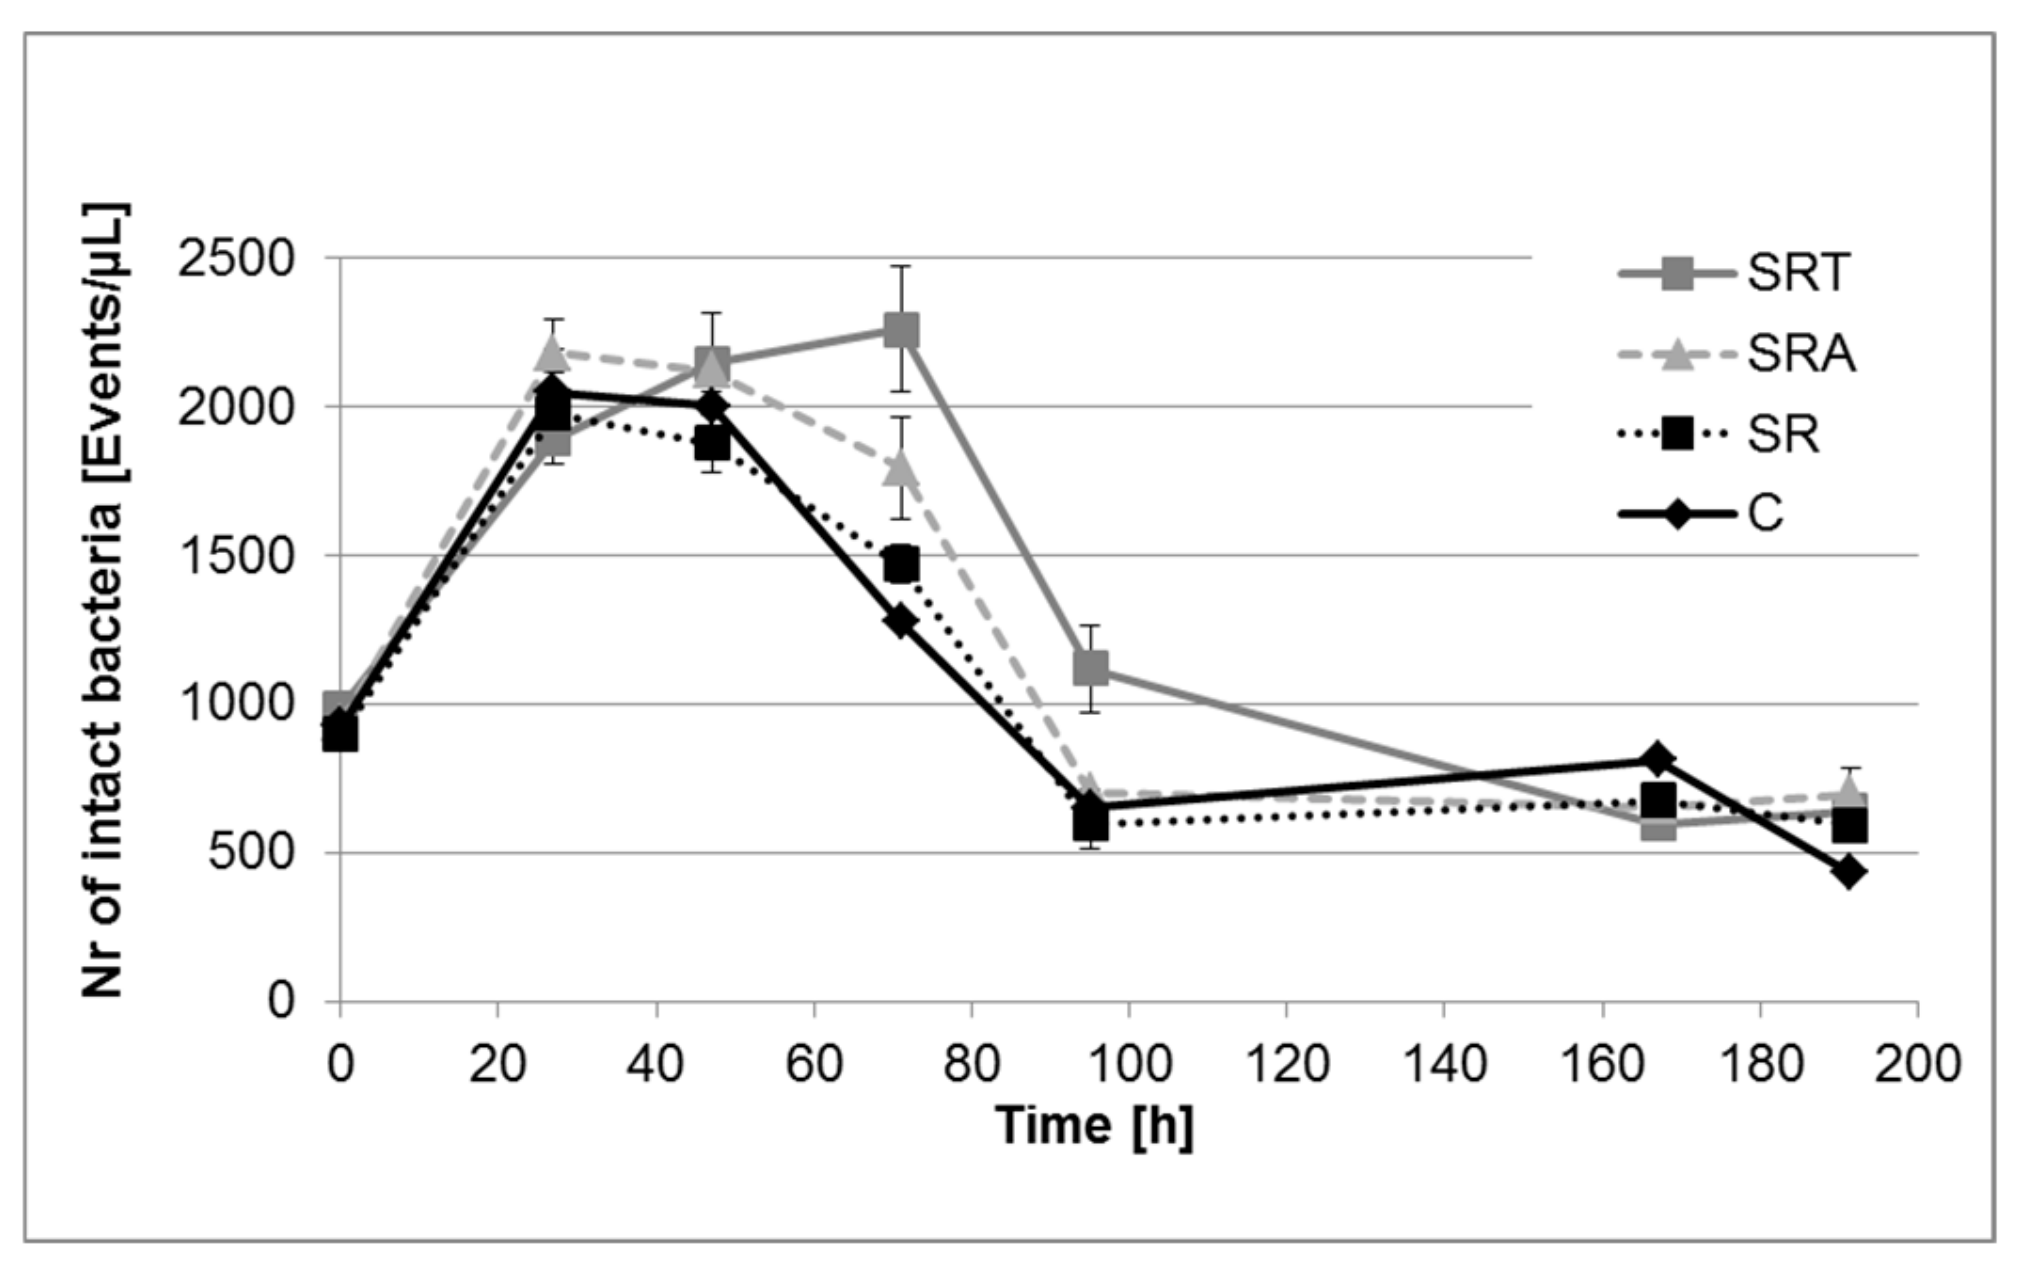
The flow cytometry measurements of total intact bacteria did not reveal a clear difference between the various experimental configurations and the control. Figure 3 displays the concentration of total intact cells in creek water diluted at a ratio of 1:1 with tap water. We observed an initial phase of total bacterial growth followed by a phase of decreasing growth. The batch containing the highest amount of silver had the longest growing phase and reached the highest count of living bacteria after 71 h. The growing phase ended after 27 h for all other setups, including the control group. After 95 h of storage, the bacterial population reached a steady state.
This indicates either that environmental bacteria other than coliforms are less sensitive to silver disinfection than coliforms or that silver renders coliforms uncultivable on standard media. Further pathogen-specific inactivation experiments are required to determine their specific sensitivities to silver disinfection.
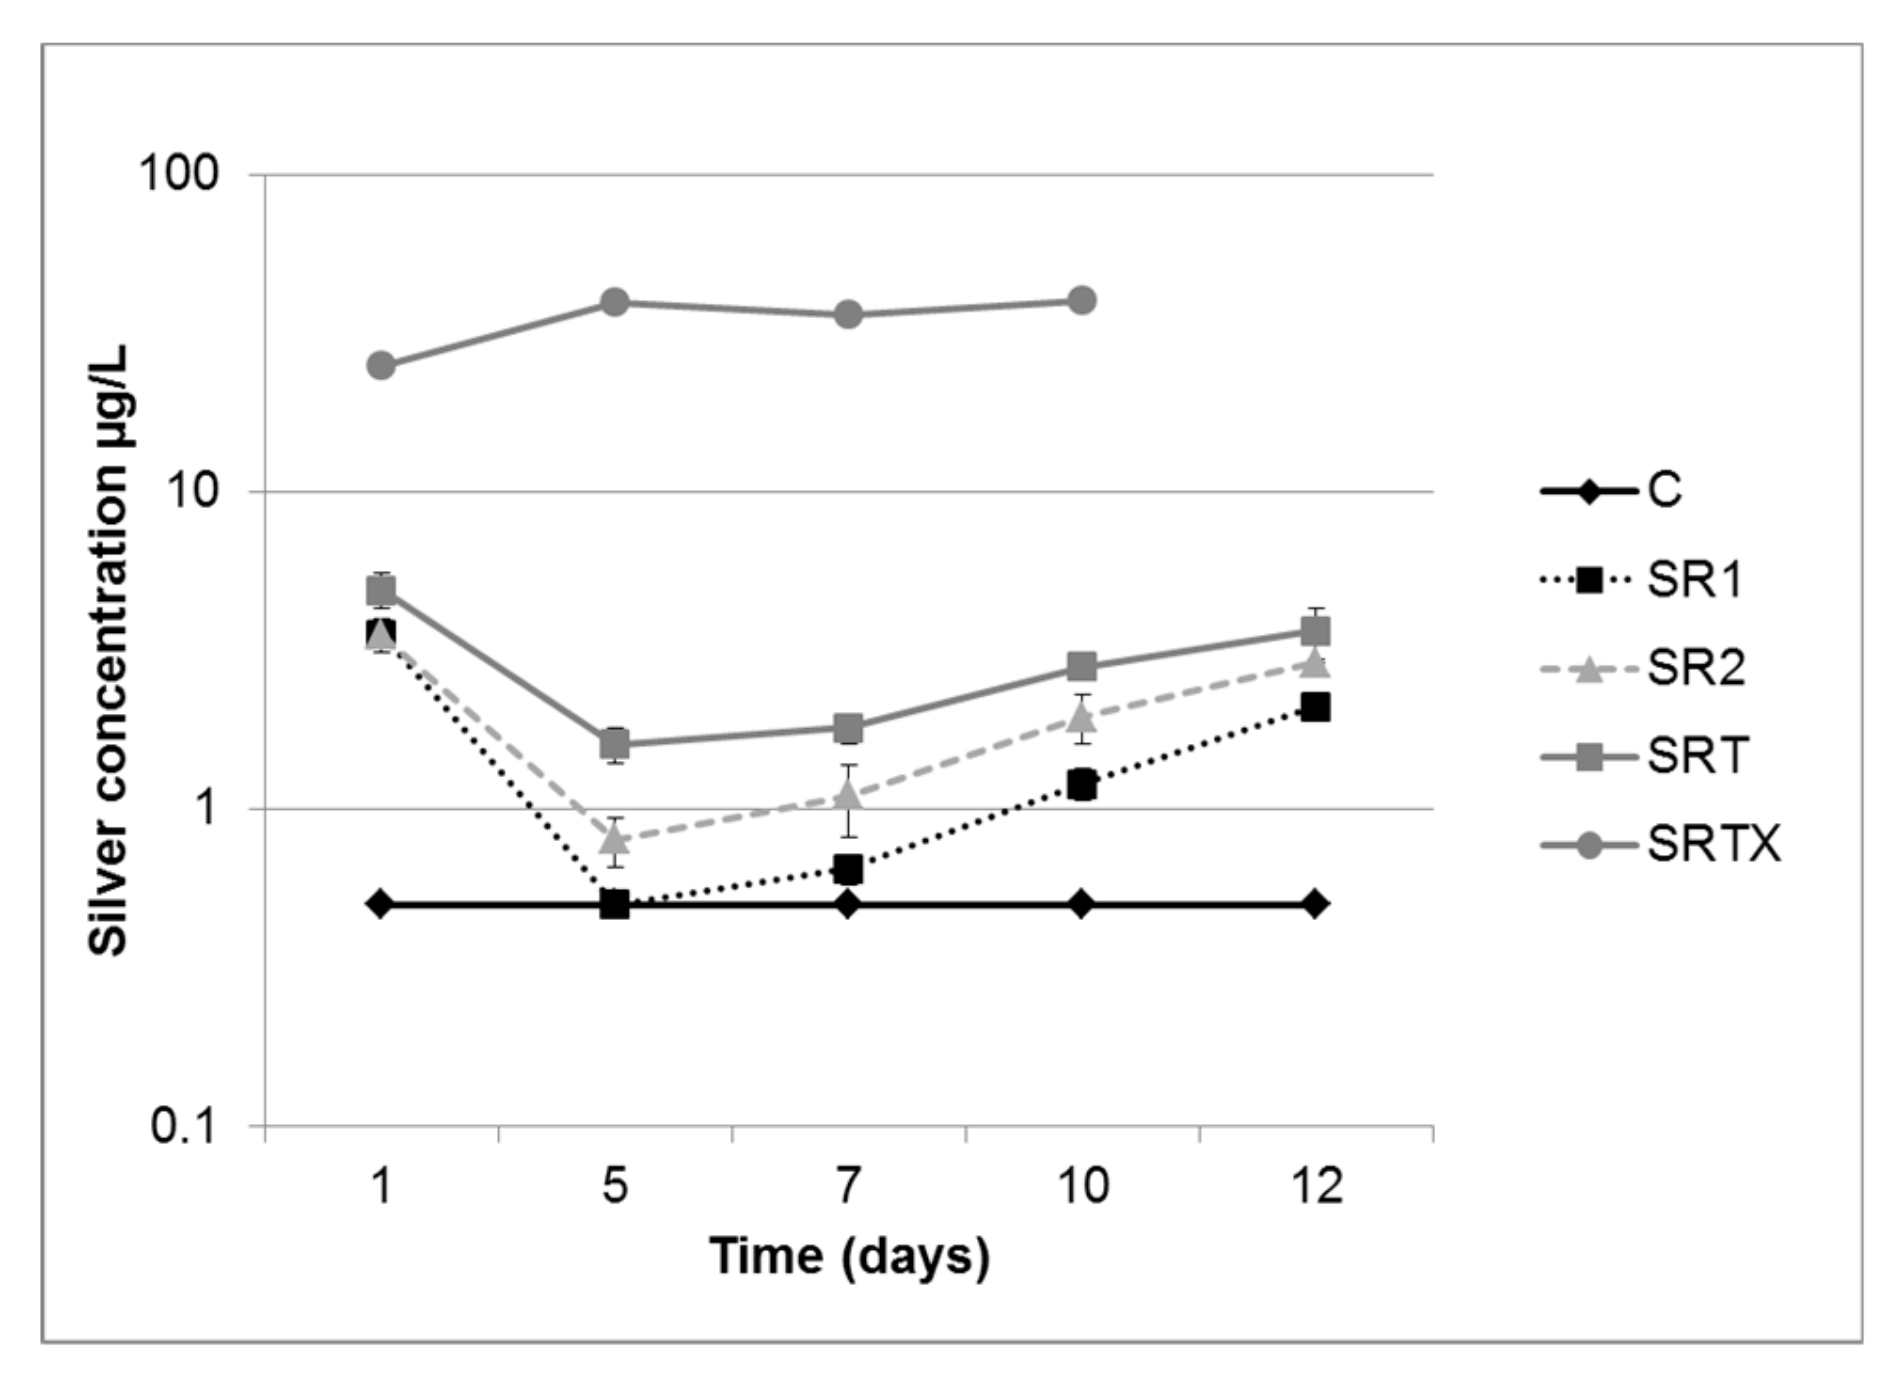
The diffusion of silver into water during storage was measured over a duration of 12 days in creek water that was diluted 1:1 with tap water. Figure 4 shows that measurements did not detect any concentrations above 5 µg Ag/L except for one container (SRTX), in which silver diffusion increased up to 40 µg Ag/L over a duration of 10 days. This concentration is still well below the WHO standard of 100 µg/L for silver in drinking water, but it indicates that inhomogeneity can occur during the production of the material. Higher initial silver diffusion rates were found during the first days. This can be explained by the presence of some remaining silver ions from the material’s production process, which were washed out during the first days of utilization. Diffusion of silver during storage in nanopure water was measured over a duration of 12 days and revealed a diffusion of 403 µg Ag/L. The detection limit is 0.5 µg Ag/L.
3.2. Effect of Activated Silver on Water Quality in Ceramic Filters at Household Level
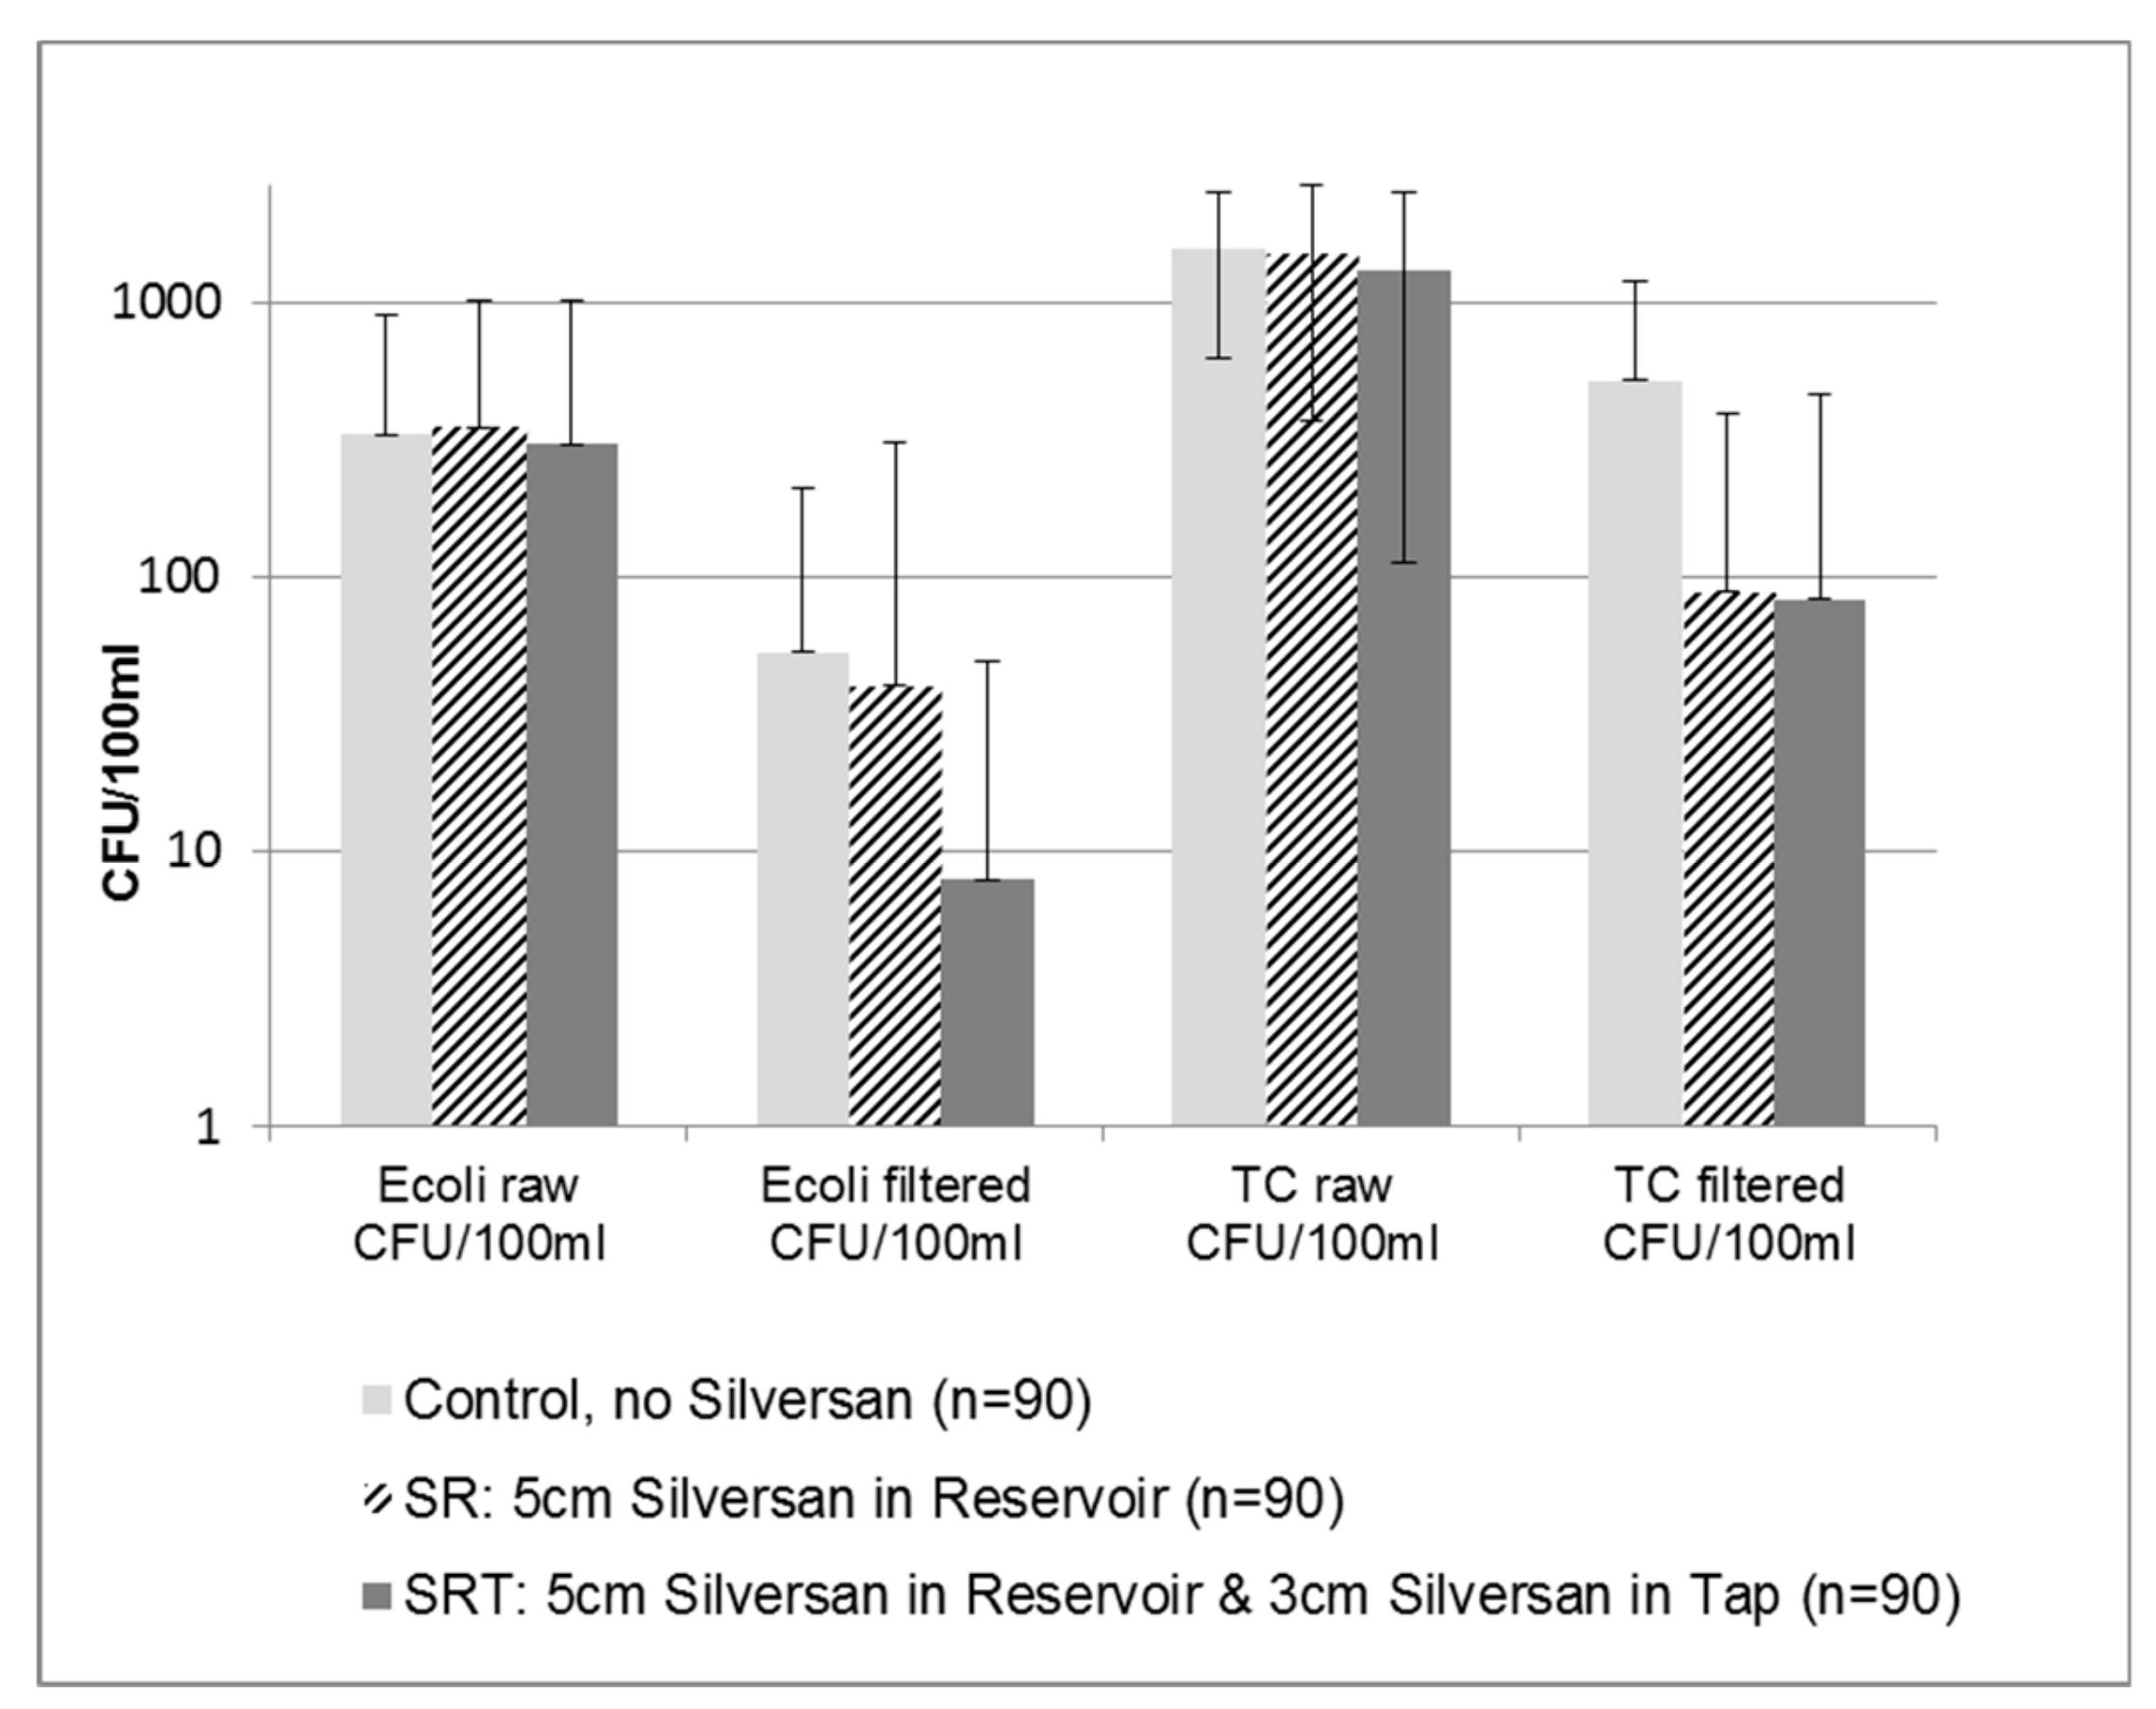
Figure 5 displays counts of E. coli and total coliforms in raw water and filtered water in ceramic filters used by 90 households living in a rural area near Kisumu, Kenya. The graph displays the mean of three household visits because differences in mean bacterial concentrations measured during different visits did not differ statistically within each group. ANOVA analysis did not detect any statistically significant difference in mean counts of E. coli and total coliforms in raw water between the three groups.
LRVs for E. coli were 1.27 (SD = 1.2) in the control, 1.90 (SD = 1.3) in the SR group and 1.86 (SD = 1.2) in the SRT group (C = control, filter without silver, SR = filter with silver in reservoir and SRT = filter with silver in reservoir and tap). For total coliforms, LRVs were 0.9 (SD = 1) in the control, 2.6 (SD = 1.4) in the SR group and 2.8 (SD = 1.3) in the SRT group.
Planned contrasts in ANOVA analysis revealed that LRVs for both E. coli and total coliforms were significantly different between the control group and the groups with activated silver in the filters, with t(264) = 3.786, p = 000 for E. coli and t(211) = 11.96, p = 0.000 for total coliforms. No statistically significant difference in LRVs for E. coli or for total coliforms was found between the SR group and the SRT group. In contrast to findings from the laboratory, the placement of silver in the tap did not yield better water quality.
While field experiments revealed that ceramic filters containing activated silver yielded significantly better water quality than filters not containing silver, no difference was found between the two filter configurations containing silver. Counts of coliforms in the SR group, with 5 cm of silver in the reservoir, did not differ significantly from those of the SRT group, with 5 cm of silver in the reservoir and 3 cm in the tap.
Water in the reservoir of the ceramic filters was tested for residual chlorine during the final household visit because chlorination products had been distributed to all households participating in the study during the previous household visit. Households were instructed not to chlorinate the water in the filters but to chlorinate water before consumption. Among the 90 households tested during the final household visit, only two (2.2%) were found to have residual chlorine in filtered water. In both cases, a concentration of 0.5 µg/L of free residual chlorine was measured.
3.3. Influence of Water Handling and Hygiene on Water Quality
Multivariate linear regression was calculated to assess the influence of water-handling practices and hygiene on LRVs. Only variables that were significantly correlated during bivariate analysis were included in the model. The following variables were included in the multivariate model: group membership, the water source used the last time water was collected, cleaning the inside of the ceramic pot with a brush, cleaning the outside of the ceramic pot with a utensil, condition of the water storage container, type of household’s toilet, and the number of times that hands were washed with soap the previous day.
In the first regression model with LRV of E. coli as the outcome variable, only group membership was significantly related (B = 0.3, SE = 0.095, β = 0.196, p = 0.002, R2 = 0.051). In the second regression model with LRV of total coliforms as the outcome variable, the following variables were significantly correlated (Model R2 = 0.297):
- Group membership (B = 0.96, SE = 0.098, β = 0.5, p = 0.000)
- Cleaning the inside of the pot with a brush (B = 0.39, SE = 0.196, β = 0.12, p = 0.046)
4. Conclusions
Both laboratory tests and field trials, revealed that metallic silver with a chemically etched surface can reduce the microbiological recontamination risks of coliform bacteria during water storage despite the low diffusion of silver ions (<5 µg Ag/L). The effect is strongly influenced by water chemistry parameters. Total coliforms were generally more sensitive to disinfection than E. coli. The application of higher quantities of activated silver generally resulted in higher inactivation rates in the laboratory but not in the field experiments.
Water quality assessments using E. coli and total coliforms as indicators indicated a small protective effect of activated metallic silver on water quality. However, mean contamination levels of treated water in the reservoirs of ceramic filters measured during the field trials were in WHO’s low risk category (1–10 E. coli/100 mL) only for the SRT group with activated silver in both the tap and the reservoirs. Mean contamination levels of E. coli in the control group and in the SR group with activated silver in the reservoir were both in the intermediate risk category (10–100 E. coli/100 mL). These contamination levels still pose a significant health concern. Higher amounts of silver may be needed to achieve satisfactory protection of the treated water. However, the use of higher quantities of silver in water treatment has to be considered with caution in view of the potential toxic effects of silver ions.
The evaluation of several water handling and hygiene factors in multivariate linear regression models revealed that the presence or absence of silver in the filter used by the household was significantly associated with the LRVs of E. coli and total coliforms at household level. In addition, cleaning the filter element with a brush was also correlated with the LRV of total coliforms. This shows that in addition to the application of silver, suitable filter cleaning practices can reduce recontamination risks during the storage of treated water in the filter. The corresponding know-how should be established in users.
Although a significant effect of activated silver on reducing the regrowth of E. coli and total coliforms was observed, this effect cannot be extended to all classes of bacteria. Further trials are required to determine the effect of activated silver on other pathogens and to assess the influence of natural chemical water quality parameters.
Author Contributions
Conceptualization, R.M., J.O. and A.O.; Formal analysis, R.M. and P.R.; Funding acquisition, R.M.; Investigation, P.R., J.O. and A.O.; Methodology, R.M. and P.R.; Project administration, R.M., J.O. and A.O.; Supervision, R.M., P.R., J.O. and A.O.; Writing—original draft, R.M., P.R., J.O. and A.O.
Funding
This research was funded by the Vontobel Foundation.
Acknowledgments
We thank Frederik Hammes and Denise Freudemann from Eawag for their help in conducting the flow cytometric measurements and analyzing the diffusion of silver. We also extend our gratitude to the communities in Kandhere, Kowi, Kanyambuyi, and Kanyawegi.
Conflicts of Interest
The authors declare no conflict of interest.
References
- Prüss-Ustün, A.; Bartram, J.; Clasen, T.; Colford, J.M.; Cumming, O.; Curtis, V.; Bonjour, S.; Dangour, A.D.; De France, J.; Fewtrell, L.; et al. Burden of disease from inadequate water, sanitation and hygiene in low- and middle-income settings: A retrospective analysis of data from 145 countries. Trop. Med. Int. Health 2014, 19, 894–905. [Google Scholar] [CrossRef]
- WHO. Investigating in Water and Sanitation: Increasing Access, Reducing Inequalities; WHO: Geneva, Switzerland, 2014. [Google Scholar]
- Onda, K.; Lobuglio, J.; Bartram, J. Global access to safe water: Accounting for water quality and the resulting impact on mdg progress. Int. J. Environ. Res. Public Health 2012, 9, 880–894. [Google Scholar] [CrossRef]
- Kenya National Bureau of Statistics (KNBS). Kenya Demographic and Health Survey 2014; Kenya National Bureau of Statistics: Nairobi, Kenya, 2014. [Google Scholar]
- Wright, J.; Gundry, S.; Conroy, R. Household drinking water in developing countries: A systematic review of microbiological contamination between source and point-of-use. Trop. Med. Int. Health 2004, 9, 106–117. [Google Scholar] [CrossRef]
- Momba, M.N.B.; Kaleni, P. Regrowth and survival of indicator microorganisms on the surfaces of household containers used for the storage of drinking water in rural communities of south africa. Water Res. 2002, 36, 3023–3028. [Google Scholar] [CrossRef]
- Brown, J. Effectiveness of Ceramic Filtration for Drinking Water Treatment in Cambodia. Ph.D. Thesis, University of North Carolina, Chapel Hill, NC, USA, 2007. [Google Scholar]
- Murphy, H.M.; Sampson, M.; McBean, E.; Farahbakhsh, K. Influence of household practices on the performance of clay pot water filters in rural cambodia. Desalination 2009, 248, 562–569. [Google Scholar] [CrossRef]
- Lantagne, D.; Klarman, M.; Mayer, A.; Preston, K.; Napotnik, J.; Jellison, K. Effect of production variables on microbiological removal in locally-produced ceramic filters for household water treatment. Int. J. Environ. Health Res. 2010, 20, 171–187. [Google Scholar] [CrossRef]
- Brown, J.; Sobsey, M.D. Microbiological effectiveness of locally produced ceramic filters for drinking water treatment in cambodia. J. Water Health 2010, 8, 1–10. [Google Scholar] [CrossRef] [PubMed]
- Oyanedel-Craver, V.A.; Smith, J.A. Sustainable colloidal-silver-impregnated ceramic filter for point-of-use water treatment. Environ. Sci. Technol. 2008, 42, 927–933. [Google Scholar] [CrossRef] [PubMed]
- Mittelman, A.M.; Lantagne, D.S.; Rayner, J.; Pennell, K.D. Silver dissolution and release from ceramic water filters. Environ. Sci. Technol. 2015, 49, 8515–8522. [Google Scholar] [CrossRef] [PubMed]
- Rayner, J.; Zhang, H.; Schubert, J.; Lennon, P.; Lantagne, D.; Oyanedel-Craver, V. Laboratory investigation into the effect of silver application on the bacterial removal efficacy of filter material for use on locally produced ceramic water filters for household drinking water treatment. ACS Sustain. Chem. Eng. 2013, 1, 737–745. [Google Scholar] [CrossRef]
- Van der Laan, H.; van Halem, D.; Smeets, P.W.M.H.; Soppe, A.I.A.; Kroesbergen, J.; Wubbels, G.; Nederstigt, J.; Gensburger, I.; Heijman, S.G.J. Bacteria and virus removal effectiveness of ceramic pot filters with different silver applications in a long term experiment. Water Res. 2014, 51, 47–54. [Google Scholar] [CrossRef] [PubMed]
- Mellor, J.E.; Kallman, E.; Oyanedel-Craver, V.; Smith, J.A. Comparison of three household water treatment technologies in san mateo ixtatán, guatemala. J. Environ. Eng. 2015, 141. [Google Scholar] [CrossRef]
- Ehdaie, B.; Krause, C.; Smith, J.A. Porous ceramic tablet embedded with silver nanopatches for low-cost point-of-use water purification. Environ. Sci. Technol. 2014, 48, 13901–13908. [Google Scholar] [CrossRef]
- Ehdaie, B.; Rento, C.T.; Son, V.; Turner, S.S.; Samie, A.; Dillingham, R.A.; Smith, J.A. Evaluation of a silver-embedded ceramic tablet as a primary and secondary point-of-use water purification technology in limpopo province, S. Africa. PLoS ONE 2017, 12, e0169502. [Google Scholar] [CrossRef] [PubMed]
- Kahler, M.D.; Koermer, T.N.; Reichl, R.A.; Samie, A.; Smith, A.J. Performance and acceptance of novel silver-impregnated ceramic cubes for drinking water treatment in two field sites: Limpopo province, south africa and dodoma region, tanzania. Water 2016, 8, 95. [Google Scholar] [CrossRef]
- Fewtrell, L.; Majuru, B.; Hunter, P.R. A re-assessment of the safety of silver in household water treatment: Rapid systematic review of mammalian in vivo genotoxicity studies. Environ. Health 2017, 16, 66. [Google Scholar] [CrossRef]
- Hadrup, N.; Lam, H.R. Oral toxicity of silver ions, silver nanoparticles and colloidal silver—A review. Regul. Toxicol. Pharmacol. 2014, 68, 1–7. [Google Scholar] [CrossRef]
- Lubick, N. Nanosilver toxicity: Ions, nanoparticles—Or both? Environ. Sci. Technol. 2008, 42, 8617. [Google Scholar] [CrossRef]
- Navarro, E.; Piccapietra, F.; Wagner, B.; Marconi, F.; Kaegi, R.; Odzak, N.; Sigg, L.; Behra, R. Toxicity of silver nanoparticles to chlamydomonas reinhardtii. Environ. Sci. Technol. 2008, 42, 8959–8964. [Google Scholar] [CrossRef]
- Meyers, R.S. Pediatric fluid and electrolyte therapy. J. Pediatr. Pharmacol. Ther. 2009, 14, 204–211. [Google Scholar]
- Lörcher, K.P. Silversan/Secosan Test Reports; Institut Dr. Lörcher. Zugelassene Untersuchungsstelle nach §19 Trinkwasserverordnung: Heilbronn, Germany, 2009. [Google Scholar]
- Szivák, I.; Behra, R.; Sigg, L. Metal-induced reactive oxygen species production in chlamydomomas reinhardtii (chlorophyceae). J. Phycol. 2009, 45, 427–435. [Google Scholar] [CrossRef] [PubMed]
- Berney, M.; Hammes, F.; Bosshard, F.; Weilenmann, H.-U.; Egli, T. Assessment and interpretation of bacterial viability by using the live/dead baclight kit in combination with flow cytometry. Appl. Environ. Microbiol. 2007, 73, 3283–3290. [Google Scholar] [CrossRef] [PubMed]
- Zhang, H.; Smith, J.A.; Oyanedel-Craver, V. The effect of natural water conditions on the anti-bacterial performance and stability of silver nanoparticles capped with different polymers. Water Res. 2012, 46, 691–699. [Google Scholar] [CrossRef] [PubMed]
Figure 1.
Bacterial inactivation in water storage containers containing activated silver in creek water: (a) E. coli; (b) total coliforms. (C = Control (n = 2), EC = E. coli, TC = Total coliforms, SR1 = 3 cm Silversan in bucket (n = 3), SR2 = 5 cm Silversan in bucket (n = 1), SRT = 3 cm Silversan in bucket and 1.5 cm Silversan in tap (n = 3), SRTX = 5 cm Silversan in bucket and 3 cm Silversan in tap (n = 1), Volume: 6 L, Temp: 20 °C).

Figure 2.
Bacterial inactivation in water storage containers containing activated silver and a mixture of 1:1 tap-/creek water: (a) E. coli; (b) total coliforms. (C = Control (n = 2), EC = E. coli, TC = total coliforms, SR = 5 cm Silversan in bucket (n = 2), SR2 = 8 cm Silversan in bucket (n = 3), SRT = 5 cm Silversan in bucket and 3 cm Silversan in tap (n = 3), Volume: 6 L, Temp: 20 °C).

Figure 3.
Total number of intact bacteria in creek water diluted with tap water in ratio 1:1 (C = Control (n = 2), SR = 5 cm Silversan in bucket (n = 2), SRA = 8 cm Silversan in bucket (n = 3), SRT = 5 cm Silversan in bucket and 3 cm Silversan in tap (n = 3)).
Figure 3.
Total number of intact bacteria in creek water diluted with tap water in ratio 1:1 (C = Control (n = 2), SR = 5 cm Silversan in bucket (n = 2), SRA = 8 cm Silversan in bucket (n = 3), SRT = 5 cm Silversan in bucket and 3 cm Silversan in tap (n = 3)).

Figure 4.
Diffusion of silver over 13 days in creek water diluted with tap water in ratio 1:1: (C = Control (n = 2), SR1 = 5 cm Silversan in bucket (n = 2), SR2 = 8 cm Silversan in bucket (n = 3), SRT = 5 cm Silversan in bucket and 3 cm Silversan in tap (n = 3), SRTX = 5 cm Silversan in bucket and 3 cm Silversan in tap (n = 1)).

Figure 5.
Counts of E. coli and total coliforms in ceramic filters in three intervention groups.


Table 1.
Experimental configurations used during laboratory experiments.
| Experiment 1 (3 Configurations) | Experiment 2 (5 Configurations) | Experiment 3 (4 Configurations) | |
|---|---|---|---|
| Water Quality | 6 L contaminated tap water (no chlorine) | 6 L creek water | 3 L creek water |
| 3 L tap water | |||
| C: silver in control | 0 (n = 1) | 0 (n = 2) | 0 (n = 2) |
| SR1: silver in reservoir | 5 cm (n = 1) | 3 cm (n = 3) | 5 cm (n = 2) |
| SR2: silver in reservoir | 5 cm (n = 1) | 8 cm (n = 3) | |
| SRT: silver in reservoir and tap | 5 cm (reservoir) | 3 cm (reservoir) | 5 cm (reservoir) |
| 3 cm (tap) | 1.5 cm (tap) | 3 cm (tap) | |
| (n = 3) | (n = 3) | (n = 3) | |
| SRTX: silver in reservoir and tap | 5 cm (reservoir) | ||
| 3 cm (tap) | |||
| (n = 1) |
© 2019 by the authors. Licensee MDPI, Basel, Switzerland. This article is an open access article distributed under the terms and conditions of the Creative Commons Attribution (CC BY) license (http://creativecommons.org/licenses/by/4.0/).
Share and Cite
MDPI and ACS Style
Meierhofer, R.; Rubli, P.; Oremo, J.; Odhiambo, A. Does Activated Silver Reduce Recontamination Risks in the Reservoirs of Ceramic Water Filters? Water 2019, 11, 1108. https://doi.org/10.3390/w11051108
AMA Style
Meierhofer R, Rubli P, Oremo J, Odhiambo A. Does Activated Silver Reduce Recontamination Risks in the Reservoirs of Ceramic Water Filters? Water. 2019; 11(5):1108. https://doi.org/10.3390/w11051108
Chicago/Turabian StyleMeierhofer, Regula, Pascal Rubli, Jared Oremo, and Alloyce Odhiambo. 2019. "Does Activated Silver Reduce Recontamination Risks in the Reservoirs of Ceramic Water Filters?" Water 11, no. 5: 1108. https://doi.org/10.3390/w11051108
Note that from the first issue of 2016, this journal uses article numbers instead of page numbers. See further details here.