Necessity of Acknowledging Background Pollutants in Management and Assessment of Unique Basins

1
Department of Water Environment, China Institute of Water Resources and Hydropower Research, Beijing 100038, China
2
College of Hydrology and Water Resources, Hohai University, Nanjing 210098, China
3
State Key Laboratory of Simulation and Regulation of Water Cycle in River Basin, China Institute of Water Resources and Hydropower Research, Beijing 100038, China
*
Author to whom correspondence should be addressed.
Water 2019, 11(5), 1103; https://doi.org/10.3390/w11051103
Submission received: 22 April 2019
/
Revised: 21 May 2019
/
Accepted: 23 May 2019
/
Published: 27 May 2019
(This article belongs to the Special Issue Water Resources Management Models for Policy Assessment)
Abstract
:The limitations of water quality management and assessment methods in China can be ascertained by comparison with other countries. However, it is unreasonable to use a uniform standard to evaluate water quality throughout China because one standard cannot fully account for the regional differences in background water quality. This study aimed to provide a basis for environmental water management decision-making. Areas seriously affected by background pollutants were identified by comparing several factors across 31 provinces in China. By coupling an improved export coefficient model (ECM) with a mechanistic model, a suitable pollutant yield coefficient was determined and its rationality was analysed. The export coefficient model was applied to estimate the pollutant (chemical oxygen demand and ammonia nitrogen) output of the basin in 2015. The spatial distribution characteristics of the pollutants were determined by simulating the pollutant outputs of 22 sub-basins and nine water function zones. For the year 2020, the simulation results of pollutant outputs far exceed the sewage discharge limit in water function zones and the pollutant concentration was much higher than the standard. Considering background pollutant outputs, more reasonable sewage discharge limit and water quality evaluation method are proposed.
1. Introduction
The water environment is closely related to human life and production, and its protection, control, and management, as well as prevention of pollution, are the focus of scholars in the field of environmental research [1,2,3,4,5]. In order to understand the characteristics of regional water environments and control water pollution, a large number of models have been developed thus far to simulate non-point source pollution loads and provide a basis for regional water environment control and planning [6,7,8,9].
With the development of the economy in China, the government is paying increasingly more attention to environmental problems, further illustrating the importance of addressing environmental issues by expanding the functions of the Ministry of Ecology and Environment in the institutional reform program of the state council, 2018. In 2011, the strictest water resources management system (three red lines) was proposed by the Ministry of Water Resources of the People’s Republic of China to control the total water consumption, improve water use efficiency, and limit sewage discharge. The sewage discharge limit implies the control of the regional water environment, that is, developing the economy while ensuring the safety of the water ecological environment.
A scientific and reasonable water quality assessment method is an important basis for water quality management and assessment [10,11,12]. The approaches and methods of water quality management in other countries have been considered; for example, the United States does not have a unified national water environmental quality standard [13], but the environmental protection agency (EPA) has developed a technical guide to determine water quality benchmarks. Each state can formulate its water quality standard through published technical guidelines for water quality benchmarks in combination with the actual situation of the state [14]. The Canadian Council of Ministers of the Environment (CCME) stipulates that the water quality of water sources should be evaluated using the Canadian Water Quality Index [15,16]. The scores of different water bodies (0–100) can be calculated by the index equation. Water bodies can be divided into five levels: clean (95–100), good (80–94), medium (60–79), passing (45–59), and poor (0–44) [15]. However, in China, the water quality evaluation standard and method lack objectivity and scientificity because of regional differences, and comprehensive indicators have not been taken into account. The current evaluation standard of surface water quality in China is based on the environmental quality standard for surface water (GB 3838-2002), which classifies water quality pollution into six categories based on pollutant concentration. The evaluation method is a single factor evaluation method in which water quality is considered to be below the standard and requiring pollution control if one of the water quality detection indicators exceeds the standard. However, it is unfair to use the same water quality standard to restrict water quality in different regions, which are affected by background pollutants with varying degrees.
Background values, as the basis for distinguishing the impact of the natural environment and human activities on the environment, were proposed early last century and widely used in the environmental field [17,18], particularly in soil background elements and groundwater [19,20,21,22]. In contrast, the background value of surface water has been less studied because of its drastic spatial and temporal variability and complex influencing factors. However, it is particularly important to understand background pollutants in the formulation of water quality standards and water management [23]. In some areas of China, this will lead to misinformation in developing a water pollution control scheme due to the degree that water pollution will be overestimated due to the background pollutant problem [24,25,26,27].
In this study, the Tangwang River Basin, which is prominently affected by the background values, is taken as the research object. According to standard for water function zoning (GB/T50594-2010), the study area was divided into 9 water function zones with different water quality standards and service objects to guarantee the sustainable utilization of water resources (Table 1). Perennial low temperature and short frost-free period decreased soil microbial respiration activity, causing the accumulation of humic substances (HSs). This underlying surface condition produces organic erosion in the process of runoff [28,29] and brings a large amount of organic matter into the river, which leads to the chemical oxygen demand (COD) and ammonia nitrogen (NH3-N) exceeding the standard perennially (standard values are shown in Table 1). This also presents an obstruction for effective regional water quality control. Therefore, we have systematically studied the background value of the study area. The main contents are as follows: (1) Clear the influence of background values on the water quality in Heilongjiang by comparing the environmental characteristics and water quality standards of 31 provinces in China; (2) by coupling an improved export coefficient model (ECM) with a mechanistic model, the land use yield coefficients suitable for this study were determined and their rationalities were verified; (3) to quantitatively estimate the background pollutant outputs in 2015 using the improved ECM; (4) a reasonable and objective method for water quality management in the study area was proposed after considering background pollutant values.
2. Materials and Methods
2.1. Study Area
The Tangwang River is one of the ten rivers in Heilongjiang Province, China. The catchment area of its basin is about 21,000 km2 (Figure 1). The northern part of the basin is bounded by the Xiao Hinggan Mountains and connected with the left bank tributary of Heilongjiang River. The annual average temperature is 0.6 °C, and the annual average temperature is below 0 °C, which is observed for five months. The annual precipitation varies from 530 to 700 mm, with precipitation from May to September accounting for 75% of the total annual precipitation. The main types of soil are dark brown loam and swamp soil rich in organic matter, and the forest coverage in the basin is as high as 87.9%. Perennial freeze-thaw alternation prevents complete decomposition of litter and HSs accumulates on the surface. Moreover, litter decompose slowly and accumulate massively on the surface owing to the special climatic and hydrological conditions [30,31,32]. Consequently, a large amount of organic matter flows into the river with rainfall-runoff, resulting in degraded regional water quality.
2.2. Data Source
The main data used in this study included data on land-use types, precipitation, synchronous monitoring data of water quality and quantity and socio-economic statistics (Table 2). Spatial data were processed in ArcGIS 10.2.
Data from the hydrological stations (H1–H3) were for January 2011 to December 2013, and the synchronous monitoring of water quality and quantity at the hydrological stations was done twice a month in the dry season (January–March and October–December) and three times a month in the wet season (April–September). Data from the monitoring stations (S1–S9) were for January 2005 to December 2014 and done once a month. Data from the background monitoring stations (1–18) were for May 2015 and done only once.
2.3. Model Structure
The ECM has certain applicability to simulate the pollution load for areas with insufficient data. The improved ECM can increase the accuracy and applicability of estimating the pollution output in river basins [6,7,33,34]. The study area is located in a mountainous area with 90% of the slope above 85°. The improved ECM used in this study varies from that used in previous studies, in which terrain factors were not considered. The rainfall influence factor and runoff-migration influence factor were taken into account in the improved model. The basic equations are as follows:
where is the pollutant export coefficient for land use of type i, is the total land use area for type i, is the interannual variation factor for rainfall, is the spatial variation factor for rainfall, is the total annual precipitation for a year (mm), is the average annual rainfall (11 years of rainfall data were selected), is the precipitation of grid a, b (mm), and is the average annual rainfall of grid a, b (mm). is the runoff-migration influence factor because most of the study area is forestland and the effect of the underlying surface on runoff interception is obvious. This paper considers runoff coefficient rather than topographic factors. The formulas are as follows:
where Q is the average annual discharge of the sub-basin (m3/s), and P is the total precipitation of the sub-basin (m3). The total annual pollutant output of the river is calculated according to the pollutant concentration and discharge at the outlet of the river basin.
where is the pollutant monthly average concentration for month j in the river basin, and Qj is the pollutant monthly average discharge for j months in the river basin.
In the study area, land use is mainly forest and grassland, followed by farmland, residential land, and another land account for a relatively low proportion. Therefore, only the pollution sources from forest and grassland and farmland were considered in the ECM. The output of pollutants from residential land and other land was calculated according to local sewage discharge information.
is the discharge of human pollution sources in the basin for areas with a single land use type. The formulas can be translated as follows:
2.4. Management and Assessment Method
In 2011, the Central Committee released Document No. 1, which clearly stated that the most stringent water resource management system should be implemented, and the “three red lines” of total water use control, water use efficiency control, and restriction of pollution acceptance in water function zones should be established. The third one is to strengthen the management of water function zones for restricting pollution acceptance, such that the total amount of main pollutants entering rivers and lakes can be controlled within the scope of the pollution acceptance capacity of rivers, and the rate at which water function zones meet the water quality standard should be increased to more than 95%.
Water pollution acceptance capacity is an important basis for regional water pollution control and management. It consists of two parts: the first part is called target capacity, which is determined by the difference between water flow rate, environmental quality target, and baseline value; the second part is called degradation capacity [35,36]. There are many methods for calculating water pollution acceptance capacity. The following one-dimensional calculation formula is suitable for rivers with uniform pollutant mixing:
where S is the water pollution acceptance capacity, Q is the outlet discharge of basin, C is the standard value of pollutant concentration, C0 is the outlet concentration, K is the comprehensive degradation coefficient of pollutants, and V is the regional environmental volume. S is closely related to water quality standards and management objectives and plays a restrictive role in regional socio-economic development.
According to GB/T50594-2010, the study area was divided into nine water function zones. The types and water quality standards are listed in Table 1. When the water quality monitoring value is higher than the water quality standard value (permissible maximum value), it will exceed the standard, and regional pollution discharge should be controlled.
3. Results and Discussion
3.1. Impact of Background Pollutants
There are 194 water function zones on the main rivers in Heilongjiang Province. Among them, the Tangwang River Basin is divided into nine water function zones. Figure 2 compares the population density, annual discharge of COD and NH3-N per unit area, forest land coverage, and rate of water function zones reaching the standard in 31 provinces of China. The population density is 87 persons/km2, the annual discharge of COD and NH3-N per unit area are 0.86 and 0.12 t/km2a, respectively, in Heilongjiang Province. In addition, the forest coverage is relatively high, indicating the good maintenance of the ecological environment in Heilongjiang Province. However, the rate of water function zones meeting the standard is insufficient (Figure 2e). According to the response of the local water quality management department, the main reason for the low rate is that COD and NH3-N exceed the permissible maximum value.
The results shown in Figure 2 confirm that the water quality in Heilongjiang Province is affected by background pollutants. Because Heilongjiang Province is located in northeast China, low annual average temperatures and short frost-free periods inhibit biological activity, resulting in the accumulation of a large amount of partially decomposed litter to form a thicker humus layer. In addition, perennial freeze-thaw alternation causes the breakdown of plant residual cells and the easy dissolution of organic solutes [30]. Moreover, the influx of runoff into rivers leads to excessive pollutants in rivers, which further affects the management and assessment of regional water quality. Therefore, research on background pollutants is very important for the study area.
3.2. Pollutant Yield Coefficient
Common methods for determining the export coefficient are literature consultation, field monitoring, and statistical data consultation; many scholars have based their export coefficients on previous studies [6,7]. The study area features a single type of land use, mainly forest land and farmland, which account for 93.9% of the total area. The special geographical location and hydro-climatic conditions have led to the formation of the underlying surface with high humus content, which results in the high pollutant yield under the action of runoff erosion. Therefore, if the export coefficient of this region is derived from land use in other regions, large errors will occur in the simulation results. According to the three water quality and quantity monitoring stations shown in Figure 1, the whole basin is divided into the upper, middle and lower parts. The land use in the upstream source area is forest and grassland, accounting for 95.8%. The pollutant yield coefficient for forest and grassland can be determined using Formula 9 rather than the export coefficient, considering the runoff-migration influence factor. Then, the pollutant yield coefficient for farmland can be calculated according to the middle and lower reaches.
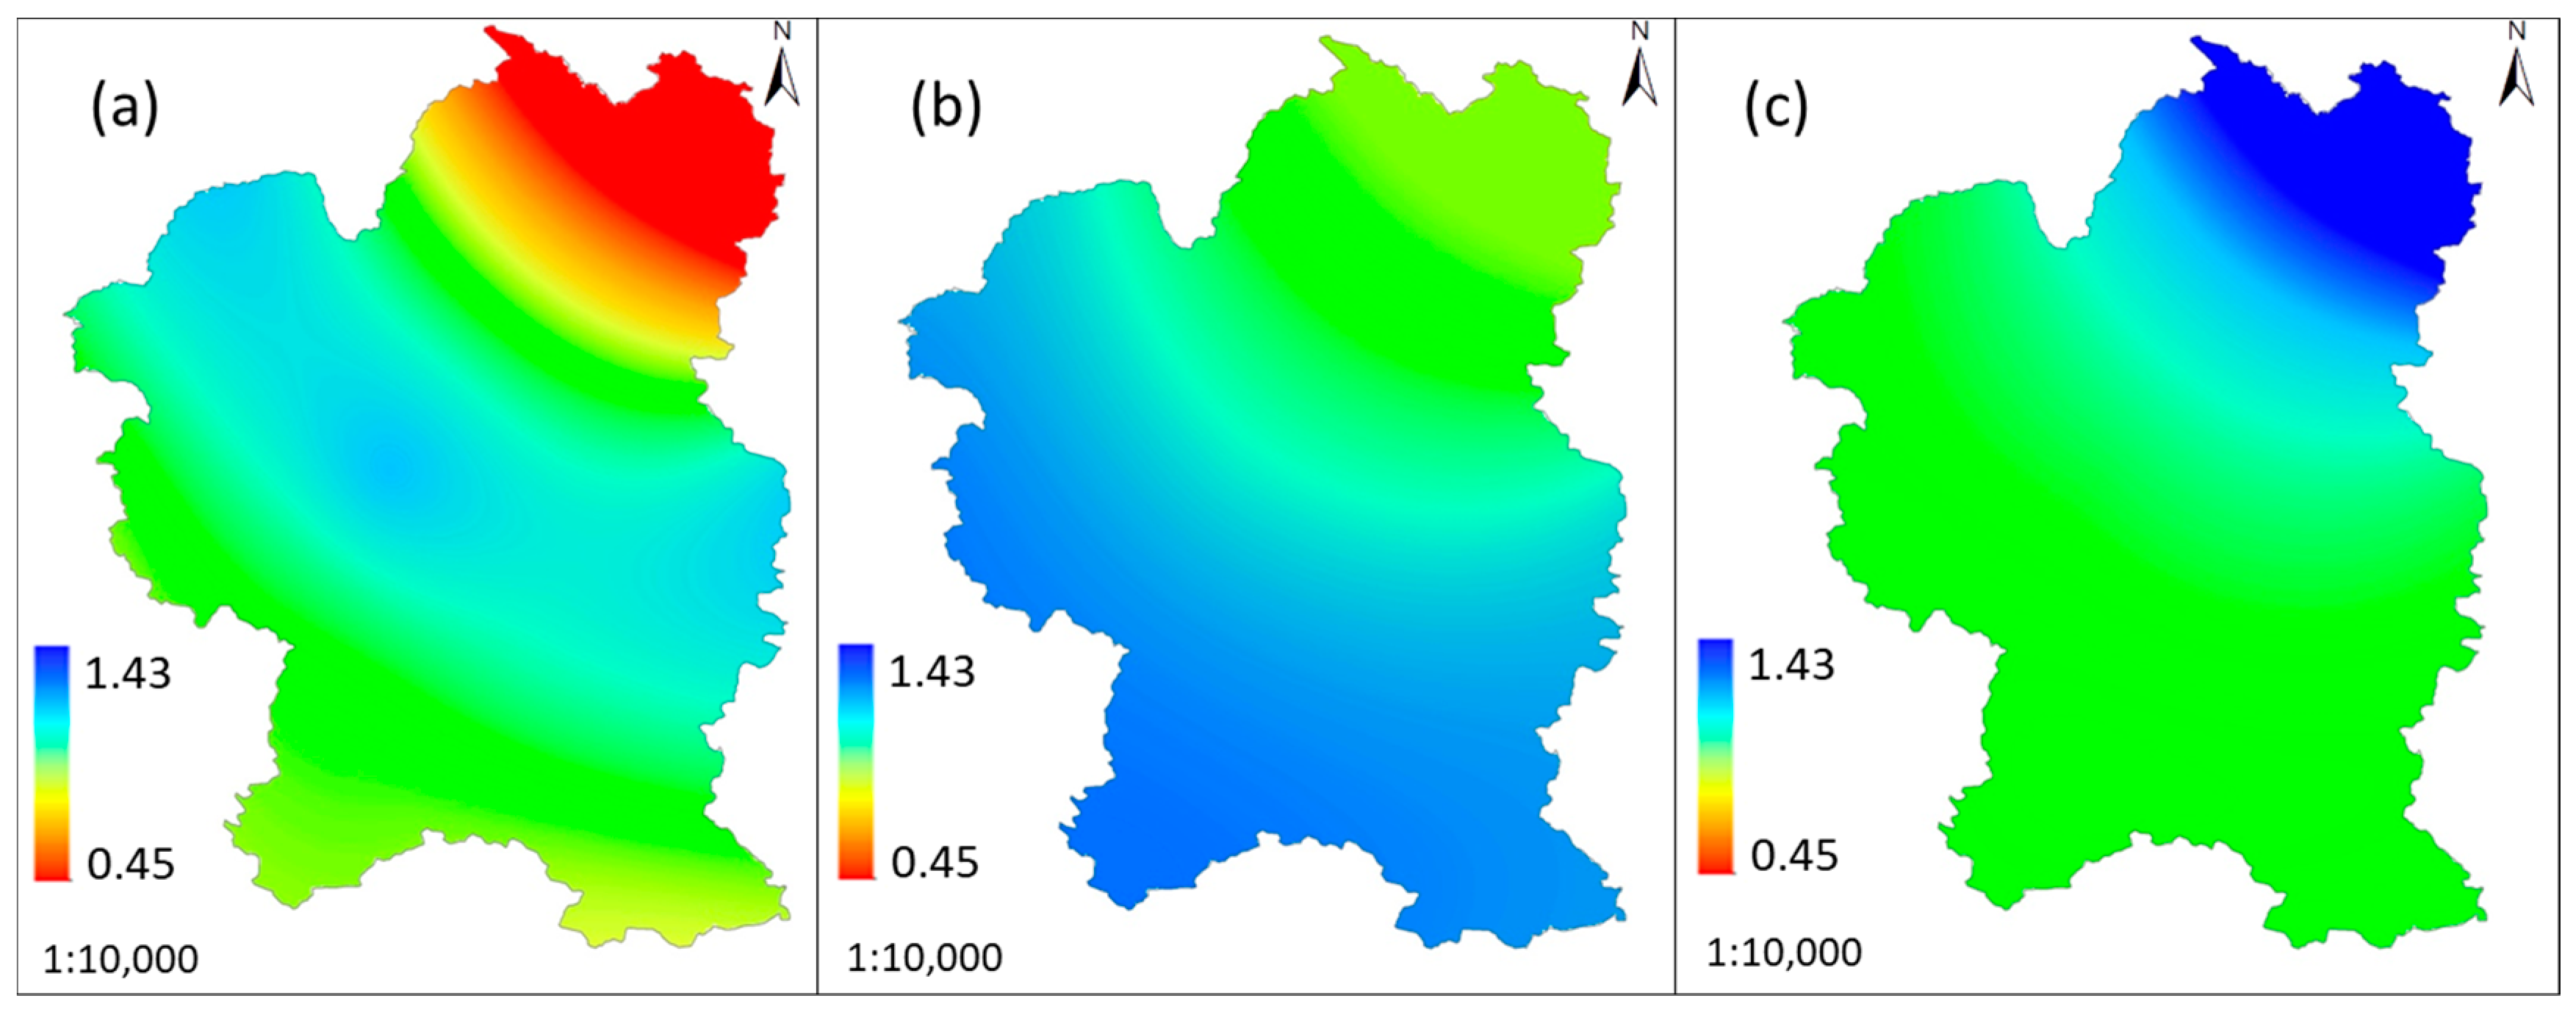
The distribution of the rainfall influence factor in the study area for three years from 2011 to 2013 is shown in Figure 3. It ranges from 0.45 to 1.43, with greater values in 2012 and 2013 than in 2011.
According to Formula (5), the distribution of the runoff-migration influence factor is calculated by using a grid calculator. The values range from 0.28 to 0.66 (Figure 4).
Based on the monitoring data from 2011 to 2013, the COD and NH3-N yield coefficients for forest and grassland in the study area were calculated. The average values calculated over 2011 to 2013 were brought into the lower and middle reaches and the yield coefficient for farmland for 2011–2013 was determined using Formula 9 (Table 3). Compared with the export coefficient of land use in previous studies, the yield coefficient calculated was much larger than that in previous studies. This is due to the essential difference between the pollutant export coefficient and yield coefficient in terms of loss through runoff. The COD yield coefficients for forest and grassland, and farmland were 28.1 t/km2a and 15.8 t/km2a, respectively, and their NH3-N yield coefficients were 0.47 t/km2a and 1.77 t/km2a, respectively.
The land use yield coefficient is much higher than that listed in the literature [37,38], which is why the region is heavily affected by background pollutants. In order to demonstrate the applicability of the high yield coefficient obtained in this study, the whole basin was divided into the background and non-background areas according to land use, and water quality monitoring stations were set up in the background area (May 2015, sampling site: 1–19). The distributions of values exceeding the standard (Table 1) of water quality are shown in Figure 5. The upstream standard value is lower than that in the middle and lower reaches. Therefore, values exceeding the standard value at each monitoring point decrease gradually from upstream to downstream.
The concentration of pollutants also appears to be high in regions with almost no human activities, which shows that the high yield coefficient obtained is consistent to a certain extent. Distribution of values exceeding the standard further proves that water quality is affected by the background values of COD and NH3-N and the degree of impact is greater. Therefore, it is unreasonable that higher concentrations of pollutants caused by natural factors are considered to be substandard.
The correlation between perennial monthly mean pollutant concentration and flow was determined on the basis of the data from synchronous monitoring of water quality and quantity at three monitoring stations (S1, S3, S9) from 2001 to 2014 (Figure 6). The results show that the correlations between COD, NH3-N, and flow in the upstream region are high (0.69 and 0.60, respectively). In the middle and downstream regions, the correlation between COD and flow was lower than that in the upstream region (0.60). This may be attributed to sewage discharge in the middle and downstream regions. However, a negative correlation was observed between NH3-N and flow, which may indicate that the impact of human sewage on NH3-N output in the river basin is relatively large compared with that of COD.
3.3. Pollutant Load and Management
The study area was divided into 22 sub-basins according to elevation data and catchment area. Among them, the 22nd sub-basin is the catchment area of the main stream of Tangwang River and others flow into the mainstream. To control the pollutant load into the main stream, it is necessary to know the pollutant load into each sub-basin. According to the results of ECM simulation combined with the investigation of human pollution sources, the pollutant output of each sub-basin for 2015 was estimated (Figure 7). The pollutant load in the main stream area was the highest, followed by sub-basins 16 and 21, which are the focus of pollution prevention and control. The pollutant load in several sub-basins in the upper reaches was found to be relatively low. Overall, the basin showed a trend of an increasing load from the upstream to downstream areas.
According to GB/T50594-2010, the Tangwang River Basin was divided into nine water function zones, and the pollutant output of the water function zones in 2015 was simulated (Figure 8). The simulated values of COD ranged from 6.2 × 10⁴ to 0.21 × 10⁴ t. The largest pollutant output was a, followed by h, b and c, with outputs of 5.0, 4.5, and 4.3 × 10⁴ t; the NH3-N simulation results ranged from 0.15 to 0.0086 × 10⁴ t. According to the sewage discharge limit of each water function zone for the planning year 2020, a considerable amount of pollutant output should be reduced. However, a large part of the pollutant output in several water function zones is caused by background pollutants. Therefore, the regional sewage discharge limit should be reconsidered with the regional background pollutants in mind.
The spatial distribution of the NH3-N pollutant output was different from that of COD. The main reason for this difference is that the discharge amounts of COD and NH3-N in each water functional area were different. The output of COD was higher upstream than downstream, while the output of NH3-N showed the opposite pattern. This shows that the influence on sewage discharge of NH3-N was significantly higher than that of COD in the middle and downstream areas.
In this paper, we suggest two methods for determining pollutant output. In the first method, the output of background pollutants (from forests and grasslands) is not taken into account. The regional pollutant output is calculated according to the output of human pollution sources and farmland pollutants. The second method is to design a sewage discharge limit for the planning year considering the background pollution output and to provide an invariable value for the yield coefficient of background pollutants. The purpose of this method is to control the output of background pollutants (disturbance from human activities such as logging and collection of resources from forests in mountains increases the loss of background pollutants). The area more representative of the background should be selected as the area for calculating the yield coefficient of forest and grassland.
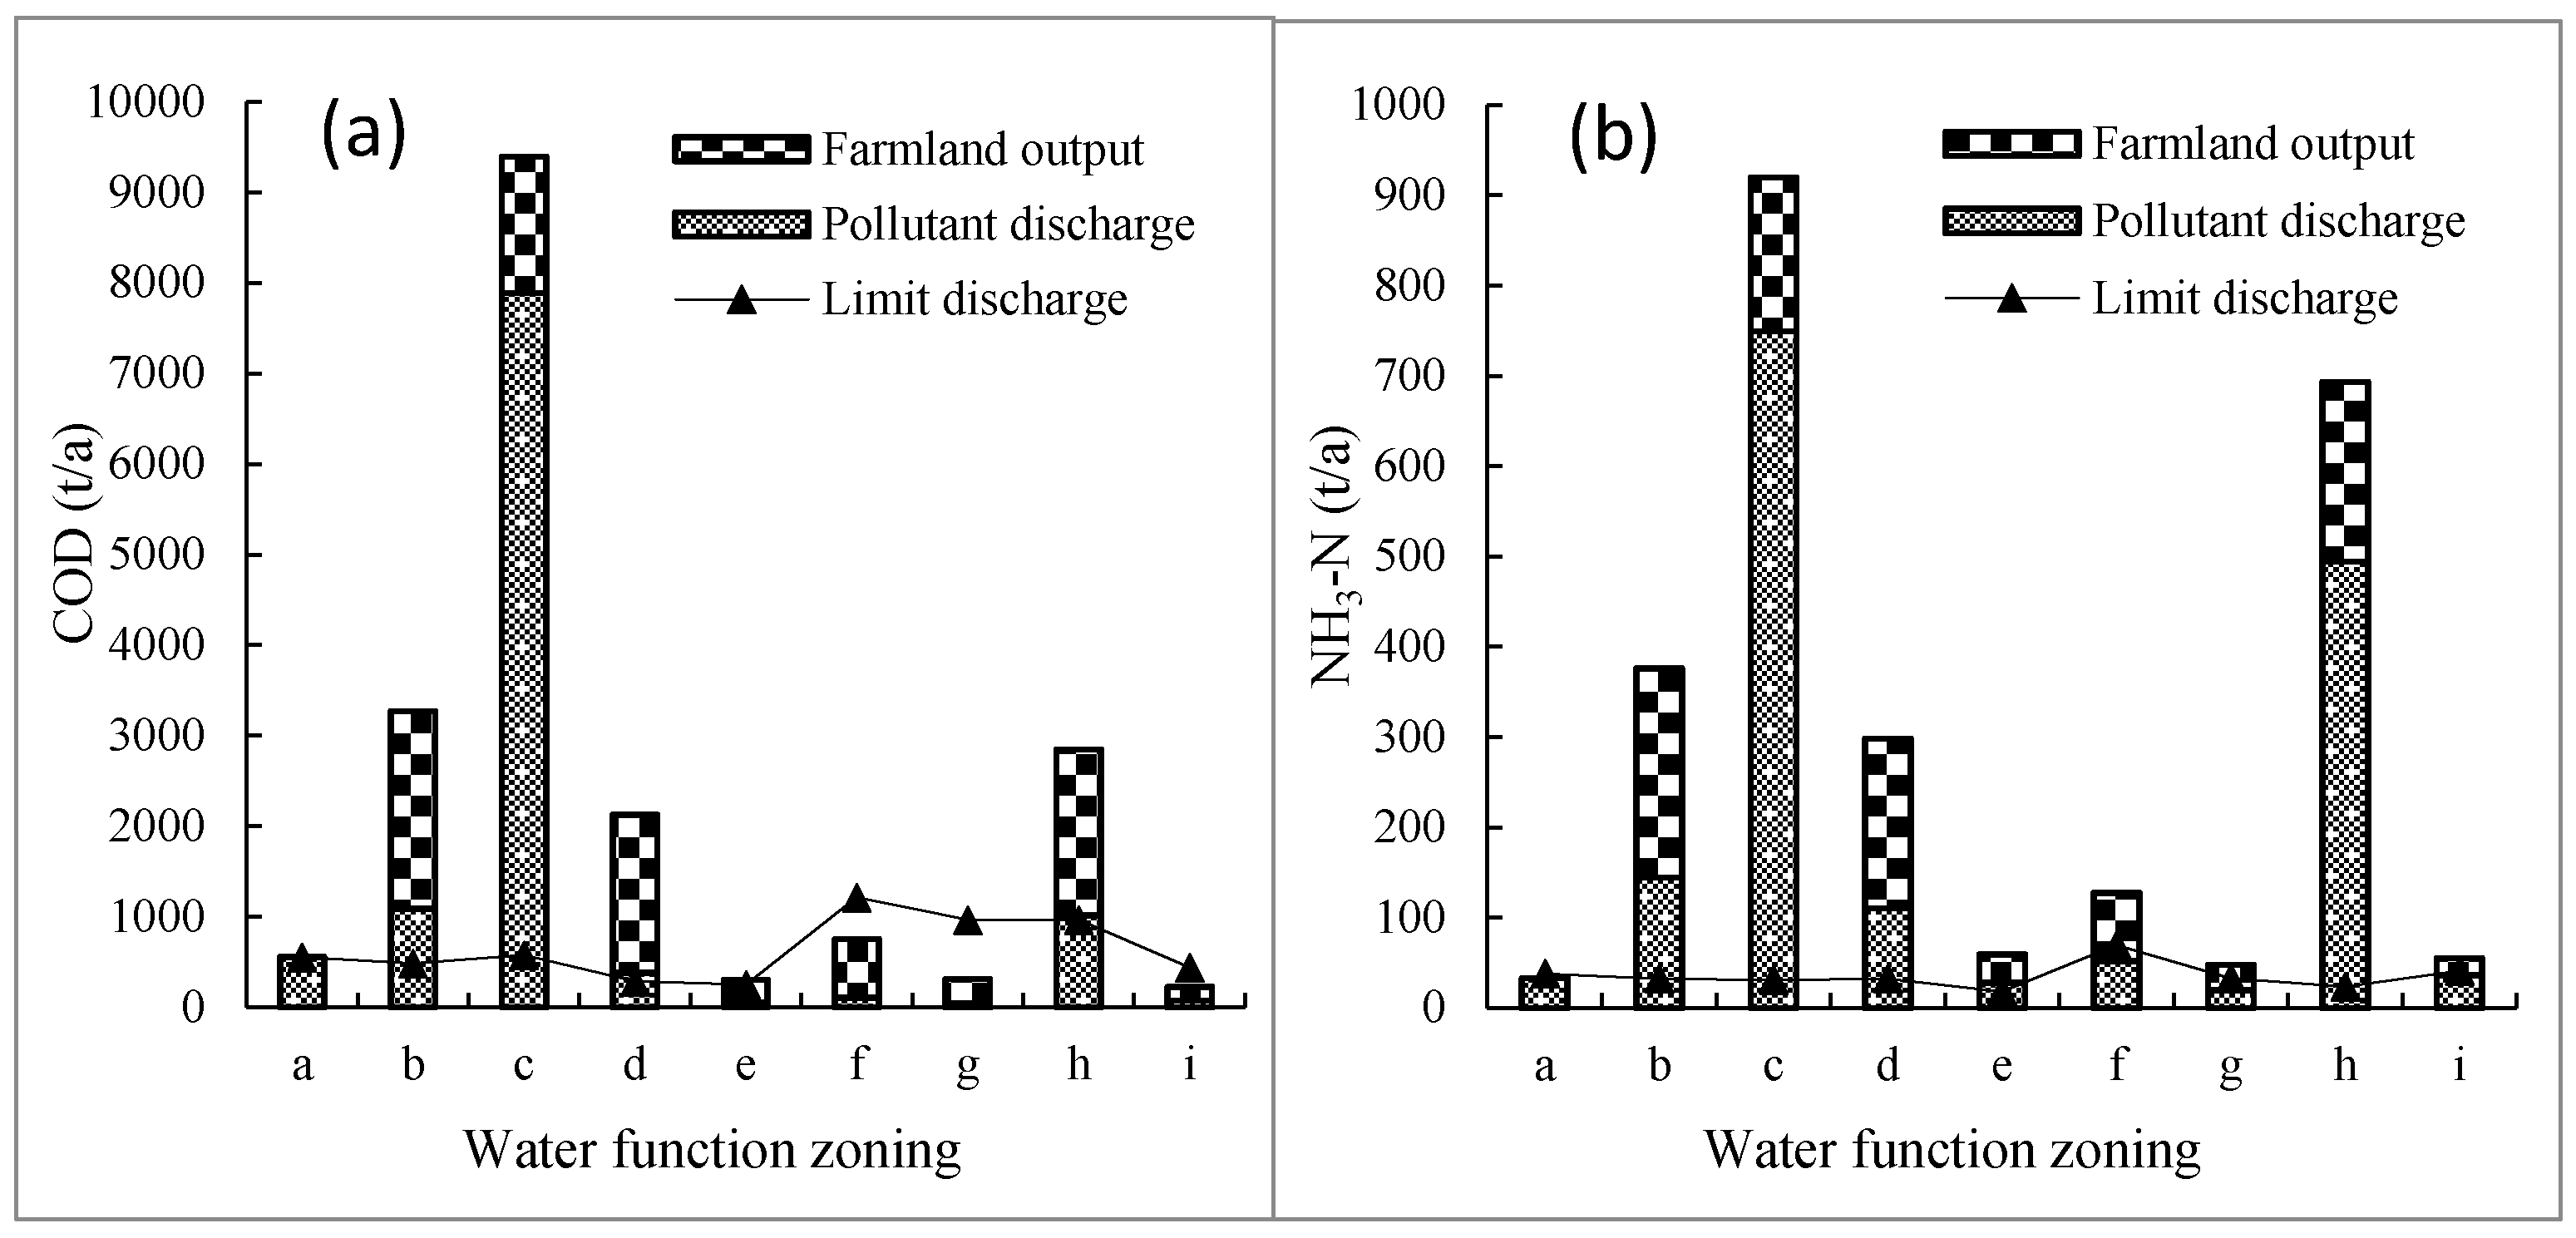
We selected the first method as an example to account for the regional pollution output in 2015; forest and grassland as the source of background pollutants were not considered. The calculation results of pollutant output and sewage discharge limit are shown in Figure 9. A considerable amount of pollutant output should be reduced in water function zones b, c, d, and h in order to meet the emission requirements of the planning year, for which farmland pollutant output is the main target of reduction in b, d, and h, whereas sewage discharge from human production activities needs to be controlled in c. Figure 9b shows that the NH3-N outputs of b, c, d, f and h significantly exceed the sewage discharge limit of the planning year. The output from farmland and sewage discharge are the key objects of pollution prevention and control in these function zones. Compared with COD output, human sewage discharge of NH3-N accounts for a large proportion in water function zones that exceed the discharge limit, which also reflects the relationship between flow and pollutant concentration (Figure 6). In the upstream reaches, the concentration of non-point source pollutants entering the river is proportional to flow (Figure 6a,b), and for the middle and lower reaches of the river, the concentration of pollutants entering the river is not positively correlated with the flow because it is greatly affected by human sewage discharge. By revising the sewage discharge limit, the control object and control index with respect to the water function zoning in the study area needs to be clear. This method overcomes the interference of background pollutants in determining the discharge capacity limit and is convenient for regional water quality management.
3.4. Assessment Method Considering Background Value
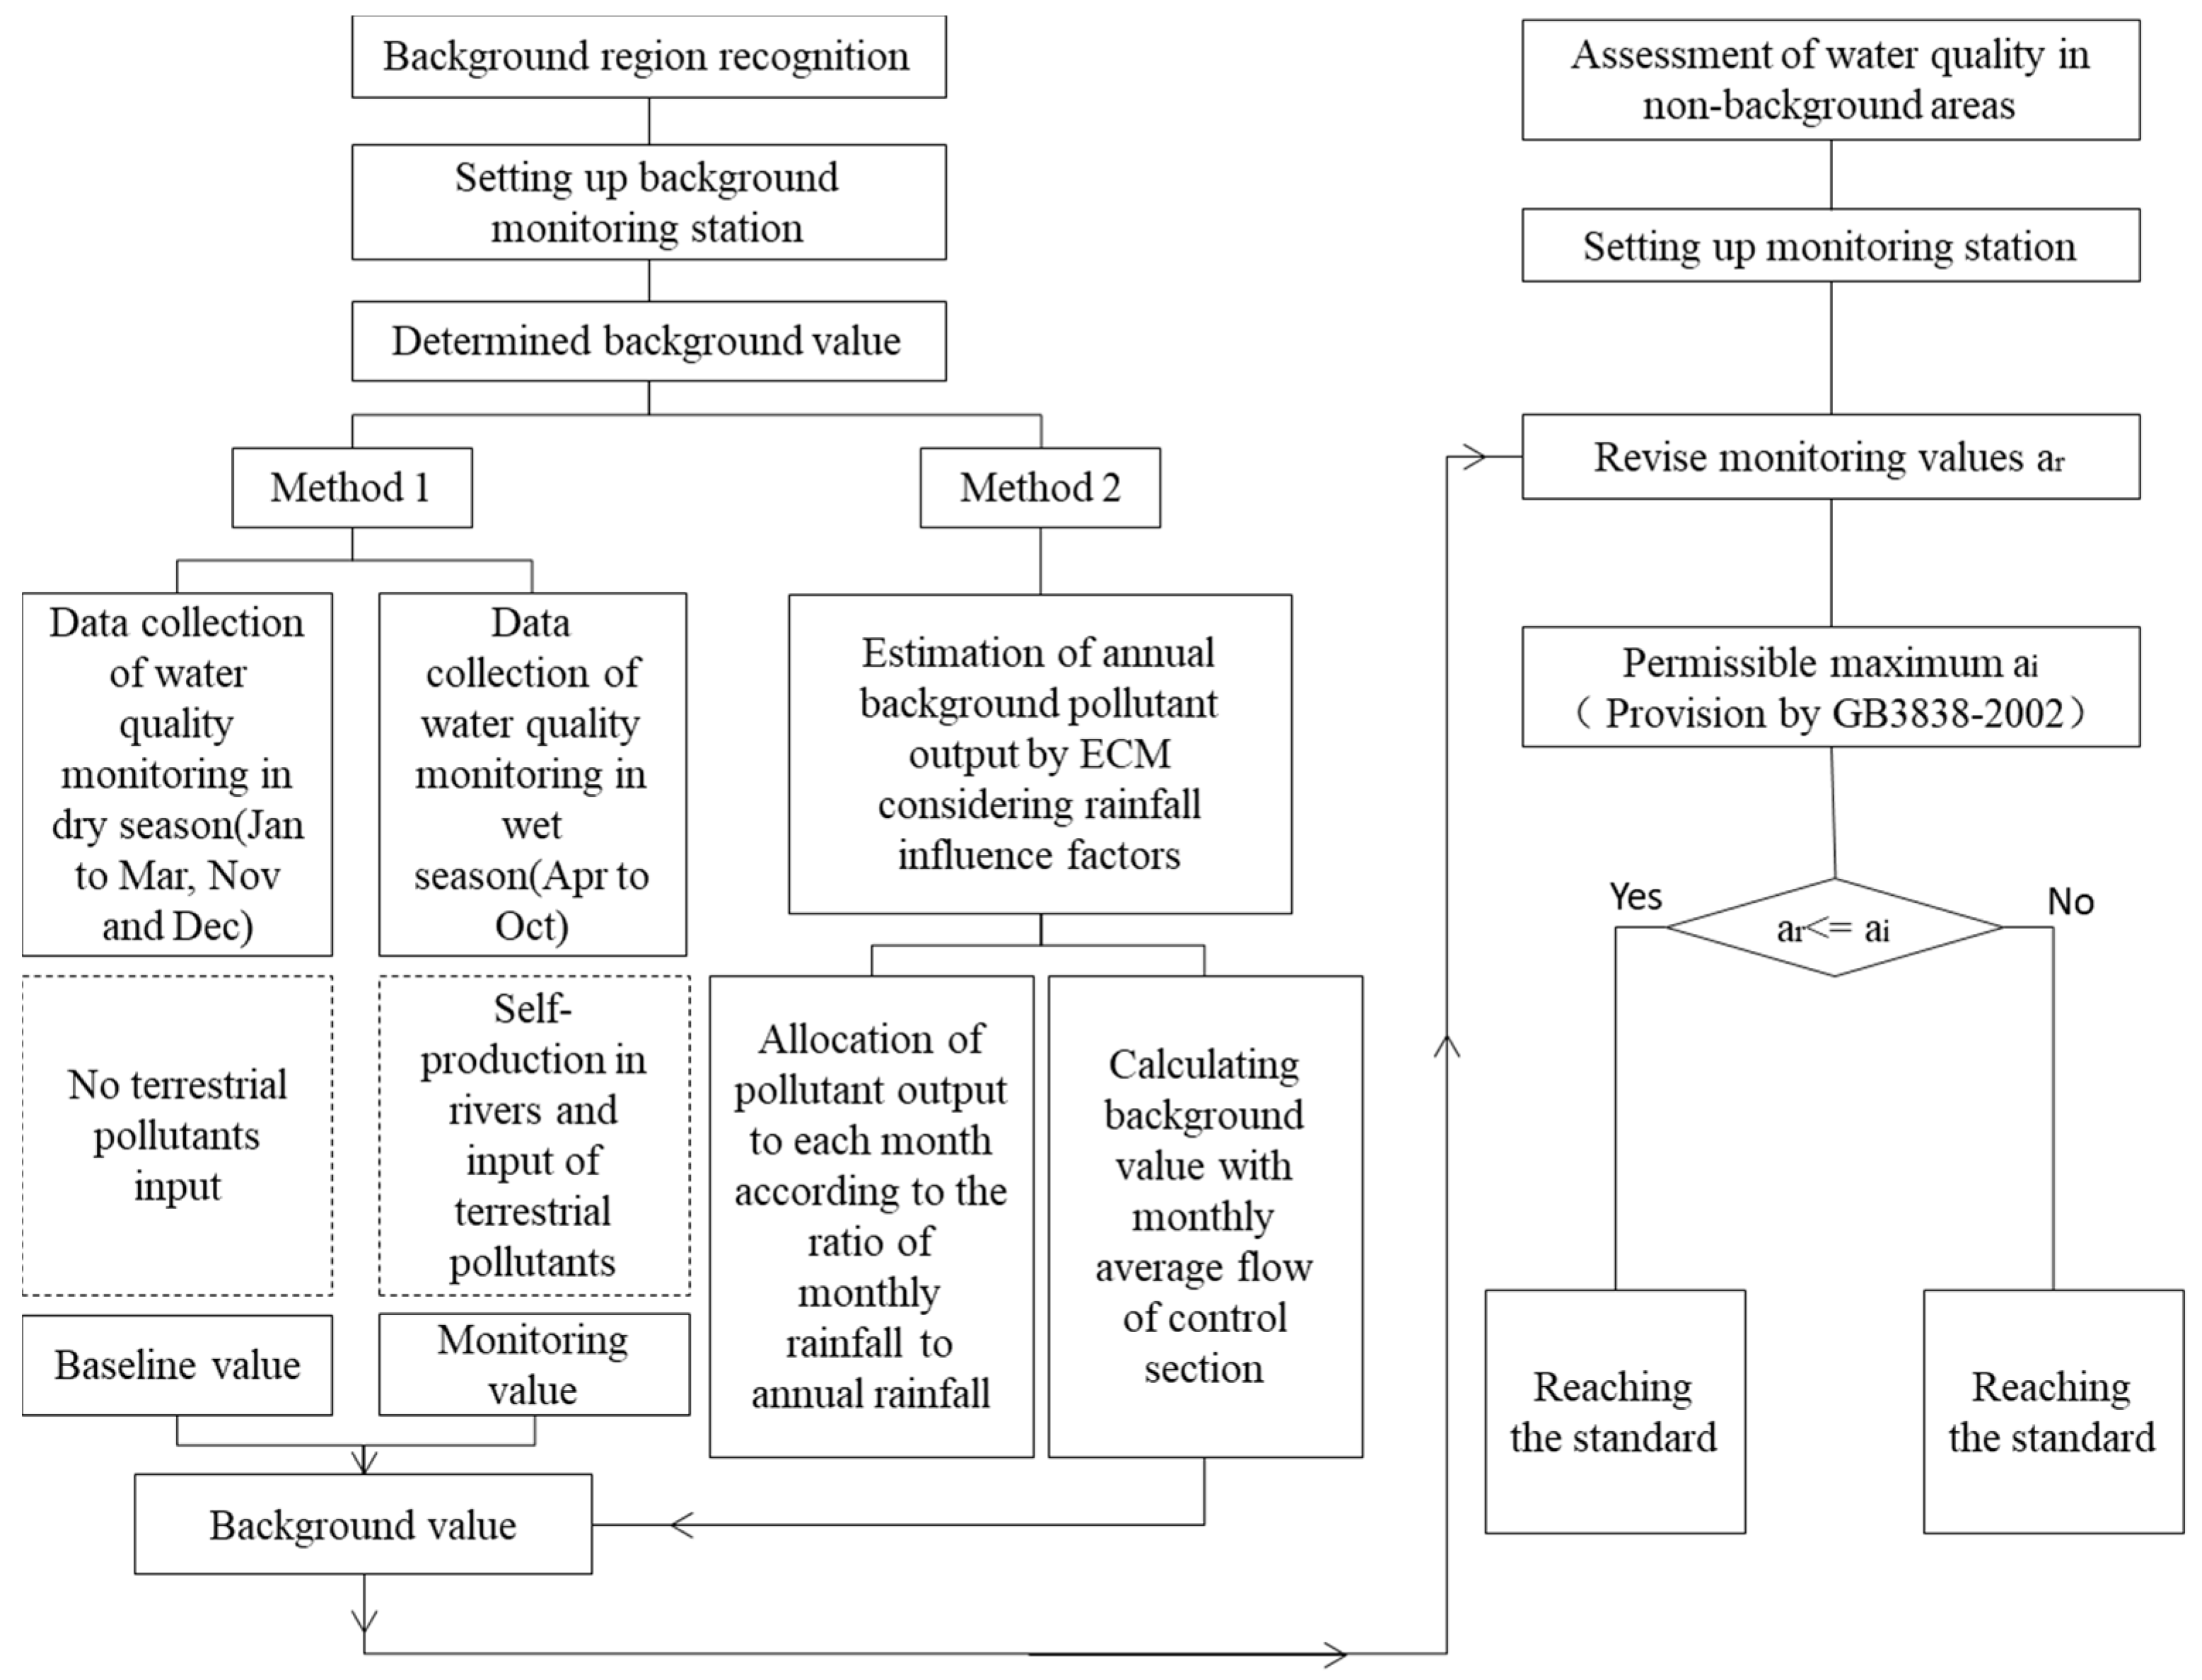
For water quality monitoring, three values should be considered: “baseline value”: self-produced pollutants of the river ecosystem; “background value”: the impact of the natural environment on water quality; “pollution value”: the impact of human activities on water quality. In order to objectively evaluate the impact of human activities on water quality, the influence of background value and baseline value should be considered on the basis of current water quality assessment methods. In other words, the background value should be subtracted from the monitoring value and then evaluated according to GB 3838-2002. Two methods are proposed to determine the background value (Figure 10). One is to set up monitoring stations in the upper reaches or areas without human activities, through which the baseline value is determined according to the concentration mean in the dry season to ensure that the water is not affected by surface recharge and exogenous pollutants. The monitoring value during the wet season contains the baseline value and the background value, through which the background value can be calculated. The second method is to consider the impact of rainfall on the output of background pollutants during the wet season. The total output of background pollutants is estimated by ECM for an entire year, and then the total output for each month is distributed according to the proportion of monthly rainfall to annual rainfall. Based on the monthly average flow of the monitoring station, the background concentration for the month is calculated, and then the monitoring value is revised.
4. Conclusions
By comparing the social, economic, and natural environments of 31 provinces in China and considering the results of this comparison in combination with the water quality standards for water function zones, it was clear that the surface water quality of Heilongjiang Province was seriously affected by background values (COD and NH3-N); this was affecting water quality management and assessment in Heilongjiang Province. To manage and assess water quality reasonably and objectively in areas seriously affected by background values, the Tangwang River Basin in Heilongjiang Province was selected as the study area and an improved ECM was applied to quantify background pollutants. Firstly, model parameters in the ECM were determined by coupling the improved ECM with a mechanistic model—pollutant yield coefficients of forest and grassland (COD: 28.1 t/km2a, NH3-N: 0.47 t/km2a) and farmland (COD: 15.8 t/km2a, NH3-N: 1.47 t/km2a) and their validities were verified using water quality monitoring data with high pollutant concentrations from background monitoring stations (1–19). The results of the correlation analysis show that there is a significant positive correlation between pollutant concentration and flow in the upstream areas, indicating that runoff is the main factor driving background pollutant amounts. However, the correlation between the middle and lower reaches of the basin is not significant or even negative because of the impact of human sewage. Based on the 22 sub-basins and nine water function zones in the basin, the spatial distribution characteristics of pollutant output in the study area were analysed. Then, the regional sewage discharge limit scheme was re-approved, and water quality evaluation methods are proposed after considering background pollutants. The revised scheme effectively avoids the influence of background values and objectively reflects the impact of human activities on water quality. The results of this study provide a scientific basis for improving China’s water quality management and assessment system. It is suggested that the relevant departments should consider regional differences when formulating schemes and standards.
This study did not fully demonstrate the background characteristic of the upstream area when determining the yield coefficient of the background pollution source (forest and grassland). It is suggested that the background characteristics of the simulated area be fully considered in the application of the ECM to study the background values of water quality. Due to limitations in monitoring data, the proposed water quality evaluation method was not verified via practical application, but the method is reasonable.
Author Contributions
W.P. provided overall guidance; X.D. and S.Z. analysed the data; L.Y. contributed analysis tools; M.D. wrote the paper.
Funding
This work was jointly supported by the IWHR Research and Development Support Program (Grant Nos. WE0145B052017); Beijing Natural Fund Program (J150005).
Acknowledgments
Yichun Water Environment Monitoring Centre and Heilongjiang Hydrological Bureau provide data.
Conflicts of Interest
The authors declare no conflicts of interest.
References
- Butler, J.R.A.; Wong, G.Y.; Metcalfe, D.J.; Honzák, M.; Pert, P.L.; Rao, N.; van Grieken, M.E.; Lawson, T.; Bruce, C.; Kroon, F.J.; et al. An analysis of trade-offs between multiple ecosystem services and stakeholders linked to land use and water quality management in the Great Barrier Reef, Australia. Agric. Ecosyst. Environ. 2013, 180, 176–191. [Google Scholar] [CrossRef]
- Yan, D.H.; Wang, H.; Li, H.H.; Wang, G.; Qin, T.L.; Wang, D.Y.; Wang, L.H. Quantitative analysis on the environmental impact of large-scale water transfer project on water resource area in a changing environment. Hydrol. Earth Syst. Sci. 2012, 16, 2685–2702. [Google Scholar] [CrossRef] [Green Version]
- Hassan, N.E.; Ali, S.A.M. Screening and analysis of water quality of Zea River in Kurdistan region, Iraq. Int. J. Adv. Appl. Sci. 2016, 3, 61–67. [Google Scholar] [CrossRef]
- Fan, X.; Cui, B.; Zhao, H.; Zhang, Z.; Zhang, H. Assessment of river water quality in Pearl River Delta using multivariate statistical techniques. Proc. Environ. Sci. 2010, 2, 1220–1234. [Google Scholar] [CrossRef] [Green Version]
- Cassanego, M.B.B.; Droste, A. Assessing the spatial pattern of a river water quality in southern Brazil by multivariate analysis of biological and chemical indicators. Braz. J. Biol. 2016, 77, 118–126. [Google Scholar] [CrossRef] [PubMed]
- Cheng, X.; Chen, L.; Sun, R.; Jing, Y. An improved export coefficient model to estimate non-point source phosphorus pollution risks under complex precipitation and terrain conditions. Environ. Sci. Pollut. Res. Int. 2018, 25, 20946–20955. [Google Scholar] [CrossRef]
- Ding, X.; Shen, Z.; Hong, Q.; Yang, Z.; Wu, X.; Liu, R. Development and test of the Export Coefficient Model in the Upper Reach of the Yangtze River. J. Hydrol. 2010, 383, 233–244. [Google Scholar] [CrossRef]
- Lai, Y.C.; Yang, C.P.; Hsieh, C.Y.; Wu, C.Y.; Kao, C.M. Evaluation of non-point source pollution and river water quality using a multimedia two-model system. J. Hydrol. 2011, 409, 583–595. [Google Scholar] [CrossRef]
- Yang, S.; Dong, G.; Zheng, D.; Xiao, H.; Gao, Y.; Lang, Y. Coupling Xinanjiang model and SWAT to simulate agricultural non-point source pollution in Songtao watershed of Hainan, China. Ecol. Modell. 2011, 222, 3701–3717. [Google Scholar] [CrossRef]
- Ye, Y.; Jia, K. A water quality assessment method based on sparse autoencoder. In Proceedings of the IEEE International Conference on Signal Processing, Communications and Computing, Ningbo, China, 19–22 September 2015. [Google Scholar]
- Liu, S.; Lou, S.; Kuang, C.; Huang, W.; Chen, W.; Zhang, J.; Zhong, G. Water quality assessment by pollution-index method in the coastal waters of Hebei Province in western Bohai Sea, China. Mar. Pollut. Bull. 2011, 62, 2220–2229. [Google Scholar] [CrossRef]
- Jähnig, S.C.; Cai, Q. River water quality assessment in selected Yangtze tributaries: Background and method development. J. Earth Sci. 2010, 21, 876–881. [Google Scholar] [CrossRef] [Green Version]
- Hinman, J.J. American standards for quality of water. J. Chem. Technol. Biotechnol. 1921, 40, R325–R327. [Google Scholar] [CrossRef]
- New York State Department of Environmental Conservation, Part 701 Classifications-Surface Waters and Ground Waters. Available online: https://docplayer.net/. (accessed on 1 December 2018).
- Lumb, A.; Halliwell, D.; Sharma, T. Application of CCME water quality index to monitor water quality: A Case of the Mackenzie River Basin, Canada. Environ. Monit. Assess. 2006, 113, 411–429. [Google Scholar] [CrossRef] [PubMed]
- Rosemond, S.D.; Duro, D.C.; Dubé, M. Comparative analysis of regional water quality in Canada using the Water Quality Index. Environ. Monit. Assess. 2009, 156, 223–240. [Google Scholar] [CrossRef]
- Campos, M.L.; Pierangeli, M.A.P.; Guilherme, L.R.G.; Marques, J.J.; Curi, N. Baseline Concentration of Heavy Metals in Brazilian Latosols. Commun. Soil Sci. Plant Anal. 2003, 34, 547–557. [Google Scholar] [CrossRef]
- Reimann, C.; Caritat, P.D. Distinguishing between natural and anthropogenic sources for elements in the environment: Regional geochemical surveys versus enrichment factors. Sci. Total Environ. 2005, 337, 91–107. [Google Scholar] [CrossRef] [PubMed]
- Cobelo-Garcia, A.; Prego, R. Heavy metal sedimentary record in a Galician Ria (NW Spain): Background values and recent contamination. Mar. Pollut. Bull. 2003, 46, 1253–1262. [Google Scholar] [CrossRef]
- Rodríguez, J.G.; Tueros, I.; Borja, A.; Belzunce, M.J.; Franco, J.; Solaun, O.; Valencia, V.; Zuazo, A. Maximum likelihood mixture estimation to determine metal background values in estuarine and coastal sediments within the European Water Framework Directive. Sci. Total Environ. 2006, 370, 278–293. [Google Scholar] [CrossRef]
- Li, J.; Wu, Y. Historical changes of soil metal background values in select areas of China. Water Air Soil Pollut. 1991, 57–58, 755–761. [Google Scholar] [CrossRef]
- Nsouli, B.; Darwish, T.; Thomas, J.P.; Zahraman, K.; Roumié, M. Ni Cu Zn and Pb background values determination in representative Lebanese soil using the thick target PIXE technique. Nucl. Instrum. Methods Phys. Res. B 2003, 219, 181–186. [Google Scholar] [CrossRef]
- Ward, R.C. Development and use of water quality criteria and standards in the United States. Reg. Environ. Chang. 2001, 2, 66–72. [Google Scholar] [CrossRef]
- Chen, J.; He, D.; Zhang, Y. Is COD a suitable parameter to evaluate the water pollution in the Yellow river? Environ. Chem. 2003, 22, 611–614. (In Chinese) [Google Scholar]
- Chen, J.; Zhang, Y.; Yu, T.; He, D. A study on dissolution and bio-degradation of organic matter in sediments from the Yellow River. Acta Sci. Circumstantiae 2004, 24, 1–5. (In Chinese) [Google Scholar]
- Chen, J.; Zhang, Y.; Yu, T.; He, D. Influences of the suspended matter on the water quality parameters including COD, Potassium Permanganate Index and BOD 5 in the Yellow River, China. Acta Sci. Circumstantiae 2004, 24, 369–375. (In Chinese) [Google Scholar]
- Chen, J.; Zhang, Y.; Yu, T.; He, D. Problem and solution in assessing the oxygen-demanding organic matters of the Yellow River, China. Acta Sci. Circumstantiae 2005, 25, 279–284. (In Chinese) [Google Scholar]
- Jacinthe, P.A.; Lal, R.; Owens, L.B.; Hothem, D.L. Transport of labile carbon in runoff as affected by land use and rainfall characteristics. Soil Tillage Res. 2004, 77, 111–123. [Google Scholar] [CrossRef]
- Jordán, A.; Martínez-Zavala, L. Soil loss and runoff rates on unpaved forest roads in southern Spain after simulated rainfall. For. Ecol. Manag. 2008, 255, 919. [Google Scholar] [CrossRef]
- Du, Z.; Cai, Y.; Wang, X.; Yan, Y.; Lu, X.; Liu, S. Research progress on the effects of soil freeze-thaw on plant physiology and ecology. Chin. J. Eco-Agric. 2014, 22, 1–9. [Google Scholar] [CrossRef]
- Zhu, J.; He, X.; Wu, F.; Yang, W.; Tan, B. Decomposition of Abies faxoniana litter varies with freeze–thaw stages and altitudes in subalpine/alpine forests of southwest China. Scand. J. For. Res. 2012, 27, 11. [Google Scholar] [CrossRef]
- Wu, F.; Yang, W.; Zhang, J.; Deng, R. Litter decomposition in two subalpine forests during the freeze–thaw season. Can. J. For. Res. 2010, 36, 135–140. [Google Scholar] [CrossRef]
- Liu, R.M.; Yang, Z.F.; Shen, Z.Y.; Yu, S.L.; Ding, X.W.; Wu, X.; Liu, F. Estimating Nonpoint Source Pollution in the Upper Yangtze River Using the Export Coefficient Model, Remote Sensing, and Geographical Information System. J. Hydraul. Eng. 2009, 135, 698–704. [Google Scholar] [CrossRef]
- Wu, L.; Li, P.; Ma, X.Y. Estimating nonpoint source pollution load using four modified export coefficient models in a large easily eroded watershed of the loess hilly–gully region, China. Environ. Earth Sci. 2016, 75, 1056. [Google Scholar] [CrossRef]
- Wu, Q.; Liu, M.; Wang, X.; Di, L.; Kang, L.; Lin, L. Assessing the water environmental capacity of pollution consumption in Jiulong River Basin. In Proceedings of the Fourth International Conference on Agro-geoinformatics, Istanbul, Turkey, 20–24 July 2015. [Google Scholar]
- Zhang, R.; Qian, X.; Yuan, X.; Ye, R.; Xia, B.; Wang, Y. Simulation of Water Environmental Capacity and Pollution Load Reduction Using QUAL2K for Water Environmental Management. Int. J. Environ. Res. Public Health 2012, 9, 4504–4521. [Google Scholar] [CrossRef] [Green Version]
- Chen, Y.; Yuan, Q.; Han, F.; Zhou, L.; Hong, S. Estimation of Non-point Source Pollution Load of Yangtze Watershed Based on Improved Export Coefficient Model. J. Geomat. 2017, 42, 96–99. (In Chinese) [Google Scholar]
- Zhang, C.; Liu, Z.; Zhang, G. A Study of the Agricultural Non-point Sources of Ammonia Nitrogen Load in Henan Province Based on the Export Coefficient Method. China Rural Water Hydropower 2017, 10, 35–39. (In Chinese) [Google Scholar]
Figure 1.
Partition of sampling sites in the Tangwang River Basin according to land-use types. (a) The river is divided into upper, middle, and lower reaches according to the control area of hydrological stations (H1–H3); (b) monitoring stations for water quality in water function zones (R1–R9); background monitoring stations (1–19) were used to monitor water quality in areas where human activity is scarce; Non-background areas include areas with high intensity of human activity; reference standard (GB/T50594-2010) for the division of water function zones.

Figure 2.
Comparison of factors in 31 provinces of China. (a) Population density; (b) forest land coverage; (c) annual discharge of COD; (d) annual discharge of NH3-N; (e) the rate of water function zones meeting the standard. COD: chemical oxygen demand; NH3-N: ammonia nitrogen.
Figure 2.
Comparison of factors in 31 provinces of China. (a) Population density; (b) forest land coverage; (c) annual discharge of COD; (d) annual discharge of NH3-N; (e) the rate of water function zones meeting the standard. COD: chemical oxygen demand; NH3-N: ammonia nitrogen.

Figure 3.
Distribution of rainfall influence factor in the study area ((a) 2011; (b) 2012; (c) 2013).
Figure 3.
Distribution of rainfall influence factor in the study area ((a) 2011; (b) 2012; (c) 2013).

Figure 4.
Distribution of runoff-migration influence factor in the study area ((a) 2011; (b) 2012; (c) 2013).
Figure 4.
Distribution of runoff-migration influence factor in the study area ((a) 2011; (b) 2012; (c) 2013).

Figure 5.
Distribution of values exceeding the standard (standard value subtracted from monitoring value). (a) Chemical oxygen demand; (b) ammonia nitrogen.
Figure 5.
Distribution of values exceeding the standard (standard value subtracted from monitoring value). (a) Chemical oxygen demand; (b) ammonia nitrogen.

Figure 6.
Correlation between perennial monthly mean concentration and flow. (a) Upstream reaches, COD and flow; (b) upstream reaches, NH3-N, and flow; (c) middle reaches, COD, and flow; (d) middle reaches, NH3-N, and flow; (e) lower reaches, COD, and flow; (f) lower reaches, NH3-N, and flow (COD: chemical oxygen demand; NH3-N: ammonia nitrogen).

Figure 7.
Spatial distribution of pollutant load in 2015. (a) Chemical oxygen demand; (b) ammonia nitrogen.
Figure 7.
Spatial distribution of pollutant load in 2015. (a) Chemical oxygen demand; (b) ammonia nitrogen.

Figure 8.
Pollutant output distribution in water function zones in 2015. (a) Chemical oxygen demand; (b) ammonia nitrogen.
Figure 8.
Pollutant output distribution in water function zones in 2015. (a) Chemical oxygen demand; (b) ammonia nitrogen.

Figure 9.
Total output of pollutants and sewage discharge limit of water function zones. (a) Chemical oxygen demand; (b) ammonia nitrogen.
Figure 9.
Total output of pollutants and sewage discharge limit of water function zones. (a) Chemical oxygen demand; (b) ammonia nitrogen.

Figure 10.
Flow chart of assessment methods considering background value.


Table 1.
Types of water function zone and water quality standards for each type.
| Number | Type | Standard | Permissible Maximum Value (mg/L) | Remarks | |
|---|---|---|---|---|---|
| COD | NH3-N | ||||
| a | River source water reserve | Ⅱ | 15 | 0.5 | a: Delimited waters of great significance for the protection of water resources, natural ecosystems and rare and endangered species; b,e: Water demarcated to meet industrial water use and agricultural irrigation needs; c,f,h,i: Water delimited for the purpose of accepting production and discharge from sewage outlets of domestic wastewater; the wastewater accepted does not have a significant adverse impact on the water environment; d,g: Water area delimited to meet the transition water quality standards in lines connecting adjacent water functional zones with great differences in water quality. |
| b | Agricultural and industrial water use zoning | Ⅳ | 30 | 1.5 | |
| c | Discharge control zoning | / | |||
| d | Transition zoning | Ⅳ | 30 | 1.5 | |
| e | Industrial water use zoning | Ⅳ | 30 | 1.5 | |
| f | Discharge control zoning | / | |||
| g | Transition zoning | Ⅴ | 40 | 2 | |
| h | Discharge control zoning | / | |||
| i | Discharge control zoning | / | |||
Table 2.
Main data sources and purposes.
| Data Types | Purpose | Sources |
|---|---|---|
| Land-use types | Model structure | Landsat 8 OLI interpretation of satellite remote sensing images |
| Precipitation | Analysis of rainfall impact | National Meteorological Information Centre (http://data.cma.cn/) |
| Topographic data | Terrain division and watershed division | National Geographic Centre; Geospatial data cloud (http://www.gscloud.cn/sources/) |
| Water quality and quantity data | Estimation of pollutant output and evaluation of water quality | Yichun Water Environment Monitoring Centre (H1–H3); Heilongjiang Hydrological Bureau (S1–S9); Project Research Group (1–18) |
| Socio-economic data | Statistics of sewage discharge data | Statistical yearbook |
Table 3.
Pollutant yield coefficient according to land use.
| Year | Area | Forest and Grassland (t/km2a) | Farmland (t/km2a) | ||
|---|---|---|---|---|---|
| COD | NH3-N | COD | NH3-N | ||
| 2011 | Upstream reaches | 31.7 | 0.52 | / | / |
| 2012 | 22.6 | 0.51 | / | / | |
| 2013 | 29.9 | 0.37 | / | / | |
| 2011 | Middle reaches | 28.1 | 0.47 | 15.5 | 1.93 |
| 2012 | 28.1 | 0.47 | 14.4 | 3.07 | |
| 2013 | 28.1 | 0.47 | 23.7 | 1.02 | |
| 2011 | Lower reaches | 28.1 | 0.47 | 7.2 | 0.54 |
| 2012 | 28.1 | 0.47 | 21.3 | 2.96 | |
| 2013 | 28.1 | 0.47 | 12.5 | 1.08 | |
| Average | 28.1 | 0.47 | 15.8 | 1.77 | |
© 2019 by the authors. Licensee MDPI, Basel, Switzerland. This article is an open access article distributed under the terms and conditions of the Creative Commons Attribution (CC BY) license (http://creativecommons.org/licenses/by/4.0/).
Share and Cite
MDPI and ACS Style
Duan, M.; Du, X.; Peng, W.; Zhang, S.; Yan, L. Necessity of Acknowledging Background Pollutants in Management and Assessment of Unique Basins. Water 2019, 11, 1103. https://doi.org/10.3390/w11051103
AMA Style
Duan M, Du X, Peng W, Zhang S, Yan L. Necessity of Acknowledging Background Pollutants in Management and Assessment of Unique Basins. Water. 2019; 11(5):1103. https://doi.org/10.3390/w11051103
Chicago/Turabian StyleDuan, Maoqing, Xia Du, Wenqi Peng, Shijie Zhang, and Liuqing Yan. 2019. "Necessity of Acknowledging Background Pollutants in Management and Assessment of Unique Basins" Water 11, no. 5: 1103. https://doi.org/10.3390/w11051103
Note that from the first issue of 2016, this journal uses article numbers instead of page numbers. See further details here.