In Situ Nutrient Removal from Rural Runoff by A New Type Aerobic/Anaerobic/Aerobic Water Spinach Wetlands
by
 ,
,
Ya-Wen Wang
1, 
Hua Li
2,
You Wu
1,
Yun Cai
1,
Hai-Liang Song
1,*,
Zhi-Dong Zhai
2 and
Xiao-Li Yang
3,* 1
Jiangsu Engineering Lab of Water and Soil Eco-remediation, School of Environment, Nanjing Normal University, Wenyuan Road 1, Nanjing 210023, China
2
School of Energy and Environment, Southeast University, Nanjing 210096, China
3
School of Civil Engineering, Southeast University, Nanjing 210096, China
*
Authors to whom correspondence should be addressed.
Water 2019, 11(5), 1100; https://doi.org/10.3390/w11051100
Submission received: 2 May 2019
/
Revised: 23 May 2019
/
Accepted: 24 May 2019
/
Published: 26 May 2019
(This article belongs to the Special Issue Urban Water Accounting)
Abstract
:Rural runoff with abundant nutrients has become a great threat to aquatic environment. Hence, more and more attention has been focused on nutrients removal. In this study, an improved aerobic/anaerobic/aerobic three-stage water spinach constructed wetland (O-A-O-CW) was used to improve the removal of nitrogen and phosphorus of rural runoff. The removal rate of the target pollutants in O-A-O-CW was compared with the common matrix flow wetland as well as the no-plant wetland. The results showed that the O-A-O-CW significantly increased the chemical oxygen demand, total phosphorus, ammonium-nitrogen, nitrate, and total nitrogen removal rate, and the corresponding removal rate was 55.85%, 81.70%, 76.64%, 89.78%, and 67.68%, respectively. Moreover, the best hydraulic condition of the wetland, including hydraulic retention time and hydraulic loading, was determined, which were 2 days and 0.45 m3·m−2·day−1, respectively. Furthermore, the removal mechanism of the constructed wetland was thoroughly studied, which included the adsorption of nitrogen and phosphorus by the matrix and water spinach, and the nitrification and denitrification by the bacteria. The results demonstrated that the mechanisms of nitrogen removal in the new type wetland were principally by the nitrification and denitrification process. Additionally, adsorption and precipitation by the matrix are mainly responsible for phosphorus removal. These results suggested that the new O-A-O-CW can efficiently removal nutrients and enhance the water quality of the rural runoff.
1. Introduction
With the rapid development of economy, water pollution has gained more and more attention [1,2,3,4,5,6]. Among so many sources of pollution, the disorderly discharge of pollutants from rainfall runoff from rural residential areas has become an important non-point source pollution of nitrogen and phosphorus. Rainfall runoff has become one of the major threats to aquatic environments [7]. The environmental impacts of runoff discharged can cause serious environmental problems, such as eutrophication of lakes and deterioration of aquatic environments [8]. To reduce the risks of the runoff risks to aquatic environments, the key technology should be developed to relieve the surface runoff pollution.
Constructed wetland (CW) is a unique ecosystem that artificially simulates the structure and function of natural wetlands. As an environmentally friendly natural treatment system, the CW has shown advantages over conventional techniques due to its low cost, good performance, and simple operation [7,9]. Recently, CW technology has also been used widely to treat rural runoff due to the easy maintenances and low energy demand [10,11,12]. These results show that CW has potential effects on nitrogen and phosphorus removal.
There are many mechanisms that are involved in nitrogen and phosphorus removal in CW including adsorption, precipitation, plants adsorption, and bacteria transformation during the rural rain runoff treatment processes in CW [9,10]. Biological nitrification and denitrification are regarded as the important removal mechanisms for nitrogen removal in CW, while the other mechanisms, including plant and substrate adsorption, are also important [11]. However, the nitrification and denitrification process are limited by carbon source [13]. The previous study has demonstrated that nitrogen removal in sub-surface CW is poor, and the removal rate can only reach 30%–40% [14]. Adding external carbon source is one possible way to solve this problem. Moreover, artificial aeration is another way to enhance the removal efficiency of nitrogen by improving dissolved oxygen (DO) concentration. It has also been reported that oxygen transfer capacity cannot meet the phosphorus removal and chemical oxygen demand (COD) oxidation [15]. Thus, the phosphorus adsorption to the substrate can be promoted and the removal rate of target pollutants such as COD can be affected during wastewater treatment process in CW by increasing DO concentration [16]. Although the oxygen availability in horizontal flow CW can be enhanced by plants through diffusion of oxygen in rhizomes, the amounts of oxygen supplied by roots cannot be sufficient for both organics and ammonia nitrogen oxidation [17]. Therefore, artificial aeration can be proposed to enhance the nitrogen removal in CW, and the gradient change of DO on target pollutant removal in CW should be further studied.
In order to enhance the treatment efficiency, much attention has been paid on the adjustment of matrix selection, plants selection, microorganisms, and wetland animals abundance and operation mode in the CWs [18,19,20,21,22,23,24]. Recently, hybrid CW systems are adopted to enhance the treatment effects, which are more effective than single-stage CW. For example, Wei et al. have found that the combined use of sedimentation pond and horizontal subsurface flow wetland systems have positive effects on rainwater surface runoff, and the effluent water quality can reach the first-level standard of comprehensive wastewater discharge in China [17]. Similarly, Angassa et al. constructed the three-horizontal flow CWs to study the effects of pollutants removal, and the results showed that the treatment efficiency in three horizontal flow CW was higher than that in single-stage CW [25].
The alternation of the anaerobic and aerobic process plays an increasingly important role in nutrient removal. Muslun et al. have found that the reactor with a loop setting of anaerobic/aerobic/anoxic/aerobic process had a better performance on removal of COD, total nitrogen (TN), and total phosphorus (TP) [26]. However, the effects of alternation of anaerobic and aerobic process on nitrogen and phosphorus removal in CWs were rarely evaluated. Additionally, aquatic plants can effectively reduce total nitrogen and phosphorus concentration [27,28]. However, few studies have evaluated the adsorption of nitrogen and phosphorus by plants during the rural runoff treatment process in hybrid enhanced CW.
Therefore, an improved aerobic/anaerobic/aerobic three-stage aquatic vegetable wetland (O-A-O-CW) was constructed in our study to (i) improve the treatment effects of nitrogen and phosphorus, and the result was compared with the traditional CW and no-plant wetland (ii) to study the effects of various influencing factors, including hydraulic retention time (HRT) and hydraulic loading (HLR) on target pollutant removal in the new type of wetland (iii) to determine the removal mechanism of nitrogen and phosphorus, including adsorption and precipitation of the matrix, the adsorption of the plants, and the microbial metabolism in this study. It is expected that the results from this study will offer a reference for the design of CW to treat rural runoff.
2. Materials and Methods
2.1. Experimental Units
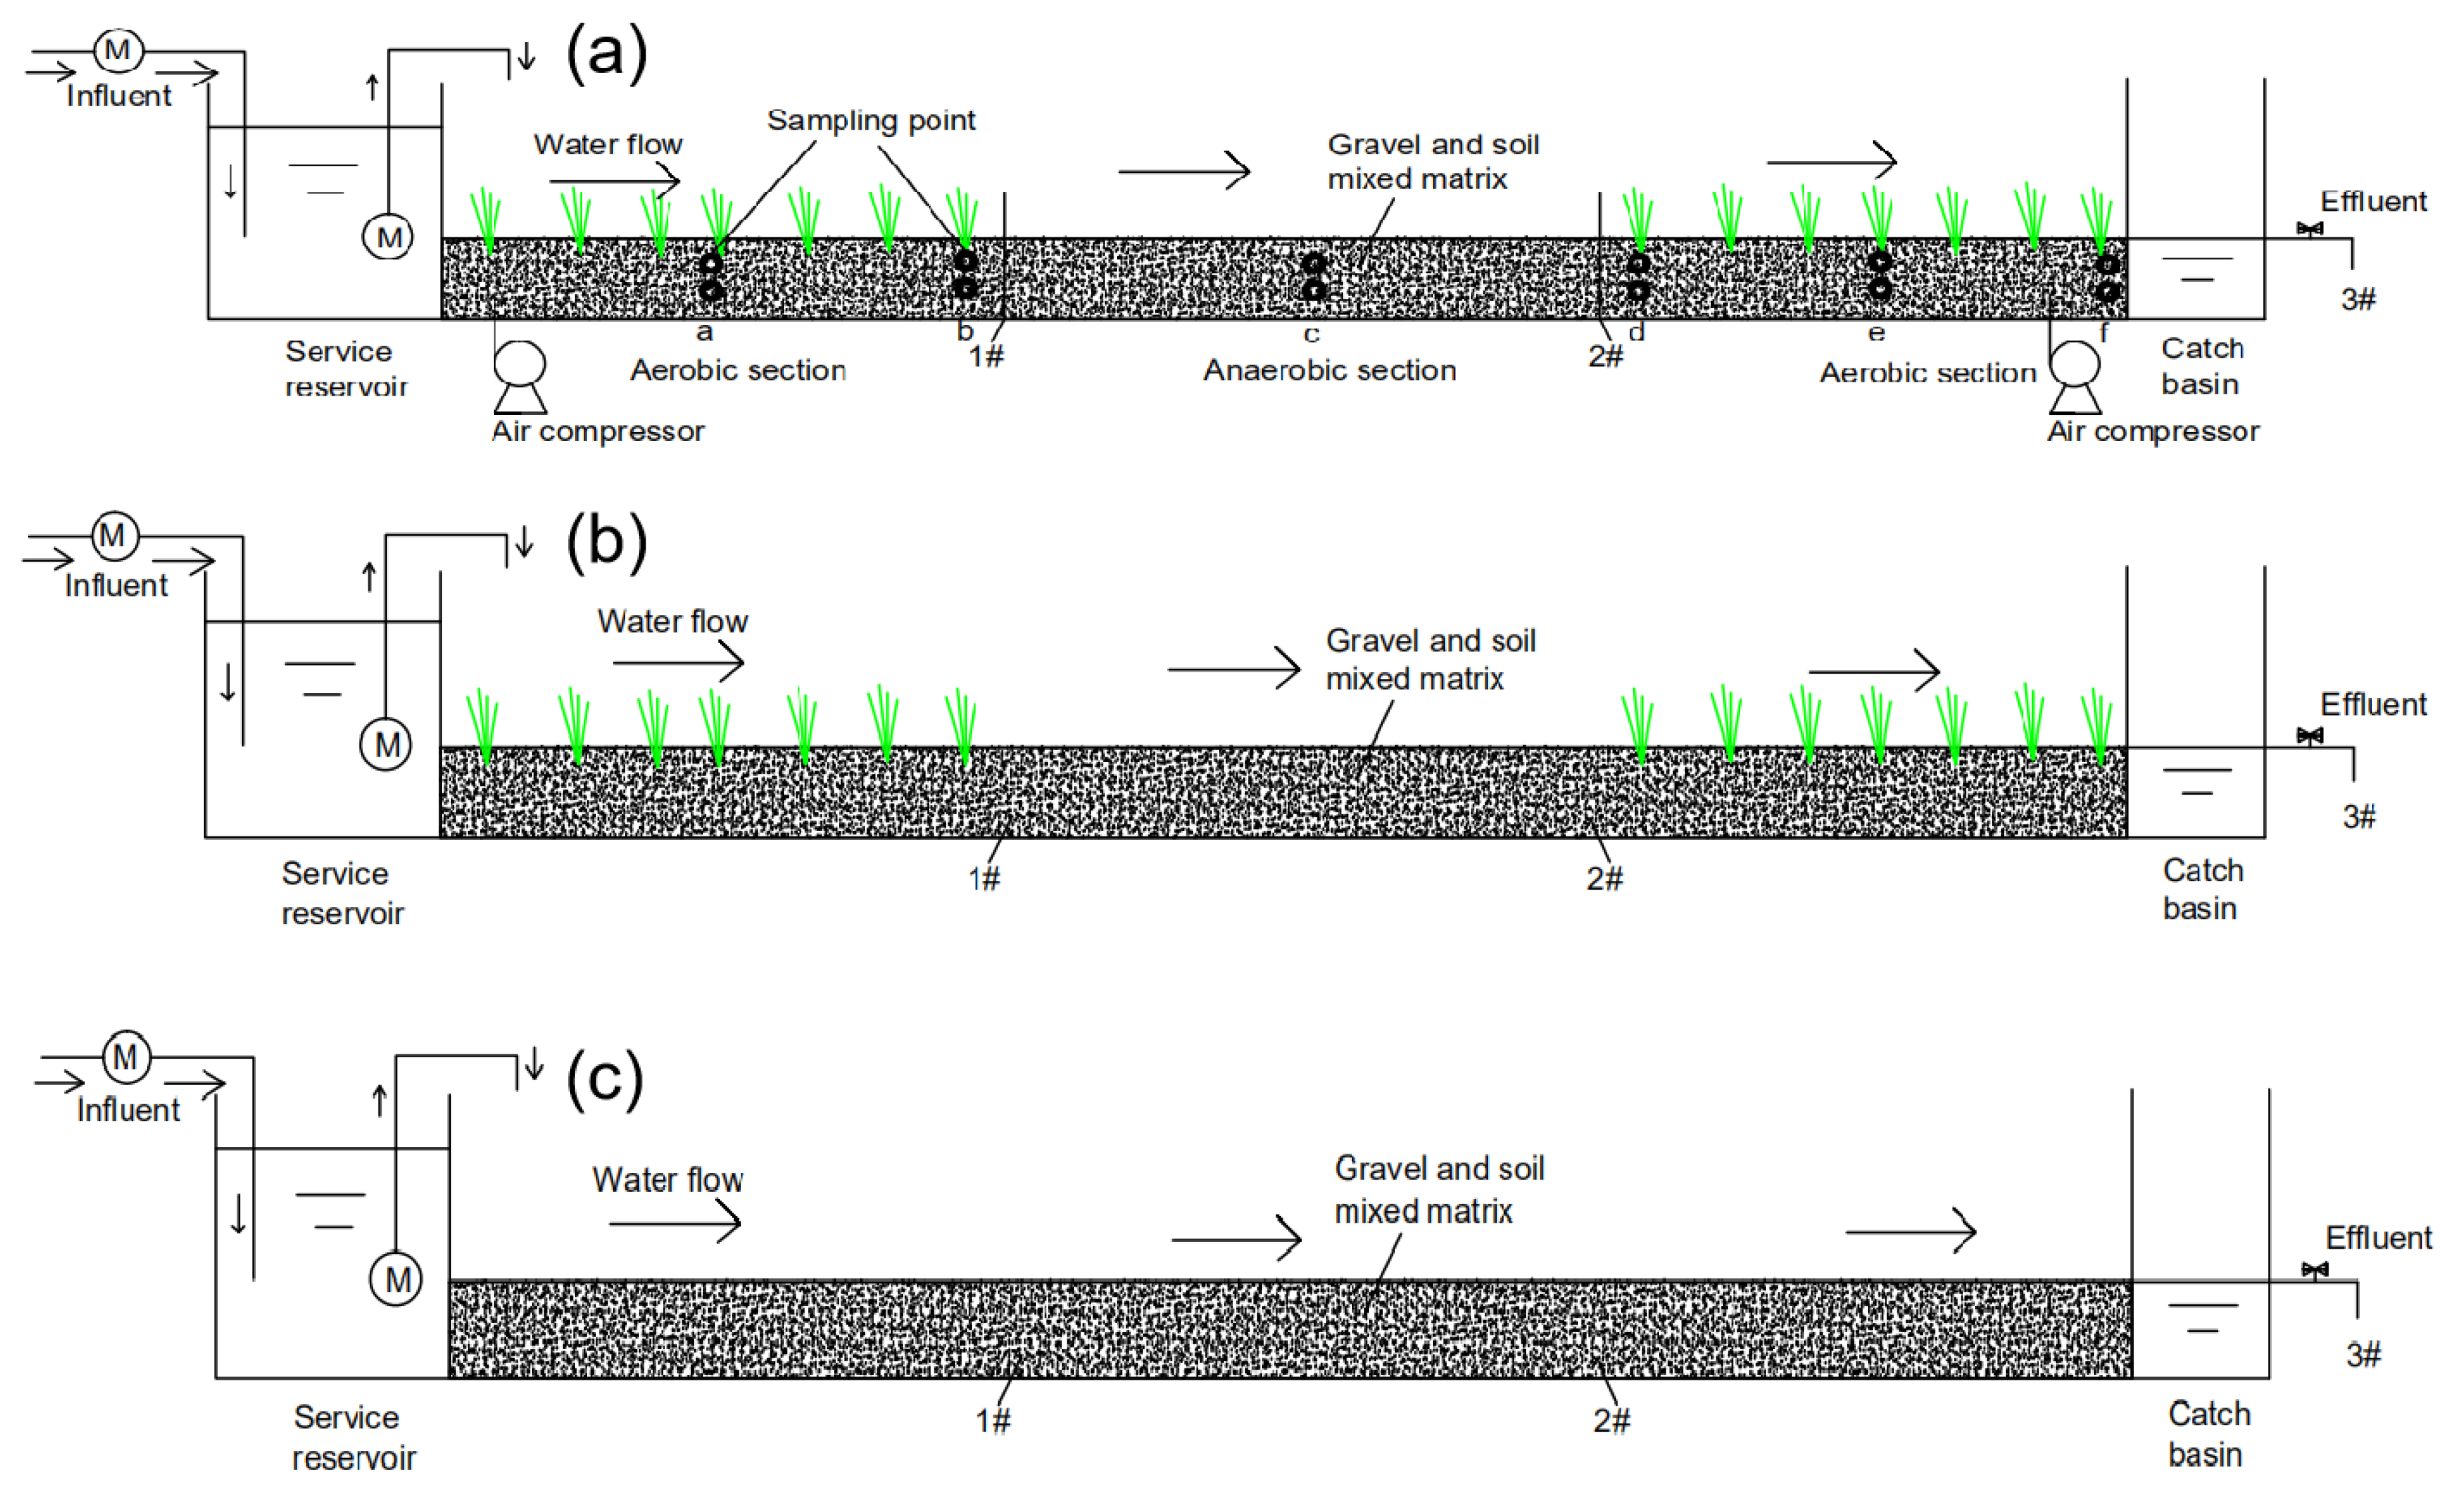
Three groups of constructed wetlands were constructed, including common matrix flow wetland, O-A-O-CW, and no-plant wetland. As a kind of aquatic vegetable, water spinach can remove nitrogen and phosphorus from the wetland by harvesting, which can also bring economic benefits. Therefore, water spinach was selected as the research object. The configurations of the three wetlands are shown in Figure 1. The wetland was made of masonry concrete which was 12 m × 1 m × 0.6 m (L × W × D). The service reservoir was set in the front of the CW. The O-A-O-CW was separated into three sections. Each section was 4 m in length and was separated by masonry concrete partition. The O-A-O (aerobic/anaerobic/aerobic) water spinach wetland was divided into aerobic, anaerobic, and aerobic sections along the flow direction. In the aerobic section, aquatic vegetables were planted. The aeration pipe was laid on the bottom, and the bed was aerated evenly by the air compressor. The aeration intensity was about 24 m3/h. There were no plants in the anaerobic area, and the anaerobic area was covered with plastic film on the surface of the matrix to form an anaerobic environment. As shown in Figure 1b, the common matrix flow wetland was constructed without the aeration pipe. Moreover, no-plant wetland was constructed as shown in Figure 1c, and only gravel and soil mixed matrix was filled in this system.
2.2. Operating Conditions and the Sampling Methods of the Constructed Wetland
The raw water was taken from a small lake, and a certain amount of chemicals were added into the raw water to simulate the water quality parameters of rural runoff. The water quality parameter of the influent of the three CWs is presented in Table 1. The raw water was stored in a service reservoir and was pumped into the wetland by a water pump after adding chemicals. Moreover, the three groups of constructed wetlands were running for six months, and the operation parameters and control conditions of the CWs are shown in Table 2.
The removal rate of COD, ammonium-nitrogen (NH4+-N), nitrate (NO3−-N), TN, TP, pH, and DO were compared between three groups CWs during the initial 60 days operation. The effects of technological characteristics, including different hydraulic retention time (HRT) (0.5, 1, 1.5, 2, 2.5 days) and different hydraulic loading (0.15, 0.25, 0.35, 0.45, 0.55 m3·m−2·day−1) on TN and TP removal was studied after that. The HRT was set as 2 days when the effects of hydraulic loading on TN and TP removal were evaluated.
2.3. The Adsorption Characteristics of TN and TP
The six sampling points were set along the flow direction of the wetland at 2 m (a), 4 m (b), 6 m (c), 8 m (d), 10 m (e), and 12 m (f) away from the influent of the O-A-O-CW, as shown in Figure 1a. The matrix and the plants sampling were conducted after the system was running for six months in November. The matrix sample and plant sample were taken back to the laboratory for testing immediately. The nitrogen and phosphorus adsorption mass in matrix and water spinach plants were determined by laboratory adsorption experiment. The specific methods were described in Supplementary Materials. The nitrification and denitrification intensity of wetland mixed matrix was determined by nitrification and denitrification intensity test. The rough experimental process was concluded as the method described below. Firstly, 10 g of mixed substrates were taken from the CW, and then the mixed substrates were added into the sterile flask. After that, 25 mg/L NH4+-N and liquid medium containing NO3−-N were respectively added into the flask for the corresponding nitrification and denitrification intensity test. The flask was shaken on a constant temperature shaker incubator (SHZ-B, Shanghai Boxun Medical Bio Instrument Co., Ltd. Shanghai, China) for 3 days. The suspension was collected every 24 h to measure the concentration of NO3--N after filtration or centrifugation. The nitrification and denitrification intensity were determined based on the Equation (1). The specific methods are described in Supplementary Materials.
W(n) = (C2 − C1) × (V1 + V2)/(t × m × k)
- W(n) — Nitrification intensity/Denitrification intensity (mg/kg·h)
- C2 — The concentration of NO3−-N after culture (mg/L)
- C1 — The concentration of NO3−-N before culture (mg/L)
- V1 — The volume of culture medium (L)
- V2 — The volume of water in the mixed substrates (L)
- t — Culture time (h)
- m — Sample quality (kg)
- k — Moisture coefficient
2.4. Statistical Analysis
pH and DO were measured by pH meter (HANNA, Padova, Italy) and portable dissolved oxygen analyzer (INESA, Shanghai, China), respectively. COD was measured by the standard procedure described in APHA [29]. Pollutants, such as NH4+-N, NO3−-N, TN, and TP, were determined by UV–visible spectrophotometer (SHIMADZU, Kyoto, Japan) described in APHA [29]. A one-way ANOVA analysis (P < 0.05) was performed using SPSS 22.0 (IBM, USA) to test for the statistical significance.
3. Results
3.1. Comparison of Treatment Effects of Three Control Groups
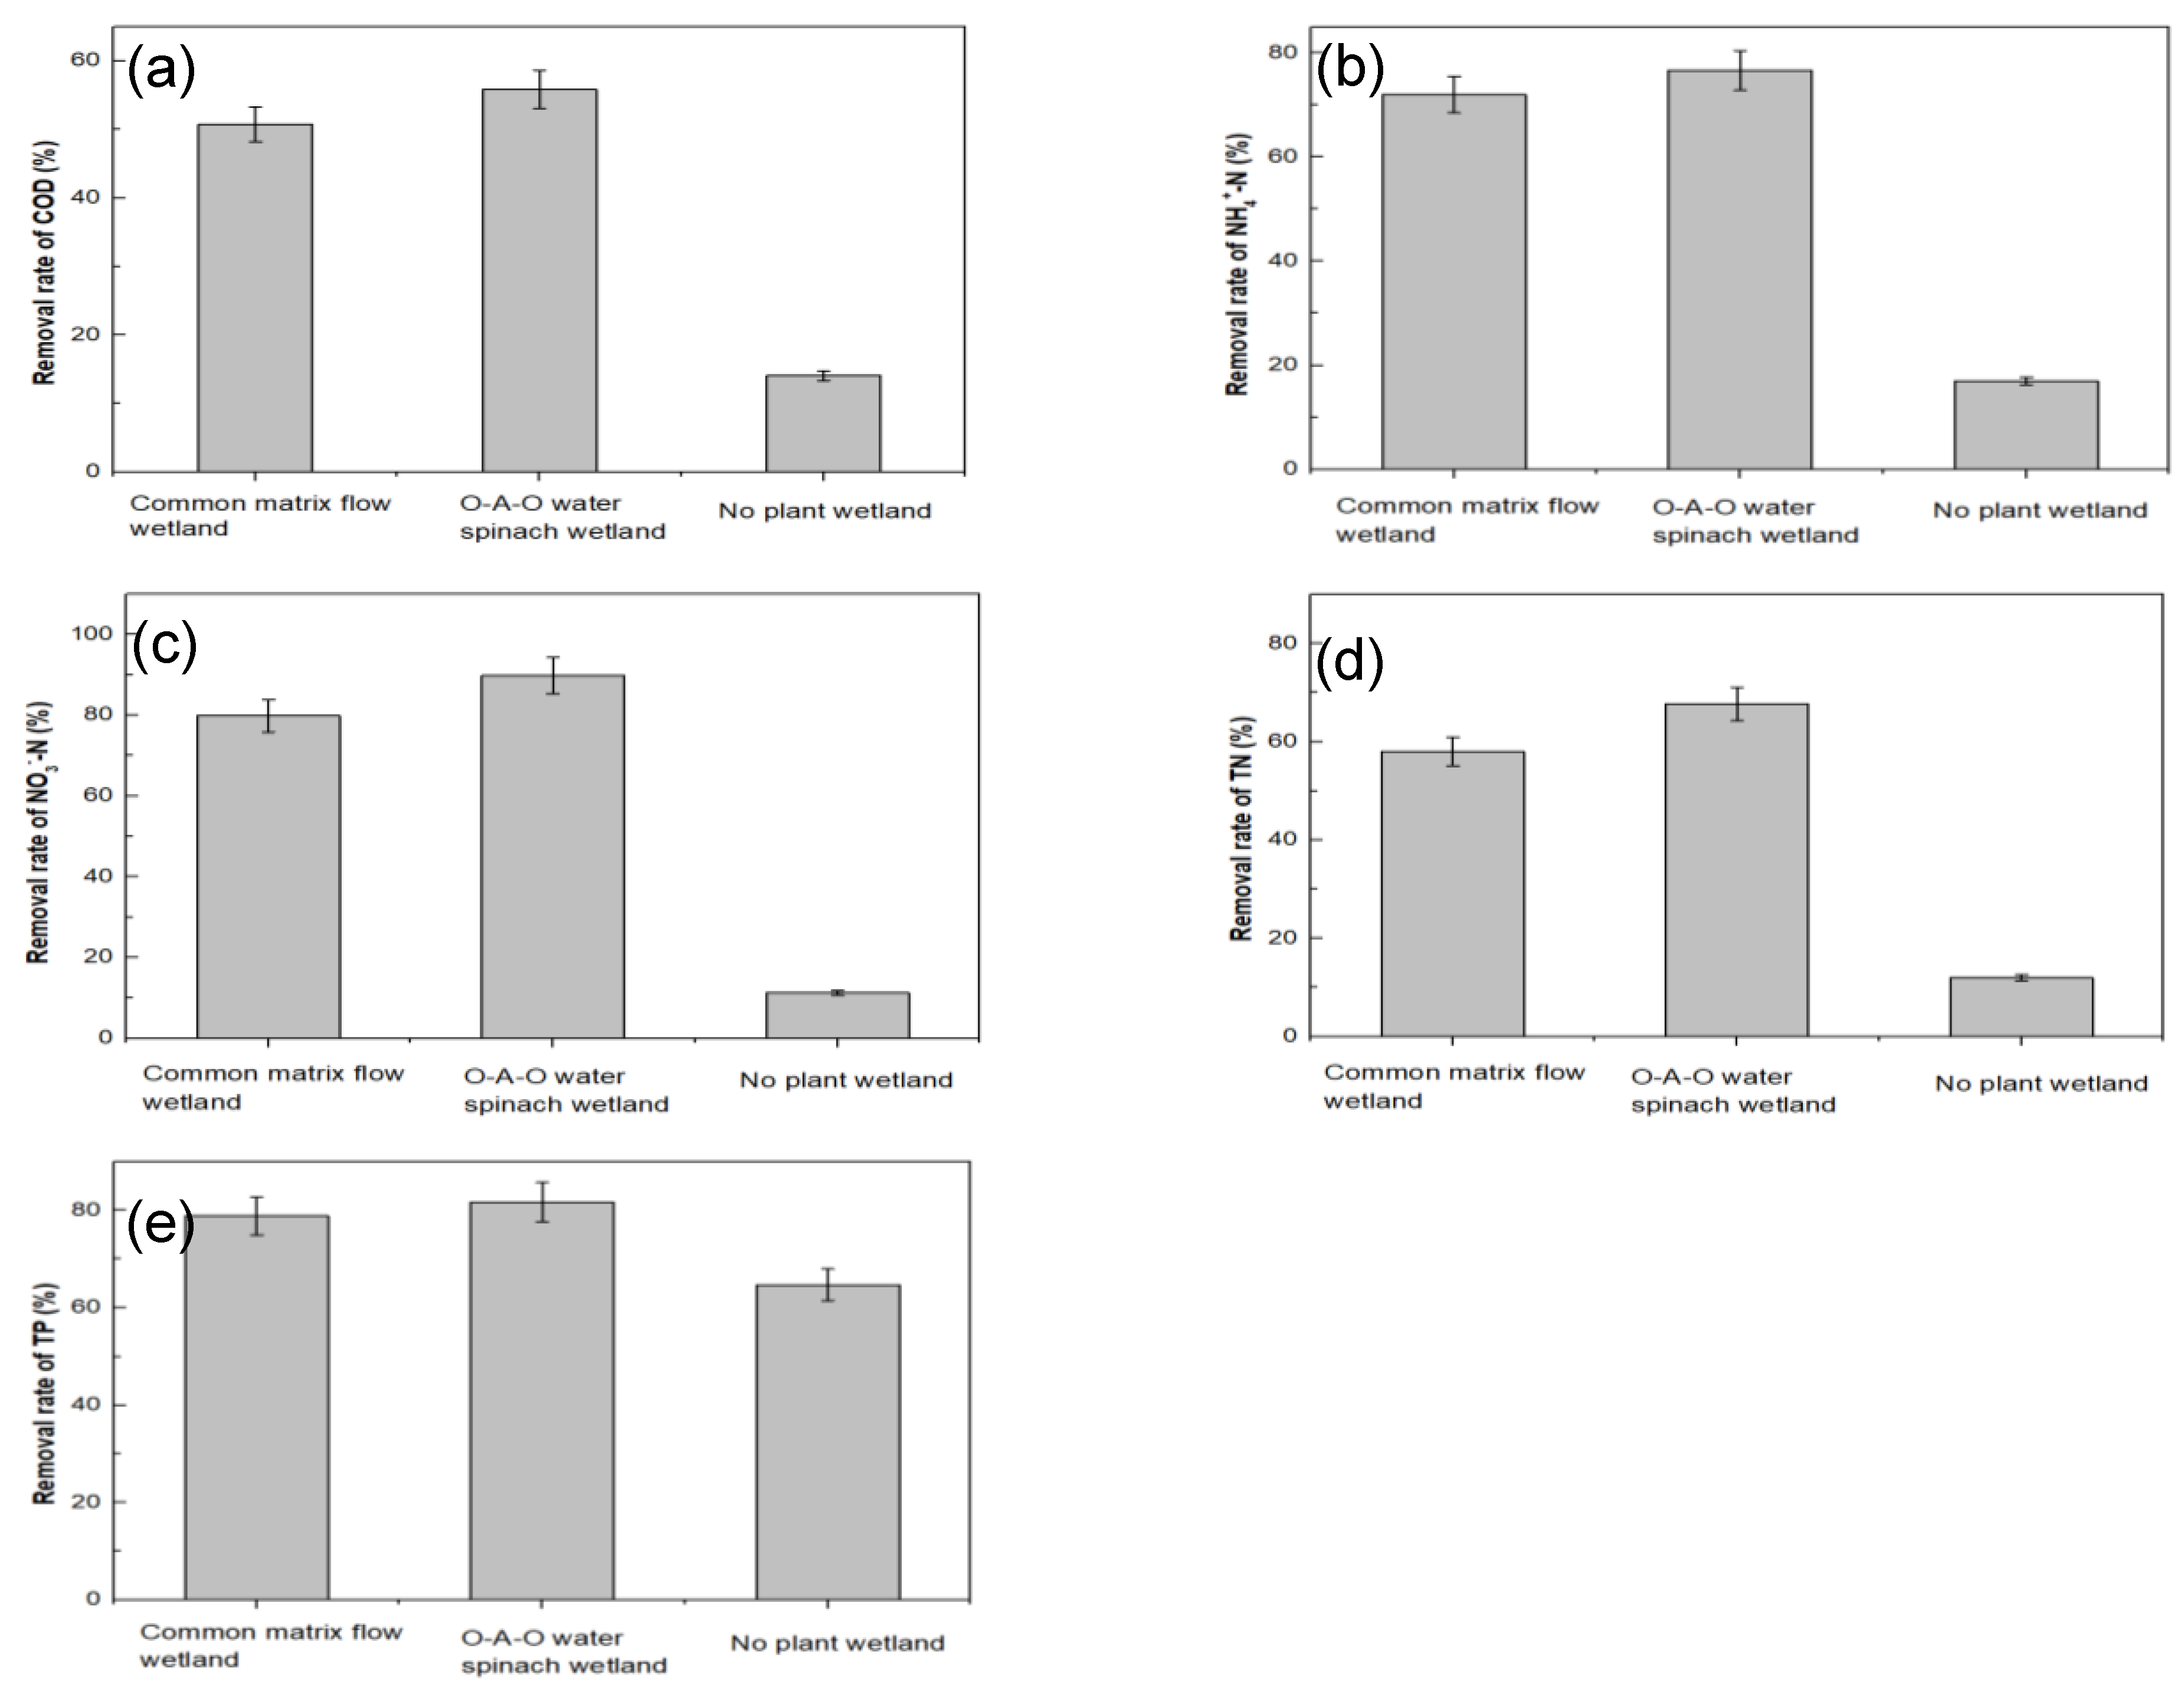
The removal efficiency of TN, TP, NH4+-N, NO3—N, and COD in different CW are shown in Figure 2. Among the three CWs, the O-A-O-CW exhibited the highest removal efficiency of TN, TP, NH4+-N, NO3—N, and COD, and the corresponding removal efficiency were 67.68%, 81.70%, 76.74%, 89.78%, and 55.85%, respectively.
In general, O-A-O-CW has the advantages over treating rural runoff discharge by creating an alternant anaerobic and aerobic environment. The DO concentration in the aerobic area was about 2.4 mg/L. It has been reported that the primary mechanism for organics removal in wetland is aerobic degradation by bacteria [30]. Therefore, the high DO in aerobic zone of the system is beneficial for COD degradation [30,31]. The O-A-O-CW has the highest removal rate of COD (Figure 2a). Additionally, aquatic vegetables can also increase DO in wetlands by photosynthesis, so the DO concentration in the common matrix flow wetlands and O-A-O-CW may be significantly higher than that of no-plant wetlands. The results depicted in Figure 2b show that the higher removal rate of NH4+-N was obtained in O-A-O-CW and the common matrix flow was due to the oxygen available from the plants. The existence of the plants can be very efficient in the nitrification process due to the high density of the roots. Moreover, plants can uptake and transfer nutrients and further improve conditions for bacteria living in the vegetable wetland. Additionally, it has been reported that the plants in CW can provide more sites for bacteria attachment, target pollutants adsorption, and further accelerate the oxygen transfer capabilities around the rhizosphere [32]. Therefore, water spinach plays an important role in CWs.
According to previous studies, the major nitrogen removal mechanisms in CWs included bacteria transformation, physicochemical methods, and plant uptake [33]. As we all know, the alternate anaerobic and aerobic process was obviously conductive to the removal of NH4+-N and NO3−-N. It is attributed to NH4+-N can be oxidized to NO3--N in aerobic section, and NO3−-N can be reduced to N2 in anaerobic section. Thus, more nitrogen can be transferred to N2 during the process in O-A-O-CW. This may be one reason for the higher removal efficiency of NH4+-N and NO3--N obtained in O-A-O-CW [34] (Figure 2b,c). The O-A-O-CW that has sufficient DO can promote the nitrification of NH4+-N by setting up an aerobic/anaerobic/aerobic structure. Meanwhile, the O-A-O-CW provides a suitable anaerobic environment and sufficient carbon source that comes from aerobic zone for the denitrifying bacteria to ensure the smooth progress of denitrification. Therefore, the TN removal was highest in O-A-O-CW (67.68%) (Figure 2d).
In addition, the TP removal rate was also highest in O-A-O-CW (81.70%), followed by common matrix flow wetland (78.82%). The difference between them was notable (P <0.05) (Figure 2e). The high removal rate obtained in O-A-O-CW and common matrix flow wetland were attributed to the fact that bacteria around the plant root system can absorb plenty of phosphorus. Cacco et al. [35] proposed the Km value to evaluate the nutrients removal efficiency by plants in polluted water. The constant Km reflects the affinity of aquatic plants absorbing phosphorus in water. The smaller the value, the stronger the affinity. Water spinach has the minimum Km value which has a good purification effect compared with other vegetables [36], and it is suitable for processing different sewage-containing phosphorus. Meanwhile, phosphatase secreted by the plant root system can promote the inorganic process of phosphorus, which was conductive to phosphorus uptake by plants [37]. Cao et al. found that plants had more and more obvious impacts on the removal of phosphorus [38]. It should be pointed out that matrix also had great absorption capacity for phosphorus and the lowest TP removal rate of no-plant wetland could still achieve 64.67%. This indicated that the adsorption of the matrix was the most important factor for the removal of phosphorus [39].
3.2. Effects of HRT and HLR on the Performance of O-A-O-CW
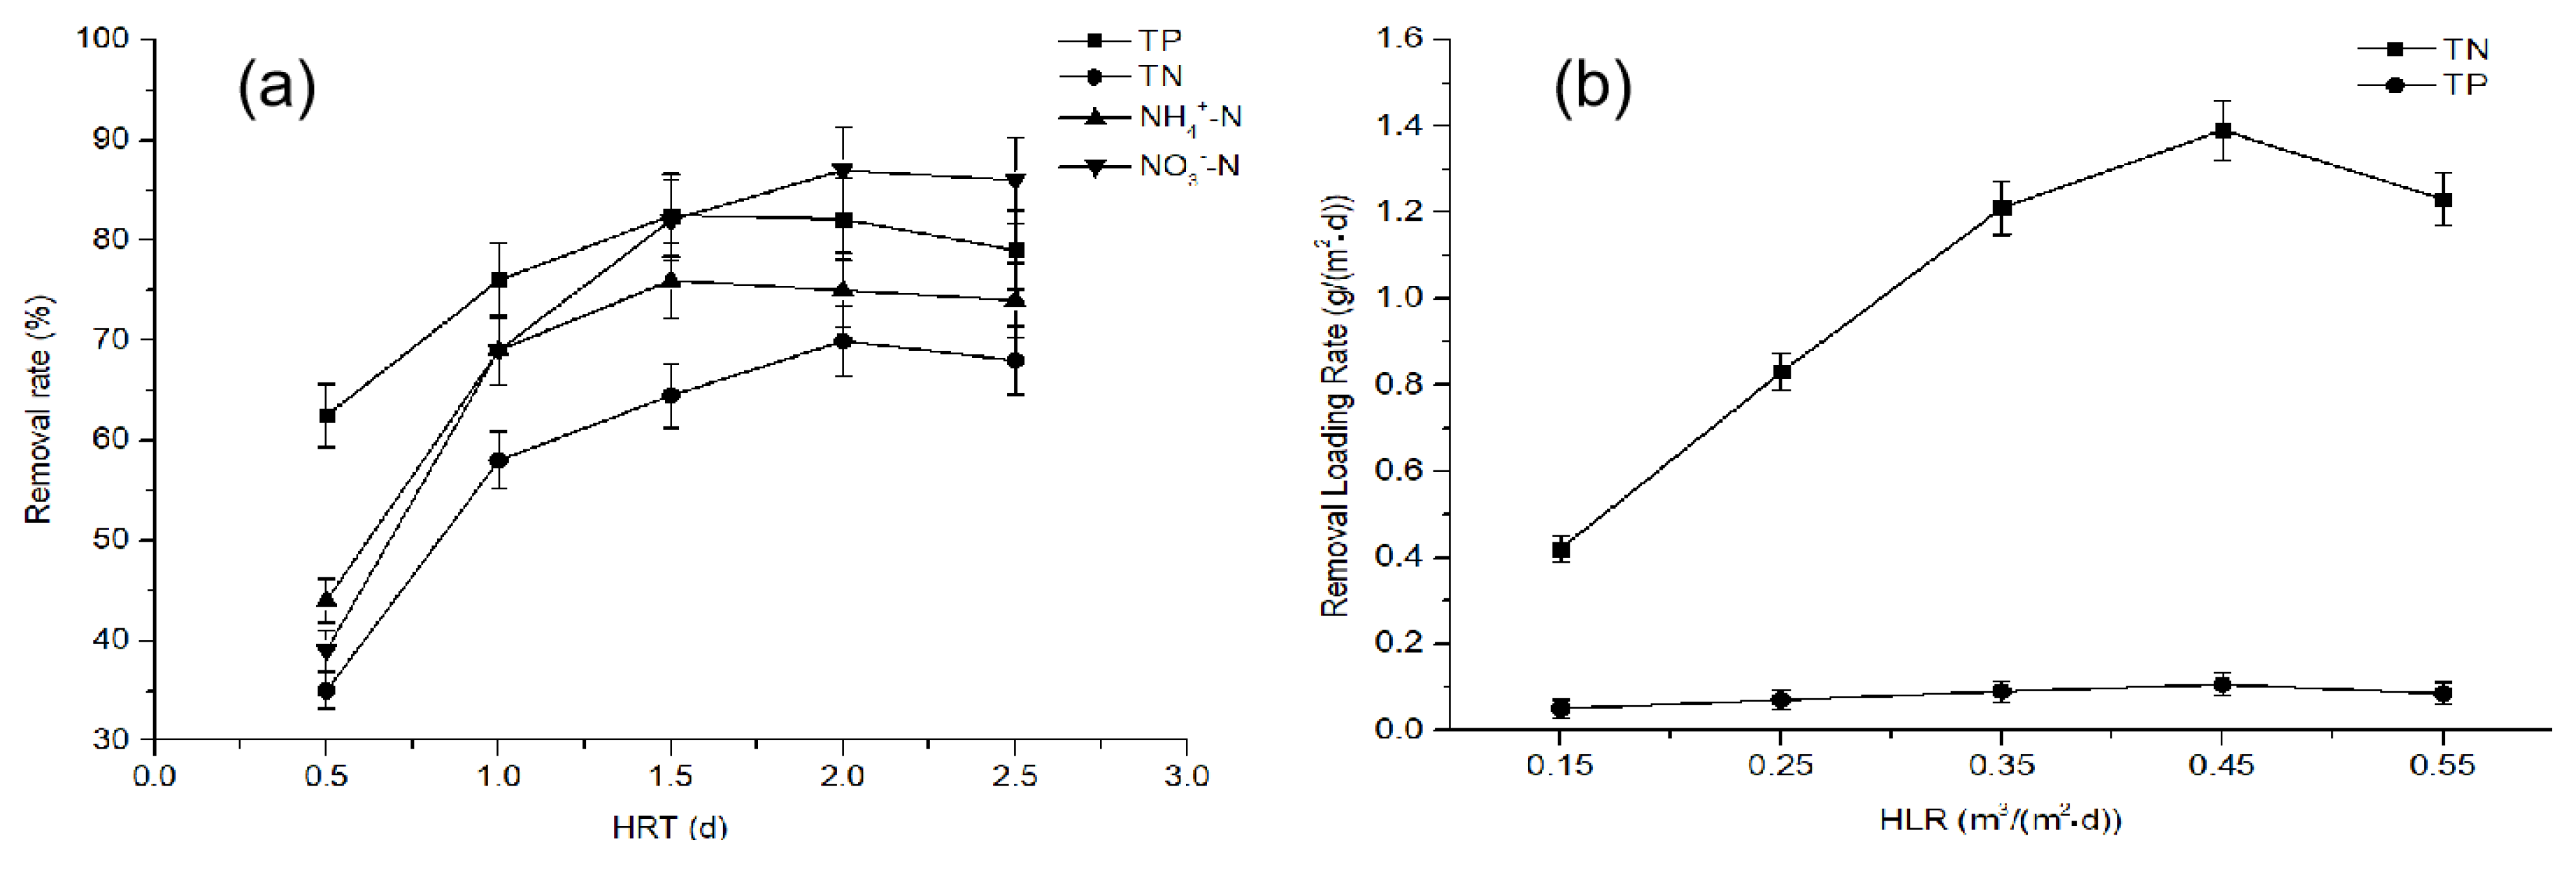
The impacts of hydraulic retention time (HRT) on target pollutant removal in the new type O-A-O-CW were evaluated. Proper extension of HRT can improve the removal rate of TP in constructed wetlands because the HRT can affect the probability of phosphorus diffusion to matrix pore surface and adsorption point [40]. As shown in Figure 3, the removal efficiency of TN, TP, NH4+-N, and NO3−-N were highest when the HRT was 2 days, and the corresponding removal rate was 69.93%, 82.13%, 75.05%, and 87.15%, respectively. However, the removal rate of pollutants went down slightly when the HRT was over 2 days. In general, the removal rate of TN was lower than that of NH4+-N, because NH4+-N removal process was finished by converting NH4+-N into nitrous oxide (NO2−-N) and NO3−-N. However, the removal of TN needed to remove both NO2−-N and NO3−-N. When HRT was 0.5 days, the removal rate of NH4+-N was only 43.59%. When HRT was 1 day, 1.5 days, 2 days, and 2.5 days, the removal rates of NH4+-N were 69.38%, 74.13%, 75.05%, and 74.49%, respectively. It showed that the removal rate of NH4+-N was greatly affected by the HRT. It was because the adsorption and precipitation of matrix and the accumulation of biofilm could be more effective on NH4+-N removal with the extension of HRT [41]. In addition, when the HRT was too short to reach the reproductive and metabolic time of the nitrification and denitrifying bacteria, the removal rate of TN would be affected. Meanwhile, the short HRT reduces the contact time between the water flow and the wetland bed, thereby reducing the nitrogen adsorption capacity of the wetland.
The removal rate of phosphorus increased as HRT increased. Brooks et al. [42] has proven that the process of removing dissolved phosphorus from CWs involves two stages: the first stage was mainly through plant, matrix adsorption, and phosphate formation, which was very fast. The second stage was mainly through the reaction of phosphate to form water-insoluble precipitates. This process was very slow. When HRT was long enough to reach the second stage, the wetland can perform better phosphorus removal effects. Generally, the HRT was allowed to be over 40 h. Too short of a HRT cannot meet the time requirements for microbial absorption and degradation of phosphorus. In summary, the optimal HRT of O-A-O-CW was 2 days.
The impacts of hydraulic loading rate (HLR) were further evaluated in this study. HLR was set at 0.15, 0.25, 0.35, 0.45, and 0.55 m3·m−2·day−1 in this study. The results showed that the improved TN and TP removal rate can be obtained by increasing HLR. As shown in Figure 3b, the removal loading rate of TN increased firstly, and then decreased. O-A-O-CW achieved maximum removal loading rate of TN when hydraulic loading was 0.45 m3·m−2·day−1. The high HLR was beneficial to the adsorption and precipitation of nitrogen. However, the improvement was limited. The removal rate of TN decreased when the HLR was over 0.45 m3·m−2·day−1. This may be attributed to the fact that the water flow velocity increased and higher HLR would wash the microbes on the roots of plants and the surface of matrix away, and would bring microorganisms out of the wetland system. It led to the insufficient nitrification and denitrification reaction. Moreover, the water flow velocity increased, and thus higher HLR led to shorter HRT. The shorter HRT would influence nitrogen removal through the plant roots and substrates adsorption because of the shortage of contact time between sewage and constructed wetlands.
The removal loading rate of TP was relatively stable. However, it still showed a similar tendency with TN. O-A-O-CW achieved maximum removal loading rate of TP when hydraulic loading was 0.45 m3·m−2·day−1. Similar to TN, the increase of HLR would reduce the chance of phosphorus diffusion and contact to the surface of the substrate and the adsorption sites, while the HRT of sewage in the wetland was reduced. The phosphorus removal way in the wetland system was mainly by the absorption of microorganisms, plants, and matrix. Low hydraulic loading could be easy to cause anaerobic environment in the wetland system. The phosphorus, which was originally absorbed by the microorganisms in the aerobic environment, would be released again, which caused the TP removal rate to decrease [43]. Furthermore, extortionate hydraulic loading of the influent can wash away the biofilm, and it was not conducive to the degradation of nutrients by microorganism [44]. Therefore, the optimal HLR of O-A-O-CW was 0.45 m3·m−2·day−1.
3.3. The Mechanism of Contaminants Removal in O-A-O-CW
3.3.1. Static Adsorption of NH4+-N and Phosphorus by Matrix
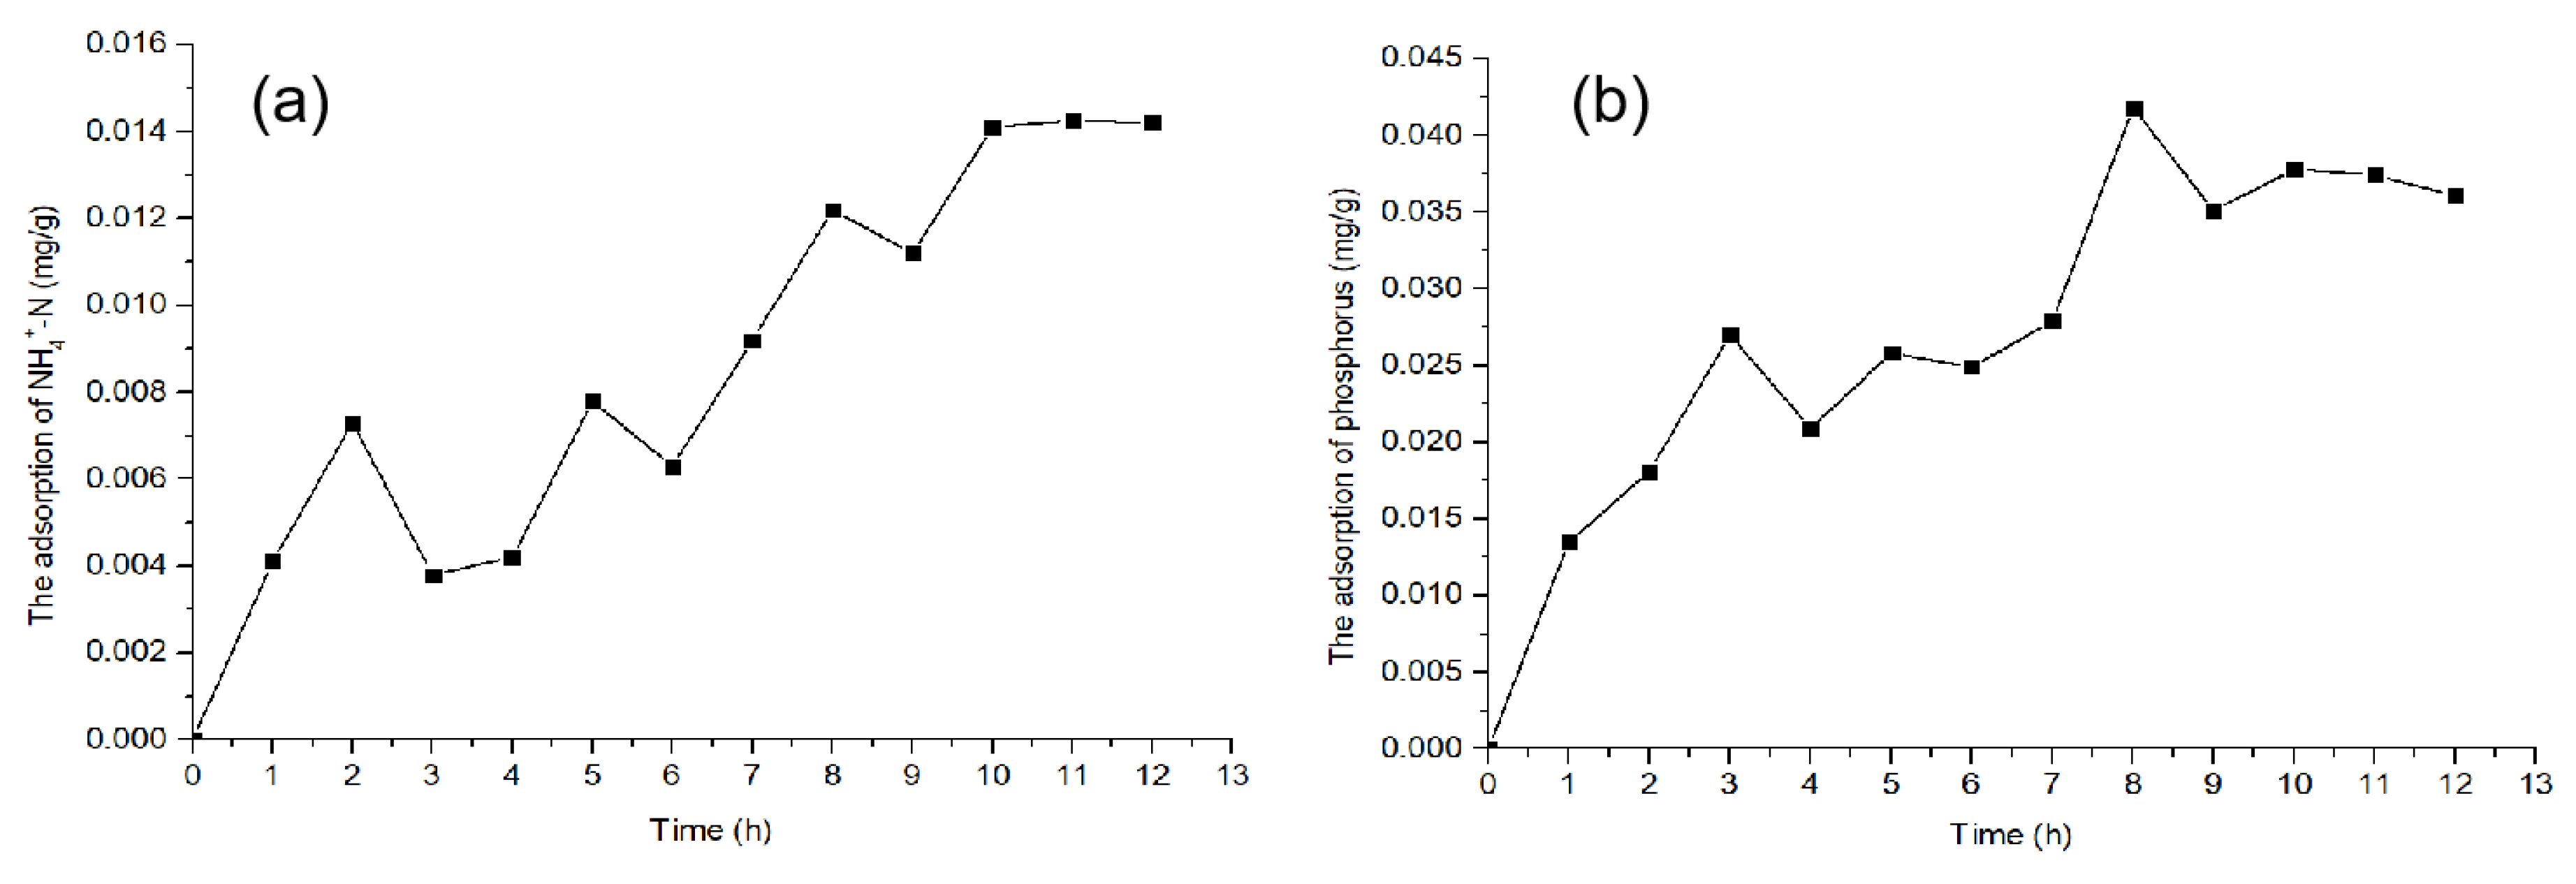
The adsorption performances of NH4+-N and phosphorus by the mixed matrix are shown in Figure 4. The adsorption rate of the NH4+-N by matrix was fast at the initial stage of the adsorption experiment (within 2 h), and the corresponding average adsorption rate was 3.65 mg/(kg·h) (Figure 4a). After that, the adsorption rate slowed down. It should be pointed out that the NH4+-N can be released when the conditions of the solution change [45]. As shown in Figure 4a, the adsorption balance point was reached at 10 h, and the equilibrium adsorption capacity was 0.0141 mg/g. As shown in Figure 4b, the adsorption of phosphorus presented a similar law with NH4+-N. the adsorption balance point was reached at 9 h. The equilibrium adsorption capacity was 0.0368 mg/g.
It can be seen that there were more adsorption sites on the surface of the matrix filler at the initial stage of the test, and the soluble phosphate and NH4+-N were adsorbed rapidly. As the adsorption time was prolonged, the adsorption sites were occupied continuously and the adsorption rate decreased. In addition, the desorption phenomenon occurred. Finally, the adsorption and desorption of NH4+-N and phosphorus by the matrix filler reached an equilibrium state, and the adsorption of NH4+-N and phosphorus gradually became stable. It should be pointed out that the adsorption of phosphorus by matrix was better than that of nitrogen. Insoluble organ phosphorus adsorbed on the solid suspended particles was stored in the wetland matrix with the deposition of the particles in the wetland or by the interception of the wetland matrix. Inorganic phosphorus can react with Ca2+, Mg2+, Fe3+, Al3+, and their hydrates or oxides in interstitial water in the matrix to form insoluble compounds. On the other hand, phosphorus in sewage can exchange with the hydrated metal ions such as Ca2+, Mg2+, Fe3+ on the matrix surface, so they were bound into the lattice of the matrix to be removed [46].
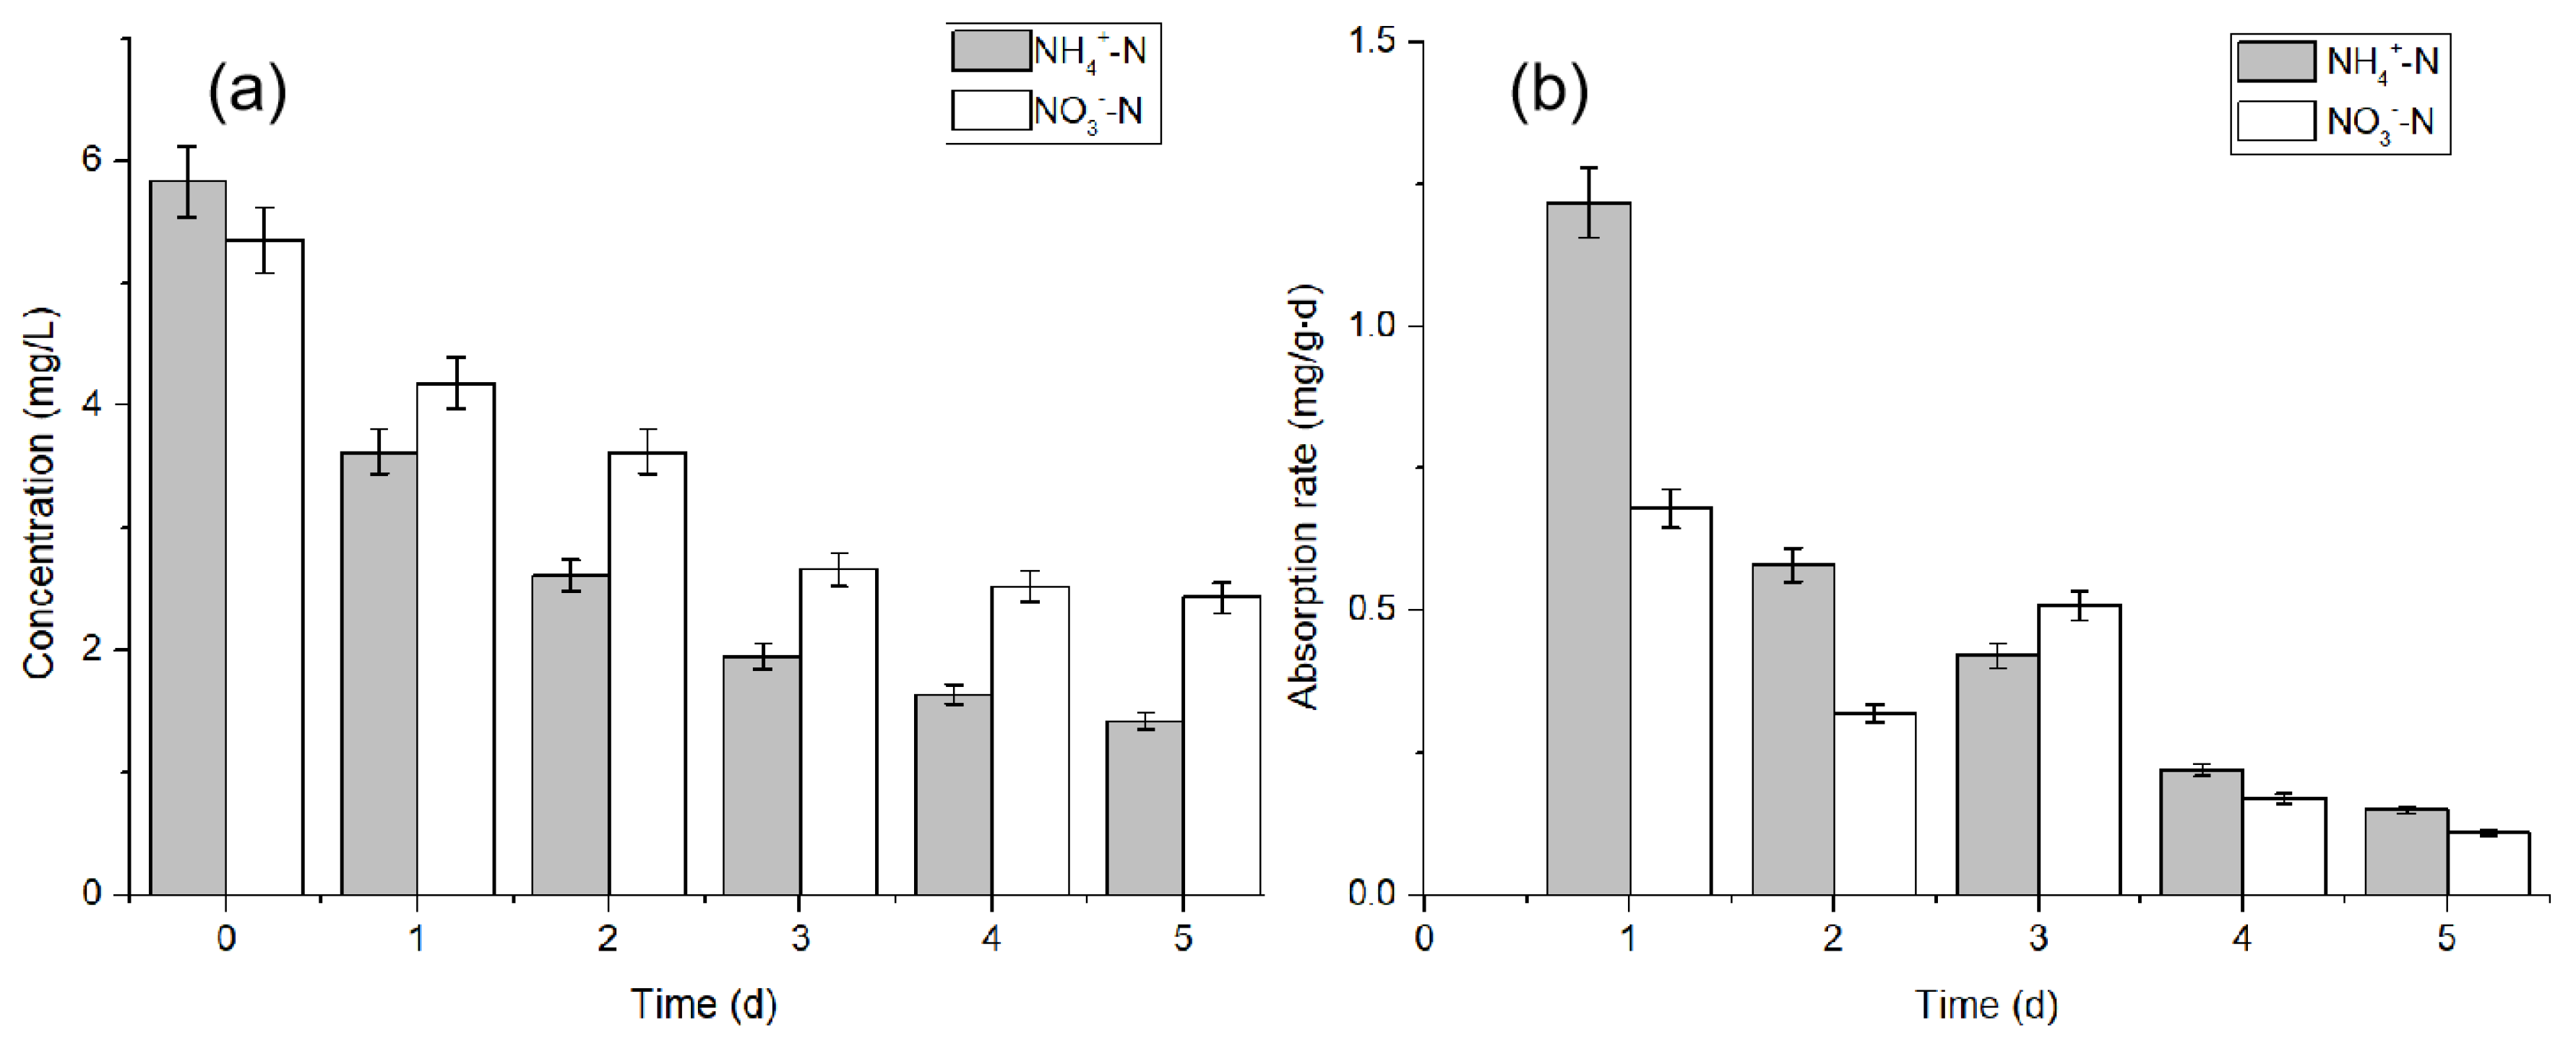
3.3.2. Nitrogen and Phosphorus Uptake Rate by Aquatic Plant
The previous study has demonstrated that the plants in the CW are essential to improve nitrogen removal efficiency [47,48]. The plants in CW can provide attachment points, DO, and carbon from root exudates for the growth of microorganisms in the rhizosphere [49,50,51,52,53]. It has reported that 20%–30% of the total nitrogen removal is derived from plant uptake in CW [54,55]. The culture medium used in the experiment was artificially prepared after sterilization, and the 5 mg/L nitrification inhibitor thiourea was added into the plant culture solution to prevent the effect of nitrification. Therefore, there was no microbial growth and the nitrification was inhibited. In addition, the concentration of dissolved oxygen in the culture vessel was always above 2 mg/L, which may inhibit the denitrification process. Therefore, the effects of denitrification on the results of test were ignored. It can be considered that NO3−-N and NH4+-N are only absorbed by plant roots, so the plant absorption contributed to the decrease of each target pollutant.
The absorption of different forms of nitrogen at 30 °C was studied, and the results are shown in Figure 5a. The result indicated that the concentration of NO3−-N and NH4+-N is negatively correlated with time. The concentration of NO3−-N decreased with the time variation curve. The average absorption rate of NO3−-N on water spinach was 0.347 mg/(g·d).
According to Figure 5b, the average absorption rate of NH4+-N by water spinach was 0.511 mg/(g.d), and the maximum absorption rate of NH4+-N was 1.22 mg/(g·d). The results showed that the water spinach has a significantly stronger absorption capacity of NH4+-N than NO3−-N. This may be caused by the water spinaches’ preference of using NH4+-N to synthesize amino acids and proteins [56]. Moreover, water spinach roots can generate Oxygen, which will beneficial for aerobic microorganisms. Aerobic microorganisms can oxidize NH4+-N to NO3−-N [57]. Besides, the removal of NH4+-N in CWs is mainly based on nitrification of microorganisms, the filtration of matrix, and the absorption of plants. However, the lack of oxygen supply will become the limiting factor of nitrification in CWs [58,59]. The required oxygen is dissolved in water, which is mainly from the transport, release, and diffusion of oxygen by plants. The previous study also demonstrated that the removal efficiency of nitrogen in planted wetlands was significantly higher than that in unplanted ones [60].
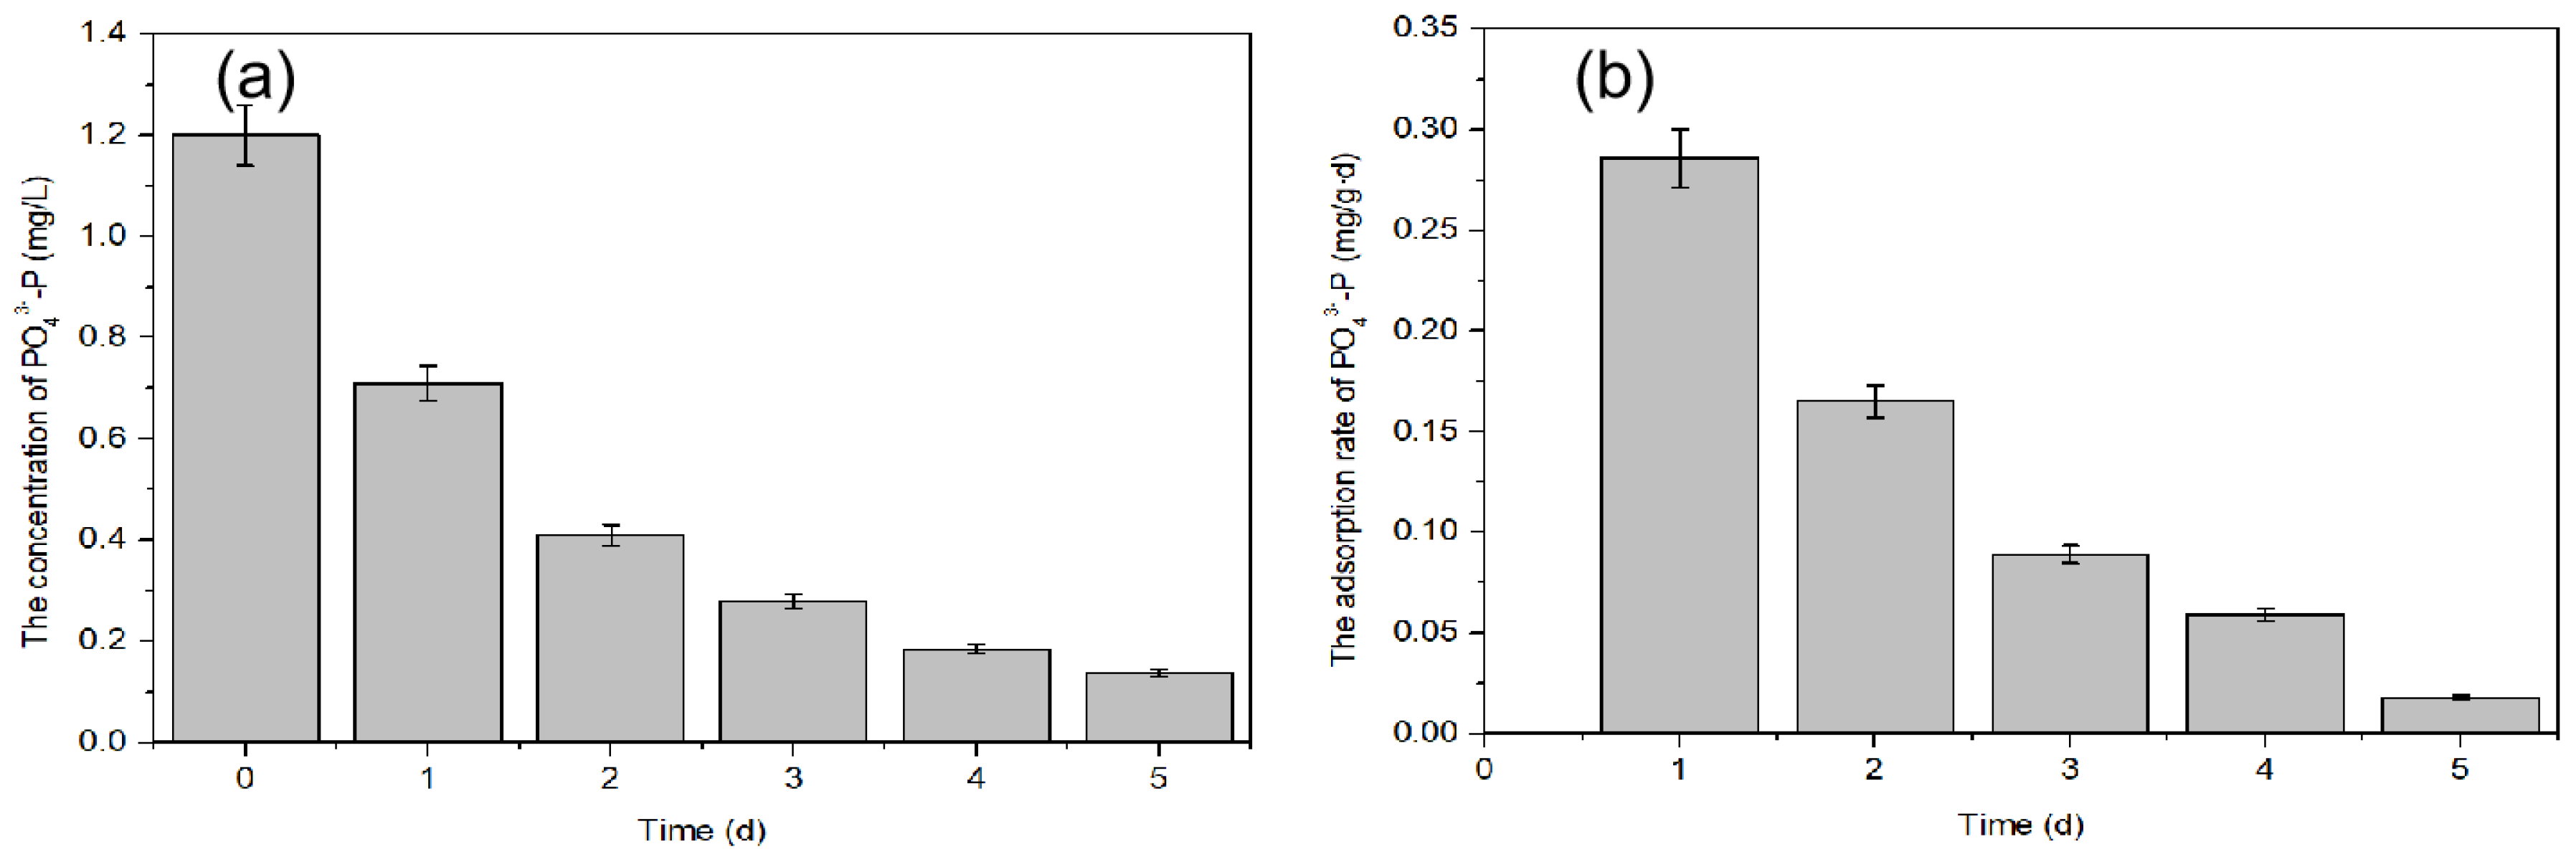
Figure 6a shows that the concentration of PO43− in the culture medium is negatively correlated with time. The average NH4+-N and PO43− average absorption rate by water spinach were 0.511 mg/(g·d) and 0.12 mg/(g·d), respectively. On the first day, the concentration of PO43− decreased sharply, and then the PO43− removal rate was 46.30%. During the test, the average PO43− uptake rate by water spinach was 0.12 mg/(g·d). As shown in Figure 6b, the maximum absorption rate was obtained on the first day and the corresponding value was 0.27 mg/(g·d), and then the absorption rate dropped. It has revealed that large amount of absorption of phosphorus only occurred in the initial stage, namely the beginning of the plant growing season, and the result was consistent with the conclusion of Vymazal et al. [61].
3.3.3. Nitrogen Removal by Bacteria
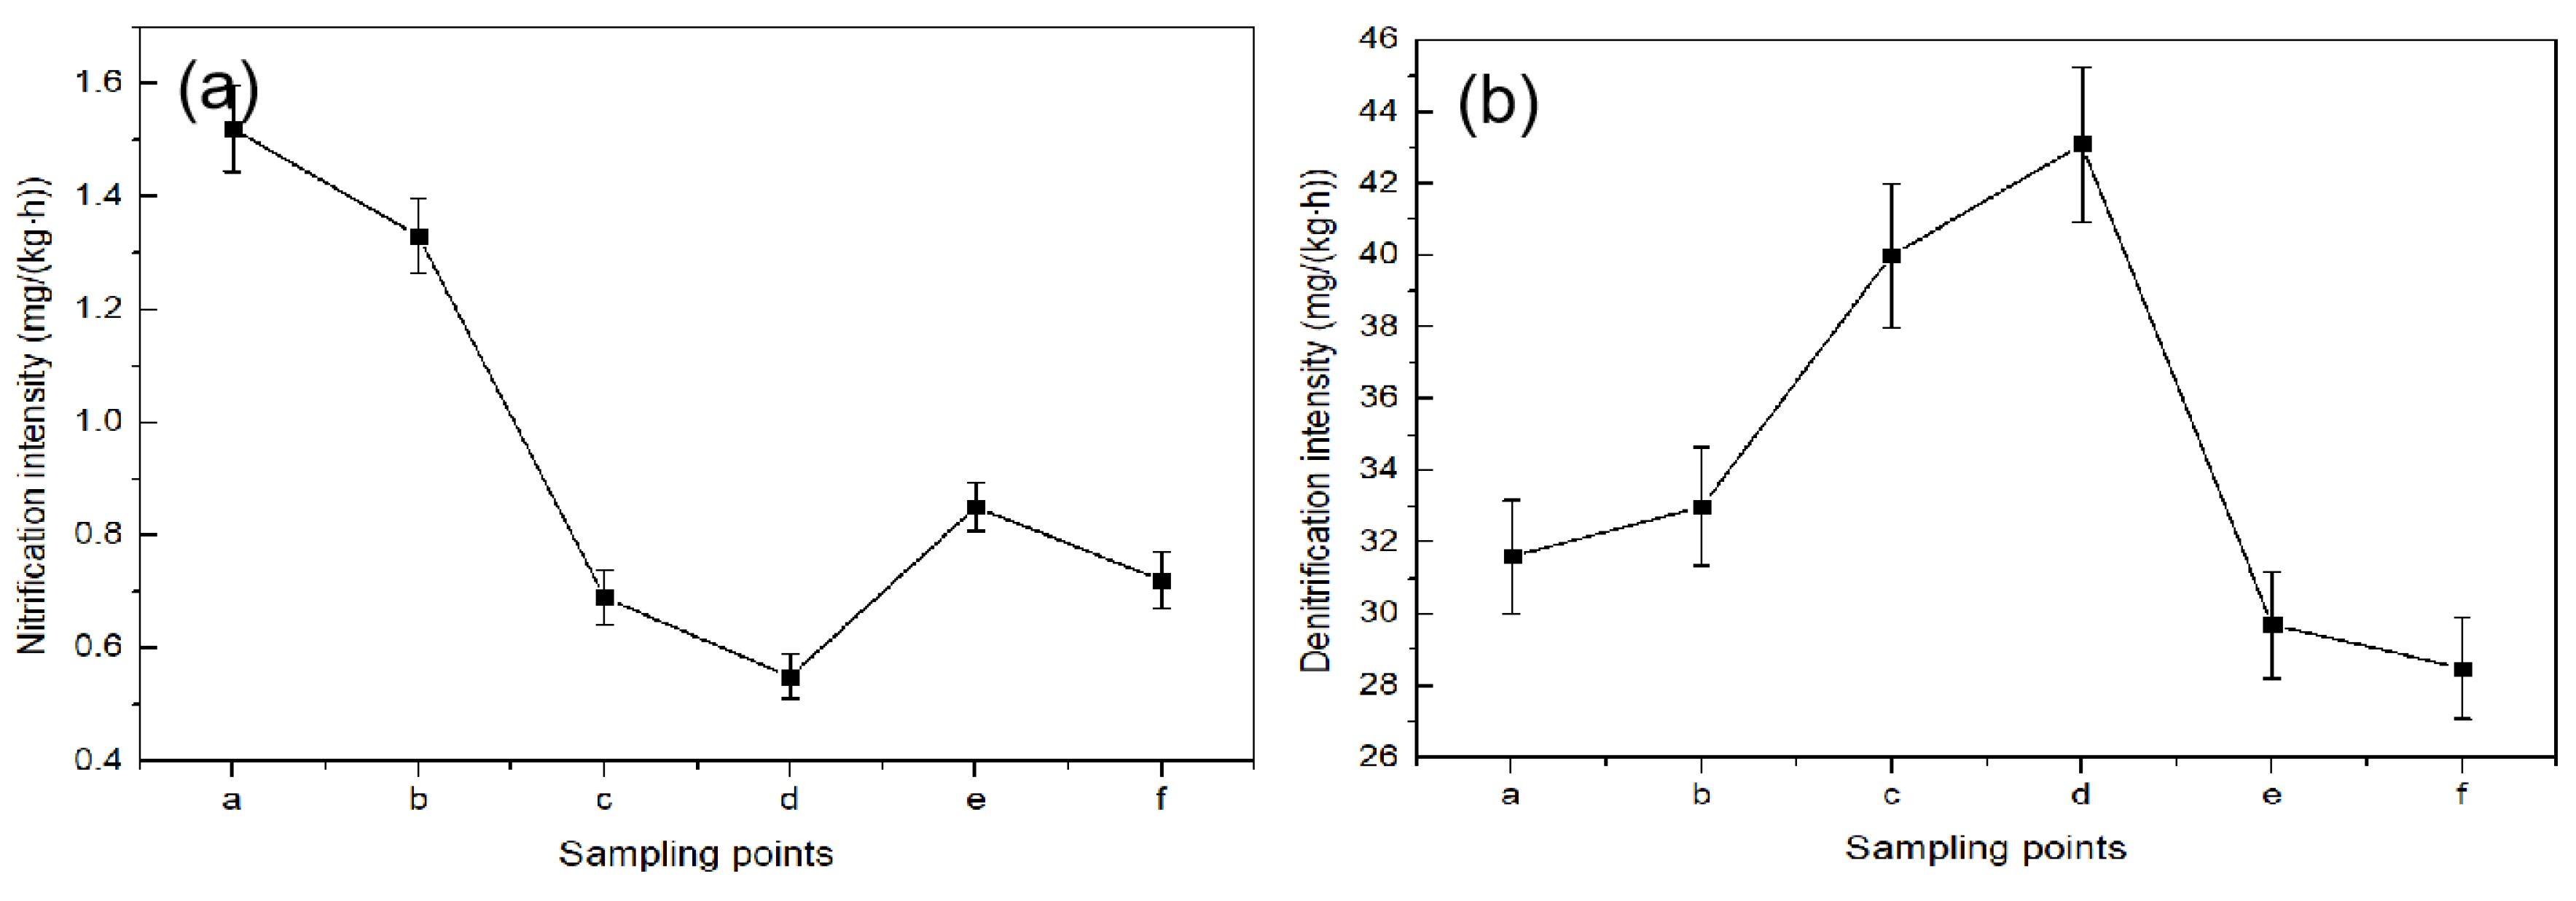
The nitrification and denitrification intensity are important parameters which can reflect nitrogen removal efficiency. As shown in Figure 1a, points a, b, e, and f belong to the aerobic section and points c and d belong to the anaerobic section. The nitrification and denitrification intensity of the matrix along the wetland are shown in Figure 7. As shown in Figure 7a, nitrification strength of aerobic zone was significantly higher than that of the anaerobic zone. This may be because artificial aeration and oxygen production of plant roots can lead to abundant DO in the aerobic section. In addition, plant roots provide a good attachment interface for nitrifying bacteria, which is beneficial to the growth and nitrification of nitrifying bacteria. Thus, it can promote NH4+-N removal. Therefore, nitrification intensity is correspondingly improved. The maximum nitrification intensity can reach 1.2 mg/(kg·h). The direct result of high nitrification intensity is the most important way for NH4+-N removal in the system. The difference in the nitrification rate is mainly limited by the nitrifying bacteria and dissolved oxygen in the system. Under the condition of sufficient oxygen, it is beneficial for the growth and reproduction of nitrifying bacteria, thereby promoting the removal of NH4+-N.
Matrix filtration, plant absorption, and bacterial metabolism contributed to the target pollutant’s degradation in this wetland. It should be pointed out that the existence of aerobic microorganism’s degradation in the wetland system may be the most important factor for the NH4+-N removal. Favorable conditions for bacterial nitrification were provided in the aerobic zone of the O-A-O-CW, and thus the removal efficiency of NH4+-N can be enhanced in this area. A large amount of NH4+-N was transferred into NO3−-N, and then the NO3−-N entered the anaerobic zone in the inner part of the system, and the denitrification process occurred in this area.
Similarly, the denitrification intensity in the anaerobic zone was stronger than that in the aerobic zone (Figure 7b). The highest denitrification intensity was 40.08 mg/(kg·h). It is generally accepted that low DO concentration should be maintained below 0.3–0.5 mg/L to accomplish the denitrification process [62]. From the aspect of microbiology, denitrification is accomplished by denitrification bacteria that use NO3−-N instead of oxygen as an electron acceptor during respiration. The DO concentration in the anaerobic section of the O-A-O wetland is significantly lower than the other two stages. The reduction of dissolved oxygen concentration ensures the smooth progress of denitrification [63]. Therefore, the anaerobic section of O-A-O-CW achieved highest denitrification intensity naturally. The alternation of the aerobic/anaerobic/aerobic environment in O-A-O-CW was conducive to the nitrification and denitrification process, which was of great significance on nitrogen removal. It was consistent with the previous study that microbial pathways were the main mechanisms responsible for nitrogen removal.
3.4. Outlook
Although this study offered a new reference for the design of CW to treat rural runoff, there are still some aspects that can be studied for further research: (1) The distribution and activity of microbes in wetlands should be further studied; (2) Functional genes of nitrification and denitrification should be studied by microbial community architecture; (3) Study the transformation and distribution of nitrogen in CWs for further understanding.
4. Conclusions
This study evaluated the effects of COD, TP, NH4+-N, NO3−-N, and TN removal in O-A-O-CW. The results show that O-A-O-CW significantly increased the target pollutant removal rate compared with the common matrix flow wetland and the no-plant wetland. The use of the plants proved to be very efficient in the nitrification process due to the oxygen supply, and the roots of the plants provided enough area for the pollutant’s adsorption, uptake, and transformation. In addition, water spinach can remove nitrogen and phosphorus. The alternate aerobic/anaerobic treatment unit contributed to the TN and TP removal. HRT and HLR are key parameters for determining the treatment efficiency in O-A-O-CW. Further study demonstrated that the optimal HRT of O-A-O-CW was 2 days, and the corresponding HLR of wetland was 0.45 m3·m−2·day−1. The most important removal pathway of nitrogen in O-A-O-CW was nitrification and denitrification, and the most important removal pathway of phosphorus in O-A-O wetland was matrix adsorption and precipitation. Hence, the O-A-O-CW achieved a higher removal of the target pollutants compared with the other CW. The result suggests that the combination of the adsorption of plants and matrix with strong nitrogen and phosphorus adsorption capacity and distinguishing the aerobic stage from the anaerobic stage were useful for enhancing the nitrogen and phosphorus removal capacity. The results from this study will offer a new reference for the design of CW to treat rural runoff.
Supplementary Materials
The following are available online at https://www.mdpi.com/2073-4441/11/5/1100/s1, Section 1: Static Shaking Table Adsorption Experiment of Matrix; Section 2: Determination of Nitrogen and Phosphorus Absorption Rate in Water Spinach; Section 3: Nitrification and Denitrification Intensity Test.
Author Contributions
Data curation, Y.C.; Funding acquisition, X.-L.Y.; Methodology, Y.W.; Supervision, H.-L.S.; Validation, Z.-D.Z.; Writing – original draft, Y.-W.W.; Writing – review and editing, H.L.
Funding
This work was supported by National Science and Technology Major Project of China (2017ZX07202004), National Natural Science Foundation of China (41571476), Postgraduate Research Practice Innovation Program of Jiangsu Province (KYCX18_1247).
Acknowledgments
Hai-Liang Song would like to acknowledge the Qing Lan Project of Jiangsu Province.
Conflicts of Interest
The authors declare no conflict of interest.
References
- Chau, K.W. Characterization of transboundary pop contamination in aquatic ecosystems of Pearl River delta. Mar. Pollut. Bull. 2005, 51, 960–965. [Google Scholar] [CrossRef] [PubMed]
- Alizadeh, M.J.; Kavianpour, M.R.; Danesh, M.; Adolf, J.; Shamshirband, S.; Chau, K.W. Effect of river flow on the quality of estuarine and coastal waters using machine learning models. Eng. Appl. Comp. Fluid. 2018, 12, 810–823. [Google Scholar] [Green Version]
- Shamshirband, S.; Nodoushan, E.J.; Adolf, J.E.; Manaf, A.A.; Mosavi, A.; Chau, K.W. Ensemble models with uncertainty analysis for multi-day ahead forecasting of chlorophyll a concentration in coastal waters. Eng. Appl. Comp. Fluid. 2018, 13, 91–101. [Google Scholar] [CrossRef] [Green Version]
- Olyaie, E.; Banejad, H.; Chau, K.W.; Melesse, A.M. A comparison of various artificial intelligence approaches performance for estimating suspended sediment load of river systems: a case study in United States. Environ. Monit. Assess. 2015, 187, 189. [Google Scholar] [CrossRef] [PubMed]
- Chen, X.Y.; Chau, K.W. A hybrid double feedforward neural network for suspended sediment load estimation. Water. Resour. Manage. 2016, 30, 2179–2194. [Google Scholar] [CrossRef]
- Alizadeh, M.J.; Nodoushan, E.J.; Kalarestaghi, N.; Chau, K.W. Toward multi-day-ahead forecasting of suspended sediment concentration using ensemble models. Enviro. Sci. Pollut. Res. 2017, 24, 1–9. [Google Scholar] [CrossRef]
- Yi, X.H.; Jing, D.D.; Wan, J.; Ma, Y.; Wang, Y. Temporal and spatial variations of contaminant removal, enzyme activities, and microbial community structure in a pilot horizontal subsurface flow constructed wetland purifying industrial runoff. Environ. Sci. Pollut. R. 2016, 23, 8565–8576. [Google Scholar] [CrossRef]
- Li, W.; Li, Z.; Li, W.; Li, Z. In situ nutrient removal from aquaculture wastewater by aquatic vegetable Ipomoea aquatica on floating beds. Water. Sci. Technol. 2009, 59, 1937–1943. [Google Scholar] [CrossRef]
- Lu, Y.; Qin, M.; Yuan, H.; Abu-Reesh, I.; He, Z. When Bioelectrochemical Systems Meet Forward Osmosis: Accomplishing Wastewater Treatment and Reuse through Synergy. Water 2014, 7, 38–50. [Google Scholar] [CrossRef]
- Kill, K.; Parn, J.; Lust, R.; Mander, U.; Kasak, K. Treatment Efficiency of Diffuse Agricultural Pollution in a Constructed Wetland Impacted by Groundwater Seepage. Water 2018, 10, 1601. [Google Scholar] [CrossRef]
- Wang, X.; Tian, Y.; Zhao, X.; Peng, S.; Wu, Q.; Yan, L. Effects of aeration position on organics, nitrogen and phosphorus removal in combined oxidation pond–constructed wetland systems. Bioresource. Technol. 2015, 198, 7–15. [Google Scholar] [CrossRef] [PubMed]
- Elfanssi, S.; Ouazzani, N.; Latrach, L.; Hejjaj, A.; Mandi, L. Phytoremediation of domestic wastewater using a hybrid constructed wetland in mountainous rural area. Int. J. of Phytoremediat. 2018, 20, 75–87. [Google Scholar] [CrossRef] [PubMed]
- He, Y.; Wang, Y.; Song, X. High-effective denitrification of low C/N wastewater by combined constructed wetland and biofilm-electrode reactor (CW-BER). Bioresour. Technol. 2016, 203, 245–251. [Google Scholar] [CrossRef]
- Ye, F.; Li, Y. Enhancement of nitrogen removal in towery hybrid constructed wetland to treat domestic wastewater for small rural communities. Ecol. Eng. 2009, 35, 1043–1050. [Google Scholar] [CrossRef]
- Foladori, P.; Ruaben, J.; Ortigara, A.R. Recirculation or artificial aeration in vertical flow constructed wetlands: a comparative study for treating high load wastewater. Bioresource. Technol. 2013, 149, 398–405. [Google Scholar] [CrossRef]
- De-Bashan, L.E.; Bashan, Y. Recent advances in removing phosphorus from wastewater and its future use as fertilizer (1997–2003). Water. Res. 2004, 38, 4222–4246. [Google Scholar] [CrossRef]
- Ding, Y.; Song, X.; Wang, Y.; Yan, D. Effects of dissolved oxygen and influent COD/N ratios on nitrogen removal in horizontal subsurface flow constructed wetland. Ecol. Eng. 2012, 46, 107–111. [Google Scholar] [CrossRef]
- Rubio, I.B.; Molle, P.; Luis, E.; Sáenz, M.; Ansola, G. Basic oxygen furnace steel slag aggregates for phosphorus treatment. Evaluation of its potential use as a substrate in constructed wetlands. Water. Res. 2015, 89, 355–365. [Google Scholar]
- Yang, Y.; Zhao, Y.; Liu, R.; Morgan, D. Global development of various emerged substrates utilized in constructed wetlands. Bioresource. Technol. 2018, 261, 441–452. [Google Scholar] [CrossRef]
- Tan, X.; Yang, Y.L.; Liu, Y.W.; Li, X.; Fan, X.Y.; Zhou, Z.W.; Liu, C.J.; Yin, W.C. Enhanced simultaneous organics and nutrients removal in tidal flow constructed wetland using activated alumina as substrate treating domestic wastewater. Bioresource. Technol. 2019, 280, 441–446. [Google Scholar] [CrossRef]
- Anna, G.P.; Marie, E.P.; Véronique, M.; Yogan, M.; Laure, M.; Bruno, C.; Isabelle, C.; Teddy, B.; Julien, V.; Isabelle, L.S. Selection of wild macrophytes for use in constructed wetlands for phytoremediation of contaminant mixtures. J. Environ. Mana. 2015, 147, 108–123. [Google Scholar]
- Singh, R.P.; Fu, D.; Jia, J.; Wu, J. Performance of Earthworm-Enhanced Horizontal Sub-Surface Flow Filter and Constructed Wetland. Water 2018, 10, 1309. [Google Scholar] [CrossRef]
- Wang, Y.M.; Lin, Z.Y.; Wang, Y.; Huang, W.; Wang, J.L.; Zhou, J.; He, Q. Sulfur and iron cycles promoted nitrogen and phosphorus removal in electrochemically assisted vertical flow constructed wetland treating wastewater treatment plant effluent with high S/N ratio. Water. Res. 2019, 151, 20–30. [Google Scholar] [CrossRef]
- Nivala, J.; Boog, J.; Headley, T.; Aubron, T.; Wallace, S.; Brix, H.; Mothes, S.; van Afferden, M.; Muller, R.A. Side-by-side comparison of 15 pilot-scale conventional and intensified subsurface flow wetlands for treatment of domestic wastewater. Sci. Total. Environ. 2019, 658, 1500–1513. [Google Scholar] [CrossRef]
- Angassa, K.; Leta, S.; Mulat, W.; Kloos, H.; Meers, E. Organic matter and nutrient removal performance of horizontal subsurface flow constructed wetlands planted with Phragmite karka and Vetiveria zizanioide for treating municipal wastewater. Environ. Processes 2018, 5, 115–130. [Google Scholar] [CrossRef]
- Muslun, S.T.; Ayhan, U. Performance of Nitrogen and Phosphorus Removal of Moving Bed Biofilm Reactor Operated as Sequencing Batch. Eur. J. Eng. Natural. Sci. 2017, 2, 108–113. [Google Scholar]
- Hu, S.S.; Chen, Z.B.; Lv, Z.P.; Chen, K.; Huang, L.L.; Zuo, X.T.; He, J.J.; Chen, Y. Purification of leachate from sludge treatment beds by subsurface flow constructed wetlands: effects of plants and hydraulic retention time. Environ. Sci. Pollut. Res. 2019, 26, 5769–5781. [Google Scholar] [CrossRef] [PubMed]
- Szota, C.; Farrell, C.; Livesley, S.J.; Fletcher, T.D. Salt tolerant plants increase nitrogen removal from biofiltration systems affected by saline stormwater. Water Res. 2015, 83, 195–204. [Google Scholar] [CrossRef]
- American Public Health Association (APHA). Standard Methods for the Examination of Water and Wastewater, 20th ed.; APHA, American Water Works Association: Washington, DC, USA, 1998. [Google Scholar]
- Kadlec, R.H. Chemical, physical and biological cycles in treatment wetlands. Wat. Sci. Tech. 1999, 40, 37–44. [Google Scholar] [CrossRef]
- Brock, T.D.; Madigan, M.T.; Martinko, J.M.; Parker, J. Biology of Microorganisms, 7th ed.; Prentice Hall: Upper Saddle River, NJ, USA, 1994. [Google Scholar]
- Abou-Elela, S.I.; Elekhnawy, M.A.; Khalil, M.T.; Hellal, M.S. Factors affecting the performance of horizontal flow constructed treatment wetland vegetated with Cyperus papyrus for municipal wastewater treatment. Int. J. Phytoremediat. 2017, 19, 1023–1028. [Google Scholar] [CrossRef]
- Khatiwada, N.R.; Polprasert, C. Assessment of effective specific surface area for free water surface constructed wetlands. Water Sci. Technol. 1999, 403, 83–89. [Google Scholar] [CrossRef]
- Akratos, C.S.; Tsihrintzis, V.A. Effect of temperature, HRT, vegetation and porous media on removal efficiency of pilot-scale horizontal subsurface flow constructed wetlands. Ecol. Eng. 2007, 29, 173–191. [Google Scholar] [CrossRef]
- Cacco, G.; Ferrari, C.; Saccomani, M. Pattern of sulfate uptake during root elongation in maize: Its correlation with productivity. Physiol. Plantarum. 1980, 48, 375–378. [Google Scholar] [CrossRef]
- Han, L.Y.; Lv, X.W. Absorption kinetics of nitrogen and phosphorus in aquatic vegetables in wetland. Chinese. J. Environ. Eng. 2017, 11, 2828–2835. (in Chinese). [Google Scholar]
- Heley, M.J.; Stewart, J.W.B.; Chauhan, B.S. Changes in inorganic and organic soil phosphorus fractions induced by cultivation practices and by laboratory incubations 1. Soil. Sci. Soc. Am. J. 1982, 46, 970–976. [Google Scholar]
- Cao, J. Study on the treatment effect of constructed wetland on rural domestic sewage. Ph.D. Thesis, Zhejiang University, Hangzhou, December 2007. [Google Scholar]
- .Zhang, X.L.; Xu, L.; Chen, J.J.; Hu, L. Purification effect of vertical-flow constructed wetlands with multi-size combined filter medium. Advanced. Materials. Res. 2013, 726–731, 1720–1723. [Google Scholar] [CrossRef]
- Healy, M.G.; Rodgers, M.; Mulqueen, J. Treatment of dairy wastewater using constructed wetlands and intermittent sand filters. Bioresource. Technol. 2007, 98, 2268–2281. [Google Scholar] [CrossRef]
- Ren, L.J.; Xu, L.L.; Zhang, Y.Y.; Pan, W.; Yin, S.L.; Zhou, Y.; Yu, L.J.; Chen, Y.S.; An, S.Q. Effects of Connection Mode and Hydraulic Retention Time on Wastewater Pollutants Removal in Constructed Wetland Microcosms. Clean-Soil. Air. Water 2014, 43, 1574–1581. [Google Scholar] [CrossRef]
- Brooks, A.S.; Rozenwald, M.N.; Geohring, L.D.; Lion, L.W.; Steenhuis, T.S. Phosphorus removal by wollastonite A constructed wetland substrate. Ecol. Eng. 2000, 15, 121–132. [Google Scholar] [CrossRef]
- Luo, J.Z.; Zhuang, W.; Xiong, G.X.; Luo, S. The behavior and removal method of phosphorus in constructed wetland. In Proceedings of the International Conference on Electric Technology & Civil Engineering, Lushan, China, 22–24 April 2011. [Google Scholar]
- Guo, Y.; Gong, H.; Guo, X. Rhizosphere bacterial community of Typha angustifolia L. and water quality in a river wetland supplied with reclaimed water. Appl. Microbiol. Biot. 2015, 99, 2883–2893. [Google Scholar] [CrossRef]
- Vymazal, J. Removal of nutrients in various types of constructed wetlands. Sci. Total. Environ. 2007, 380, 48–65. [Google Scholar] [CrossRef] [PubMed]
- Brix, H.; Arias, C.A.; Del Bubba, M. Media selection for sustainable P removal in subsurface flow constructed wetland. Water. Sci. Technol. 2001, 44, 47–54. [Google Scholar] [CrossRef] [PubMed]
- Shelef, O.; Gross, A.; Rachmilevitch, S. Role of Plants in a Constructed Wetland: Current and New Perspectives. Water 2013, 5, 405–419. [Google Scholar] [CrossRef]
- Herouvim, E.; Akratos, C.S.; Tekerlekopoulou, A.; Vayenas, D.V. Treatment of olive mill wastewater in pilot-scale vertical flow constructed wetlands. Ecol. Eng. 2011, 37, 931–939. [Google Scholar] [CrossRef]
- White, S.A. Design and Season Influence Nitrogen Dynamics in Two Surface Flow Constructed Wetlands Treating Nursery Irrigation Runoff. Water 2018, 10. [Google Scholar] [CrossRef]
- Cui, L.; Ouyang, Y.; Lou, Q.; Yang, F.; Chen, Y.; Zhu, W.; Luo, S. Removal of nutrients from wastewater with Canna indica L. under different vertical-flow constructed wetland conditions. Ecol. Eng. 2010, 36, 1083–1088. [Google Scholar] [CrossRef]
- Białowiec, A.; Janczukowicz, W.; Randerson, P.F. Nitrogen removal from wastewater in vertical flow constructed wetlands containing LWA/gravel layers and reed vegetation. Ecol. Eng. 2011, 37, 897–902. [Google Scholar] [CrossRef]
- Osorio, A.C.; Villafañe, P.; Caballero, V.; Manzano, Y. Efficiency of mesocosmscale constructed wetland systems for treatment of sanitary wastewater under tropical conditions. Water. Air. Soil. Poll. 2011, 220, 161–171. [Google Scholar] [CrossRef]
- Wang, R.; Baldy, V.; Périssol, C.; Korboulewsky, N. Influence of plants on microbial activity in a vertical-downflow wetland system treating waste activated sludge with high organic matter concentrations. J. Environ. Manage. 2012, 95, S158–S164. [Google Scholar] [CrossRef]
- Spieles, D.J.; Mitsch, W.J. The effects of season and hydrologic and chemical loading on nitrate retention in constructed wetlands: A comparison of low- and high- nutrient riverine systems. Ecol. Eng. 2000, 14, 77–91. [Google Scholar] [CrossRef]
- Reddy, K.R.; D’Angelo, E.M. Biogeochemical indicators to evaluate pollutant removal efficiency in constructed wetlands. Water Sci. Technol. 1997, 35, 1–10. [Google Scholar] [CrossRef]
- Gideon, O. Duckweed culture for wastewater renovation and biomass production. Agricul. Water Manag. 1994, 26, 27–40. [Google Scholar]
- Zhang, Y.L. Characteristics of NH4+ and NO3−~- uptake by rices of different genotypes. Acta. Pedologica. Sinica. 2004, 41, 918–923. [Google Scholar]
- Vtmazal, J.; Brix, H.; Cooper, P.F. Removal Mechanisms and Types of Constructed Wetland. Leiden Backhuys Publishers 1998, 35, 41–43. [Google Scholar]
- USEPA. Subsurface Flow Constructed Wetlands for Wastewater Treatment: A Technology Assessment; USEPA: Office of Water: Washington, DC, USA, 1993.
- Huett, D.O.; Morris, S.G.; Smith, G.; Hunt, N. Nitrogen and phosphorus removal from plant nursery runoff in vegetated and unvegetated subsurface flow wetlands. Water. Res. 2005, 39, 3259–3272. [Google Scholar] [CrossRef]
- Vymazal, J. Algae and Element Cycling in Wetlands; Lewis Publishers Inc.: New York, NY, USA, 1995. [Google Scholar]
- Bertino, A. Study on One-Stage Partial NitritationeAnammox Process in Moving Bed Biofilm Reactors: a Sustainable Nitrogen Removal. Master’s Thesis, Royal Institute of Technology, Stockholm, Sweden, December 2010. [Google Scholar]
- Penton, C.R.; Deenik, J.L.; Popp, B.N.; Bruland, G.L.; Engstrom, P.; St.Louis, D.; Tiedje, J. Importance of sub-surface rhizosphere-mediated coupled nitrification–denitrification in a flooded agroecosystem in Hawaii. Soil. Biol. Biochem. 2013, 57, 362–373. [Google Scholar] [CrossRef]
Figure 1.
The diagram of the three groups of constructed wetlands, (a) O-A-O (aerobic/anaerobic/ aerobic) water spinach wetland, (b) Common matrix flow wetland, (c) No-plant wetland.
Figure 1.
The diagram of the three groups of constructed wetlands, (a) O-A-O (aerobic/anaerobic/ aerobic) water spinach wetland, (b) Common matrix flow wetland, (c) No-plant wetland.

Figure 2.
Removal rates of pollutants in three groups of CWs (Constructed Wetlands), (a) Removal rate of COD (Chemical Oxygen Demand), (b) Removal rate of NH4+-N, (c) Removal rate of NO3−-N, (d) Removal rate of TN (Total Nitrogen), (e) Removal rate of TP (Total Phosphorus).
Figure 2.
Removal rates of pollutants in three groups of CWs (Constructed Wetlands), (a) Removal rate of COD (Chemical Oxygen Demand), (b) Removal rate of NH4+-N, (c) Removal rate of NO3−-N, (d) Removal rate of TN (Total Nitrogen), (e) Removal rate of TP (Total Phosphorus).

Figure 3.
Effects of HRT (Hydraulic Retention Time) and HLR (Hydraulic Loading Rate) on target pollutant removal rate, (a) Effects of HRT on the target pollutant removal rate, (b) Effects of HLR on the target pollutant removal loading rate.
Figure 3.
Effects of HRT (Hydraulic Retention Time) and HLR (Hydraulic Loading Rate) on target pollutant removal rate, (a) Effects of HRT on the target pollutant removal rate, (b) Effects of HLR on the target pollutant removal loading rate.

Figure 4.
The effects of matrix adsorption on NH4+-N and phosphorus adsorption, (a) NH4+-N adsorption by matrix (b) Phosphorus adsorption by matrix.
Figure 4.
The effects of matrix adsorption on NH4+-N and phosphorus adsorption, (a) NH4+-N adsorption by matrix (b) Phosphorus adsorption by matrix.

Figure 5.
Changes of nitrogen (NH4+-N and NO3−-N) concentration and absorption rate, (a) Changes of nitrogen concentration (NH4+-N and NO3−-N) in the culture medium, (b) Changes of nitrogen absorption rate (NH4+-N and NO3−-N) by water spinach.
Figure 5.
Changes of nitrogen (NH4+-N and NO3−-N) concentration and absorption rate, (a) Changes of nitrogen concentration (NH4+-N and NO3−-N) in the culture medium, (b) Changes of nitrogen absorption rate (NH4+-N and NO3−-N) by water spinach.

Figure 6.
Changes of PO43− concentration and absorption rate. (a) Changes of PO43− concentration in culture medium, (b) Changes of PO43− absorption rate by water spinach.
Figure 6.
Changes of PO43− concentration and absorption rate. (a) Changes of PO43− concentration in culture medium, (b) Changes of PO43− absorption rate by water spinach.

Figure 7.
Nitrification and denitrification intensity along the O-A-O-CW (aerobic/anaerobic/aerobic three-stage aquatic vegetable wetland). (a) Nitrification intensity along the wetland, (b) Denitrification intensity along the wetland.
Figure 7.
Nitrification and denitrification intensity along the O-A-O-CW (aerobic/anaerobic/aerobic three-stage aquatic vegetable wetland). (a) Nitrification intensity along the wetland, (b) Denitrification intensity along the wetland.


Table 1.
Raw water quality of test water.
| Index | CODCr | TP | TN | NH4+-N | NO3−-N |
|---|---|---|---|---|---|
| Range (mg/L) | 46~152 | 0.1~1.54 | 0.74~26.45 | 0.36~8.42 | 0.3~6.37 |
Table 2.
Operating conditions for new aquatic constructed wetlands.
| Temperature (°C) | HRT (days) | HLR (m3·m−2·day−1) | TN (mg/L) | TP (mg/L) |
|---|---|---|---|---|
| 12~36 | 2 | 0.45 | 3~15 | 0.2~2.95 |
© 2019 by the authors. Licensee MDPI, Basel, Switzerland. This article is an open access article distributed under the terms and conditions of the Creative Commons Attribution (CC BY) license (http://creativecommons.org/licenses/by/4.0/).
Share and Cite
MDPI and ACS Style
Wang, Y.-W.; Li, H.; Wu, Y.; Cai, Y.; Song, H.-L.; Zhai, Z.-D.; Yang, X.-L. In Situ Nutrient Removal from Rural Runoff by A New Type Aerobic/Anaerobic/Aerobic Water Spinach Wetlands. Water 2019, 11, 1100. https://doi.org/10.3390/w11051100
AMA Style
Wang Y-W, Li H, Wu Y, Cai Y, Song H-L, Zhai Z-D, Yang X-L. In Situ Nutrient Removal from Rural Runoff by A New Type Aerobic/Anaerobic/Aerobic Water Spinach Wetlands. Water. 2019; 11(5):1100. https://doi.org/10.3390/w11051100
Chicago/Turabian StyleWang, Ya-Wen, Hua Li, You Wu, Yun Cai, Hai-Liang Song, Zhi-Dong Zhai, and Xiao-Li Yang. 2019. "In Situ Nutrient Removal from Rural Runoff by A New Type Aerobic/Anaerobic/Aerobic Water Spinach Wetlands" Water 11, no. 5: 1100. https://doi.org/10.3390/w11051100
Note that from the first issue of 2016, this journal uses article numbers instead of page numbers. See further details here.