Article

Optimization of Horseradish Peroxidase Catalytic Degradation for 2-Methyl-6-Ethylaniline Removal Using Response Surface Methodology

1
School of Environment and Resource, Southwest University of Science and Technology, Mianyang 621010, China
2
Tianfu College of Southwestern University of Finance and Economics, Mianyang 621000, China
*
Authors to whom correspondence should be addressed.
Water 2019, 11(5), 1093; https://doi.org/10.3390/w11051093
Submission received: 8 May 2019 / Revised: 21 May 2019 / Accepted: 22 May 2019 / Published: 24 May 2019
(This article belongs to the Section Wastewater Treatment and Reuse)

Abstract

:
For optimizing the reaction conditions of 2-methyl-6-ethylaniline (MEA) degradation catalyzed by horseradish peroxidase (HRP), a response surface methodology with three factors and three levels was used in this research to establish a regression model, a ternary quadratic polynomial, in order to analyze temperature, H2O2 concentration and pH effects on MEA removal efficiency. The results showed that the regression model was significant (p < 0.0001), fitted well with experimental data and had a high degree of reliability and accuracy, and the data were reasonable with low errors. By analyzing interactions and solving the regression model, the maximum MEA removal efficiency was 97.90%, and the optimal conditions were defined as follows: pH 5.02, H2O2 concentration 13.41mM, and temperature 30.95 °C. Under the optimal conditions, the average MEA removal efficiency obtained from the experiments was 97.56%. This research can provide reference for the treatment of actual acetochlor industrial wastewater.

1. Introduction

Acetochlor is a kind of systemic chloroacetamide herbicide, which has been widely used as the pesticides for control of some annual broadleaf and grass weeds in China [1]. Acetochlor industrial wastewater contains large amounts of highly toxic organic pollutants and heavy metals [2,3,4]. 2-methyl-6-ethylaniline (MEA) which belongs to the aniline compounds is the main metabolite of acetochlor in the wastewater [5]. On account of their high toxicity, persistence and bioaccumulation, aniline compounds are one of the priority pollutants listed by the United States Environmental Protection Agency (US EPA) [6]. Conventional removal methods of aniline compounds from wastewaters are mainly physical, chemical and biological methods. Through adsorption and desorption experiments, Tao et al. [7] found 13X molecular sieves synthesized from natural rock suitable for the purification of aniline-bearing wastewater. At pH 3.0, 40 °C and constant current 20 A, Brillas and Casado [8] found that degradation efficiency of the soluble total organic carbon gradually reached 61% after 2 h by the electro-Fenton process for aniline wastewater treatment in a flow reactor. Bacteria BA1, BA2 and BA3 were isolated from an aniline wastewater treatment reactor by Wang et al [9], and the removal efficiency of soluble COD in aniline wastewater reached 81% using the optimal combination of these three bacteria in the experimental process. These methods proved to be feasible and available, but they suffer from such shortcomings as low removal efficiency, high treatment cost, and secondary contamination. Thus, harmless treatment of aniline compounds in wastewater is urgent.
In fact, the use of natural enzymes in aniline compounds treatment has been proposed by many researchers [10,11,12]. Horseradish peroxidase (HRP) is a heme-containing enzyme that can catalyze the oxidation of certain organic pollutant molecules using hydrogen peroxide [13]. Most oxidation reactions catalyzed by HRP can be described [14] by the following reaction equations, Equations (1)–(3). In the equations, AH2 and AH· represent a kind of reducing substrate and its free radical product, respectively. E is the original enzyme (i.e., HRP), EI and EII are its intermediates.
E + H 2 O 2 E I + H 2 O
E I + A H 2 E I I + A H
E I I + A H 2 E + A H + H 2 O
In addition, certain indirectly degraded pollutants (e.g., polychlorinated biphenyls and metolachlor) could be adsorbed by the polymers of peroxidase catalytic reaction [15]. HRP is suitable for the treatment of refractory organic pollutants due to its extensive applicability [16], high catalytic activity [17] and mild reactive condition [18]. In order to maximize the removal efficiency of pollutants, how to optimize the reaction conditions needs to be explored in depth.
The traditional single-factor optimization tests one variable while keeping all other influence factors constant. When faced with systems of multi-variables, this method is cumbersome and time-consuming, or even leads to the drawing of wrong conclusions [19]. Response surface methodology (RSM) is a useful statistical tool. It can be used to optimize the response through analyzing and evaluating the effects of multiple variables and their interactions [20]. Based on experimental design and mathematical modeling, RSM establishes a regression equation for fitting function relation between influence factors and experimental result [21]. With this method, fewer experiments could provide sufficient information on the effects of variables [22]. This study was focused on the HRP catalyzed oxidative process of MEA removal. RSM was used to optimize three variables (temperature, pH and concentration of H2O2). The final objective was to discuss the possibility of HRP catalytic degradation for MEA, and to maximize the removal efficiency of MEA.

2. Materials and Methods

2.1. Experimental Materials

HRP (EC—Enzyme Commission 1.11.1.7) and catalase (EC 1.11.1.6) were purchased from Merck KGaA (Darmstadt, Germany). MEA was purchased from Ruize (Dalian, China). Acetonitrile (High performance liquid chromatography, HPLC grade) was purchased from Tedia (Fairfield, CA, USA). All other chemicals (e.g., hydrochloric acid, citric acid, potassium dihydrogen phosphate, and sodium hydroxide) purchased from Kemiou Chemical Reagent (Tianjin, China) were analytically pure.

2.2. Experimental Procedure

In order to resist the pH variety produced by the change of reaction solution quantity, various pH buffer solutions (200 mM phosphate buffer) were prepared at different temperatures. MEA was added into the buffer solutions for the preparation of 3.5 mM simulated water sample [23]. The centrifuge tube containing simulated water sample and a predetermined amount of HRP was preheated in a temperature-controlled incubator, shaking at 200 rpm. The reaction was initiated by addition of H2O2 whose concentration was changing in experiments, and inhibited by adding catalase after 6 h.

2.3. Analysis Methods

After being filtered by 0.22 μm aperture micropore film, the residual MEA of reaction solutions was detected through HPLC (Agilent 1100), containing a diode array ultraviolet detector and a reversed phase chromatographic column (YWG C-18, 4.6 × 250 mm, Dalian Elite Analytical Instruments Co., Ltd., Dalian, China). The mobile phase was composed of acetonitrile and water with volume fraction of 65/35, flow rate at 1.0 mL/min. The MEA with detective wavelength of 220 nm was eluted at 9.8 min. MEA removal efficiency was determined using Equation (4).
MEA removal efficiency   ( % ) = C i C f C i × 100
In this equation, Ci and Cf represent the initial and final concentrations of MEA, respectively.

2.4. Experimental Design and Optimization Method

Central composite design (CCD), a frequently used design of RSM, can be applied to the optimization of reaction conditions. Appropriate axial points in CCD can ensure the rotation and sequentiality of the experiments [24]. For a three-factor CCD, extreme values of axial points are ±1.68 ( ± 2 3 / 4 ). The levels of three experimental variables (pH, temperature and concentration of H2O2) are presented in Table 1.
A three factor-three level CCD included 6 axial points, 6 center points and 8 star points, 20 runs in total. The data obtained from the CCD experiments were calculated by the software Design Expert 8.0.6 (Stat-Ease), and the response of MEA removal efficiency to three experimental variables was fitted to the general model a second order polynomial as Equation (5) below.
Y = B 0 + i = 1 n B i X i + i = 1 n B i i X i 2 + 1 i < j n n B i j X i X j
In this equation, Y is the dependent variable (i.e., the MEA removal rate), Xi the ith independent variable (temperature, pH or H2O2 concentration), B0 constant terms, Bi the linear coefficient, Bii the coefficient of square term, and Bij the interaction coefficient.
Via variance analysis, the fitting quality of the polynomial quadratic equation model was assessed by different criteria, such as F value, P value and R2. The F value and the P value determined significances of the model and the quadratic equations items. The larger the F value while the smaller the P value, the more significant the terms accordingly. The model-fitting effect was evaluated by the coefficient of determination R2 that the closer its value to 1, the higher model fitting degree. Combining with the analysis of contour plots of the response surface, the regression equation was solved and the optimal values of investigated variables were determined.

3. Results and Discussion
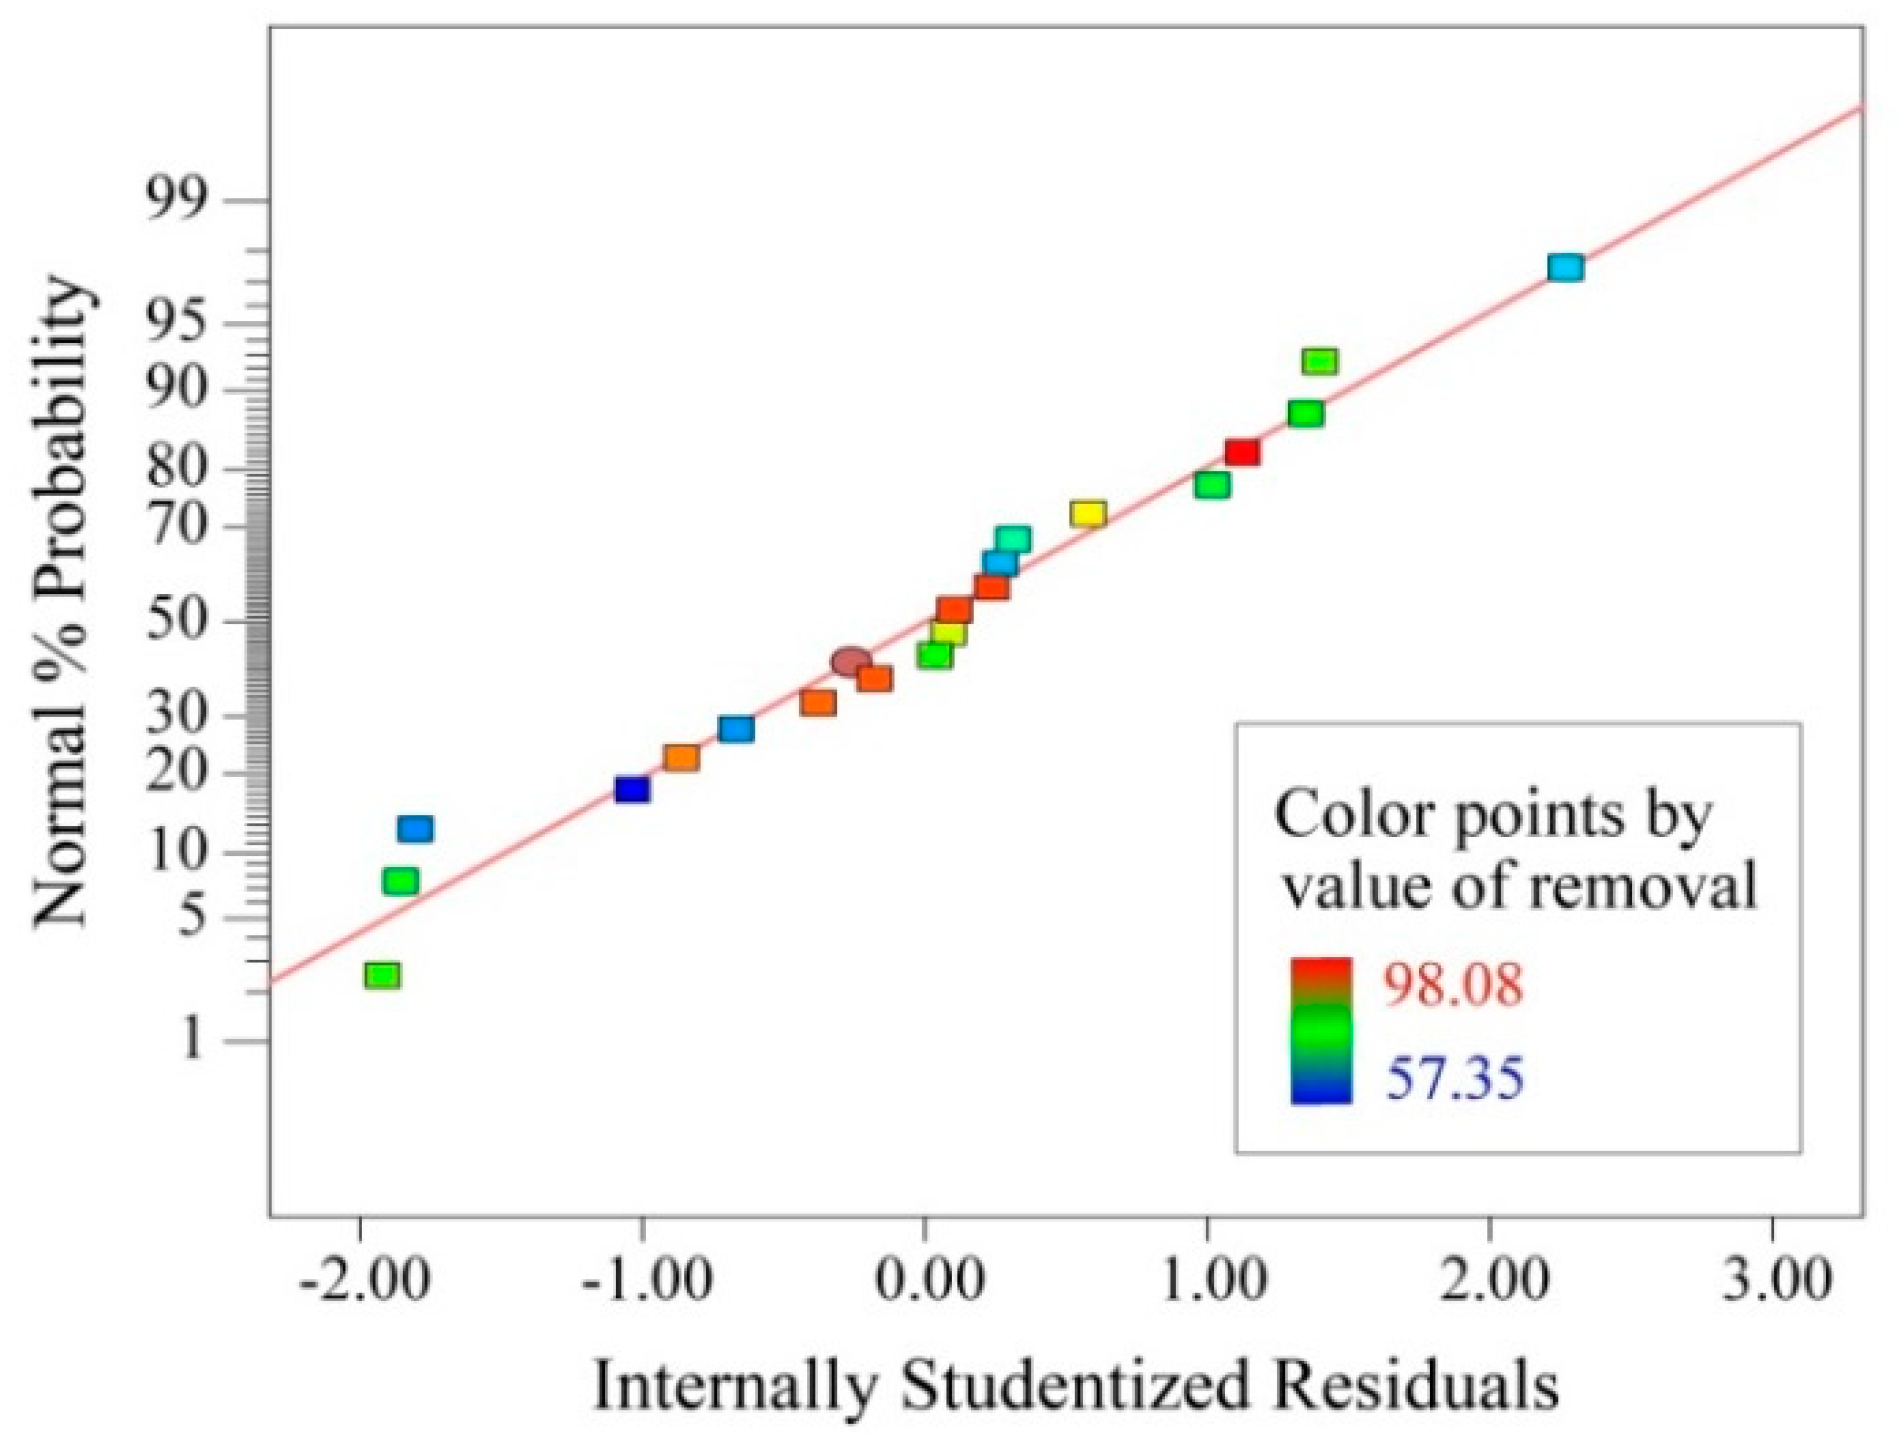
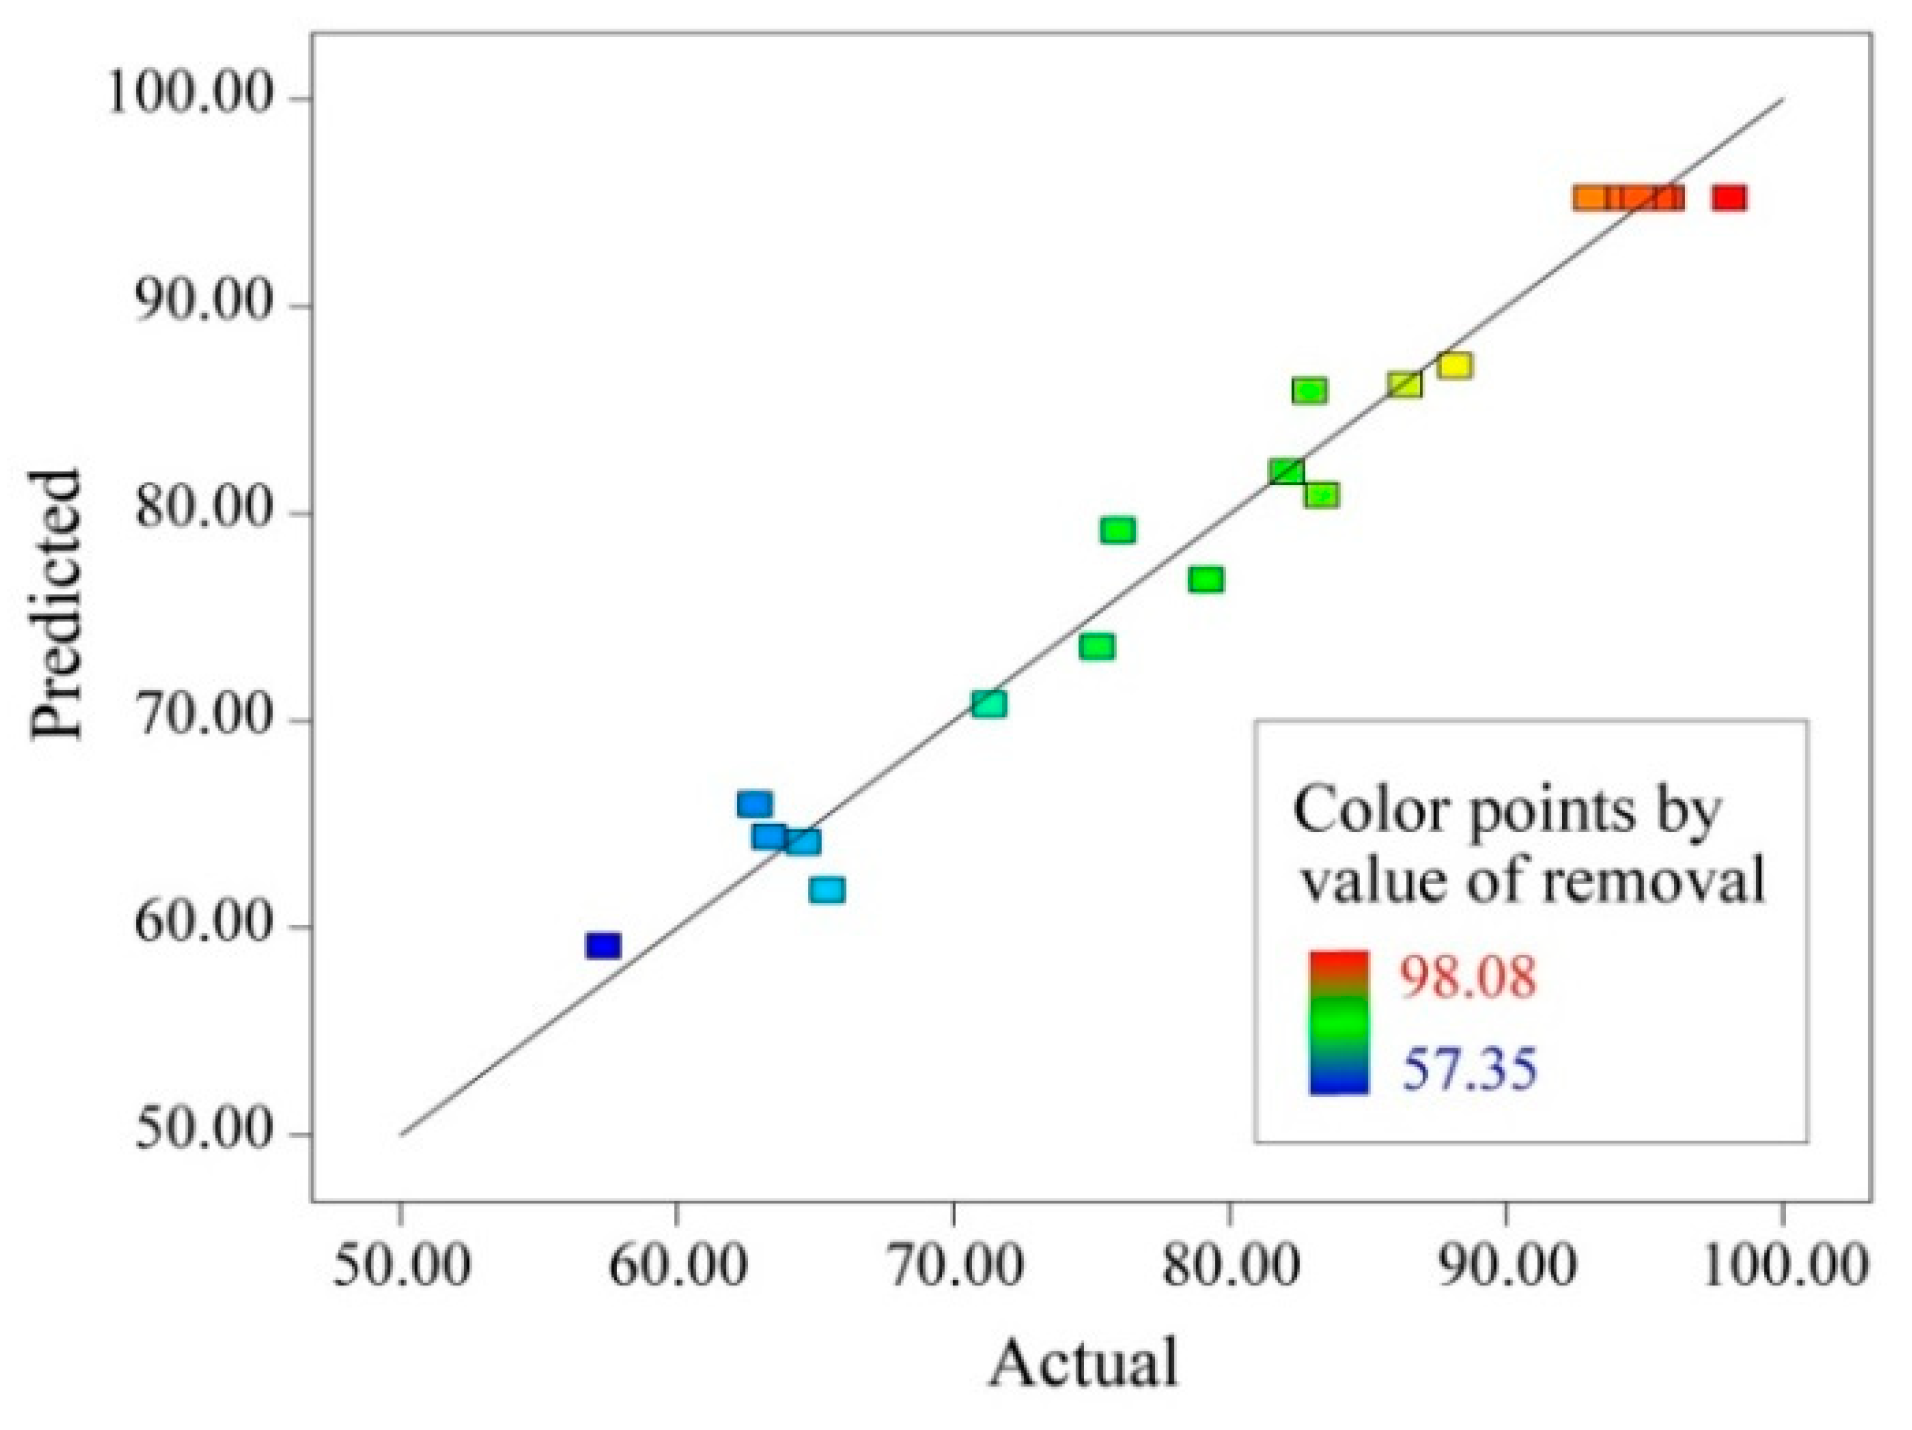
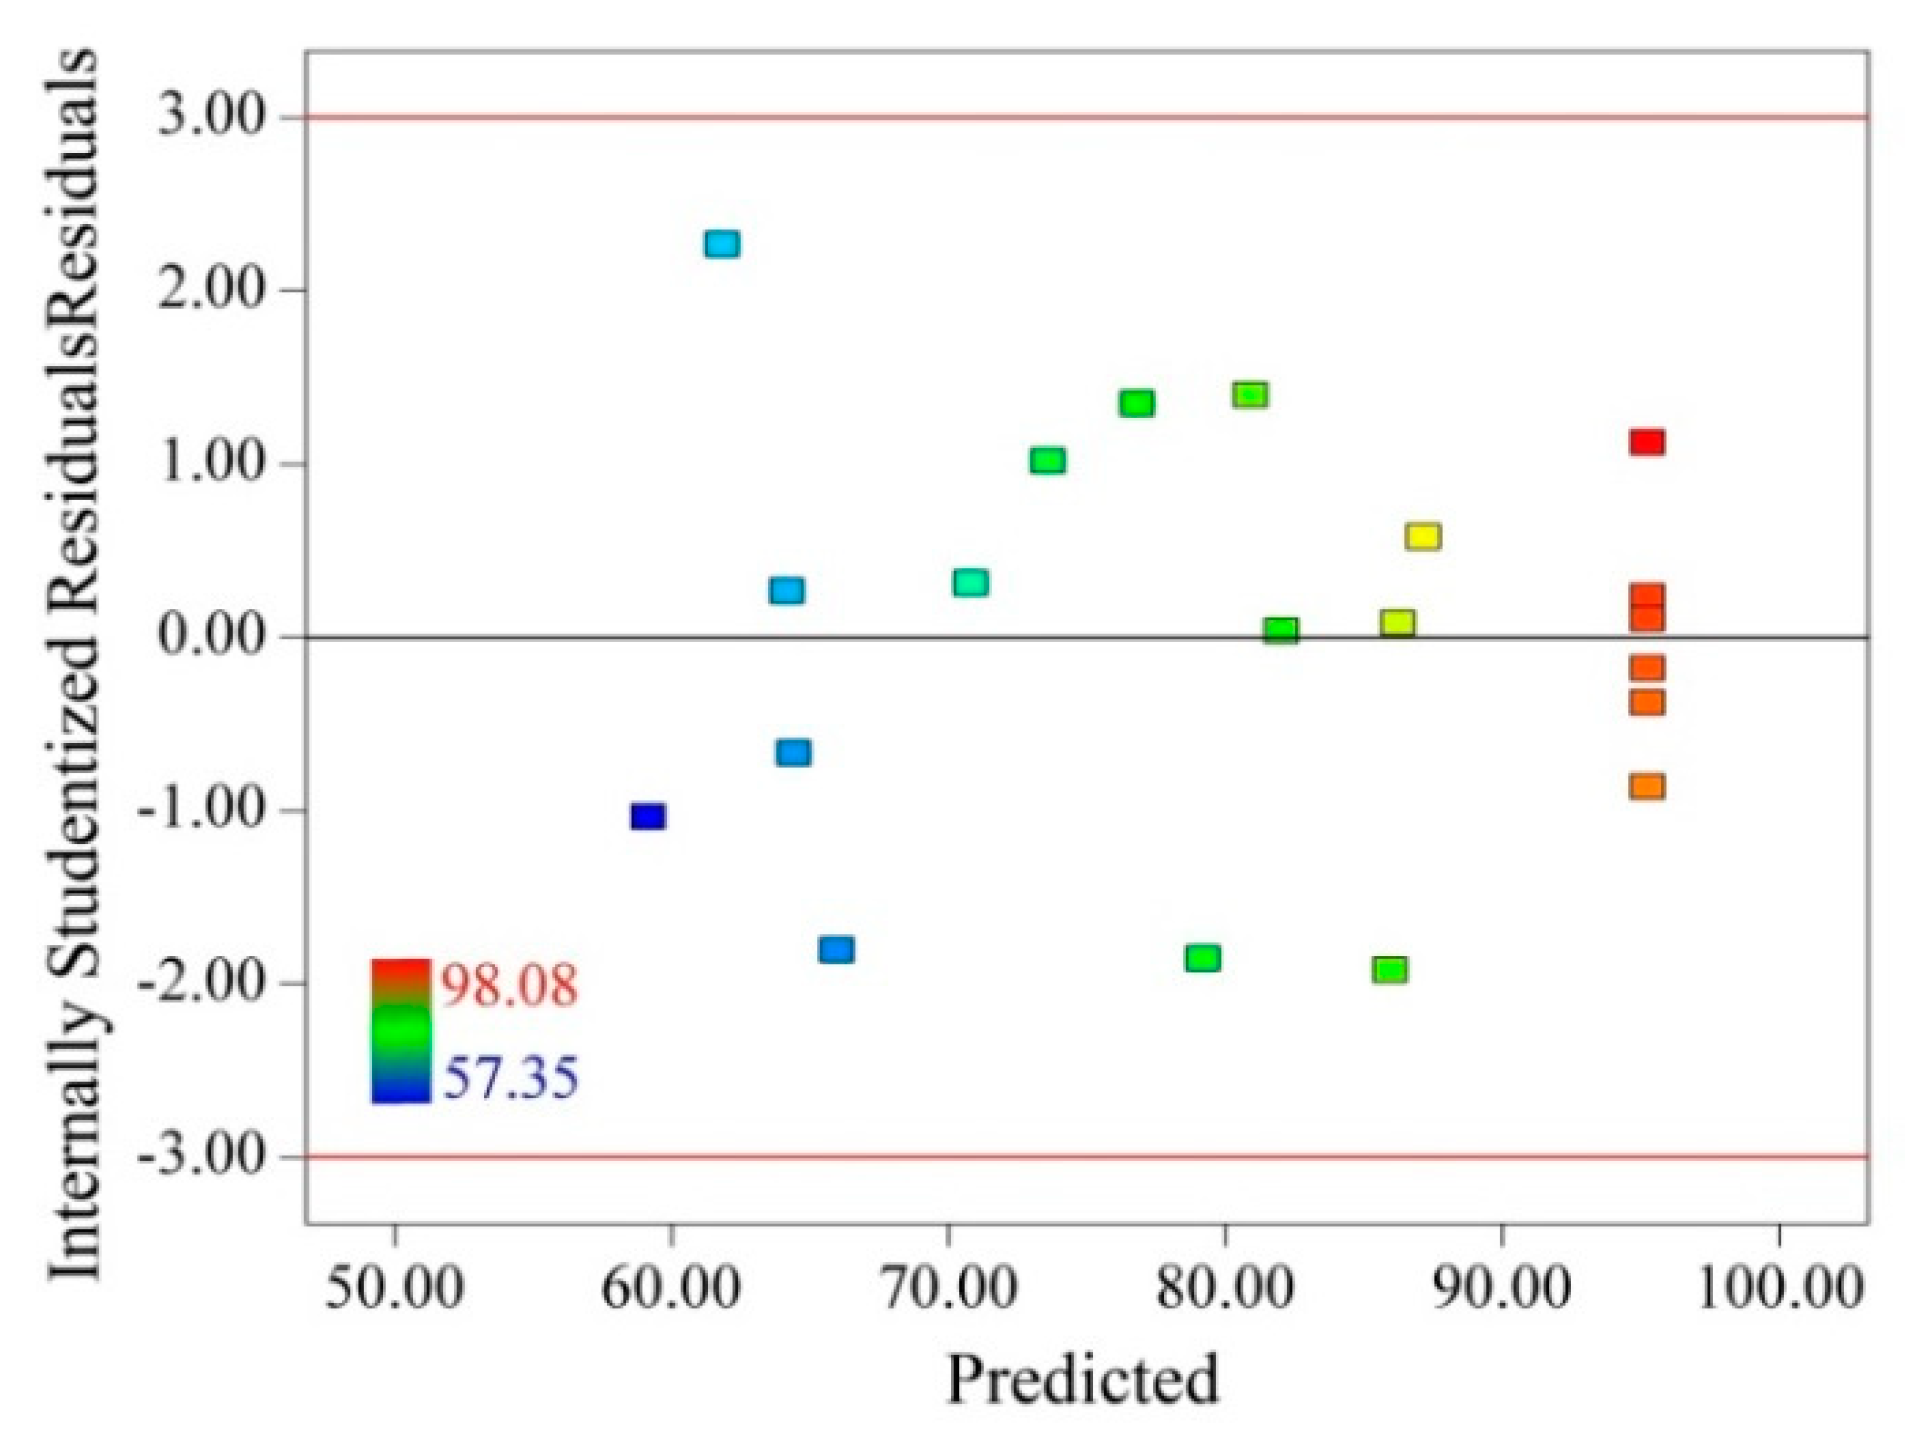
3.1. Model Fitting

Experiments were carried out to evaluate the effects of condition variables on the removal rate. It was based on the CCD design and repeated three times at each point. The CCD experimental schemes and results of removal efficiency were noted down. As shown in Table 2, the removal efficiency of MEA in the CCD experiments varied from 57.35% to 98.08%, and the average removal efficiency of MEA was 80.48% in different reaction conditions. Removal efficiency higher than 90% was only observed in center runs, which indicated that the CCD-based experimental schemes were reasonable.
The polynomial quadratic equation model for the removal efficiency of MEA was deduced through the Design-Expert software (Ver. 8.0.6, Stat-Ease, Minneapolis, MN, USA). The coefficients of the equation were calculated by the least squares method. After insignificant terms were excluded, the second order polynomial was presented in terms of the coded values for the removal efficiency of MEA. The results indicated that the polynomial quadratic model provided the best fit, and the ultimate equation was as Equation (6) below.
Y% = −350.07 + 20.41X1 + 47.60X2 + 1.89X3 − 0.14X1·X2 + 0.09X1·X3 + 0.24 X2·X3 − 0.34X12
4.62X22 − 0.21X32
where Y% is the removal efficiency of MEA, X1, X2 and X3 were the temperature, pH and concentration of H2O2, respectively.
The response results of the removal efficiency of MEA were indicated through variance analysis, as shown in Table 3. From the whole model, lack of fit was not insignificant (P > 0.05) with the extremely low P value (<0.0001), and the corresponding F value being 45.02. All of these suggested that the model fitting was valid. The R2 (coefficient of determination) was 0.9759, which indicated that 97.59% of the variations in the response could be explained by the fitting model within the variable ranges. The CV (coefficient of variation) of the repeated experiments was 3.44%, within the acceptable range of 10%, which showed that the experiments data had good reliability [25]. Adeq precision, the signal to noise ratio of the experiments, was 18.419 (greater than 4), which indicated that the model had enough signal intensity in response to the design [26]. In the model, p value of pH was less than 0.05, which indicated that pH was a significant factor of MEA removal. In the binomial, temperature, H2O2 concentration and pH were a significant factor of MEA removal. In the interaction terms, all the p value great than 0.05, which indicated that the interaction between temperature and pH, temperature and H2O2 concentration, and pH and H2O2 concentration was not obvious.
The assumption of normality, the predicted removal efficiencies versus the actual ones, and the predicted responses versus the residual ones were listed in in Figure 1, Figure 2 and Figure 3. As shown in Figure 1, the residuals were, in satisfying nearly linear distribution, suggesting that the errors were in bell-shaped normal distribution. As evident from the removal efficiencies of MEA in Figure 2, the data points were in distribution along diagonal lines, which implied that the predicted values of the model tallied with the actual experimental results. The points are in random distribution in Figure 3, which indicates that residuals did not contain any predictable information, and the neighboring residuals were not correlated. These illustrated that the polynomial quadratic model, with sufficient recommendations, was valid and the fitting of the equation was successful [27].
The perturbation plot for the removal efficiency of MEA in different temperature, pH and H2O2 concentrations is shown in Figure 4. The resulting plot illustrated the effect of temperature, pH and H2O2 concentration at central type in CCD (temperature 32 °C, H2O2 concentration 13 mM, pH 4.3 for 6 h). The effect of independent variable on the removal efficiency of MEA was in the order pH > temperature > H2O2 concentration. A relatively small change of the pH greatly impacted the removal efficiency of MEA. By contrast, the variety of the H2O2 concentrations could not lead a notable influence on the MEA removal efficiency. The influence of temperature, a modest factor, was neither too big nor too small.

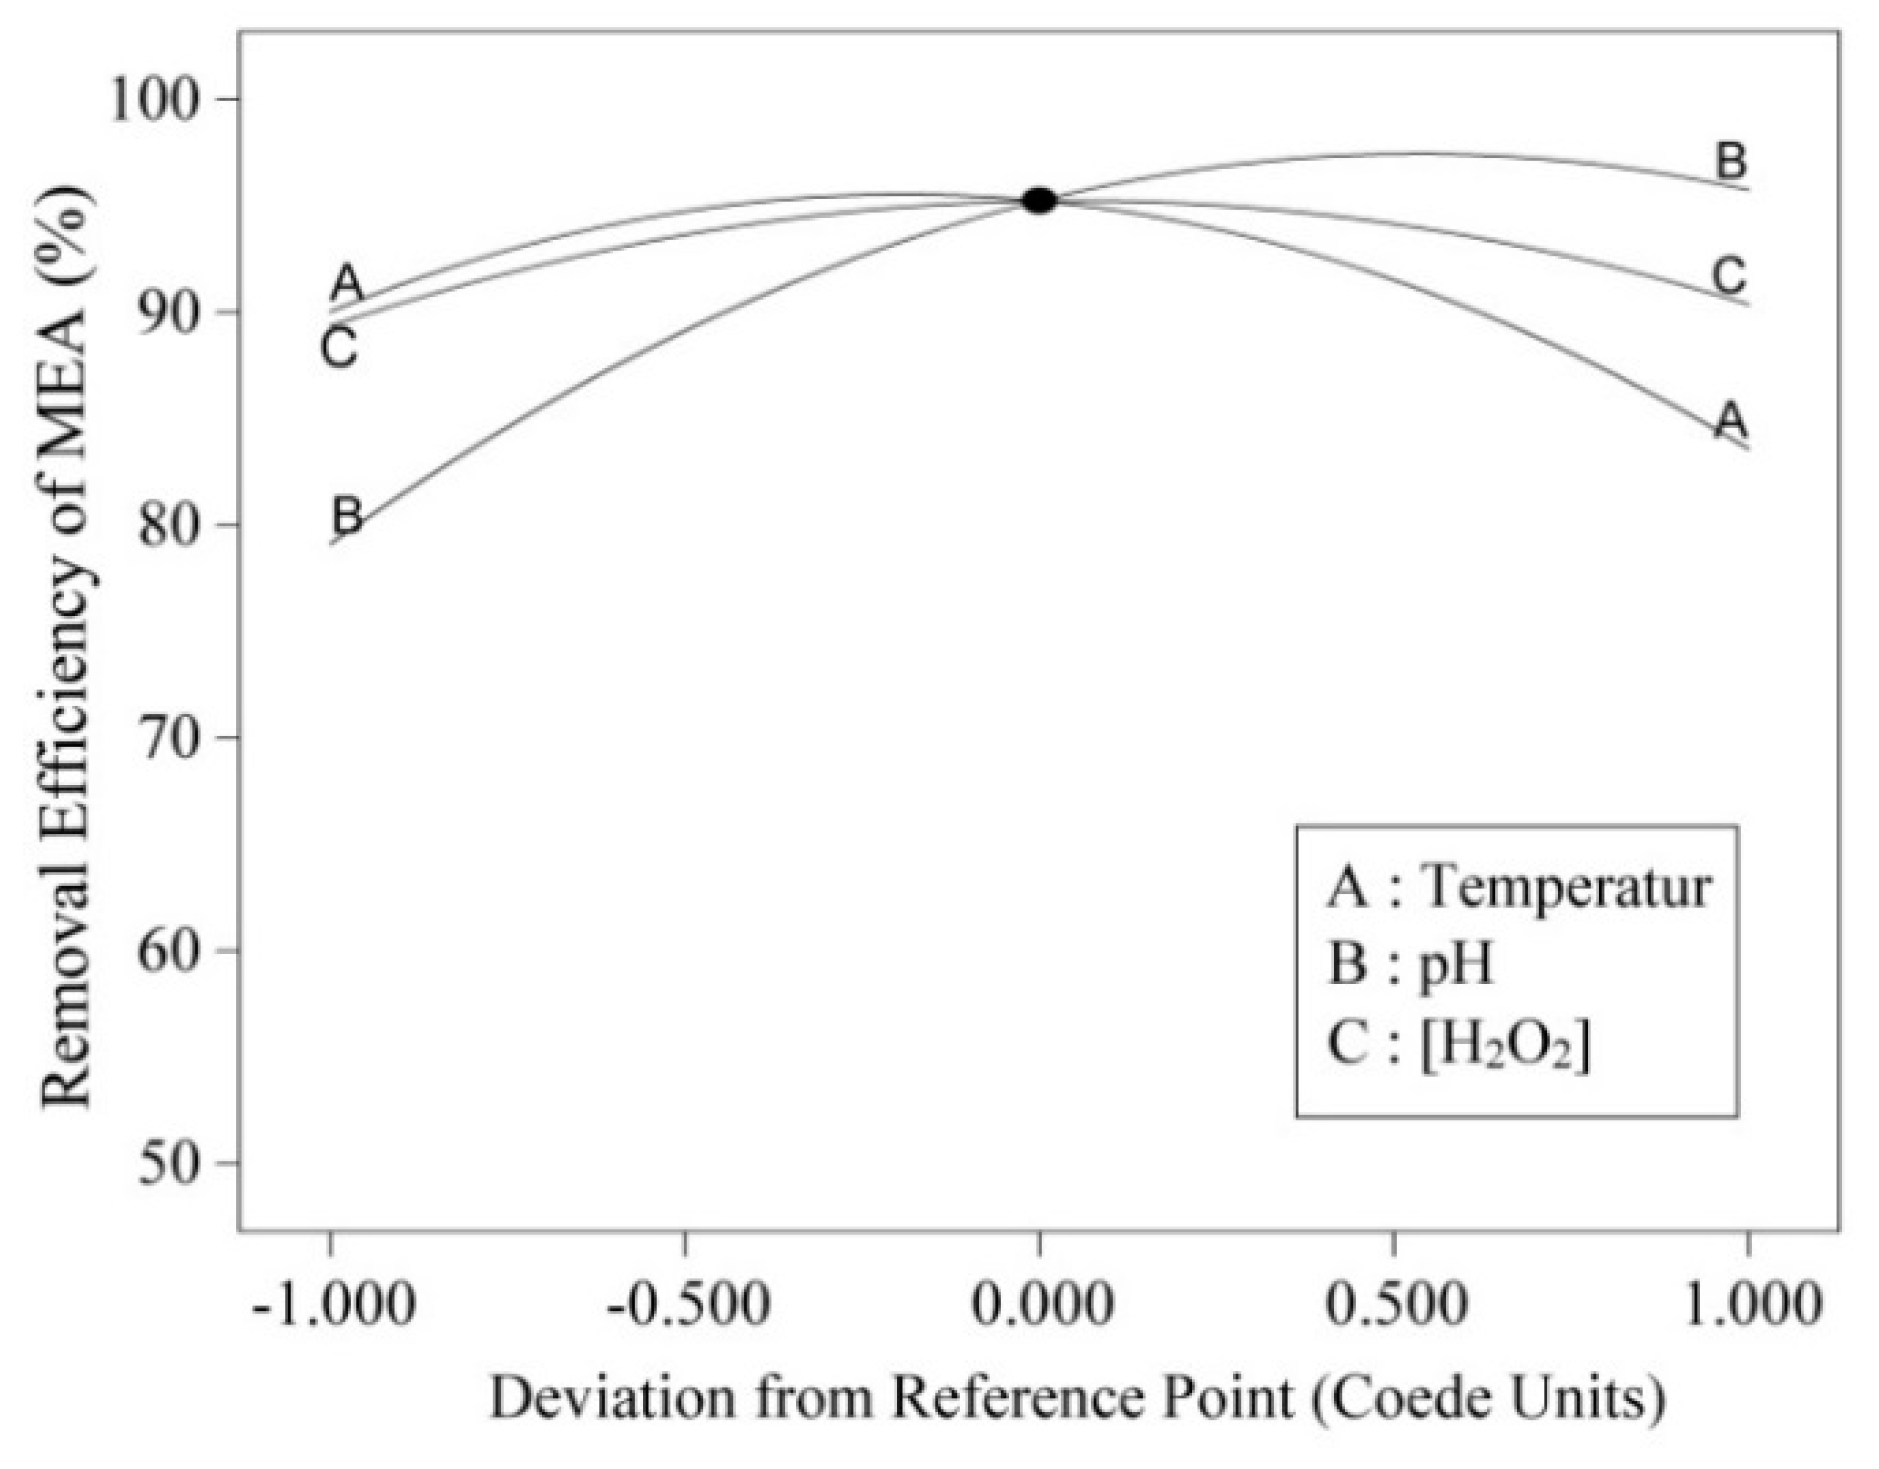
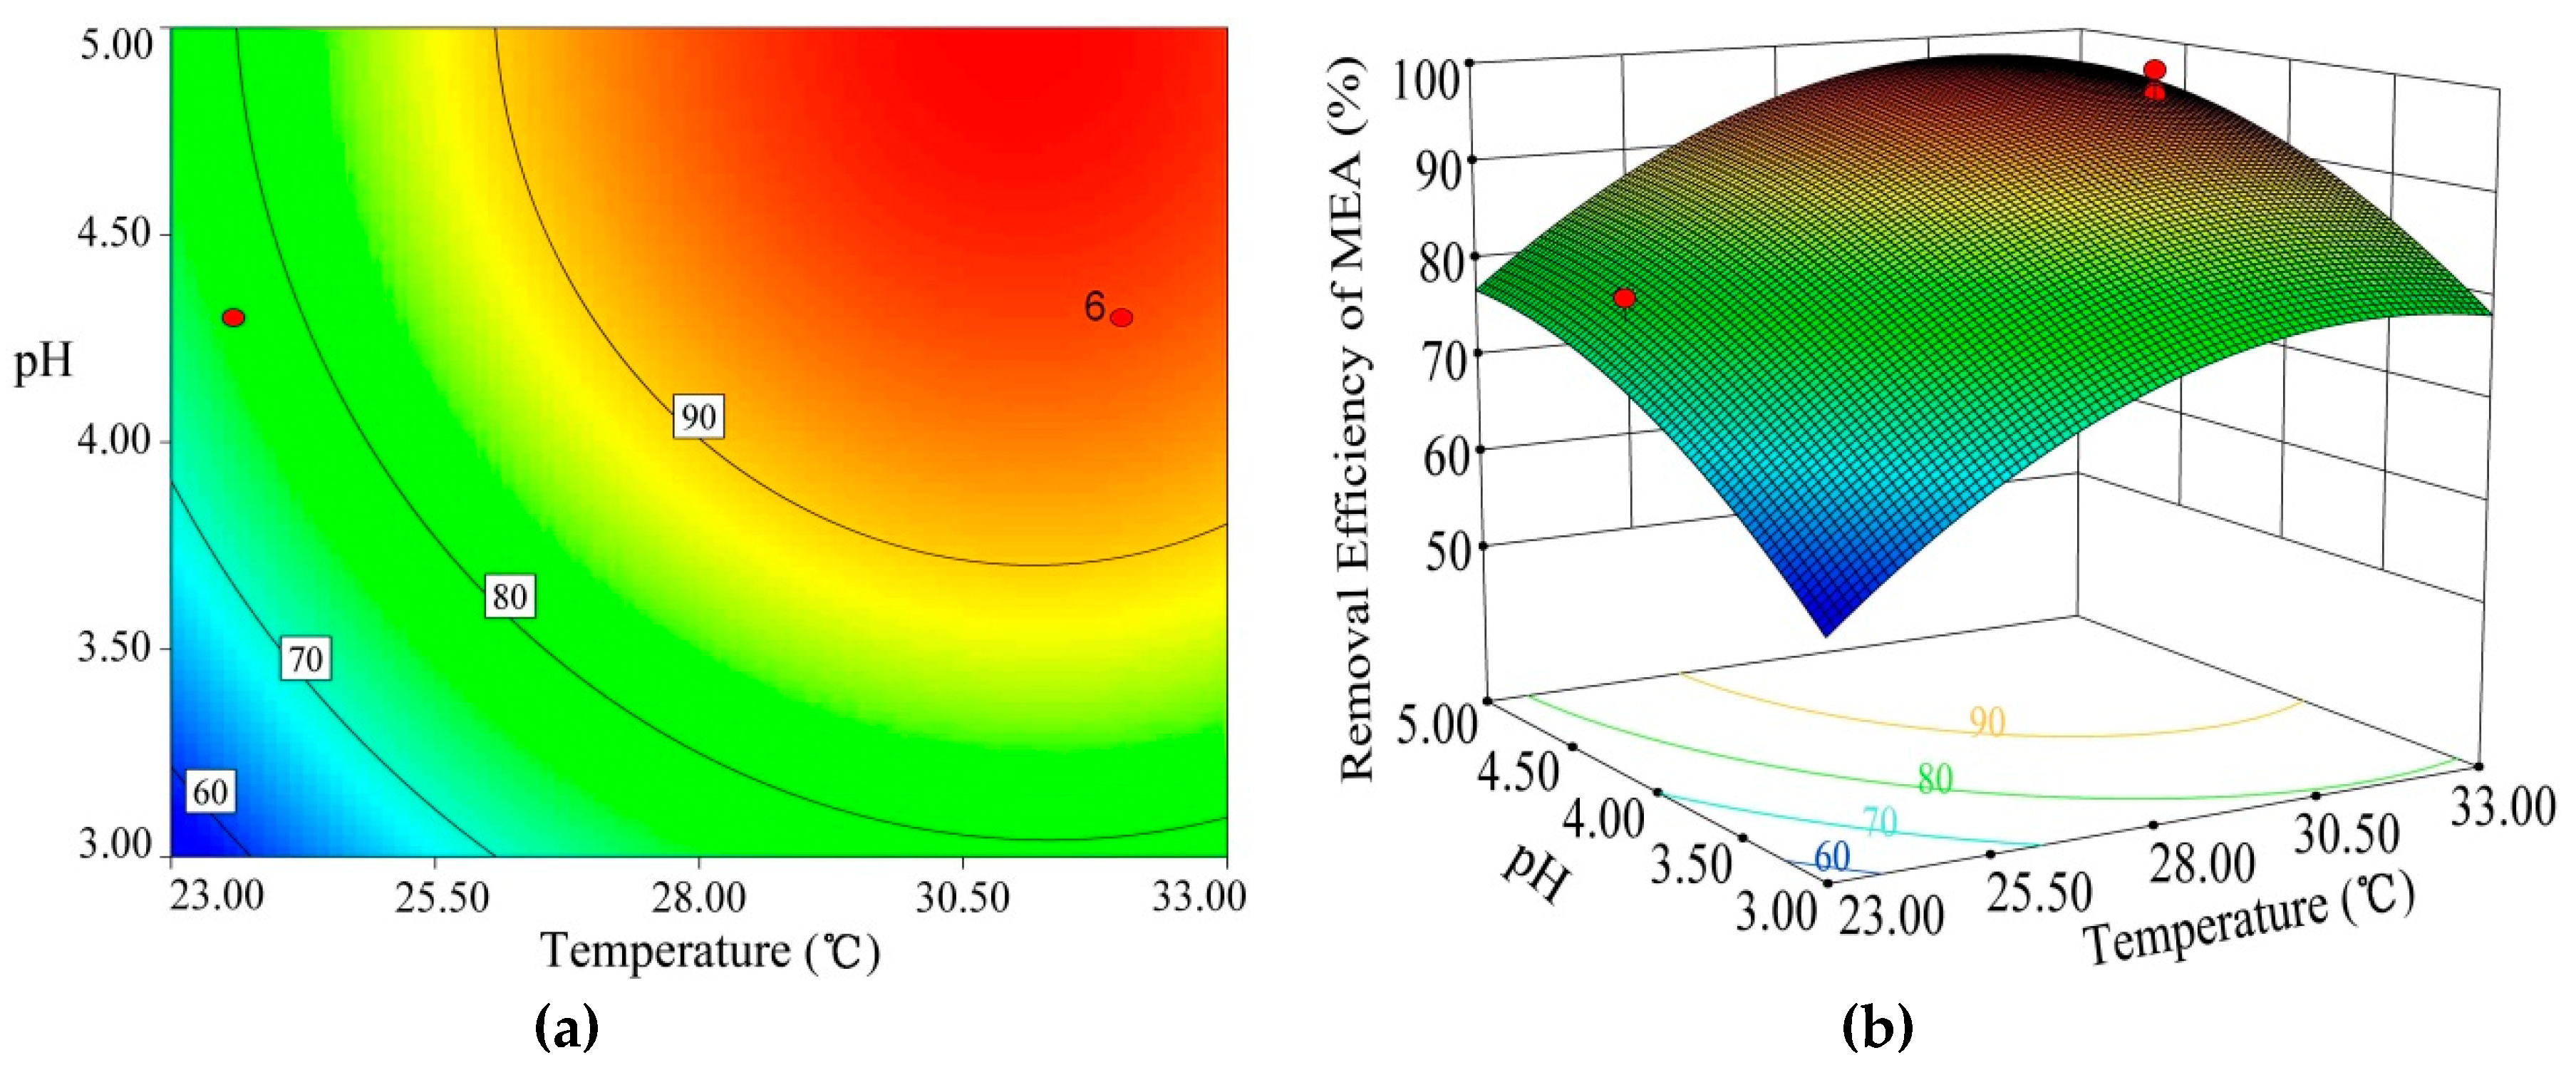
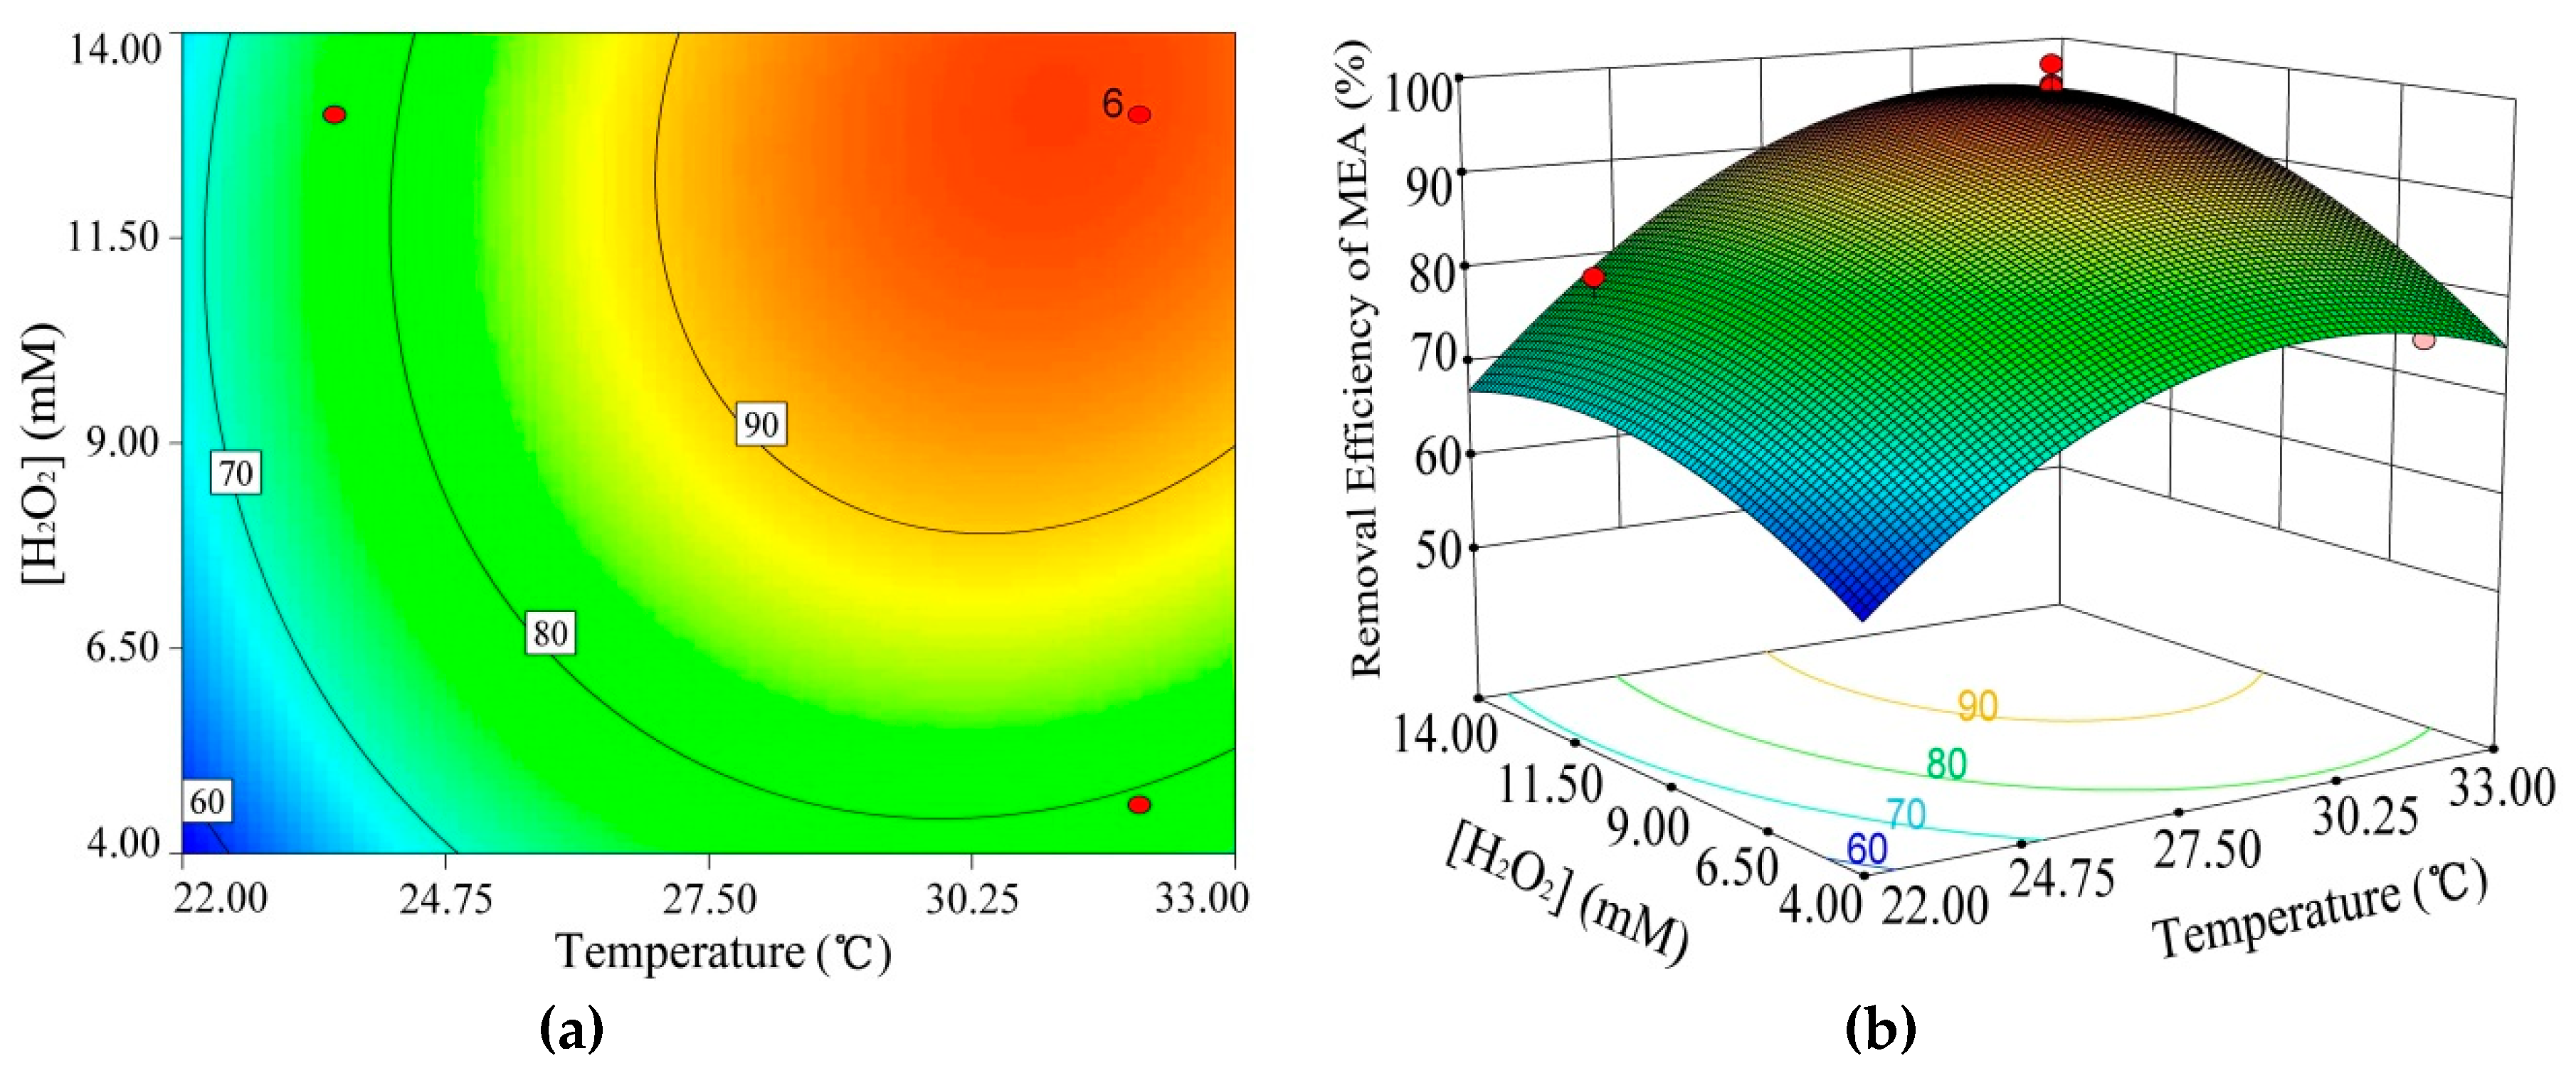
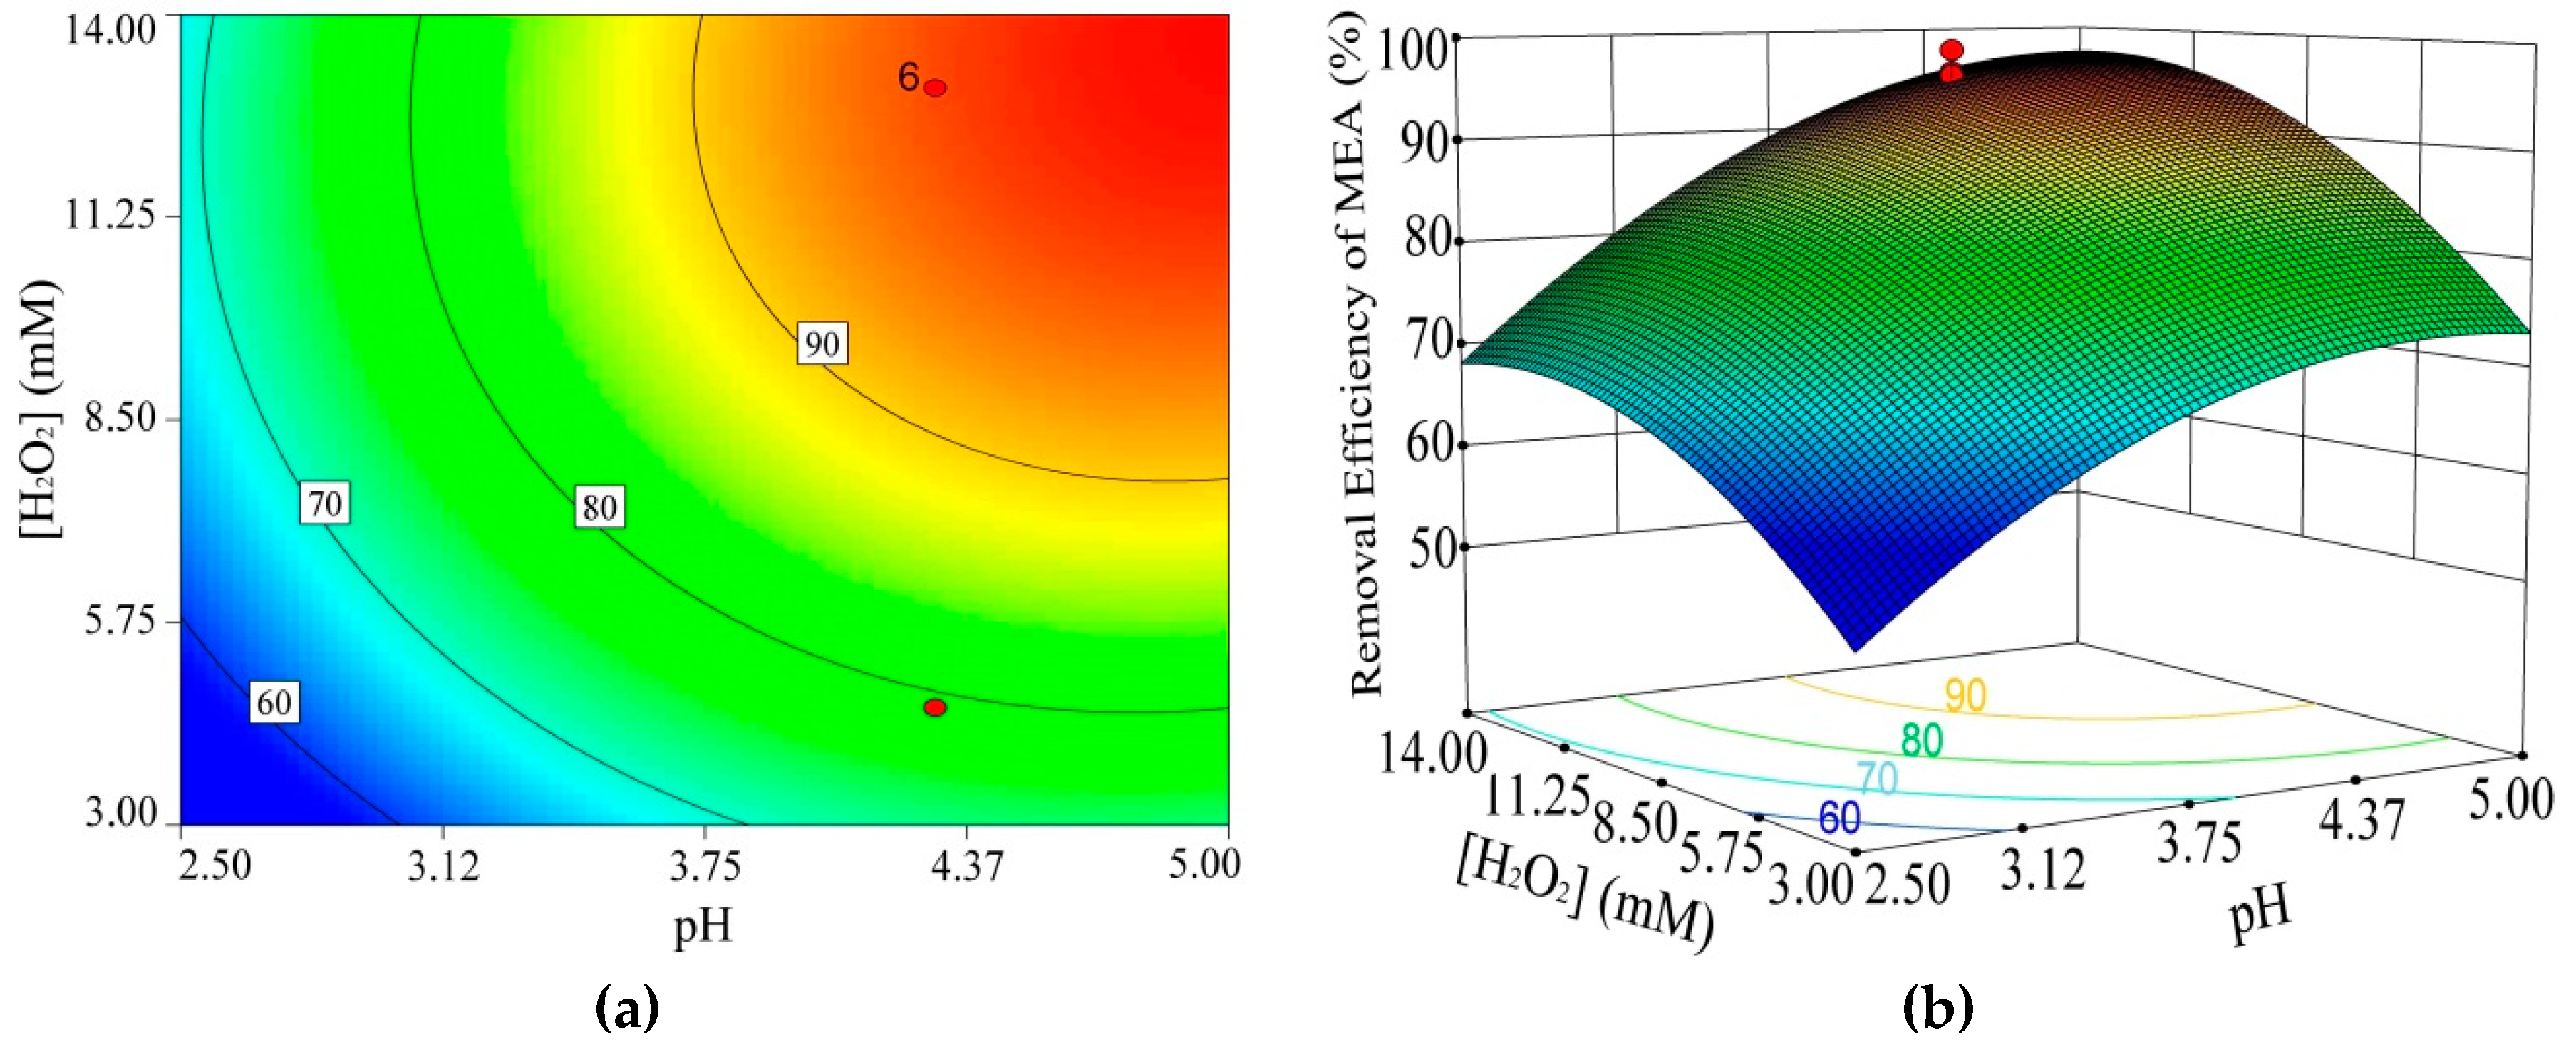
3.2. Influence Factor of 2-Methyl-6-Ethylaniline (MEA) Removal Efficiency

For the sake of an intuitive sense on the interactions among temperature, pH and H2O2 concentration, the three-dimensional plots of these factors were drawn for two variables at a time, keeping the third factor unchanged (at center level). The combined effects of the pH and the temperature on the removal efficiency of MEA are shown in Figure 5. We could see that the removal efficiency of MEA slowly increased at a high level given a high pH, as temperature increased. Similarly, at a high given temperature, with the increase of the pH, the removal efficiency of MEA increased slowly at a high level.
The joint effects of the H2O2 concentration and temperature on the removal efficiency of MEA were shown in Figure 6. It could be seen that the removal efficiency of MEA slowly increased at a high level given a high H2O2 concentration, as temperature increased. Similarly, at a high given temperature, with the increase of the H2O2 concentration, the removal efficiency of MEA increased slowly at a high level.
The combined effects of the pH and the H2O2 concentration on the removal efficiency of MEA are shown in Figure 7. We can see that the removal efficiency of MEA slowly increased at a high level given a high H2O2 concentration, as pH increased. Similarly, at a high given pH, with the increase of the H2O2 concentration, the removal efficiency of MEA increased slowly at a high level.
As shown in Table 4, by solving the extremum of the ternary quadratic polynomial model, the maximum MEA removal efficiency was 97.90%, and the optimal conditions were defined as follows: pH 5.02, H2O2 concentration 13.41 mM, and temperature 30.95 °C. Under the optimal conditions, the average MEA removal efficiency obtained from the experiments was 97.56%. HRP catalytic degradation for MEA removal is the typical enzyme-catalyzed reaction, and the enzyme activity and stability are important factors affecting removal efficiency [28]. In the research on the removal of pentachlor ophenol, Ye et al. [29] suggested that the optimal pH for HRP was 5–6. Studying the inactivation and catalytic pathways of horseradish peroxidase with m-chloroperoxybenzoic acid, Rodriguez-Lopez et al. [30] found that horseradish peroxidase lost its activity in too acid or alkaline conditions. Arnao et al. [31] proposed the two competitive (catalytic and inactivating) routes reaction mechanism in research on the inactivation of peroxidase by hydrogen peroxide. An over-high H2O2 concentration inhibited the activity of HRP. Unlike pH and H2O2 concentration, the inactivation was mainly caused by HRP denaturation under a high-temperature condition [32]. This was in good agreement with the experimental study on dyestuff degradation catalyzed by HRP [33].

4. Conclusions

In this research for optimizing the reaction conditions of MEA degradation catalyzed by HRP, RSM was used to analyze temperature, H2O2 concentration and pH effects on MEA removal efficiency. Some conclusions can be drawn as follows:
(1)
A regression model for the removal efficiency of MEA, the ternary quadratic polynomial, was established. The variance analysis showed that the regression model was significant (p < 0.0001), fitted well with experimental data and had a high degree of reliability and accuracy, and the data were reasonable with low errors.
(2)
By analyzing interactions and solving the regression model, the maximum MEA removal efficiency was 97.90%, and the optimal conditions were defined as follows: pH 5.02, H2O2 concentration 13.41 mM, and temperature of 30.95 °C. Under the optimal conditions, the average MEA removal efficiency obtained from the experiments was 97.56%.
The results can provide a reference for the treatment of acetochlor industrial wastewater, and the stabilization and reutilization of HRP in the process of the pollutant’s degradation are worth further study.

Author Contributions

S.S. and Q.W. designed and directed the experiments; S.S., L.C. and L.M. conducted the experiments; S.S. and J.S. processed and analyzed the data; S.S. and Q.W. wrote the paper; J.S. and Y.X. revised and adjusted the paper. All authors have confirmed the final manuscript.

Funding

This study was financially supported by the sub topic of the National Key Technology R&D Program (No. 2015BAC05B05).

Acknowledgments

The authors express our gratitude and respect to the reviewers and the editors for their hard work and valuable suggestions, which improved the academic level of this paper.

Conflicts of Interest

All authors solemnly declare no conflict of interest.

References

  1. Wei, D.; Sun, K.; Han, L. Isolation, identification and analysis of degradation dharacteristics of acetochlor-degrading strain B-2. Genomics and Appl. Biol. 2016, 35, 3069–3075. [Google Scholar]
  2. Feng, Q.; Wen, S.; Bai, X.; Chang, W.; Cui, C.; Zhao, W. Surface modification of smithsonite with ammonia to enhance the formation of sulfidization products and its response to flotation. Miner. Eng. 2019, 137, 1–9. [Google Scholar] [CrossRef]
  3. Feng, Q.; Wen, S.; Deng, J.; Zhao, W. Combined DFT and XPS investigation of enhanced adsorption of sulfide species onto cerussite by surface modification with chloride. Appl. Surf. Sci. 2017, 425, 8–15. [Google Scholar]
  4. Feng, Q.; Zhao, W.; Wen, S. Surface modification of malachite with ethanediamine and its effect on sulfidization flotation. Appl. Surf. Sci. 2018, 436, 823–831. [Google Scholar] [CrossRef]
  5. Zhang, J.; Zheng, J.; Liang, B.; Wang, C.; Cai, S.; Ni, Y.; He, J.; Li, S. Biodegradation of Chloroacetamide Herbicides by Paracoccus sp. FLY-8 in Vitro. J. Agric. Food Chem. 2011, 59, 4614–4621. [Google Scholar] [CrossRef] [PubMed]
  6. Keith, L.H.; Telliard, W.A. Priority pollutants: I. A perspective view. Enviro. Sci. Technol. 1979, 13, 416–423. [Google Scholar] [CrossRef]
  7. Tao, H.; Zhou, S.; Gao, T. Experimental research on treatment of aniline-bearing wastewater using 13X molecular sieves. Acta Scientiae Circumstantiae 2002, 22, 408–411. [Google Scholar]
  8. Enric, B.; Juan, C. Aniline degradation by Electro-Fenton and peroxi-coagulation processes using a flow reactor for wastewater treatment. Chemosphere 2002, 47, 241–248. [Google Scholar]
  9. Wang, X. New progress in the treatment of aniline wastewater. Ind. Water Treat. 2010, 30, 11–14. [Google Scholar]
  10. Giardina, P.; Faraco, V.; Pezzella, C.; Piscitelli, A.; Vanhulle, S.; Sannia, G. Laccases: A never-ending story. Cell. Mol. Life Sci. 2010, 67, 369–385. [Google Scholar] [CrossRef]
  11. Zhong, P.; Peng, H.; Peng, F.; Cai, Q.; He, M. Kinetic Analysis of Laccase catalyze phenolic and aniline compounds and detecting catechol in wastewater. Environ. Sci. 2010, 31, 2673–2677. [Google Scholar]
  12. Song, W.; Wu, C.; Lin, L.; Ni, J.; Wang, W. Optimization of degradation conditions for degrading bacteria of dianilinodithiophosphoric acid and properties of degrading enzyme. J. Anhui Agric. Sci. 2013, 41, 13486–13488. [Google Scholar]
  13. Veitch, N.C. Horseradish peroxidase: a modern view of a classic enzyme. Phytochemistry 2004, 65, 249–259. [Google Scholar] [CrossRef] [PubMed]
  14. Saidman, S.; Rueda, E.H.; Ferreira, M.L. Activity of free peroxidases, hematin, magnetite-supported peroxidases and magnetite-supported hematin in the aniline elimination from water-UV-vis analysis. Biochem. Eng. J. 2006, 28, 177–186. [Google Scholar] [CrossRef]
  15. Jiang, Y.; Feng, C. The Study on Reaction kinetics based on a new system of the horseradish peroxidase catalyting the oxidation of o-phenylenediamine by H2O2. Spectrosc. Spectral Anal. 2002, 22, 436–440. [Google Scholar]
  16. Yang, D.; Wu, X.; Chang, Y.; Qiu, X.; Tao, J. Horseradish peroxidase catalyzed polymerization of sulfomethylated alkali Lignin. Acta Polym. Sin. 2014, 4, 473–480. [Google Scholar]
  17. Reihmann, M.H.; Ritter, H. Oxidative oligomerization of cyclodextrin-complexed bifunctional phenols catalyzed by horseradish peroxidase in water. Macromol. Chem. Phys. 2000, 201, 798–804. [Google Scholar] [CrossRef]
  18. Zhang, L. Applications of horseradish peroxidase in the phenolic wastewater. J. Shanxi Datong Univ. (Nat. Sci.) 2012, 28, 35–39. [Google Scholar]
  19. Mayer, R.H.; Montgomery, D.C. Response Surface Methodology; Wiley: New York, NY, USA, 2002. [Google Scholar]
  20. Hasan, S.D.M.; Melo, D.N.C.; Filho, R.M. Simulation and response surface analysis for the optimization of a three-phase catalytic slurry reactor. Chem. Eng. Process. 2005, 44, 335–343. [Google Scholar] [CrossRef]
  21. Ma, H.; He, T.; Hong, L.; Wei, D.; Li, J.; Sun, S.; Xu, Z. Optimization of the adsorption of phosphorus by water plant sludge using response surface methodology. Chin. J. Environ. Eng. 2015, 9, 546–552. [Google Scholar]
  22. Ghasempur, S.; Torabi, S.F.; Ranaei-Siadat, S.O.; Jalali-Heravi, M.; Ghaemi, N.; Khajeh, K. Optimization of peroxidase-catalyzed oxidative coupling process for phenol removal from wastewater using response surface methodology. Environ. Sci. Technol. 2007, 41, 7073–7079. [Google Scholar] [CrossRef] [PubMed]
  23. Liu, M.; Wang, T.B.; Shen, X. Market and technical process of acetochlor in China. Chem. Techno-Econ. 2005, 23, 14–16. [Google Scholar]
  24. Jeffwu, C.F.; Michael, H. Experimental Design and Analysis and Parameter Optimization; China Statistics Press: Beijing, China, 2003; pp. 362–365. [Google Scholar]
  25. Bhatti, M.S.; Reddy, A.S.; Thukral, A.K. Electrocoagulation removal of Cr(VI) from simulated wastewater using response surface methodology. J. Hazard. Mater. 2009, 172, 839–846. [Google Scholar] [CrossRef] [PubMed]
  26. Bashir, M.J.K.; Aziz, H.A.; Suffian, Y.M.; Aziz, S.Q.; Mohajeri, S. Stabilized sanitary landfill leachate treatment using anionic resin: treatment optimization by response surface methodology. J. Hazard. Mater. 2010, 182, 115–122. [Google Scholar] [CrossRef]
  27. Zhang, X.R.; Liu, Z.H.; Fan, X.; Lian, X.; Tao, C.Y. Optimization of reaction conditions for the electroleaching of manganese from low-grade pyrolusite. Int. J. Miner. Metall. Mater. 2015, 22, 1121–1130. [Google Scholar] [CrossRef]
  28. Jia, Z.; Wang, C.; Zhang, G. Catalytic degradation of benzaldehyde by horseradish peroxidase. J. Taiyuan Normal Univ. (Nat. Sci.) 2017, 16, 78–81. [Google Scholar]
  29. Ye, P.; Zhang, J.; Chen, S.; Yang, Y.; Wang, W.; Wang, S. Removal of pentachlor ophenol (PCP) by immobilized horseradish peroxidase (HRP). Acta Scientiarum Naturalium Universitatis Pekinensis 2005, 41, 918–925. [Google Scholar]
  30. Rodriguez-Lopez, J.N.; Hernandez-Ruiz, J.; Garcia-Canovas, F.; Thorneley, R.N.; Acosta, M.; Arnao, M.B. The inactivation and catalytic pathways of horseradish peroxidase with m-chloroperoxybenzoic acid: A spectrophotometric and transient kinetic study. J. Biol. Chem. 1997, 272, 5469–5476. [Google Scholar] [CrossRef]
  31. Arnao, M.B.; Acosta, M.; del Rio, J.A.; García-Cánovas, F. Inactivation of peroxidase by hydrogen peroxide and its protection by a reductant agent. Biochim. Biophy. Acta 1990, 1038, 85–89. [Google Scholar] [CrossRef]
  32. Pina, D.G.; Shnyrova, A.V.; Gavilanes, F.; Rodríguez, A.; Leal, F.; Roig, M.G.; Sakharov, I.Y.; Zhadan, G.G.; Villar, E.; Shnyrov, V.L. Thermally induced conformational changes in horseradish peroxidase. Eur. J. Biochem. 2010, 268, 120–126. [Google Scholar] [CrossRef]
  33. Si, Y.; Xu, R.; Li, F.; Xu, Z. Removal of dyestuff from water catalyzed by horseradish peroxidase. Ind. Water Treat. 2015, 35, 40–43. [Google Scholar]
Figure 1. Normal probability of the residuals.
Water 11 01093 g001
Figure 2. The predicted removal efficiencies versus the actual ones.
Water 11 01093 g002
Figure 3. The predicted responses versus the residual ones.
Water 11 01093 g003
Figure 4. Perturbation plot for the removal efficiency of MEA. A: Temperature; B: pH; C: [H2O2] (mM).
Water 11 01093 g004
Figure 5. Response surface plots for the temperature and pH at [H2O2] = 13.00 mM. (a) Contour, (b) 3D surface.
Water 11 01093 g005
Figure 6. Response surface plots for the temperature and [H2O2] at pH = 4.30. (a) Contour, (b) 3D surface.
Water 11 01093 g006
Figure 7. Response surface plots for the t pH and [H2O2] at 32.00 °C. (a) Contour, (b) 3D surface.
Water 11 01093 g007
Table 1. Experimental variables and levels for central composite design (CCD), [H2O2]: H2O2 concentration.
Coded LevelUncoded Level
Temperature (°C)pH[H2O2] (mM)
−1.6823.592.114.59
−127.003.008.00
032.004.3013.00
137.005.6018.00
1.6840.416.4921.41
Table 2. The CCD experimental schemes and results.
RunTypeUncoded LevelRemoval Efficiency of MEA (%)
Temperature (°C) X1pH X2[H2O2] (mM) X3
1Star27.003.008.0071.30
2Star37.003.008.0064.35
3Star27.005.608.0086.35
4Star37.005.608.0075.21
5Star27.003.0018.0063.35
6Star37.003.0018.0064.58
7Star27.005.6018.0082.89
8Star37.005.6018.0082.08
9Axial23.594.3013.0079.15
10Axial40.414.3013.0062.84
11Axial32.002.1113.0057.35
12Axial32.006.4913.0088.15
13Axial32.004.304.5975.97
14Axial32.004.3021.4183.33
15Center32.004.3013.0093.05
16Center32.004.3013.0095.83
17Center32.004.3013.0095.50
18Center32.004.3013.0098.08
19Center32.004.3013.0094.28
20Center32.004.3013.0094.78
MEA is the abbreviation of 2-methyl-6-ethylaniline.
Table 3. The variance analysis of the fitting model.
SourceSum of SquaresDFMean SquareF ValueP Value
Model3110.099345.5745.02<0.0001
X1141.91141.918.490.0016
X2945.731945.73123.2<0.0001
X33.5613.560.460.5112
X1·X26.7216.720.880.3716
X1·X337.95137.954.940.0504
X2·X318.69118.692.440.1497
X121024.3211024.32133.44<0.0001
X22878.931878.93114.5<0.0001
X32415.71415.754.15<0.0001
Residual76.76107.68
Lack of fit62.36512.474.330.0667
Pure error14.452.88
Cor Total3186.8519
Table 4. The removal efficiency of MEA under the optimal conditions.
Optimum ConditionsMEA Removal Efficiency (%)
pHH2O2 (mM)Temperature (°C)ExperimentalPredicted
5.0213.4130.9597.5697.90

