Simulation of Water Resources Carrying Capacity in Xiong’an New Area Based on System Dynamics Model


School of Environment, Beijing Normal University, Beijing 100875, China
*
Author to whom correspondence should be addressed.
Water 2019, 11(5), 1085; https://doi.org/10.3390/w11051085
Submission received: 22 April 2019
/
Revised: 21 May 2019
/
Accepted: 22 May 2019
/
Published: 24 May 2019
(This article belongs to the Section Water Resources Management, Policy and Governance)
Abstract
:In order to comprehensively evaluate the water resources carrying capacity in Xiong’an New Area, a system dynamics (SD) model was established to evaluate the regional water resources carrying capacity, for which several scenarios were designed: the original development scenario, the accelerated industrialization scenario, the environmental governance scenario, and the optimization development scenario. The results show that, compared with the original development scenario, the water resources carrying capacity in Xiong’an New Area can be improved in other scenarios, but a water supply and demand gap will be generated due to the lack of groundwater overdraft and a water transfer project. In 2026, under the accelerated industrialization scenario, the population carrying capacity will be 2.652 million, and the water supply and demand gap will be 1.13 × 10⁸ m3; under the environmental governance scenario, the population carrying capacity will be 2.36 million, and the water supply and demand gap will be 0.44 × 10⁸ m3; under the optimal development scenario, the population carrying capacity will be 2.654 million, and since the supply of water resources will be greater than the demand, there will not be a gap between supply and demand, making it the most feasible scenario to effectively alleviate the tension between industry restructuring, environmental management, and water resources development and utilization. The findings of this study can provide reference and decision support for optimizing regional water resources allocation and enhancing water resources carrying capacity in Xiong’an New Area.
1. Introduction
On 1 April 2017, the Chinese government issued the plan for the construction of Xiong’an New Area. Following the construction of Shenzhen Special Economic Zone and Shanghai Pudong New Area, the strategic planning for Xiong’an New Area was recognized as an historically essential decision, and Xiong’an New Area is considered to be the future subsidiary administrative center of China. Accordingly, the Chinese government emphasized seven essential aspects of the planning and construction of Xiong’an New Area, and the tasks of constructing a green and smart city, creating an ecologically friendly urban environment, and promoting the balance between nature and urban development were considered as priorities [1]. Xiong’an New Area is located in the center of the Beijing–Tianjin–Baoding delta, and the location may benefit Xiong’an New Area’s development through the geographical as well as the economic and social connection to the surrounding large cities. However, studies have shown that the scarcity of water and the issue of water pollution may threaten the harmony between ecology and economy during the construction of Xiong’an New Area [2,3]. Dong [4] studied the human–water relationship and the water resources carrying capacity in Xiong’an New Area using water resources carrying indexes and provided suggestions on the improvement of local residency. Feng et al. [5] analyzed the population distribution and water resources and quantitatively evaluated the relationship between population and water resources carrying capacity in Xiong’an New Area. Ge et al. [6] utilized remote sensing and contrasted the observations with historical data to assess the water resources carrying capacity in Xiong’an New Area. Previous studies often suggest weak water resources carrying capacity and a challenging human–water relationship in Xiong’an New Area based on qualitative analyses of its current situation [7,8]. Fewer scholars, however, have focused on utilizing quantitative methods to forecast the trend of water resources carrying capacity in Xiong’an New Area. This study aims to construct models that characterize socioeconomic traits, industrial structure, and ecological factors to simulate the variations of water resources carrying capacity in Xiong’an New Area based on the system dynamics (SD) method and to compare the results with other scholars’ findings through the structural entropy method, system analysis method, and so forth [9,10,11,12,13]. Considering the lack of water resources in Northern China and the strategic targets of the planning and construction of Xiong’an New Area, this study intends to simulate the water resources carrying capacity in Xiong’an New Area under four different situations, including original planning, industrialization acceleration, environmental governance, and optimized development. The analyses and discussions of the four different situations may provide comprehensive suggestions to improve water resources allocation and the development of Xiong’an New Area.
2. A Brief Introduction to Xiong’an New Area
Xiong’an New Area is located within the administrative area of Baoding city. It is also close to Baiyang Lake, which is the largest fresh water lake in the North China Plain. The geographical location is shown in Figure 1. The initial planning area of Xiong’an New Area is approximately 100 km2, and its area is expected to be around 200 km2 after several years of development. In the long term, the overall administrative area of Xiong’an New Area will reach 2000 km2, covering Xiongxian, Rongcheng, and Anxin counties in Hebei Province. The residential population in all three counties of Xiong’an New Area was 1.13 million in 2017, and 88% of them were rural residents. The average per capita GDP in Xiong’an New Area in 2017 was approximately 18,800 RMB. Regarding the natural and water resources conditions, Xiong’an New Area has a typical continental monsoon climate, with annual precipitation of 1549 mm in 2017. According to the 2017 data, the quantity of annual water resources in Xiong’an New Area is 1.23 × 10⁸ m3. In particular, the amount of surface water is 0.01 × 10⁸ m3, the amount of underground water is 1.31 × 10⁸ m3, and the nonduplicated amount between surface and underground water is 1.12 × 10⁸ m3. In addition, the area of effective irrigation reaches 2 × 10⁸ m2 in all counties in Xiong’an New Area. Moreover, the total water supply, including surface and underground water, is 2.47 × 10⁸ m3, while the total amount of water usage is already 2.53 × 10⁸ m3. The above data are derived from the Statistical Yearbook of the National Bureau of Statistics of China and the Water Resources Bulletin provided by the local hydrographic bureau of Xiong’an New Area. In general, facing intensive pressure from abuses to underground water and a lack surface water, Xiong’an New Area is in urgent need of solutions for its low water resources carrying capacity in order to coordinate its economic development (urbanization process and industrial restructuring) and natural eco-environment.
3. The Formulation of SD Model
An SD model is a system simulation method that has been primarily utilized to analyze production and inventory management in an enterprise through interactive feedback of information and the evolutionary process of a system [14,15]. The formulation of an SD model requires precise mathematical models addressing the internal connections of a system, and the model can provide useful insights into a complex system, particularly when it comes to systems with nonlinearity and multiple control variables [16,17]. As the SD method has further developed with advancements of computer technologies, it has become more appropriate to apply the SD method to simulate the dynamics of a system, including the dynamics of water resources carrying capacity, water resources allocation, energy dispatching, and environmental governance. The main subject of this study is the water resources carrying capacity in Xiong’an New Area, for which utilizing the SD method is more suitable. Such studies often require the analysis of optimal water resources allocation in the area in order to sustain the largest possible population and economy given a certain level of production technology.
3.1. The Conceptual Model
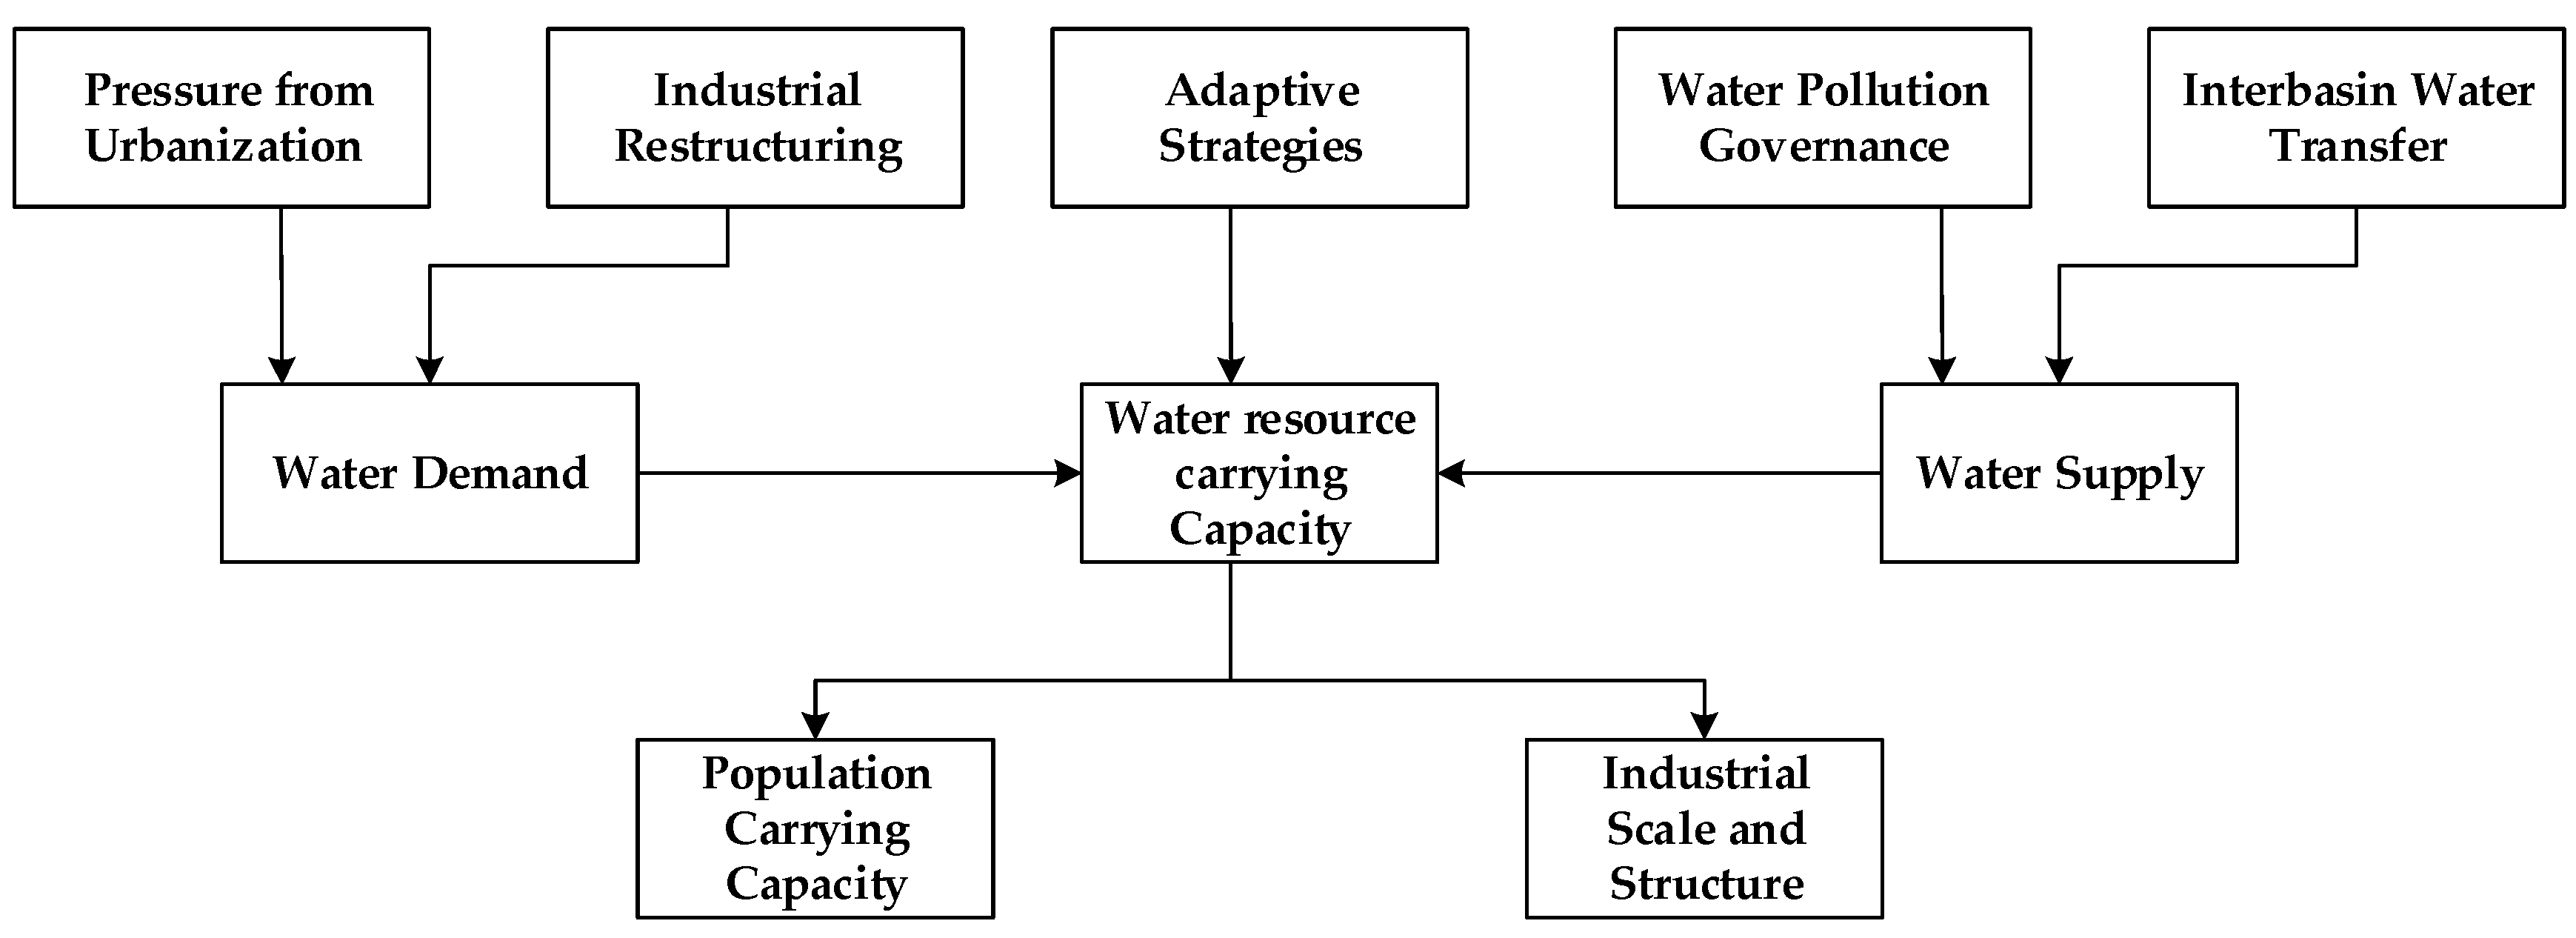
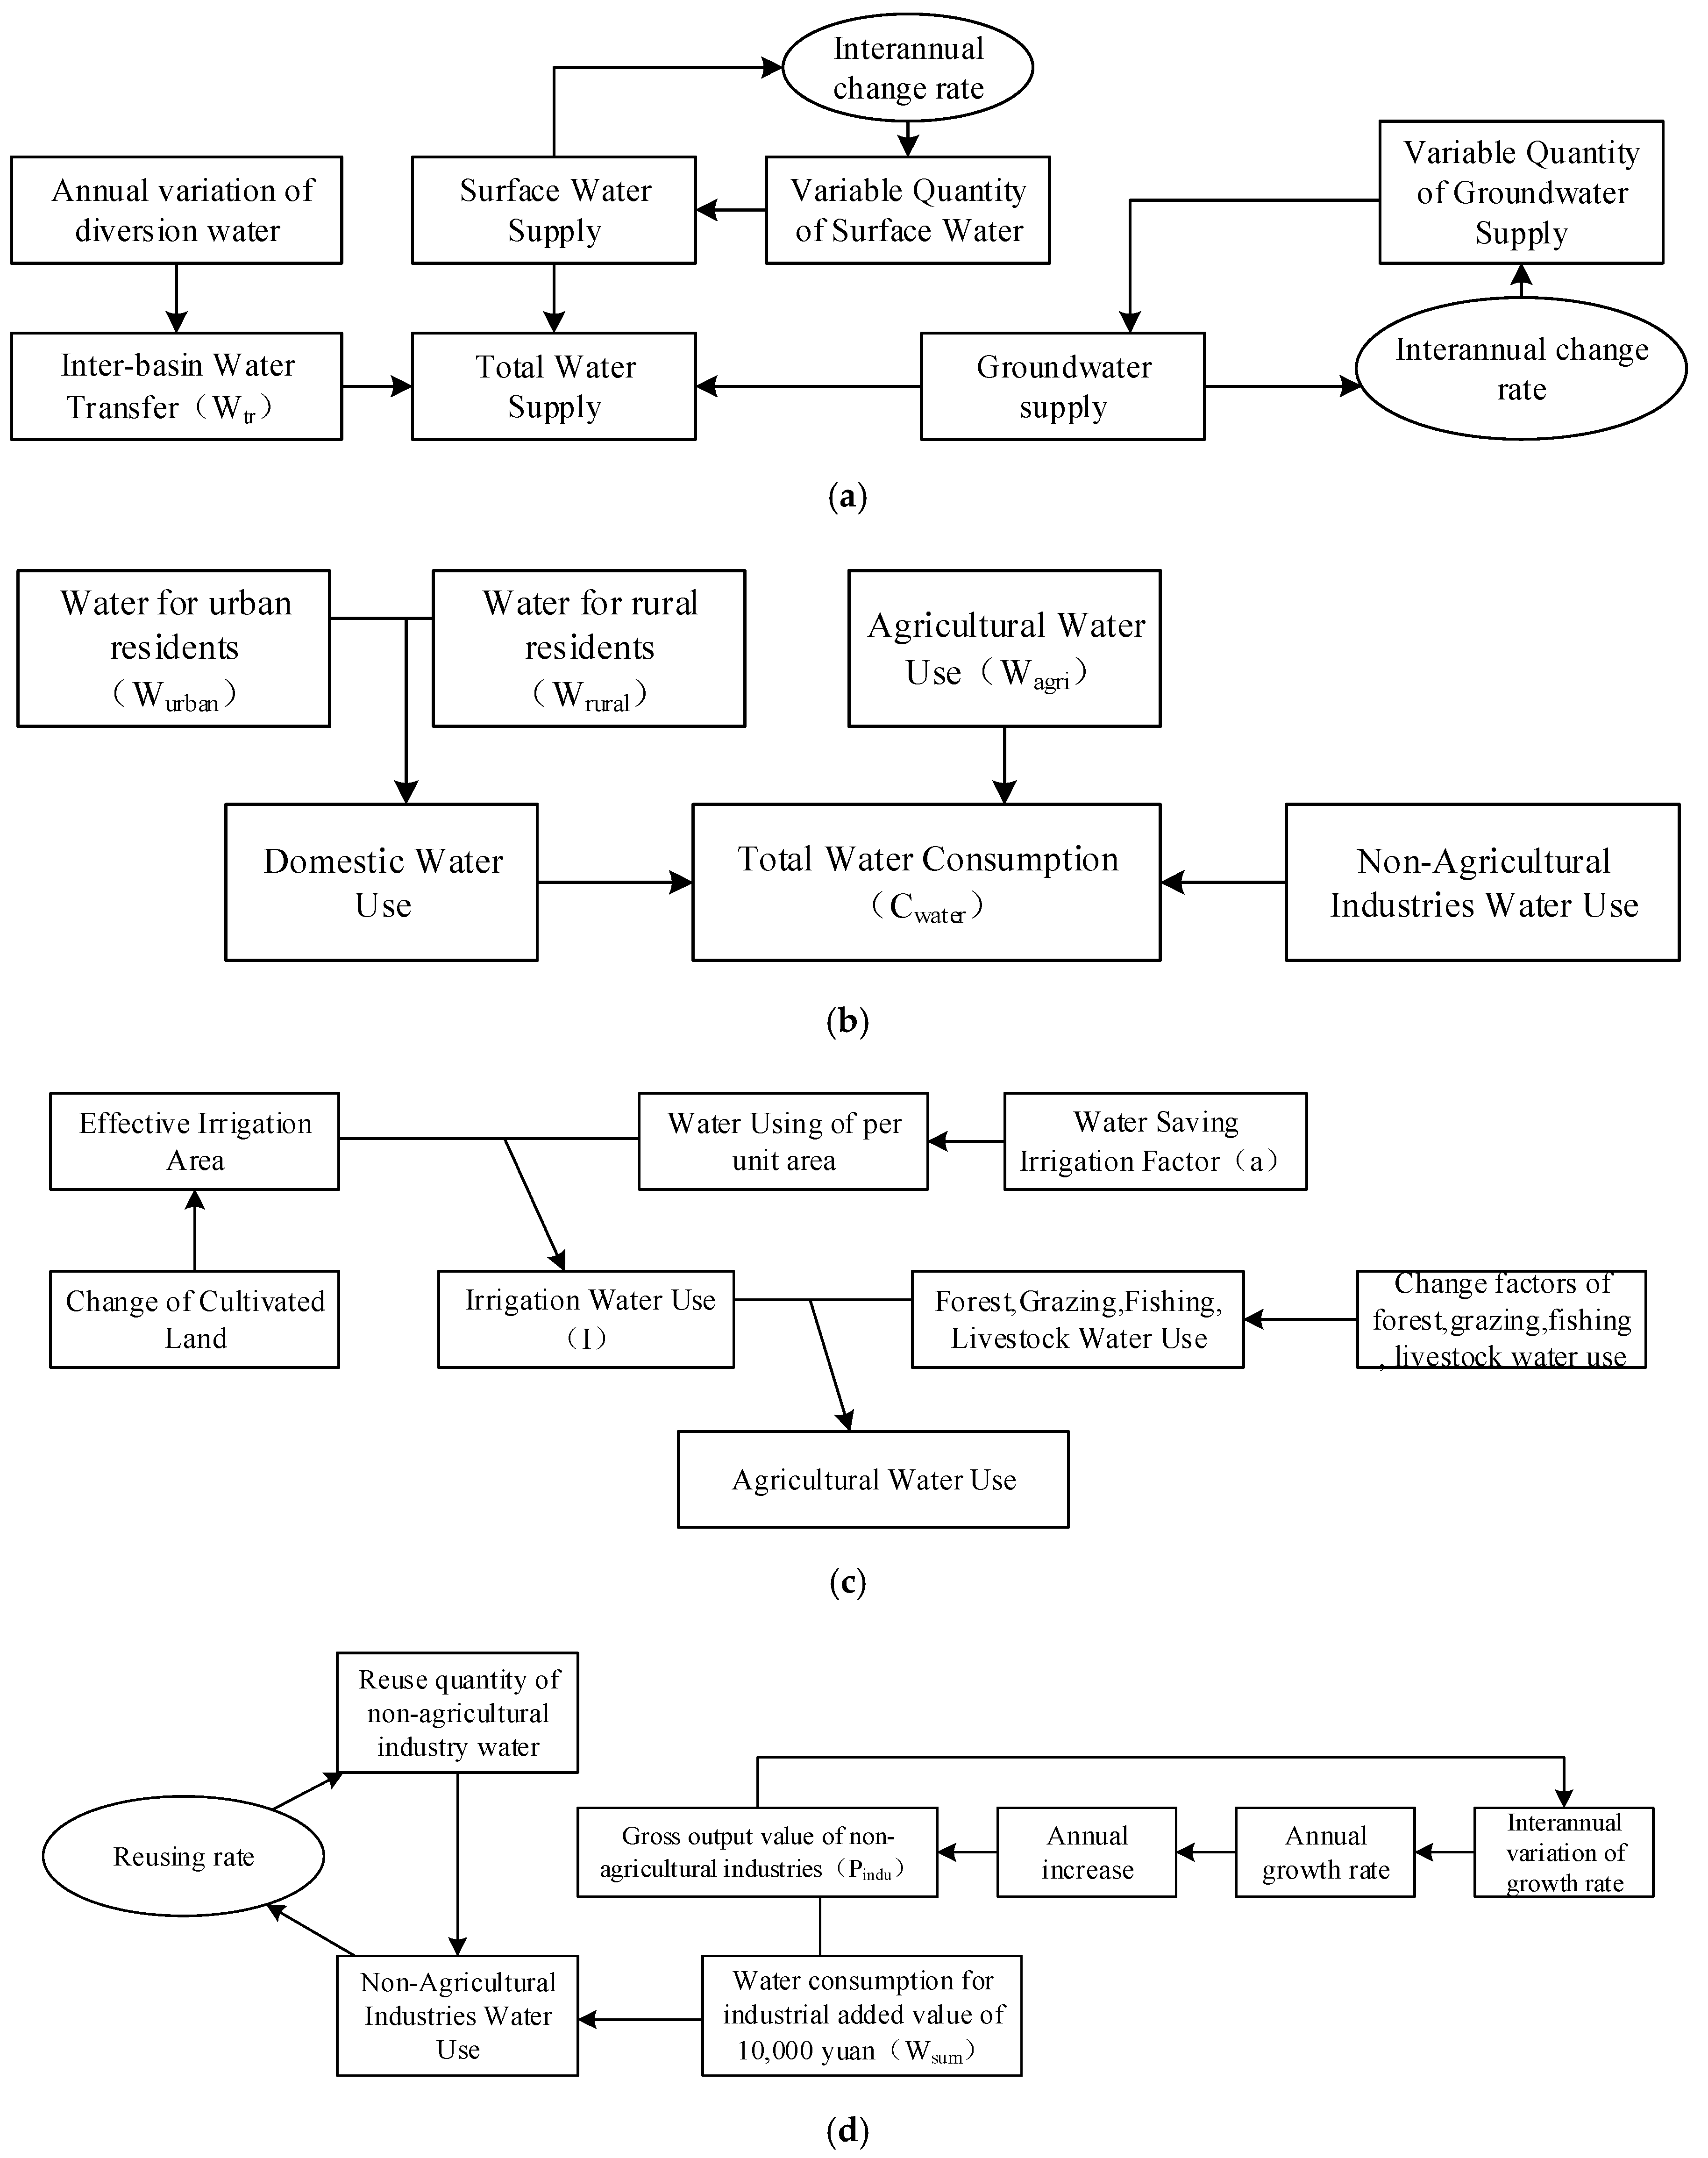
By applying the essence of the SD method, the conceptual model for analyzing the dynamics of water resources carrying capacity in Xiong’an New Area was constructed. As shown in Figure 2, this model consisted of the following three parts: first, the simulation of the dynamics of the total water resources amount in Xiong’an New Area; second, the simulation of the possible maximal population and economy that Xiong’an New Area’s water resources can bear in the preset scenarios; and third, the matching of the dynamics of the total water resources amount and the potential maxima of population and economy by calculating the corresponding water resources carrying capacity. Figure 3 presents the causal relationships among the main factors in this model. In addition, the construction of the specific models and simulations were all conducted using Matlab software [18,19,20].
3.2. The Calculation of the Total Water Resources Amount in Xiong’an New Area
The equations used to calculate the total amount of usable water and actual water consumption in an area are described below.
Equation (1) shows the calculation of the total amount of usable water in an area. Wa represents the total amount of usable water, Wpro represents the average amount of water production within the area, Win represents the amount of inbound water resources, Wout represents the amount of outbound water resources, u is a parameter coefficient representing the efficiency of water resources utilization, Wtr represents the amount of water transferred to the area, and Wre represents the amount of reusable water resources. According to the 2017 data, the amount of annual overexploited underground water in Xiong’an New Area is approximately 1.5 × 10⁸ to 2 × 10⁸ m3. The amount of compensated water from the south-to-north water diversion project is expected to be 4 × 10⁸ to 6 × 10⁸ m3 annually. However, considering the limited amount of water compensation from the south-to-north water diversion project, it is hardly possible to presently transfer more than 3 × 10⁸ m3 of water to Xiong’an New Area. Therefore, the numerical value of Wtr was set to 3 × 10⁸ m3 in the model simulations.
Equation (2) indicates the calculation of actual water consumption in an area:
where Cwater represents the total amount of actual water consumption, Windu represents the amount of industry water usage, Wrural represents the amount of rural residents’ water usage, Wirr represents the amount of agricultural water usage, Wurban represents the amount of urban residents’ water usage, and Wenvi represents the amount of environmental and ecological water usage.
3.3. The Calculation of Water Resources Carrying Capacity in an Area
Based on the definition of “maximal bearing capacity” and the existing methods for measuring bearing capacity [21,22], the water resources carrying capacity of the population, nonagricultural industries, and agricultural industry can be expressed by the following equations.
Equation (3) was used to calculate the population’s water resources carrying capacity:
where Np represents the maximal population that can be carried, S represents the total area of arable land, Sp is the per capita area of arable land, GDPnagri represents the total value of nonagricultural products, lp represents the per capita productivity of labor, and λ represents the population/employment ratio.
The water resources carrying capacity of nonagricultural industries was calculated based on Equation (4):
where CSP represents the maximal value of nonagricultural products that can be carried, Wa represents the total amount of usable water, Pindu represents the value of products in each nonagricultural industry, Windu represents the amount of water usage per 10,000 RMB of products in each nonagricultural industry, Cwater represents the total amount of actual water consumption, and Wsum represents the overall amount of water usage per 10,000 RMB of products in nonagricultural industries.
The last equation, Equation (4), shows the calculation for the water resources carrying capacity of the agricultural industry:
where CSA represents the maximal value of agricultural products that can be carried, Wa represents the total amount of usable water, I represents the overall water usage for irrigation, a represents the water-saving efficiency in irrigation, Cwater represents the total amount of actual water consumption, and Uagri represents the overall amount of water usage per 10,000 RMB of products in the agricultural industry.
4. The Scenario Simulation of the Dynamics of Water Resources Carrying Capacity
4.1. The Setups of the Scenarios
Based on the above data, the analysis results showed that Xiong’an New Area is facing a water scarcity issue at its early developmental stage. However, as the construction of Xiong’an New Area carries on, the process of urbanization and industrialization may further exert pressure on local water resources. To analyze the possible dynamics of the water resources carrying capacity and find an optimal solution to the issue of water scarcity, this study simulated four scenarios with different primary targets and forecasted water usage and other essential social and economic indicators for comparison and discussion. These scenarios are listed in Table 1.
The development of Xiong’an New Area is a national major program of lasting importance in China, and its major function is to inherit Beijing’s noncapital functions in the future. Therefore, the original official planning of Xiong’an New Area must be considered as the benchmark. In addition, this study took into account of other key indicators that identify major Chinese cities’ developmental characteristics when setting up the scenarios. For example, Shenzhen Special Economic Zone is already free of areas with agricultural irrigation, and the growth rate of its nonagricultural industry is tied to the government’s predetermined growth rate. When the actual growth rate exceeds the predetermined rate, its economy stays in a steady state with a constant growth rate. With a well-developed economy, the water usage per 10,000 RMB GDP in Shenzhen in 2015 was 11.37 m3, with 41.2% and 58.8% used in the second and third industries, respectively. Beijing, on the other hand, used 9.94 m3 of water for every 10,000 RMB of GDP in the third industry alone in 2015. In 2016, the usage of water for each 10,000 RMB of GDP in the second and third industries was 8.34 and 8.56 m3, respectively. It can be inferred that Beijing requires relatively more water usage in production, but the usage is decreasing. Another key indicator of water usage efficiency is the rate of water reuse. Such a rate measures how much water is saved and repetitively utilized. The rate of water reuse is approximately 40% in Beijing, and the rate is about 50% in Tianjin Binhai District. To indicate the economic productivity in an area, one may consider using the per capita productivity of labor. Bejing’s, Shanghai’s, and Shenzhen’s annual per capita productivities of labor are 150,000, 180,000, and 180,000 RMB, respectively. Moreover, this study also used the population/employment ratio to address the population size which the existing number of employed laborers can support in an area. Generally speaking, if the ratio reaches 2, there are usually enough laborers to support the overall population in the area; if it reaches 3, it is often stressful for the laborers to support the local population. Lastly, the recycling of domestic wastewater, which is often processed by the local government, is also an important factor influencing water resources carrying capacity. Currently, Beijing processes and recycles about 30% of domestic wastewater, and this ratio can be improved to 50% as the recycling technology advances and the governmental subsidy increases.
Based on the discussion of potential indicators of water resources carrying capacity in an area, this study set up the following four scenarios to simulate the dynamics of the water resources carrying capacity in Xiong’an New Area.
4.1.1. Scenario A: Original Planning
In scenario A, the planning and construction of Xiong’an New Area remained as predetermined in the official documents issued by the Central Committee of the Communist Party of China and the State Council. Therefore, none of the potential influences from accelerating urbanization or industrialization (such influences include more industrial water usage and pollution) were considered. The average amount of water production within the area and other indicators in the regression analyses remained at their 2017 levels.
4.1.2. Scenario B: Industrialization Acceleration
This scenario addressed industrial restructuring to accelerated industrialization. Based on the history of well-developed cities in China, this study set the changing rate of irrigation areas to be −20%, the growth rate of nonagricultural industries to be 35%, the water usage per 10,000 RMB of GDP to be 10 m3, the recycling rate of water usage in nonagricultural industries to be 30%, the per capita productivity of labor to be 180,000 RMB annually, the population/employment ratio to be 2, and the recycling rate of domestic wastewater to be 30% in this scenario.
4.1.3. Scenario C: Environmental Governance
In this scenario, the goal of environmental protection was the priority. Therefore, the usage of water in the ecological system in Xiong’an New Area was primarily fulfilled. Thus, this study set the changing rate of irrigation areas to be −20%, the growth rate of nonagricultural industries to be 25%, the water usage per 10,000 RMB of GDP to be 10 m3, the recycling rate of water usage in nonagricultural industries to be 50%, the per capita productivity of labor to be 150,000 RMB annually, the population/employment ratio to be 2, and the recycling rate of domestic wastewater to be 50% in this scenario.
4.1.4. Scenario D: Optimized Development
The last scenario coordinated modest urbanization and industrialization with proper environmental protection and water-saving efforts in Xiong’an New Area’s development. Therefore, this study set the changing rate of irrigation areas to be −10%, the growth rate of nonagricultural industries to be 30%, the water usage per 10,000 RMB of GDP to be 8 m3, the recycling rate of water usage in nonagricultural industries to be 50%, the per capita productivity of labor to be 180,000 RMB annually, the population/employment ratio to be 2, and the recycling rate of domestic wastewater to be 50% in this scenario.
4.2. The Results and Discussions of Scenario Simulations
As mentioned previously, scenario A shows the dynamics of the water resources carrying capacities of the population and industrial production. However, due to the fact that all factors were set to remain at the 2017 levels, not much dynamics could be observed in this scenario.
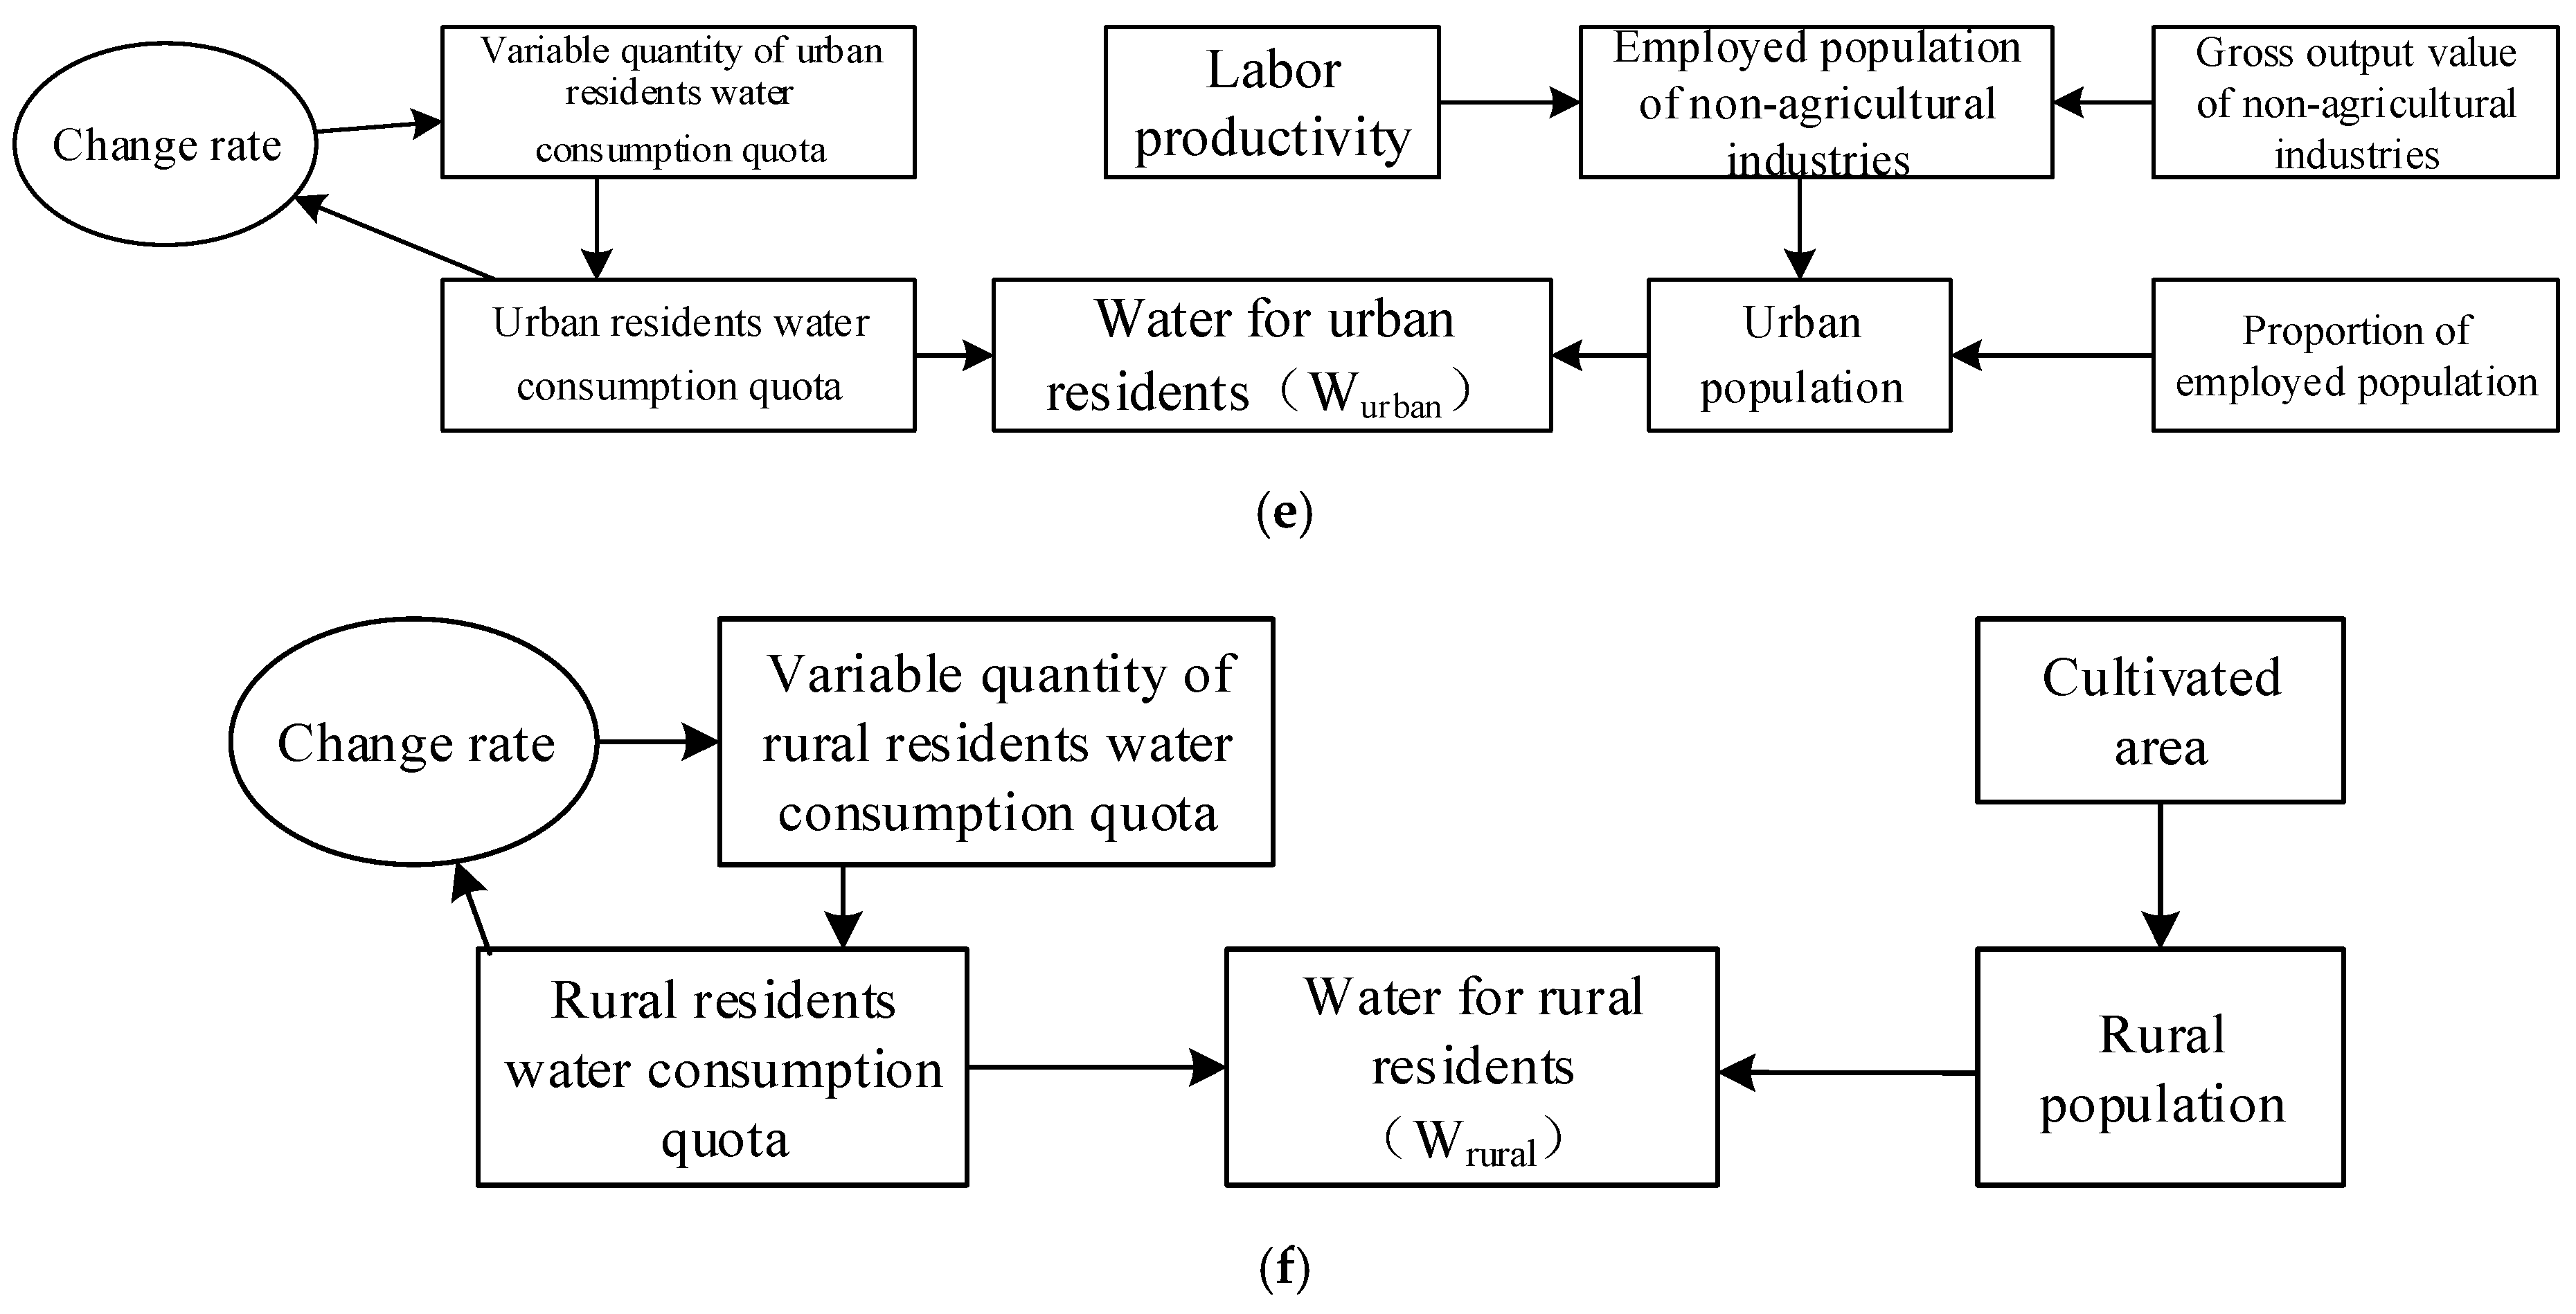
In scenario B, where Xiong’an New Area focuses more on industrialization during its future development, the maximal population and value of nonagricultural products that could be carried by water resources were simulated to be 2.65 million people and 227 billion RMB, respectively, in 2026. However, stimulating industrialization significantly increased the water usage in nonagricultural production. The estimated total water usage in Xiong’an New Area in 2026 was 4.72 × 10⁸ m3, and nonagricultural water usage was 2.41 × 10⁸ m3, which was 51% the total usage. The water supply compensation from the south-to-north water diversion project would provide 3 × 10⁸ m3 of water, which would be enough for the water usage in Xiong’an New Area in the first eight years. However, starting from the ninth year, a water supply shortage would exist. The shortage will grow exponentially and be as large as 1.13 × 10⁸ m3 in 2026, which may significantly obstruct development in Xiong’an New Area.
In scenario C, the development of Xiong’an New Area was more environmentally friendly. With a higher recycling rate of water usage in nonagricultural industries and domestic wastewater, Xiong’an New Area’s total water usage in 2026 would be 3.73 × 10⁸ m3, and its water resources could bear up to 2.36 million people. A water supply shortage will also emerge with the compensated water supply, but not until 2026. In time, the shortage will be 0.44 × 10⁸ m3.
In scenario D, where industrialization and environmental protection are both addressed, Xiong’an New Area’s total water usage reached 4.31×10⁸ m3 with 2.65 million people and 204 billion RMB of nonagricultural production value in 2026. The amount of bearable population in this scenario would accord with the official planning of Xiong’an New Area. In addition, the sufficient water supply, including that from the south-to-north water diversion project, would improve the water circulation condition in the natural system so that the issues of underground water abuse could be resolved. In such a scenario, Xiong’an New Area’s development may achieve harmony between economic advancement and ecological stability.
The simulations of water resources carrying capacities in Xiong’an New Area in different scenarios (expect for scenario A) revealed a common fact about the dynamics of the possible bearable population: in all three scenarios, the maximal bearable population decreases in the first years and reaches its lowest value in the third year, and then it increases throughout the following years. Specifically, the decreases in maximal bearable population in scenarios B and D were less than the decreases in scenario C. In addition, scenarios B and D showed that in the fifth year of simulation (2022), the maximal bearable population exceeded Xiong’an New Area’s original population, while it took six years in scenario C to have a population exceeding the original population. It is also important to note that the maximal bearable population in any scenario was dependent on the preset population/employment ratio. Therefore, the decreases in the maximal bearable population in the first years in all scenarios indicated that the original laborers, who would be mostly employed in low-technology jobs, would not be skilled to be employed in the nonagricultural industries at the beginning of Xiong’an New Area’s construction, which would cause structural unemployment and decreases in the bearable population given the water resources in Xiong’an New Area in the short term. Thus, Xiong’an New Area’s government must be aware of such potential unemployment and find alternatives to settle those who are unemployed.
The uncertainty of the simulation results mainly comes from three aspects: the uncertainty of system structure, the uncertainty of the input parameters, and the uncertainty of economic development. Uncertainty of economic development is objective and unavoidable. In order to ensure that these input parameters had a reasonable range, we referred to the relevant parameters of some of the most developed regions in China. These development indicators are achievable under the current technical conditions in China. Due to the quantity of data being limited and the economic and water systems being complex and large, in order to minimize the impact of system uncertainty and data volume, this study simulated the water resources carrying capacity of Xiong’an New Area by setting different development scenarios, analyses of the socioeconomic scale, and water consumption rates that can be sustained by Xiong’an New Area under different development scenarios. Comparing the optimal results of the model with the Shenzhen Special Economic Zone, Shanghai Pudong New Area, Tianjin Binhai New Area, and Beijing, under the same level of social and economic development, the population and water consumption of Xiong’an New Area are in a reasonable range.
5. Conclusions
This study utilized an SD model to analyze the water resources carrying capacity in Xiong’an New Area. Four different scenarios were set to simulate the relationship among the economy, water resources, and environment, which provided insights into the dynamics of the water resources carrying capacity of the population and nonagricultural production in Xiong’an New Area.
The results of the simulations indicated that merely relying on environmental governance or accelerating industrialization to boost Xiong’an New Area’s development may not achieve the harmony of both economic and ecological sustainability. In particular, an environmentally oriented developmental strategy will hardly help improve Xiong’an New Area’s water resources carrying capacity. Emphasizing industrialization can improve the carrying capacity of water, but the reallocation of water from domestic and ecological usage to industrial usage will create a significant gap between the demand and supply of water in Xiong’an New Area in the future. A well-rounded development strategy requires the integration of industrial restructuring, environmental governance, and water-saving efforts to achieve sustainable development in Xiong’an New Area.
Xiong’an New Area is facing the issue of water scarcity, and the overexploitation of underground water has pushed the local water resources carrying capacity to its limit. Therefore, the future development of Xiong’an New Area must regard water resources constraints as a priority. Potentially, Xiong’an New Area should control the expansion of the second industry and promote that of the third industry while reducing the share of agricultural production, since the third industry has higher added value with lower energy and water consumption. At the same time, the promotion of water-saving efforts must be put on the agenda of local governors since water-saving efforts, including the improvement of water usage efficiency, the construction of public water-saving facilities, and the use of water recycling technology, can directly ameliorate Xiong’an New Area’s water carrying capacity issues.
Author Contributions
Conceptualization, B.S.; methodology, B.S.; software, B.S.; investigation, B.S.; resources, X.Y.; data curation, B.S.; writing—original draft preparation, B.S.; writing—review and editing, X.Y.; visualization, B.S.; supervision, X.Y.; project administration, X.Y.; funding acquisition, X.Y.
Funding
This work was supported by the National Key Research Program of China (Nos. 2016YFC0401305, 2017YFC0506603), the State Key Program of National Natural Science of China (No. 41530635), and the Project of National Natural Foundation of China (Nos. 51679007, 51379013).
Acknowledgments
Thanks to reviewers and editors for their valuable suggestions.
Conflicts of Interest
The authors declare no conflict of interest.
References
- Hebei Provincial Committee of CPC. The People’s Government of Hebei Province: Outline of Plan for Xiongan New District of Hebei Province 2018; Hebei Provincial Government: Shijiazhuang, China, 2018. [Google Scholar]
- Han, Y.; Zhang, S.F.; Lv, A.F. Research of effect on water resources carrying capacity in Beijing-Tianjin-Hebei region by water transfer. Resour. Sci. 2018, 40, 2236–2246. (In Chinese) [Google Scholar]
- Liu, J.J.; Dong, S.C.; Li, Z.H. Comprehensive Evaluation of China’s Water Resources Carrying Capacity. J. Nat. Resour. 2011, 26, 258–269. [Google Scholar]
- Dong, W.S.; Yang, M.Q. Analysis of Water Resources Carrying Capacity in Xiong’an District. Inner Mongolia Water Resour. 2018, 2, 57–59. (In Chinese) [Google Scholar]
- Feng, Z.M.; Yang, Y.Z.; You, Z. The Population and Water and Land Resource Carrying Capacity of Xiongan New Area. Sci. Technol. Support. Xiongan New Area’s Plann. Constr. 2017, 32, 1216–1223. (In Chinese) [Google Scholar]
- Ge, Q.S.; Yang, L.S.; Jin, F.J. Carrying Capacity of Resource and Environment of Xiongan New Area: Evaluation, Regulation, and Promotion. Sci. Technol. Support. Xiongan New Area’s Plann. Constr. 2017, 32, 1206–1215. (In Chinese) [Google Scholar]
- Yao, Z.J.; Wang, J.H.; Jiang, D. Advances in study on regional water resources carrying capacity and research on its theory. Adv. Water Sci. 2002, 13, 111–115. [Google Scholar]
- Duan, C.Q.; Liu, C.M.; Chen, X.N. Preliminary Research on Regional Water Resources Carrying Capacity Conception and Method. Acta Geographica Sinica. 2010, 65, 82–89. [Google Scholar]
- Jin, J.L.; Chen, L.; Chen, M.L. Evaluation method of water resources carrying capacity based on set pair analysis and risk matrix. Yangtze River 2018, 49, 35–41. (In Chinese) [Google Scholar]
- Li, F.; Luo, X.R. Study on water resources carrying capacity in Chongqing reach of TGP reservoir area. Yangtze River 2010, 41, 35–38. (In Chinese) [Google Scholar]
- Kuspilic, M. Assessment of water resources carrying capacity using uncertainty and sensitivity analyses. Common Found. 2017, 103–109. [Google Scholar] [CrossRef]
- Peng, Z.F.; Ma, X.M.; Liu, Y.Y. Evaluation on water resources bearing capacity in Jiangxi Province. Yangtze River 2011, 42, 73–76. (In Chinese) [Google Scholar]
- Sun, Y.R.; Dong, Z.C.; Zhou, Y. Evaluation of water resources carrying capacity in lower reaches of Yangtze River based on structural entropy method: a case study of Nanjing. Yangtze River 2018, 49, 47–51. (In Chinese) [Google Scholar]
- Wang, C.; Yang, G.; He, X.L.; Chen, S.; Li, X.L. Research on Water Resources Carrying Capacity Based on System Dynamics. China Rural Water Hydropower 2016, 9, 212–215. (In Chinese) [Google Scholar]
- Chen, G.W.; Jin, J.S.; Geng, J.B. Application Research Overview of System Dynamics. Control Eng. China 2012, 19, 921–928. (In Chinese) [Google Scholar]
- Wen, Y.; Zhou, K.; Jiang, S.R.; Lin, S.Y.; Shi, L. Water environment and water resource carrying capacity in Lushui Basin. J. Arid Land Resour. Environ. 2018, 32, 126–132. (In Chinese) [Google Scholar]
- Zhang, Z.W.; Yang, L.H.; Gao, H.Y.; Liu, H.Q.; Du, X.Y. Study on Water Resources Carrying Capacity Based on System Dynamics (SD) Model in Hebei Province. China Rural Water Hydropower 2008, 3, 20–23. [Google Scholar]
- Qiong, A. Study of Water Resources Carrying Capacity Based on System Dynamics Model in Tianjin City; Tianjin University: Tianjin, China, 2018. (In Chinese) [Google Scholar]
- Zhang, B.; Lu, G.H.; Hu, Z.Y. Study on the water resources supporting capacity of Shenzhen based on the SD model. J. Water Resour. Manag. 2011, 3, 25–27. [Google Scholar]
- Wang, J.H.; Jiang, D.; Gu, D.F.; Qi, W.H.; Tang, Q.W. Study on Prediction of Urban Water Resources Carrying Capacity in Arid Areas Based on SD Model. Geogr. Territ. Res. 1999, 15, 18–22. [Google Scholar]
- Fan, Y.Y.; Liu, Y.; Guo, H.C.; Wang, S.T.; Jiang, Y.M. The effects of water resources policies on water resources carrying capacity in Beijing city. Resour. Sci. 2005, 27, 113–119. [Google Scholar]
- Huang, Q.X.; Shi, P.J.; He, C.Y. Modelling land use change dynamics under different aridification scenarios in Northern China. Acta Geographica Sinica 2006, 61, 1229–1301. [Google Scholar]
Figure 1.
Geographical location of Xiong’an New Area.

Figure 2.
Modeling the variations of water resources carrying capacity in Xiong’an New Area.

Figure 3.
The causal relationships among the main factors in the Xiong’an system dynamics (SD) model: (a) total water supply, (b) total water consumption, (c) agricultural water use, (d) nonagricultural industries’ water use, (e) water for urban residents, and (f) water for rural residents.
Figure 3.
The causal relationships among the main factors in the Xiong’an system dynamics (SD) model: (a) total water supply, (b) total water consumption, (c) agricultural water use, (d) nonagricultural industries’ water use, (e) water for urban residents, and (f) water for rural residents.


Figure 4.
The dynamics of the simulated water resources carrying capacity in the four scenarios in Xiong’an New Area.
Figure 4.
The dynamics of the simulated water resources carrying capacity in the four scenarios in Xiong’an New Area.


Table 1.
Simulation scenarios of Xiong’an New Area’s water resources carrying capacity.
| Scenario Name | Mark | Setup | Detail |
|---|---|---|---|
| Original Planning | A | The process of Xiong’an New Area’s economic development remains original and unchanged. | All developmental activities follow the governmental planning. |
| Industrialization Acceleration | B | The development is primarily industrialization oriented. | The industrial structure in Xiong’an New Area is to be reorganized, and more resources are to be utilized in nonagricultural industries to stimulate industrialization. |
| Environmental Governance | C | Environmental governance is prior to economic development. | The use of water in the ecological system must be fulfilled first to keep Xiong’an New Area environmentally friendly. |
| Optimized Development | D | Multiple factors are considered to achieve optimal development. | The original planning, industrialization, and environment are all addressed to achieve an optimal developmental path. |
Table 2.
The simulated water resources carrying capacity in the four scenarios in Xiong’an New Area.
Table 2.
The simulated water resources carrying capacity in the four scenarios in Xiong’an New Area.
| Scenario | Year | Total Amount of Water Usage/108 m3 | Carrying Gross Industrial Output Value/108 yuan | Carrying Population/104 people | Water Demand-Supply Gap/108 m3 |
|---|---|---|---|---|---|
| A | 2017 | 2.53 | 115 | 113 | 0.00 |
| B | 2026 | 4.72 | 2267 | 265 | 1.13 |
| C | 2026 | 3.73 | 1670 | 236 | 0.44 |
| D | 2026 | 4.31 | 2040 | 265 | 0.41 |
© 2019 by the authors. Licensee MDPI, Basel, Switzerland. This article is an open access article distributed under the terms and conditions of the Creative Commons Attribution (CC BY) license (http://creativecommons.org/licenses/by/4.0/).
Share and Cite
MDPI and ACS Style
Sun, B.; Yang, X. Simulation of Water Resources Carrying Capacity in Xiong’an New Area Based on System Dynamics Model. Water 2019, 11, 1085. https://doi.org/10.3390/w11051085
AMA Style
Sun B, Yang X. Simulation of Water Resources Carrying Capacity in Xiong’an New Area Based on System Dynamics Model. Water. 2019; 11(5):1085. https://doi.org/10.3390/w11051085
Chicago/Turabian StyleSun, Boyang, and Xiaohua Yang. 2019. "Simulation of Water Resources Carrying Capacity in Xiong’an New Area Based on System Dynamics Model" Water 11, no. 5: 1085. https://doi.org/10.3390/w11051085
Note that from the first issue of 2016, this journal uses article numbers instead of page numbers. See further details here.