A Unified Equation to Predict the Permeability of Rough Fractures via Lattice Boltzmann Simulation

1
School of Highway, Chang’an University, Xi’an 710064, China
2
School of Civil Engineering, Sun Yat-Sen University, Zhuhai 519082, China
3
School of Aeronautics and Astronautics, Sun Yat-Sen University, Guangzhou 510006, China
4
Southern Marine Science and Engineering Guangdong Laboratory (Zhuhai), Zhuhai 519082, China
*
Author to whom correspondence should be addressed.
Water 2019, 11(5), 1081; https://doi.org/10.3390/w11051081
Submission received: 28 April 2019
/
Revised: 19 May 2019
/
Accepted: 21 May 2019
/
Published: 24 May 2019
(This article belongs to the Special Issue Modeling of Flow and Transport in Saturated and Unsaturated Porous Media)
Abstract
:In this paper, the fluid flow through rough fractures was investigated via numerical simulation based on the lattice Boltzmann method (LBM). The accuracy of LBM was validated through the numerical simulation of the parallel plate model and the verification of the mass conservation of fluid flow through rough fracture. After that, the effect of roughness on fluid flow was numerically conducted, in which, the geometry of fractures was characterized by the joint roughness coefficient (JRC), fractal dimension (D) and standard deviation (σ). It was found that the JRC cannot reflect the realistic influence of roughness on the permeability of single fracture, in which, an increase in permeability with increasing JRC has been observed at the range of 8~12 and 14~16. The reason behind this was revealed through the calculation of the root mean square of the first derivative of profile (Z2), and an equation has been proposed to estimate the permeability based on the aperture and Z2 of the fracture. The numerical simulations were further conducted on fluid flow though synthetic fractures with a wide range of D and σ. In order to unify the parameter that characterizes the roughness, Z2 was obtained for each synthetic fracture, and the corresponding relationship between permeability, aperture and Z2 was analyzed. Meanwhile, it was found that the fluid flow behaves differently with different ranges of Z2 and the critical point was found to be Z2 = 0.5. Based on extensive study, it was concluded that Z2 is a generic parameter characterizing the roughness, and the proposed equation could be used to predict the permeability for fluid flow in fracture.
1. Introduction
The inherent fracture has a significant influence on the strength, deformation and seepage characteristics of rock mass. In particular, the fluid flow through fractures has been a popular topic in a variety of areas including petroleum engineering, hydraulic engineering, and geotechnical engineering. For example, the production of nature resources (oil, gas), the leakage problem of waste and toxic substances, and the seepage failure in tunnel and mines require accurate descriptions of fluid flow through fractures.
The fluid flow in single fractures is quantified by the cubic law, in which, the transmissivity is proportional to the cubic of aperture based on the assumption of a parallel plate model. The early research on fluid flow in fractures can be tracked back to the work by Lomize [1] and Louis [2], who verified the cubic law through laboratory test. The cubic law was also validated by Witherspoon et al. [3] through the fluid flow in deformable rock fracture. In reality, rock fractures are not smooth but present certain degrees of roughness due to a complex formation process, and the influence of roughness on fluid flow through fractures has been studied extensively. For example, Tsang [4] conducted a numerical study to investigate the tortuosity on fluid flow through a single fracture and found that the fraction of contact area of the rough fracture is the controlling factor to determine the magnitude of the effect of tortuosity. Brown [5] used the finite difference method to calculate the volume flow rate and electric current in simulated fractures composed of rough surfaces generated with a fractal algorithm. Zimmerman and Bodvarsson [6] conducted an extensive theoretical analysis on the fluid flow through fractures. Barton and Quadros [7] explored the correlation between the hydraulic aperture and joint roughness coefficient (JRC). Murata and Saito [8] estimated the permeability and tortuosity of rock fractures by using the fractal model. Min et al. [9] conducted a numerical study to investigate the influence of stress on the permeability of fractured rock mass. Rasouli and Hosseinian [10] developed a correlation to estimate the hydraulic parameters through a channel of combined JRC profiles under different minimum closures using a finite element method. Further works include those by Xiong et al. [11], who investigated the geometrical and hydraulic characteristic of rock fractures during shear through both experimental and numerical study; Indraratna et al. [12], who proposed a 2D equivalent finite volume model that considers the hydraulic aperture distribution to solve the flow problem in deformable rough rock joints. Furthermore, Guha Roy and Singh [13] conducted a parametric study on fluid flow through fracture based on finite element modeling, in which, the influence of inflow pressure, aperture and shear displacement on the flow behavior were investigated. Ma et al. [14] and Ma and Wang [15] investigated the correlation between permeability and external stress applied on fractured rock mass through the concept of tortuosity. Chen et al. [16] conducted the experimental study to explore the effect of fracture geometric characteristics on the permeability in deformable rough-walled fractures. Recently, Rezaei Niya and Selvadurai [17] examined the relationship between the joint roughness coefficient (JRC) and permeability of a fracture through the numerical study based on COMSOL multiphysics. It is clear from the aforementioned studies that a deep understanding of fluid flow through rock fracture requires both an accurate geometry description and conceptual model that could characterize the flow behavior. Even with dramatic achievements, there is still a lack of a unified equation that could effectively estimate the permeability of rock fracture due to four reasons: (1) the differences in the geometry characterization of fracture roughness; (2) the difficulties and uncertainties in experimental investigation; (3) the assumption and simplification in theoretical analysis; (4) the difficulties in dealing with complex boundary conditions for conventional numerical models.
Parallel with conventional studies, the lattice Boltzmann method (LBM) developed in the past 30 years has received great popularity in the study of fluid flow in complex systems [18,19,20,21]. Compared with the traditional computed fluid dynamic model, LBM presents an advantage in describing the fluid flow in complex geometry and parallel implementation. Recently, a number of scholars adopted the LBM to describe the flow behavior in rough fracture. Eker and Akin [22] investigated the influence of average aperture, fractal dimension and anisotropy on fluid flow through synthetic fractures using the LBM. Wang et al. [23] and Ju et al. [24] conducted a study on the influence of surface roughness on flow behaviors through a combination of the fractal model and LBM. Dou and Zhou [25] studied the solute transport in a single rough fracture. Even with the promising application of the LBM in solving fluid flow problems, studies to quantify the permeability from fracture geometry based on the LBM are rarely reported.
Due to the limitations of the aforementioned studies, a systematic investigation of the fluid flow through rough fracture has become necessary and valuable. Thus, the lattice Boltzmann method was adopted to solve the fluid flow problem in fractures characterized by different approaches, thus trying to obtain a unified equation to predict the permeability of fractures. To this end, this paper is structured as follows. Firstly, the theoretical background of the LBM is introduced briefly, and the geometric characterization of fractures and its implementation in the lattice Boltzmann model is presented. After that, the accuracy of the LBM is validated through the parallel plate model and the mass conservation of fluid flow through rough fractures. Then, the fluid flow through fractures with different JRCs is numerically conducted and an equation is proposed to estimate the permeability of rock fractures. The roughness effect on the fluid flow is further investigated based on the fractal model, and the applicability of the proposed equation is validated. The discussion and conclusion will be drawn at the end of this paper.
2. Methodology
2.1. Lattice Boltzmann Method (LBM)
The lattice Boltzmann method is one of the “bottom up” approaches developed in the past three decades to solve single-phase or multi-phase flow problems in fracture/porous media. Originating from the kinetic theory, the LBM has the appealing features of programming simplicity, intrinsic parallelism, and straightforward resolution of complex solid boundaries and multiple fluid species [26,27].
In this work, the incompressible LBGK model is used, in which, the evolution equation of the density distribution function is expressed as
where , and are the lattice grid spacing and time step, respectively, is the discrete velocity direction, and is the collision operator given by
where is the relaxation time and is the equilibrium distribution function.
The macroscopic density and velocity can be obtained as
Accordingly, the incompressible Navier–Stokes equations can be derived through multi-scaling expansion as
where is the pressure, and is the kinetic viscosity, given by
The fundamental principle and explanation of the LBM can be found in the work by Guo et al. [18], which will not be discussed in detail.
2.2. Characterization of Fracture Roughness
2.2.1. Joint Roughness Coefficient
Originating from the difficulties in characterizing the roughness, Barton et al. [28] introduced the joint roughness coefficient (JRC) to investigate the mechanical and hydraulic behaviors of jointed rock mass. The JRC is obtained from the comparison between the given profiles with the standard profile shown in Figure 1a. The proposed parameter has the advantage of being easily obtained in practice, and thus it is widely used to characterize the geometry of fracture profiles. The process to obtain the height of the profiles for Barton’s standard profiles are demonstrated in Figure 1, in which, a profile with a certain JRC value is extracted (Figure 1b) and binarized according to the threshold value that is distinguished in the solid line (black) and background (white) (Figure 1c). After that, the height of different locations (x) is obtained as shown in Figure 1d.
2.2.2. Fractal Theory
To quantitatively describe the geometry of the fracture profile, the mathematical model developed by Brown [29] is used to characterize the fracture roughness for its limited parameters and easy implementation. According to Brown [29], the natural joints present remarkable similarities, and the profiles could be described as a decreasing power law of the power spectra, which is of the form G(k) = Ck−α (where G is the power spectral density, k is the wave number related to the wavelength, C is the proportionality constant, and α is the exponent index, typically ranging from 2 to 3). This power law indicates that the fracture surface topography can be described by fractal geometry, where the fractal dimension D is related to the power spectrum exponent as , which is frequently used as the measurement of surface texture. Meanwhile, it was found that the roughness is also related to the standard deviation of the profile. In statistics, the standard deviation (σ) is used to quantify the amount of variation for the profile. To this end, the rough-walled fracture in rock is characterized by two important parameters, fractal dimension (D) and standard deviation (σ).
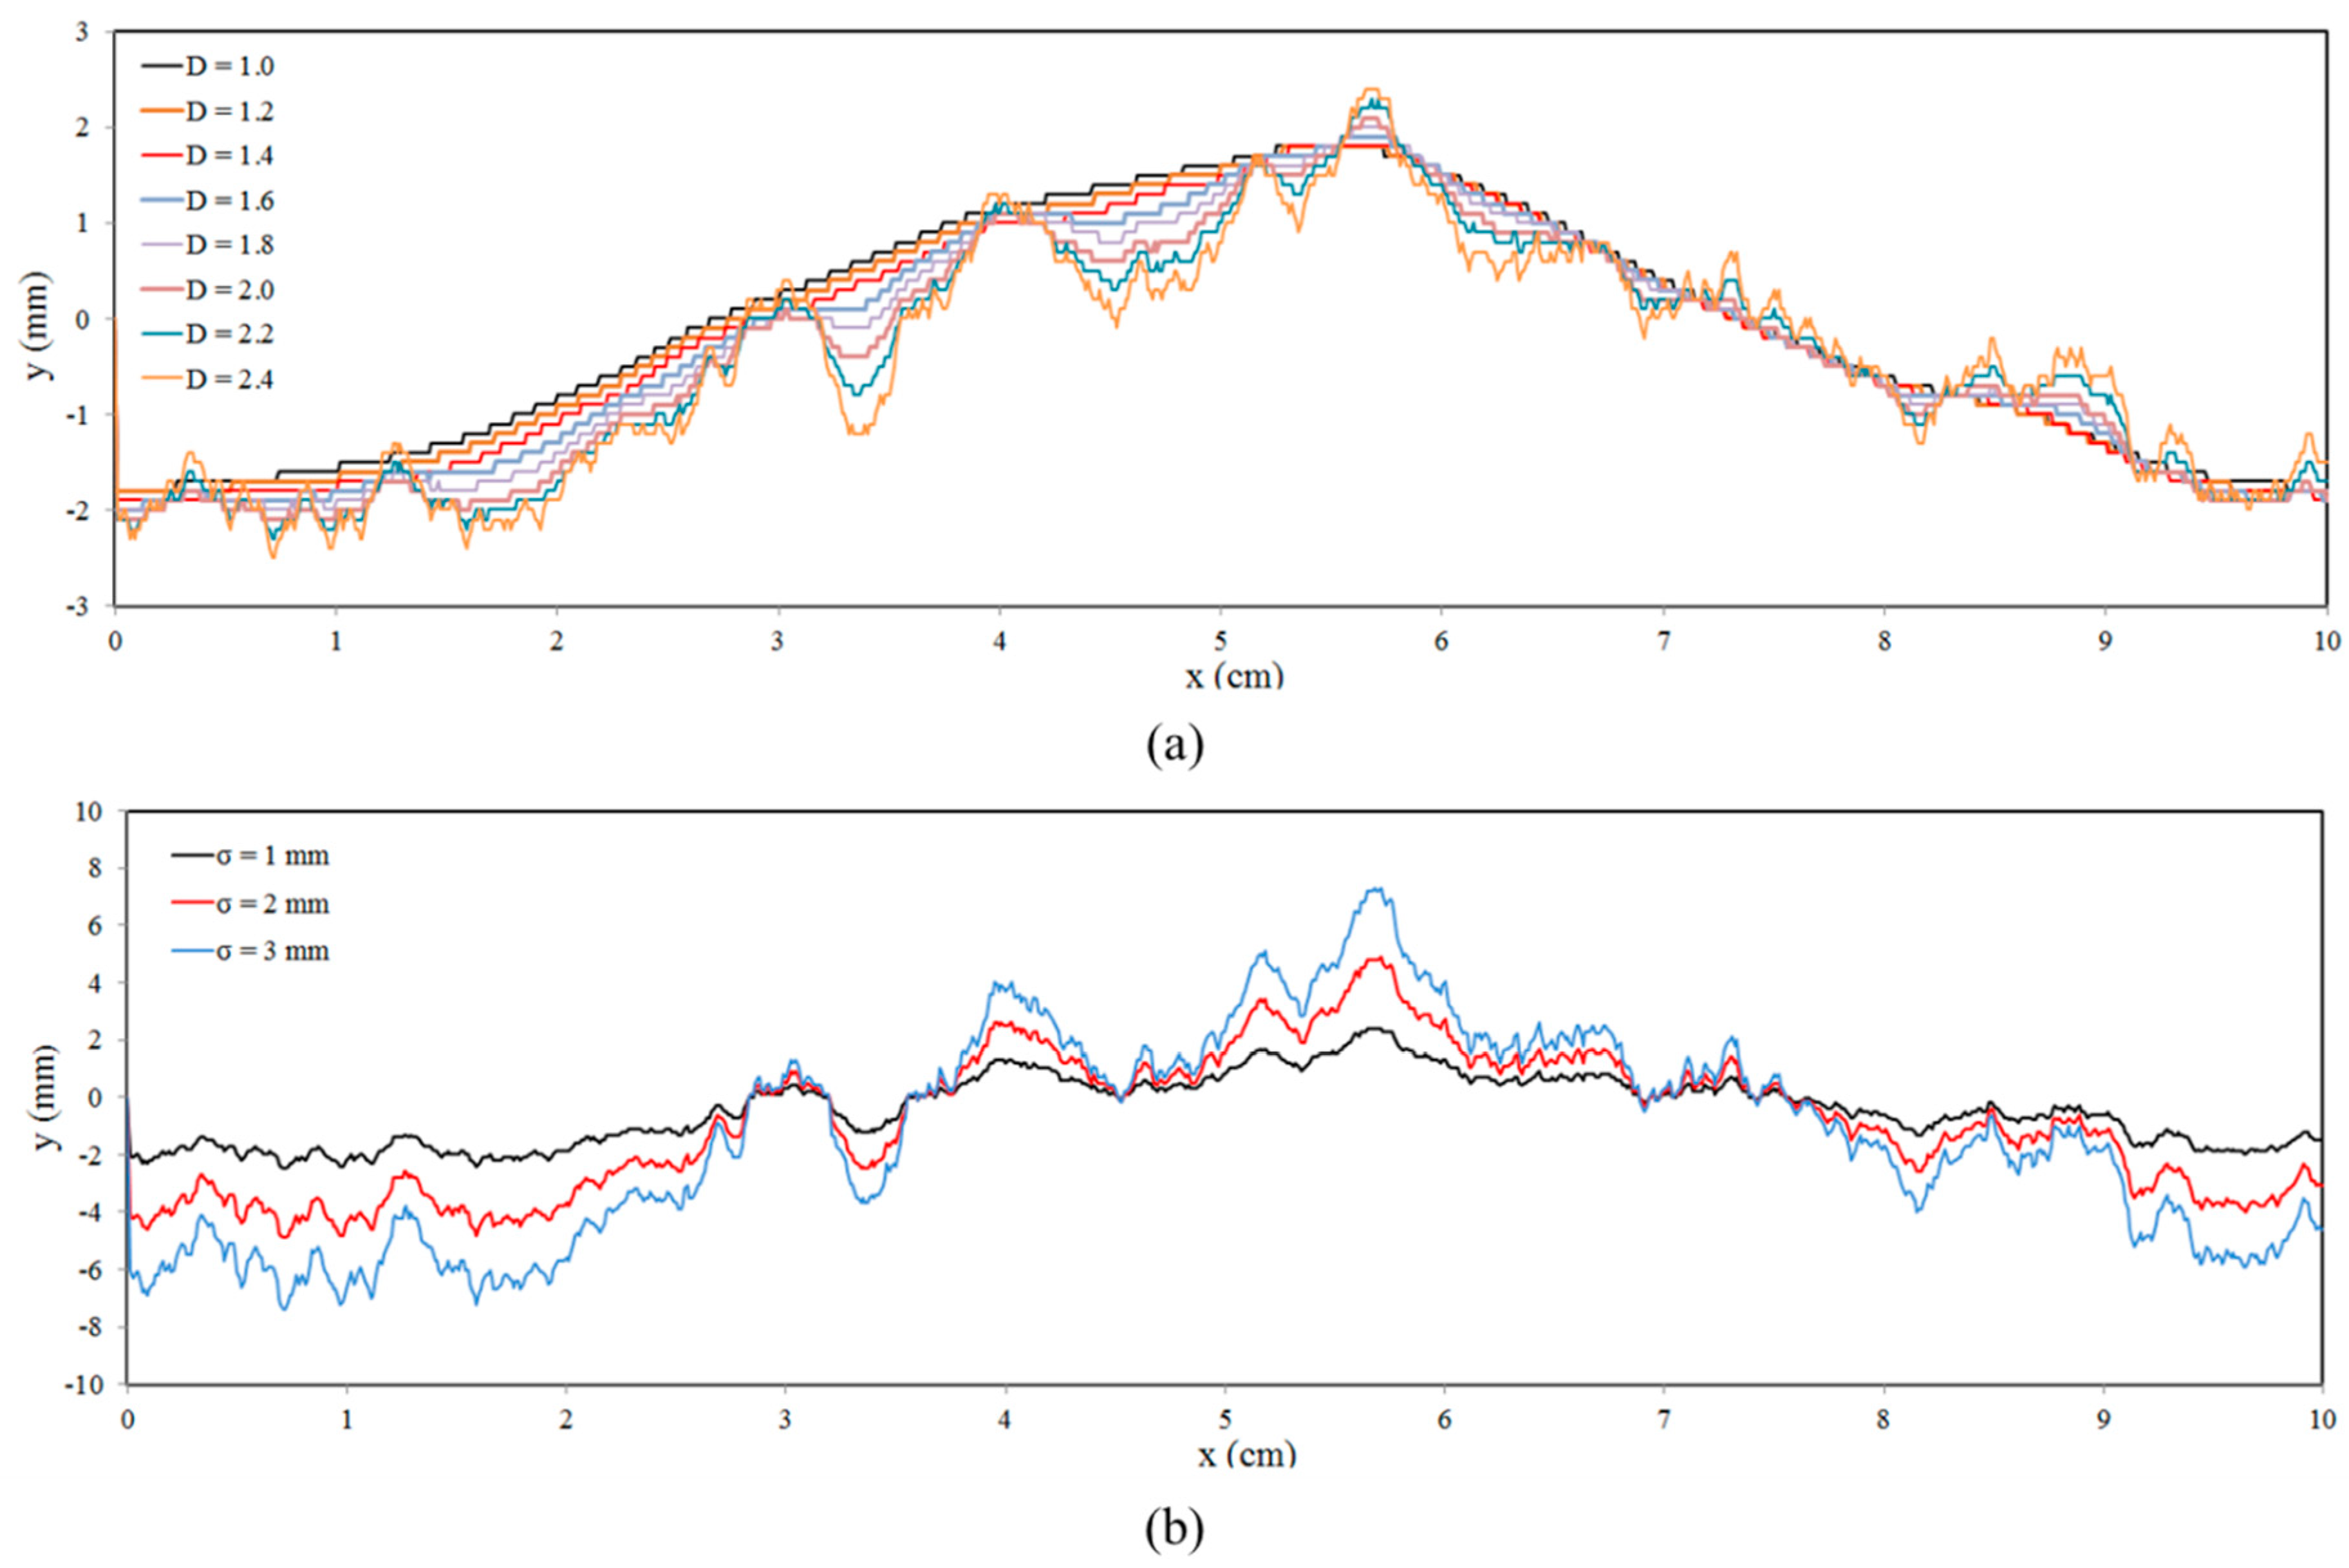
Accordingly, the open source code SynFrac developed by Ogilvie et al. [30] is used to generate the synthetic fracture, in which, the fractal dimension varies from 1.0 to 2.4 and the standard deviation varies from 1 to 3 mm. Selected profiles are presented in Figure 2, and an obvious increase in roughness with increasing fractal dimension and standard deviation has been observed.
2.3. Numerical Implement of Rough Fracture in the LBM
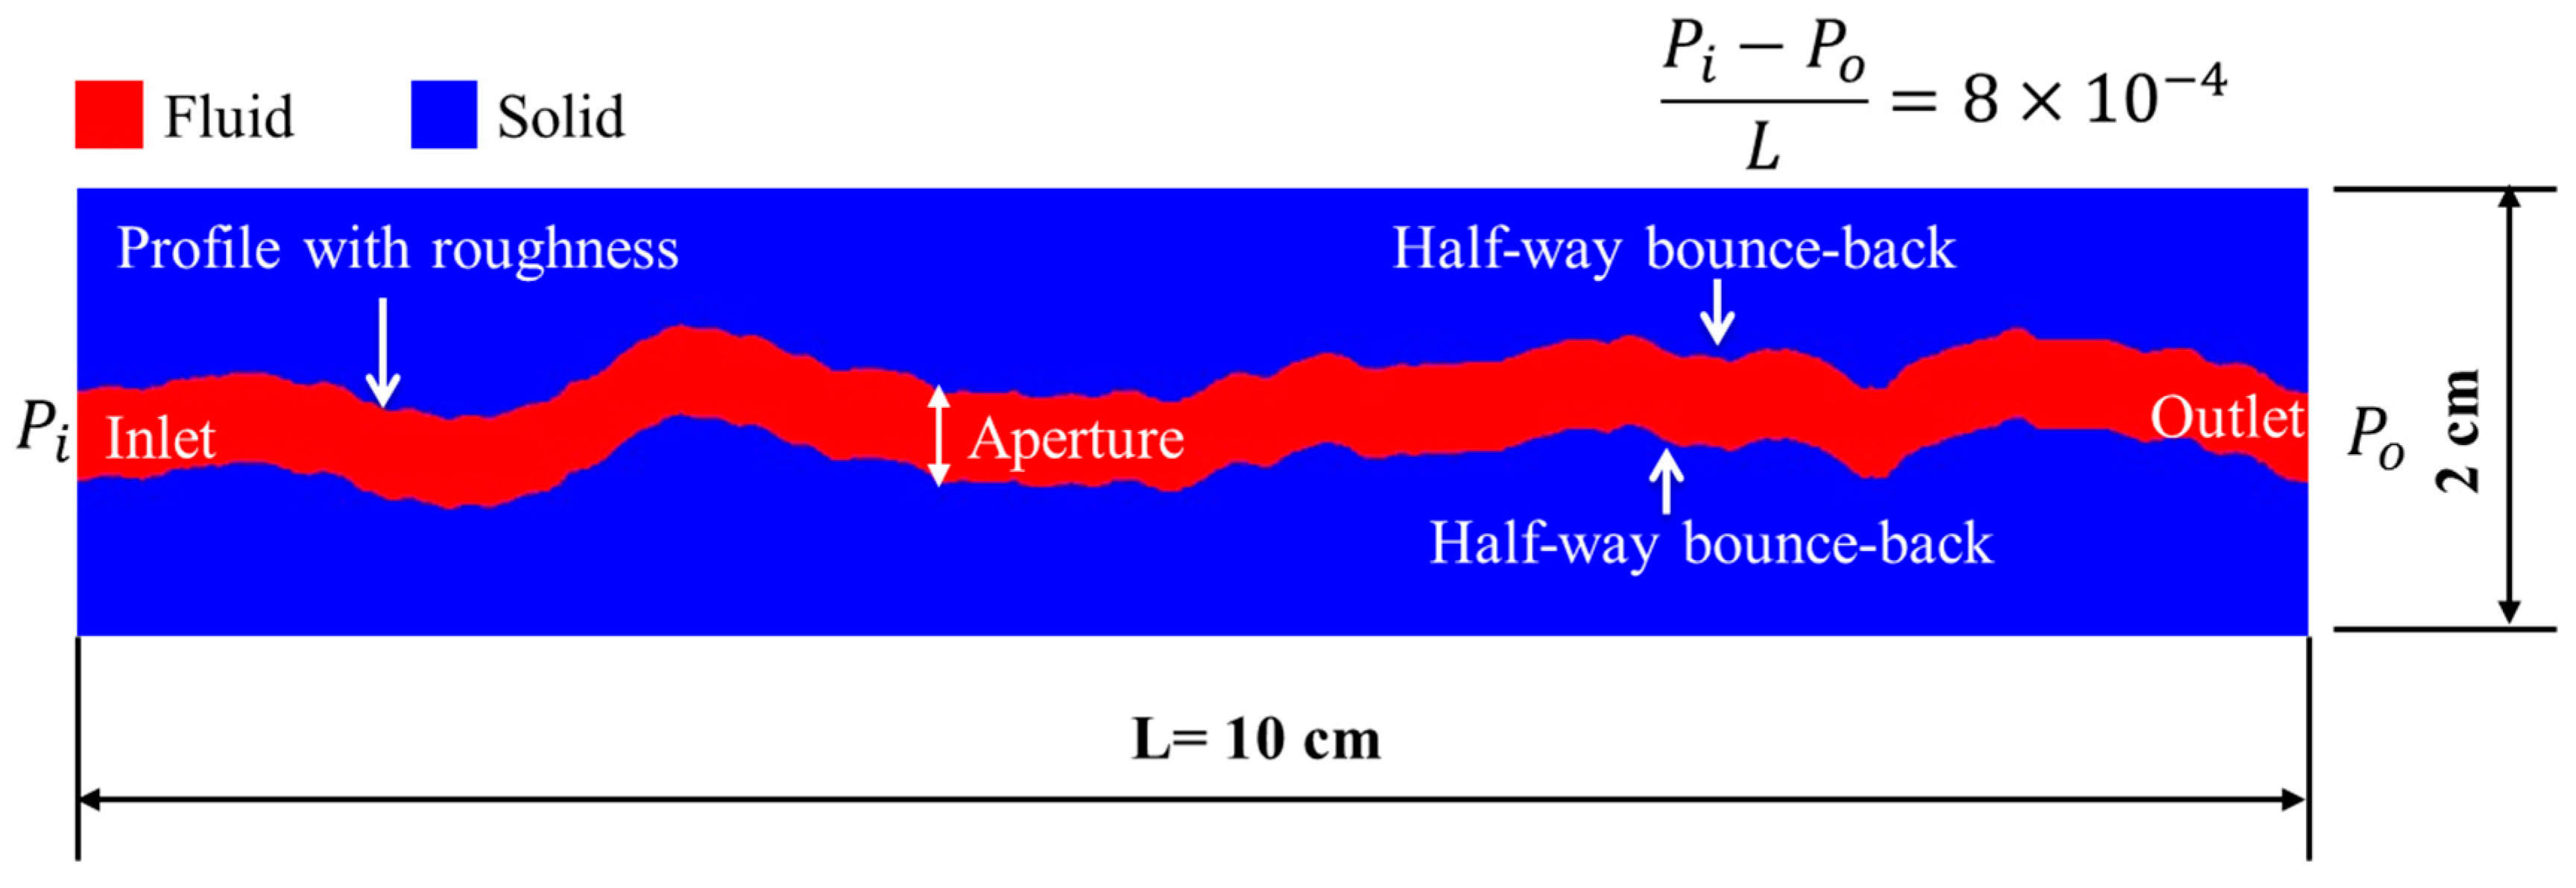
The influence of roughness on fluid flow is investigated through the two-dimensional incompressible LBGK model. To this end, the 2D profile of fracture surface is imported to the LBM so as to generate a fractured model as shown in Figure 3. The length of the fractured model is set as 10 cm to keep it consistent with a realistic profile. The aperture between two parallel rough profiles varies from 0.1 to 0.4 cm and the height of the fractured model is kept constant at 2 cm so that the full fracture would be in the range of the model domain. The pressure is applied at the inlet and outlet of the fracture and the “half-way wall bounce-back” scheme is used to simulate the non-slip boundary at the fluid–solid interface [31].
In order to represent the physics of a real system, it is necessary to convert the physical system to the discrete system so that the LBM simulation is equivalent to the physical system [18]. Meanwhile, the discrete parameters should be chosen for the consideration of both the numerical stability and accuracy, and the details on parameter choice can also be found in [32]. Accordingly, the corresponding parameters used in the physical model, dimensionless model and lattice model are listed in Table 1. It should be mentioned that the Reynolds numbers are identical for the three models, and the viscosity of the dimensionless model is related to the Reynolds number as
With the Reynolds number given as 100, the viscosity is calculated as 0.01 and the corresponding relaxation time is calculated as 0.53 based on Equation (7).
3. Numerical Study of Fluid Flow through Rough Fractures
3.1. Numerical Validation
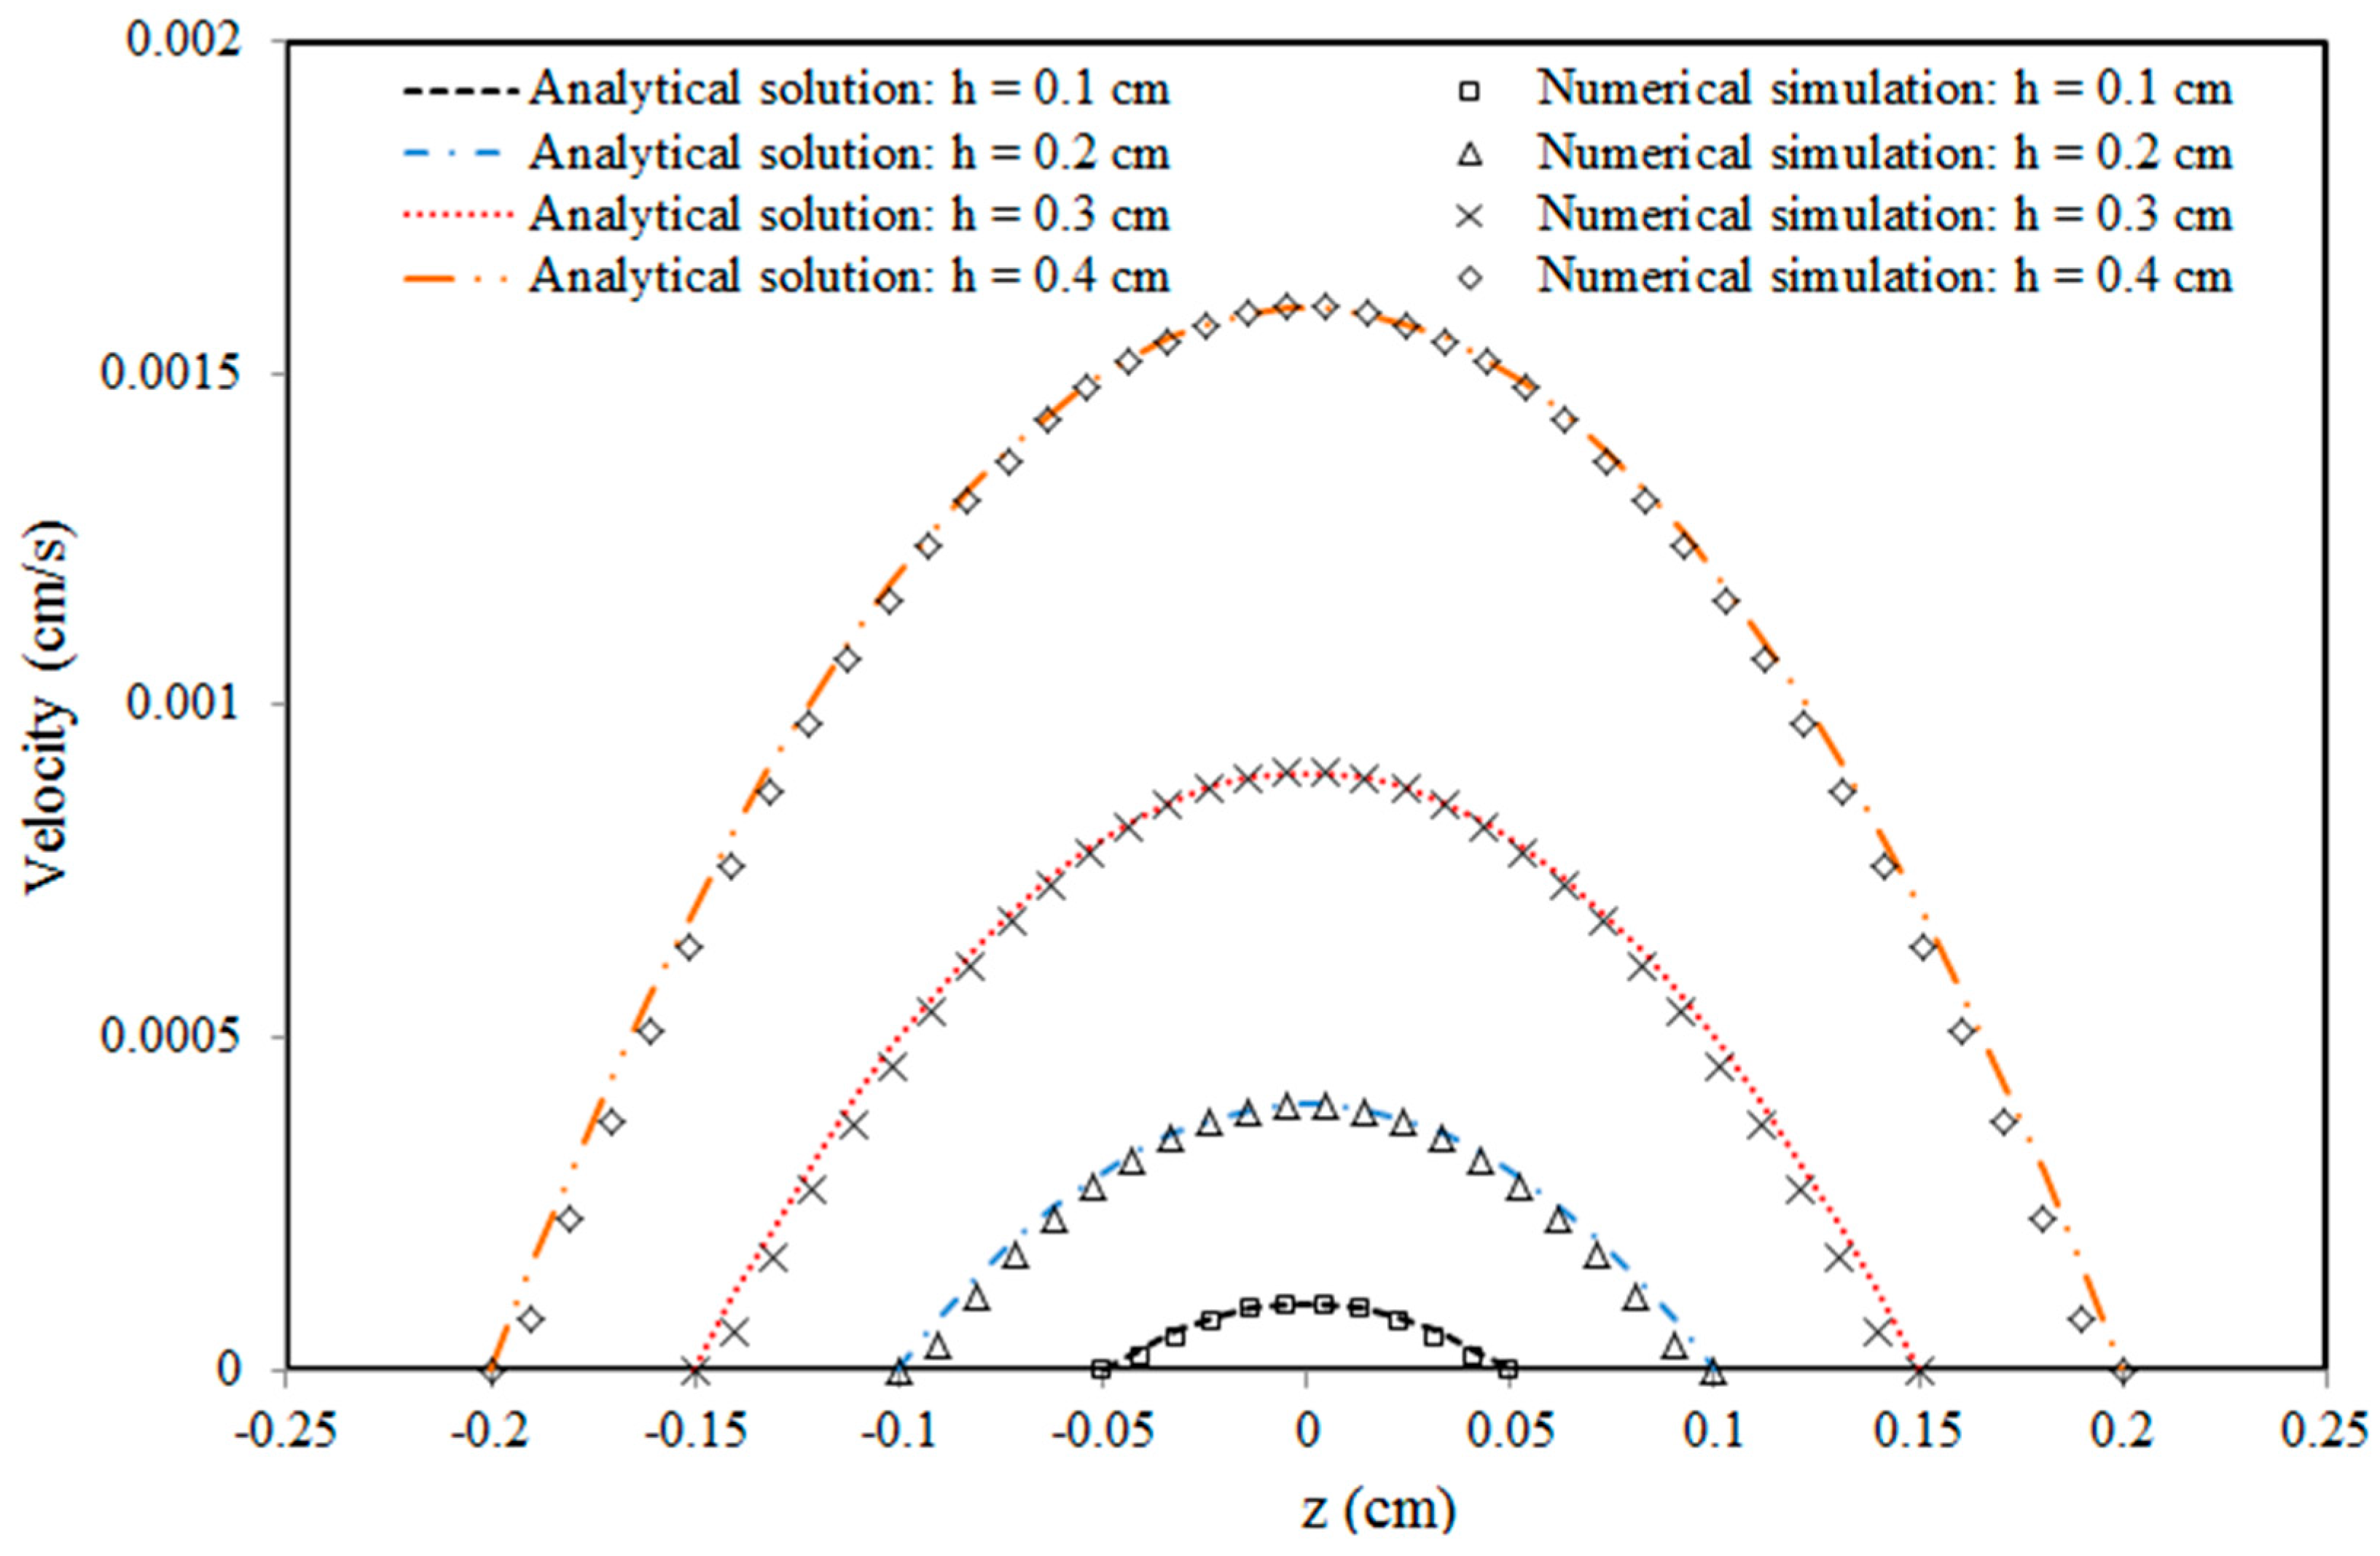
The simplest model of fluid flow through a rock fracture is the parallel plate model [33], in which, the exact theoretical solution can be readily obtained from given boundary conditions. The analytical solution for velocity is expressed as
where is the pressure at outlet and is the pressure at inlet, which lead to the pressure gradient of ; is the density, is the viscosity, is the aperture and is the distance from the center line.
The total volumetric flux through the fracture can be obtained from integrating the velocity across the fracture from z = −h/2 to z = h/2,
where W is the width of the fracture, which equals to 1 for 2D problems.
The permeability of the fracture can be calculated as
where A is the cross-sectional area of the fracture and i is the pressure gradient.
The accuracy of the LBM is validated through the numerical simulation of fluid flow through the parallel plate model. The fracture setup and the boundary condition are the same as the illustration in Figure 3 excepting that the fracture is characterized by two parallel plates. The velocity profiles for the parallel plate model with different apertures are presented in Figure 4, which is compared with the analytical solution in Equation (7), with a good agreement being achieved.
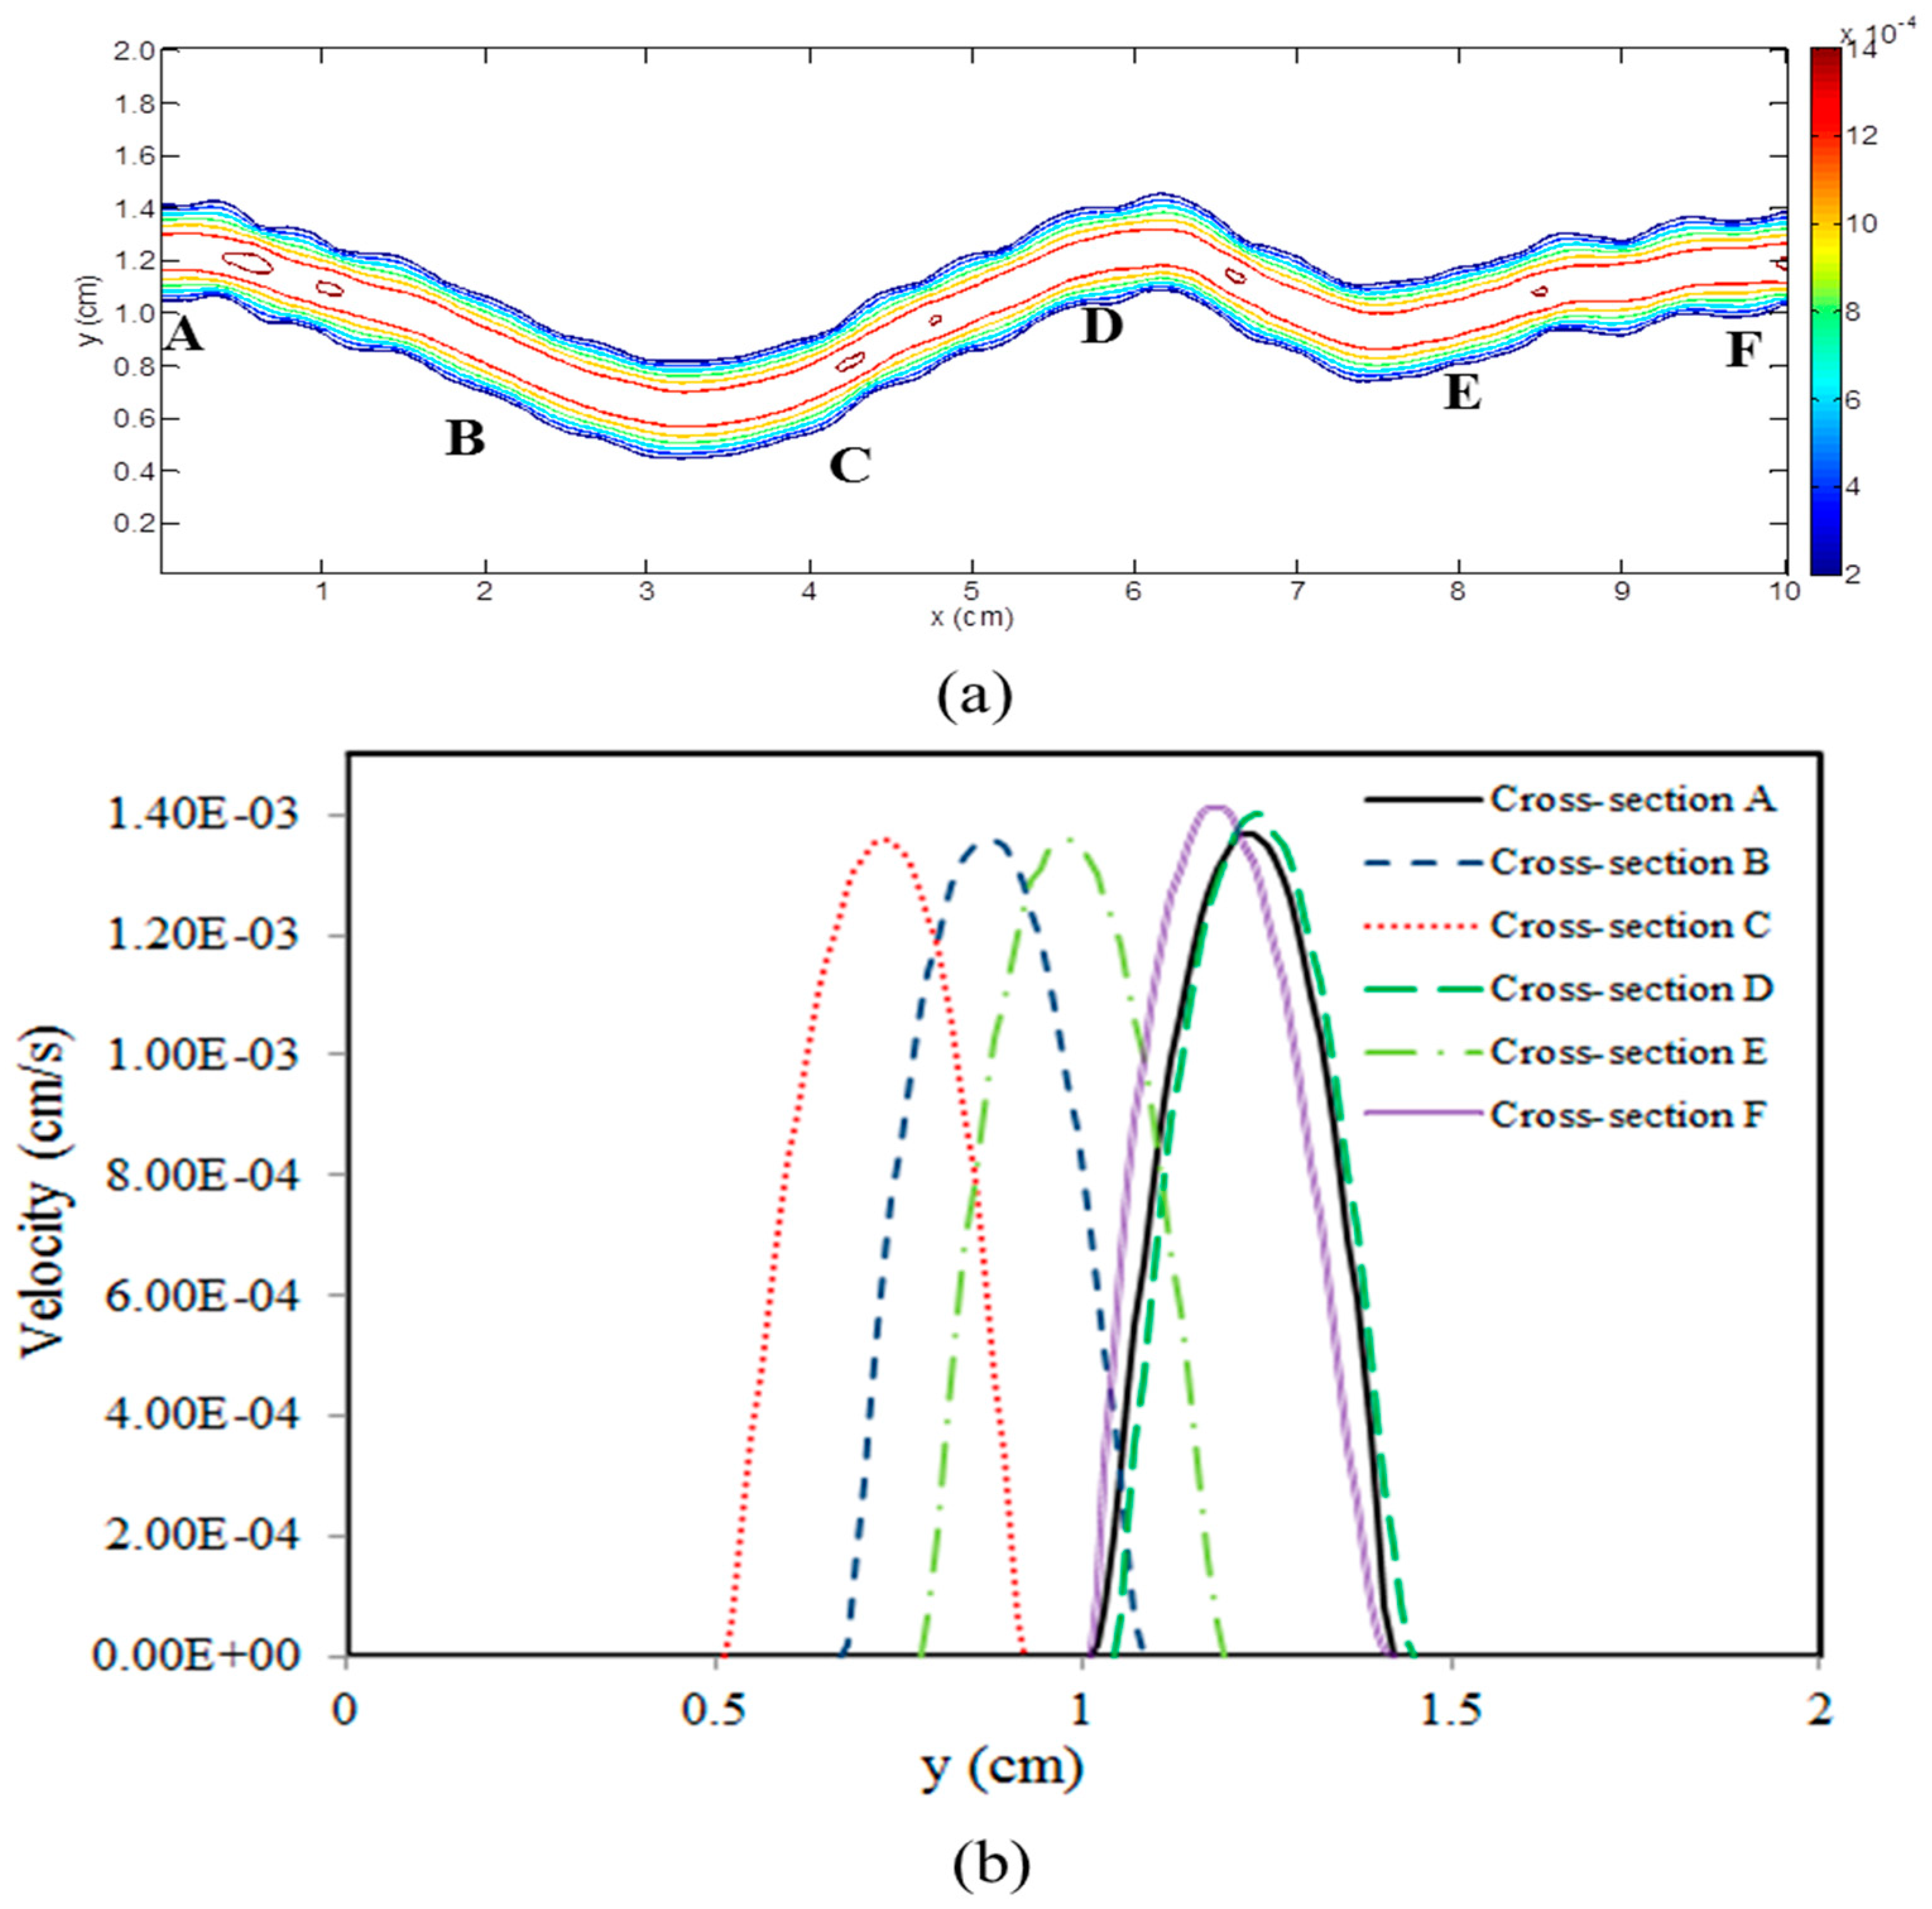
The LBM is further validated for the fluid flow through fractures with roughness, the rough profile with JRC = 17~18 is imported to the LBM, and the aperture is set as 0.4 cm. With the same boundary condition and parameters, the velocity distribution is obtained as shown in Figure 5a, and the velocity profiles at different cross sections (A~E) are monitored, which are presented in Figure 5b.
The total volumetric flux is calculated for each of the cross sections based on the following equation,
where Ny is the number of lattices along the y axis for each of the cross sections and is the velocity along direction x for the lattice at position yi.
It was found that the volumetric fluxes at different positions are calculated as , which indicates that the mass conservation can be perfectly realized through the LBM simulation. Based on the numerical simulation of fluid flow through the parallel plate model and rough fracture model, it is concluded that the LBM is an effective and accurate tool to explore the effect of roughness on the fluid flow through fracture.
3.2. Fluid Flow through a Fractured Model with Roughness
The parallel plate model can only be considered as a qualitative description of fluid flow through real fractures. Real fracture surfaces are often not smooth parallel plates but with roughness, and a number of parameters have been proposed to characterize the fracture roughness, such as the joint roughness coefficient (JRC), tortuosity, fractal dimension (D) and standard deviation (), etc. However, there is no unified parameter that could effectively quantify the influence of roughness on permeability of fractured rock. To this end, the LBM is used to investigate the fluid flow through fracture characterized by different approaches.
3.2.1. Rough Fracture Characterized by the JRC
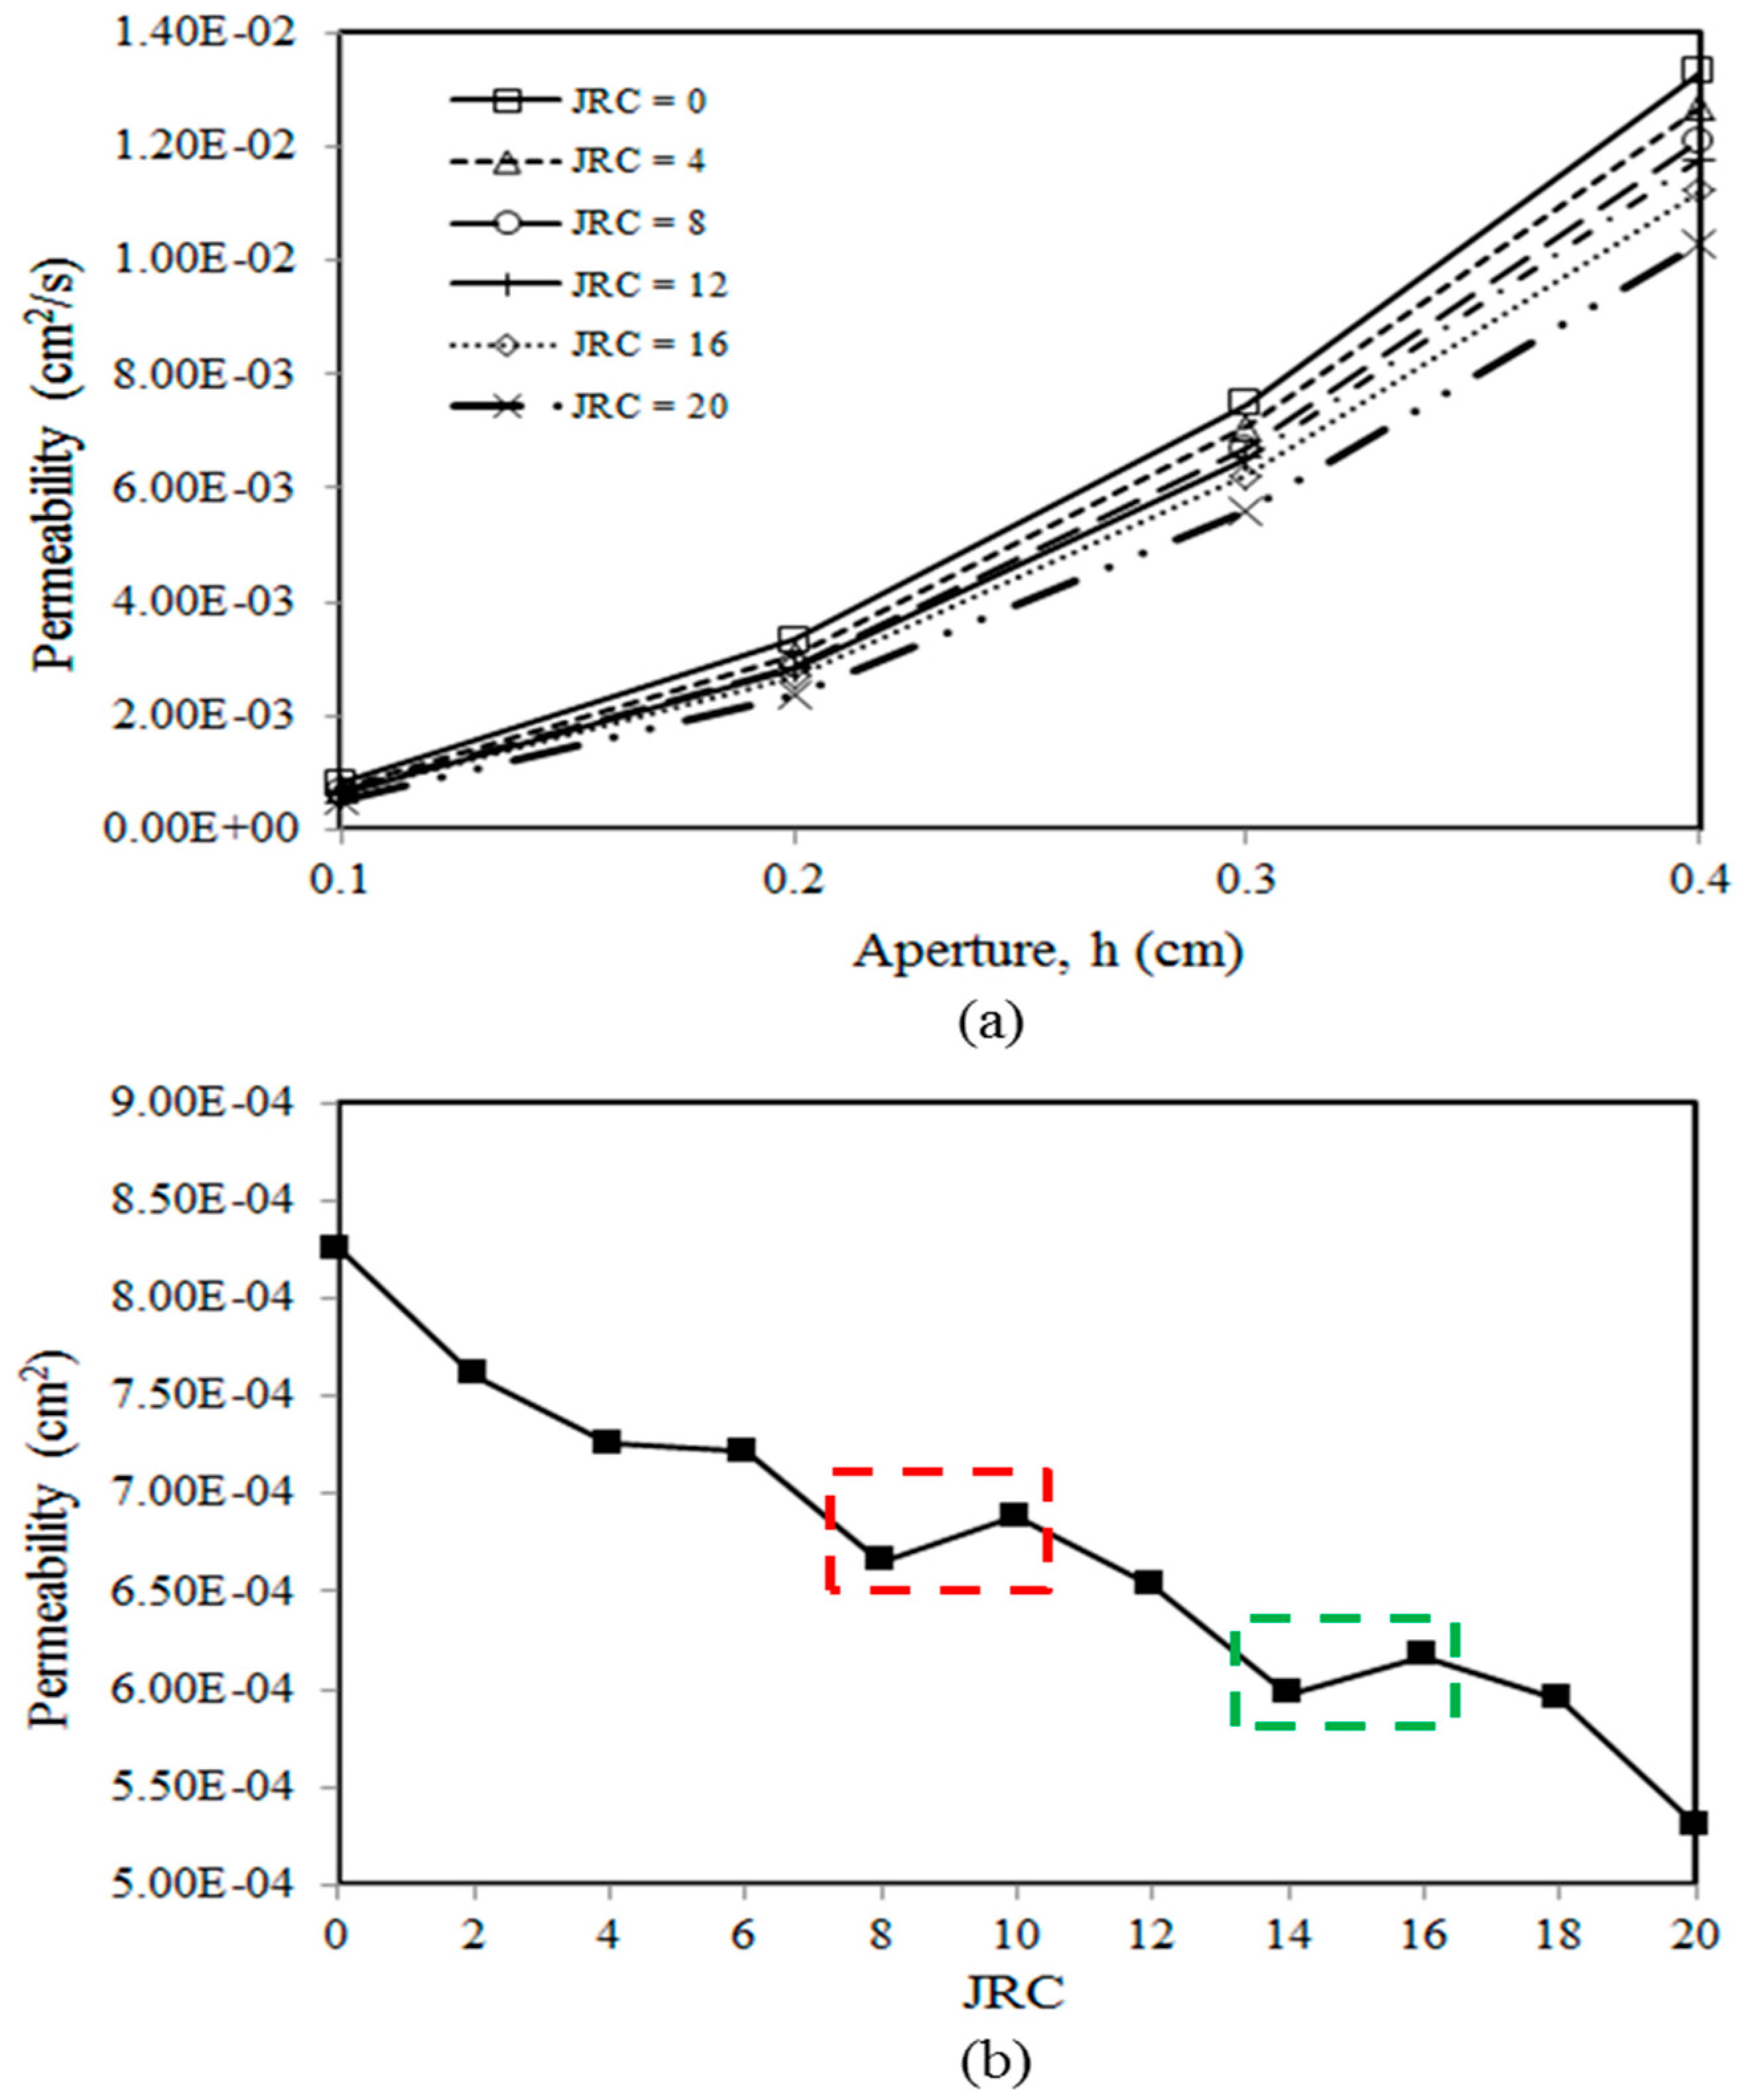
In this part, Barton’s standard profiles are used to generate the fractured model and the permeability for fracture with different JRC and apertures are calculated based on the simulation results, and the selected results are presented in Figure 6a. It was found that the theoretical solution of permeability in Equation (9) can be reproduced by the LBM based on the result of JRC = 0 (parallel plate model). With the presence of roughness, the permeability of single fracture is modified as
where f is the correction factor due to roughness.
Accordingly, f is calculated for each of the simulation results, which is presented in Figure 6b. It was found that the correction factor decreases with the increase in the JRC and increases with aperture. However, it is noticed that an unrealistic trend has been observed in the red and green rectangular zones from Figure 6b, in which, a larger JRC value presents a higher correction factor (or permeability).
It is widely known that the JRC is obtained through the comparison between the given profile and standard profile which requires experiences, and sometimes, it is observation dependent. It is reasonable to give the conclusion from Figure 6b that the JRC is perhaps not an ideal choice for the characterization of fluid behavior in fractured rock. Therefore, it is necessary to explore a more reasonable and accurate parameter that could reflect the real behavior of fluid flow through rough fracture.
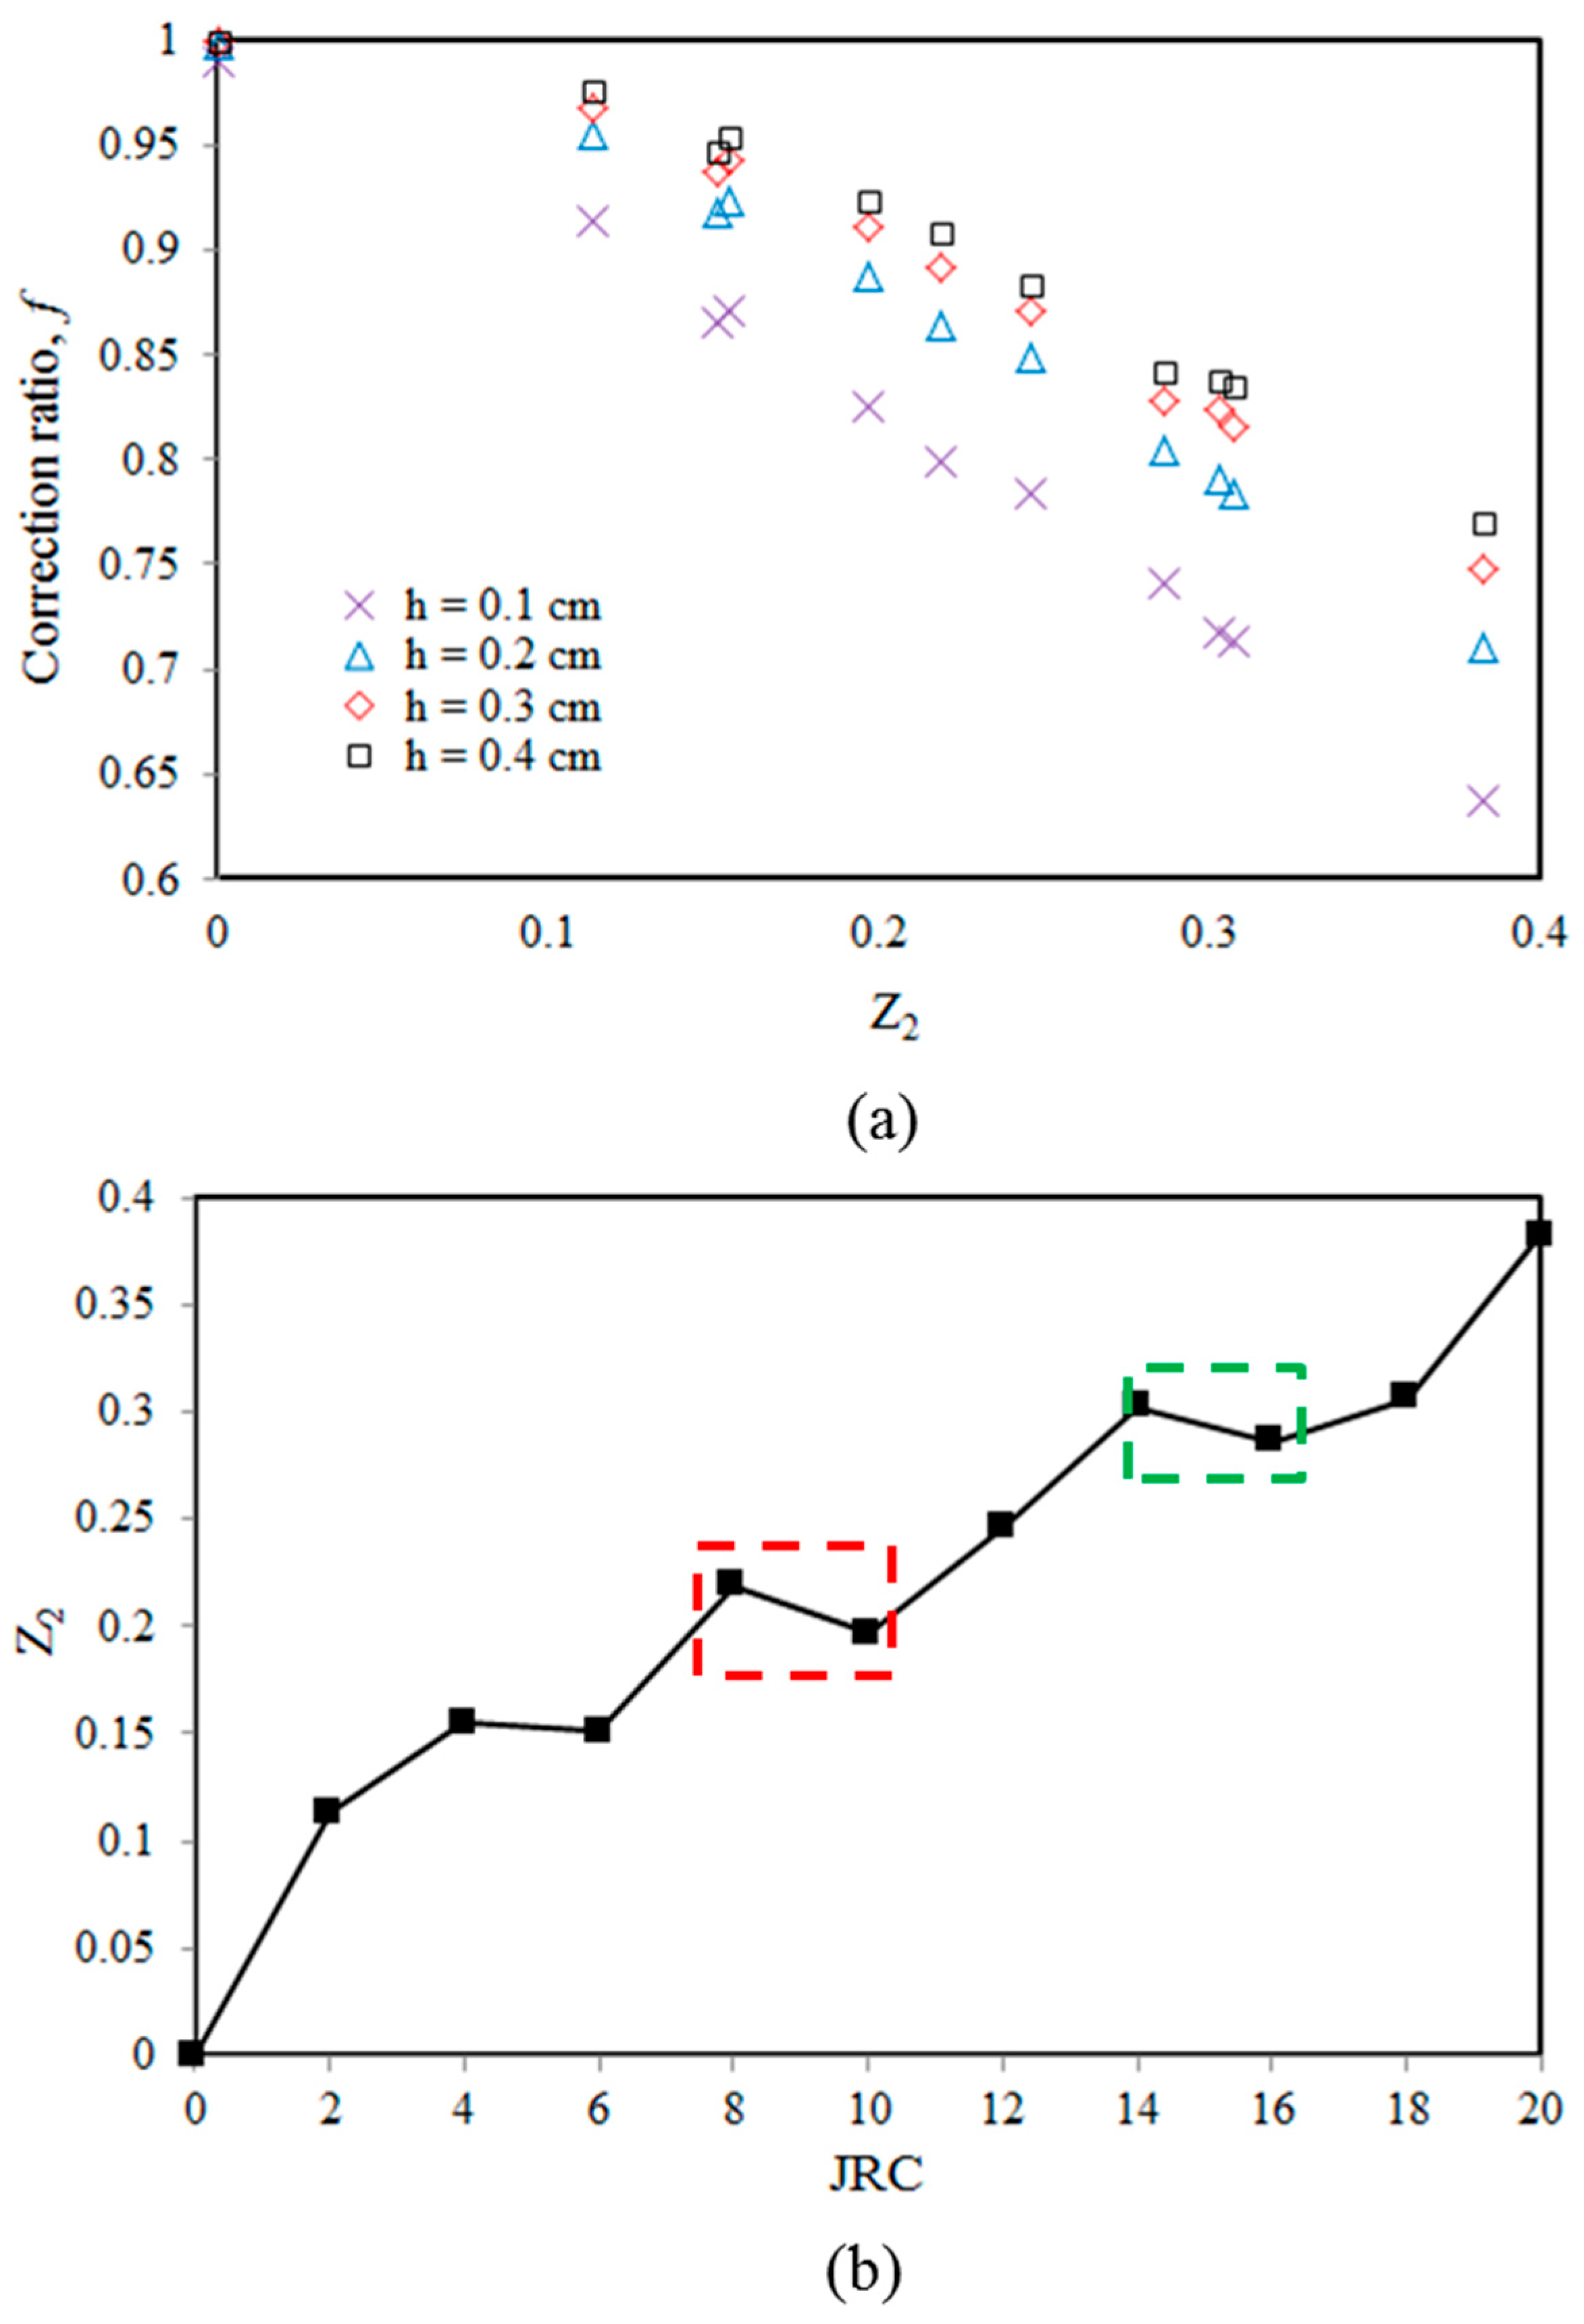
Inspired by the work by Myers [34], the root mean square of the first derivative of profile (Z2) is adopted, which is expressed as
where L is the length of profile, N is the number of segments, δx is the horizontal distance between the adjacent points (L/N), and yi is the height of the discrete point.
It is clear from Equation (12) that the value of Z2 depends on the selection of point interval (∆x), which should be chosen to reflect the real roughness of profile. According to the work by Li and Zhang [35], ∆x generally varies from 0.25 to 1.27 mm. To this end, ∆x = 0.5 mm is used to obtain the reasonable Z2 for profiles with different JRCs as presented in Figure 7a, which shows the reverse trend compared with Figure 6b. It is reasonable to conclude that Z2 is a more reasonable parameter to quantify the correction of cubic law. To this end, the correlation between f and Z2 is demonstrated in Figure 7b, and an obvious decrease in f with Z2 has been observed.
Based on the trend shown in Figure 7b, the following equation is proposed to reflect the effect on roughness on the permeability of fracture,
where is the parameter that reflects the influence of roughness on the permeability of single fracture, which is given as −0.35 with confidence interval of (−0.37, −0.32) and R-square of 99.76%.
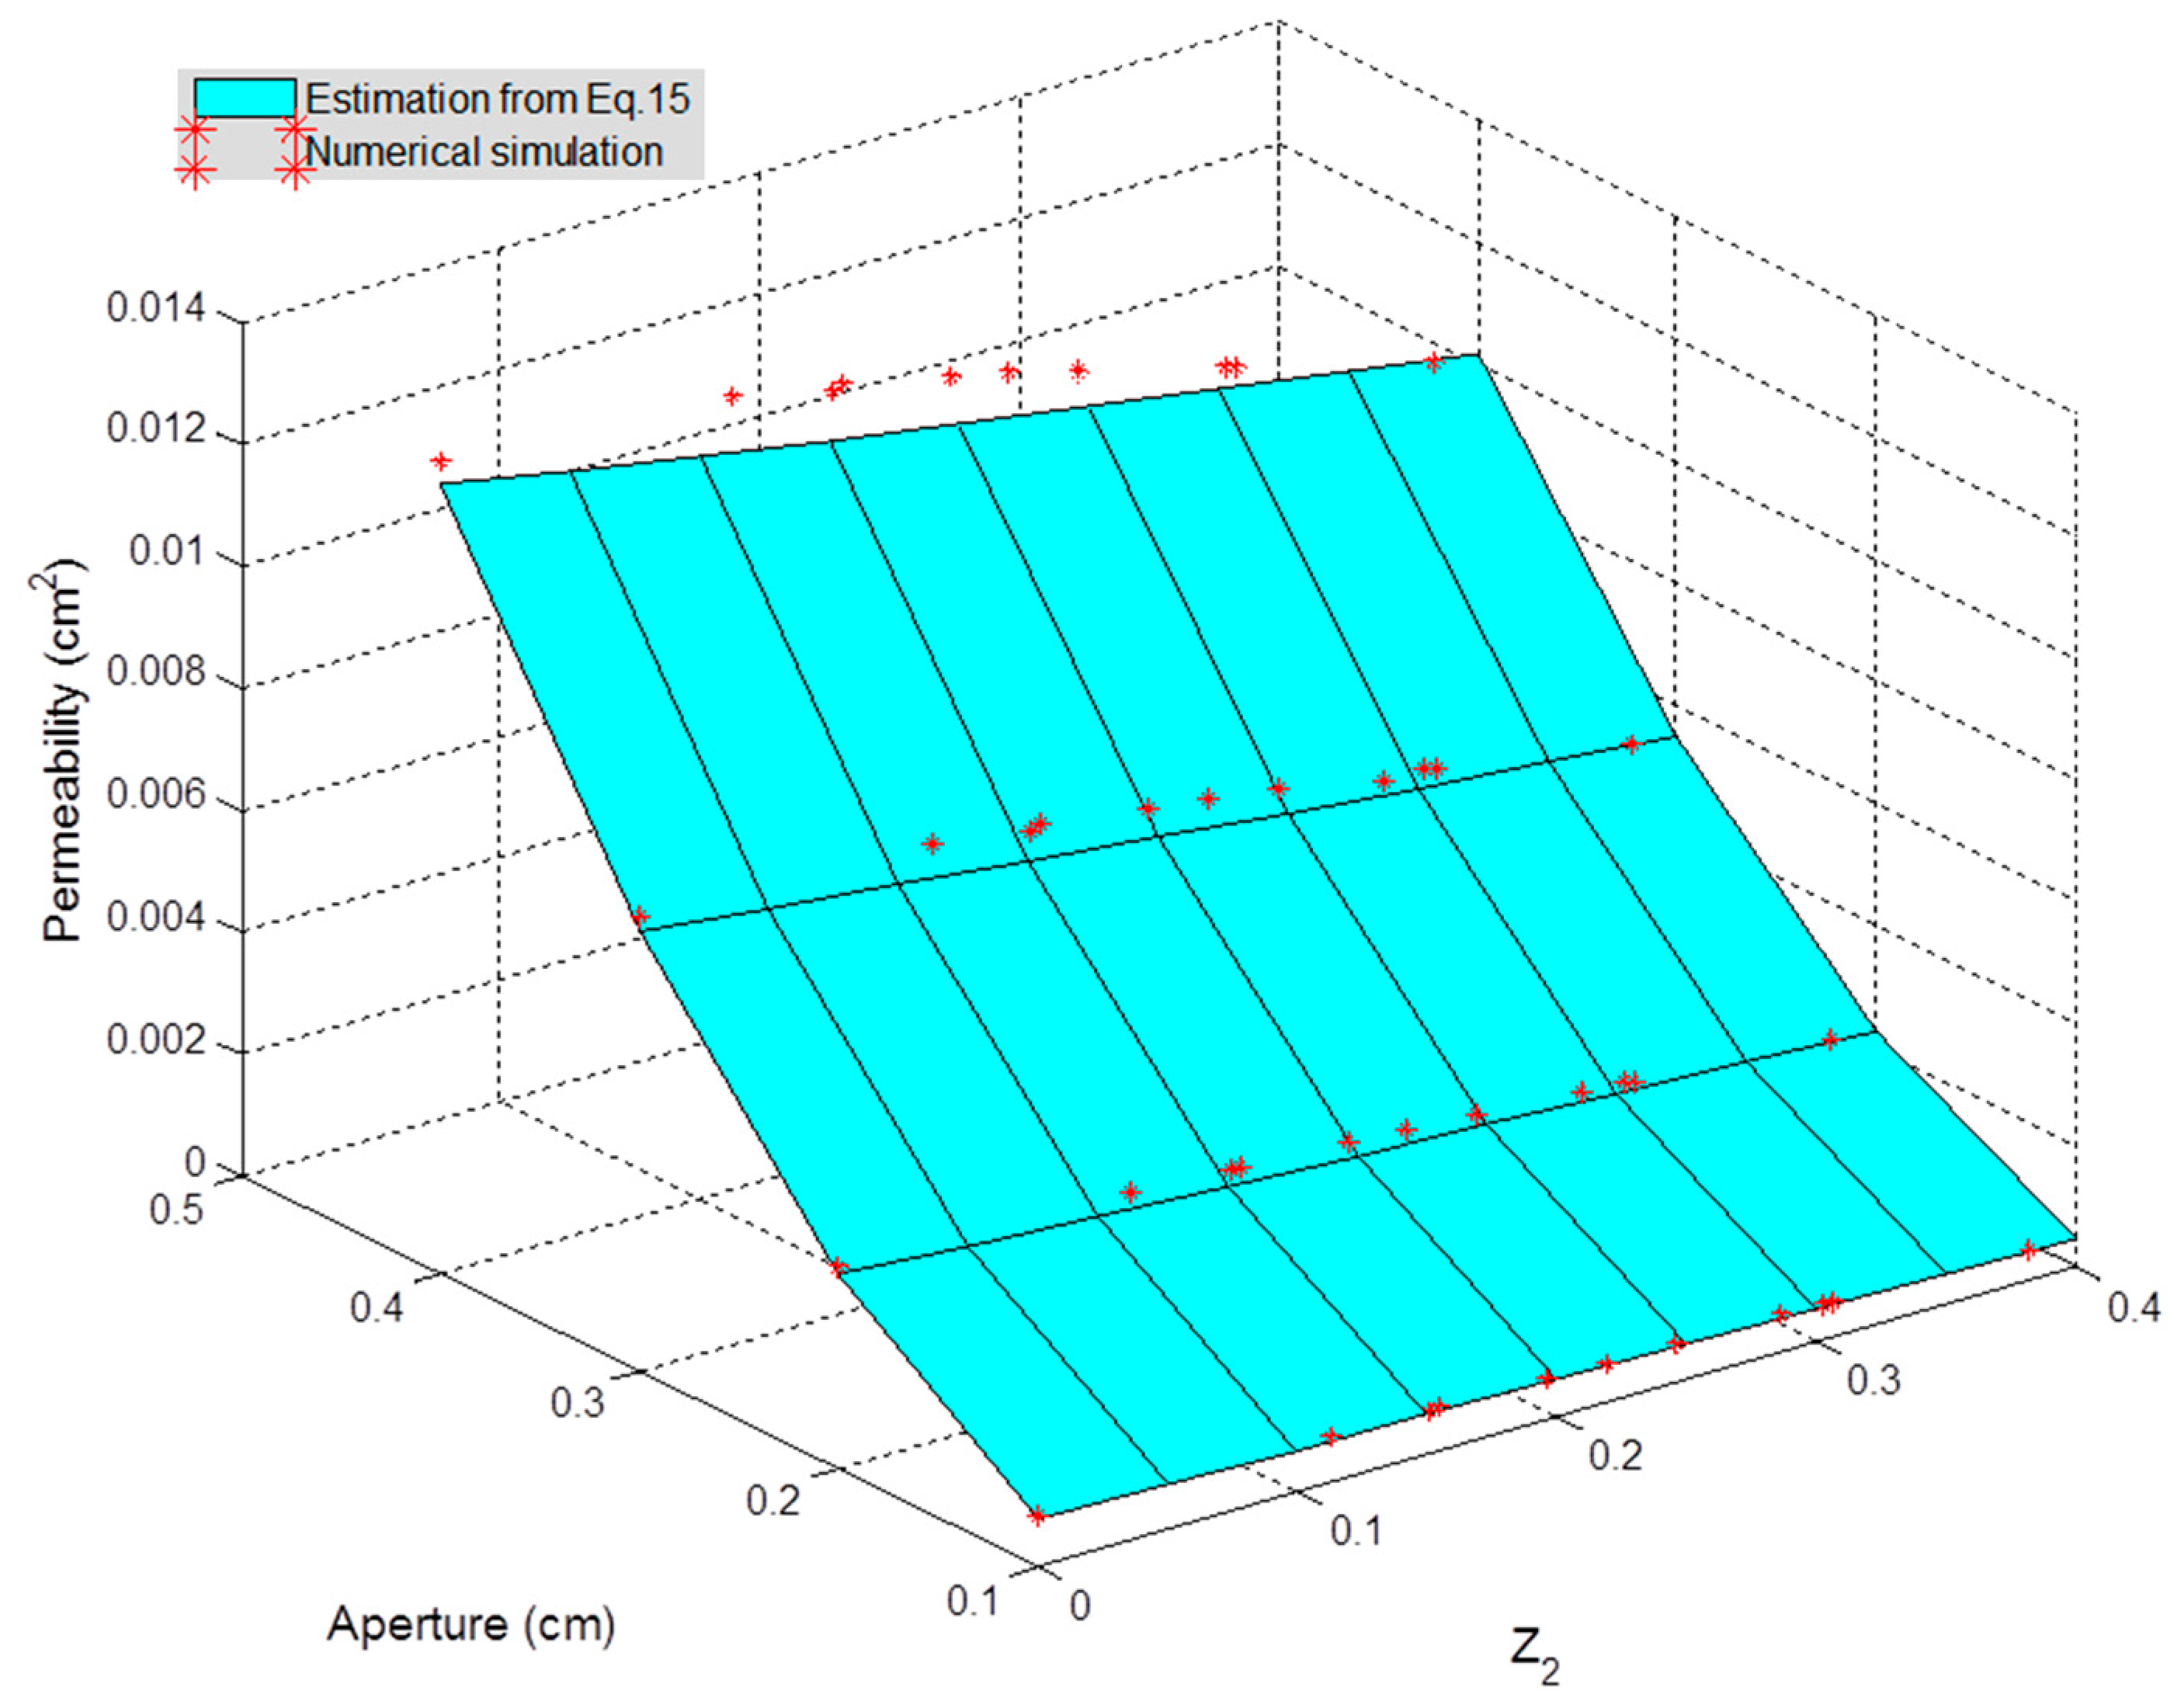
To this end, the relationship between permeability, Z2 and aperture is summarized in the k-Z2-h space in Figure 8, and a good agreement has been observed from the comparison between the numerical simulation and the proposed equation.
3.2.2. Rough Fracture Characterized by Fractal Dimension and Standard Deviation
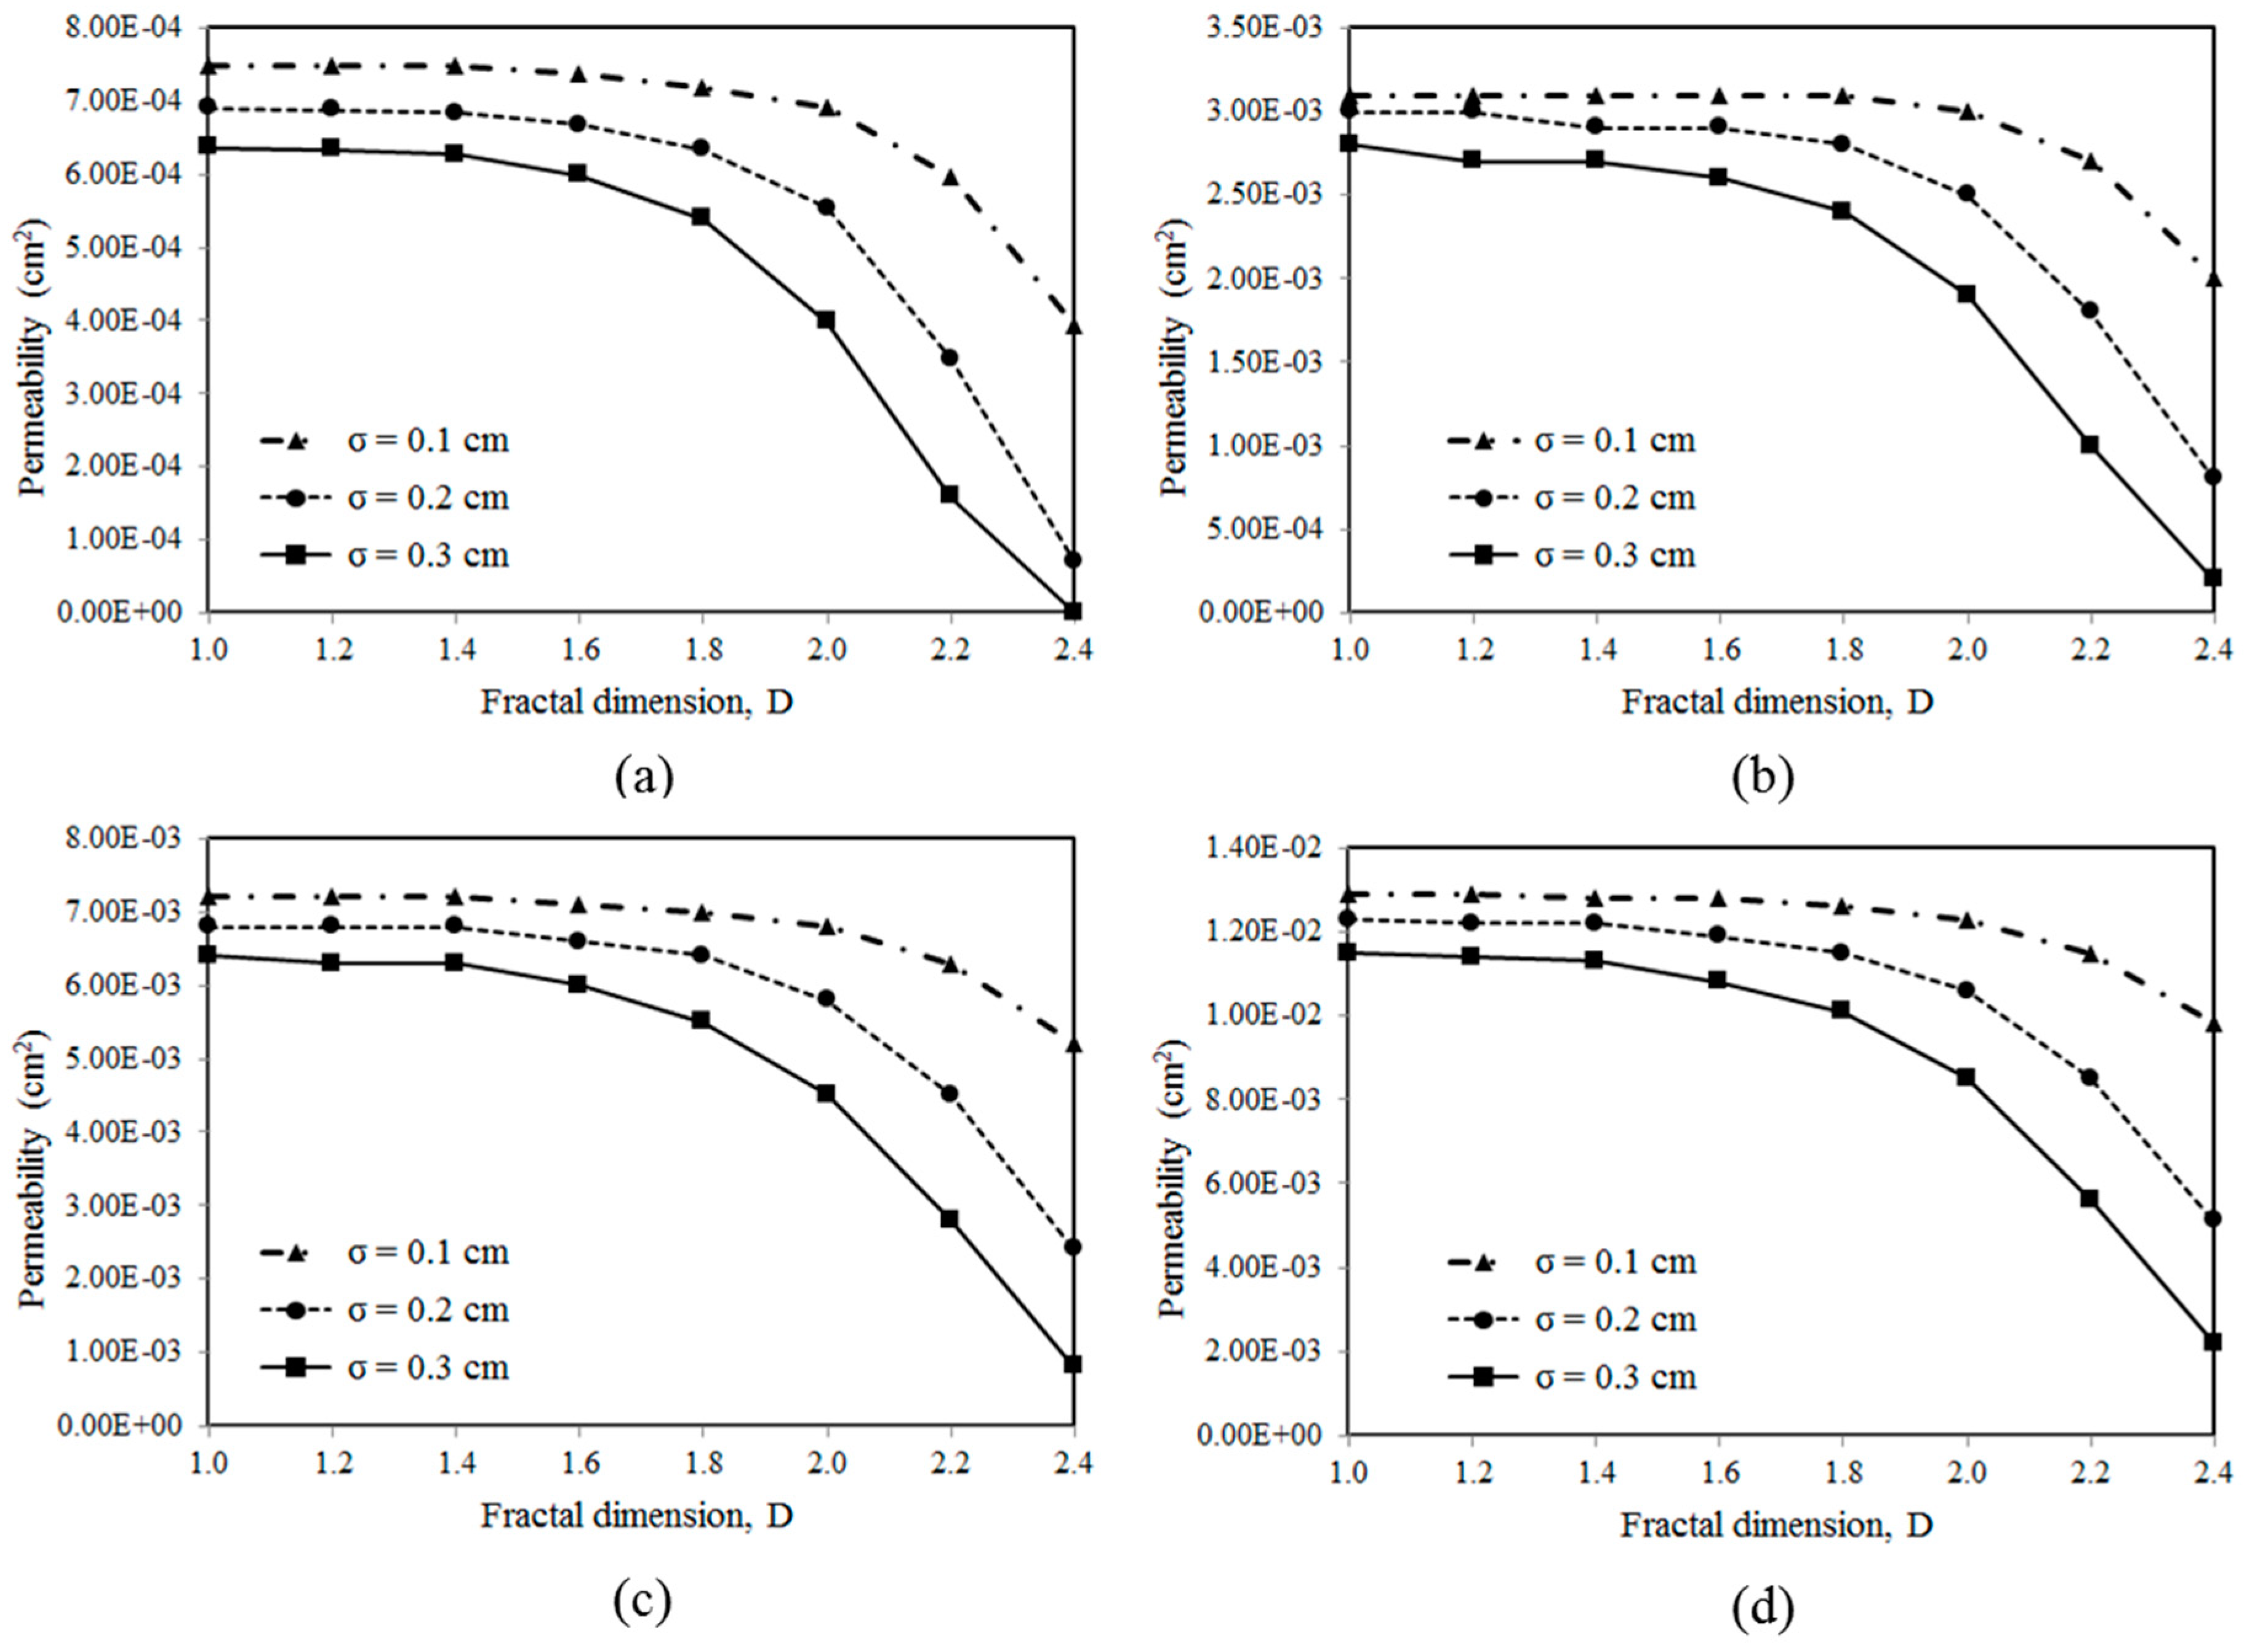
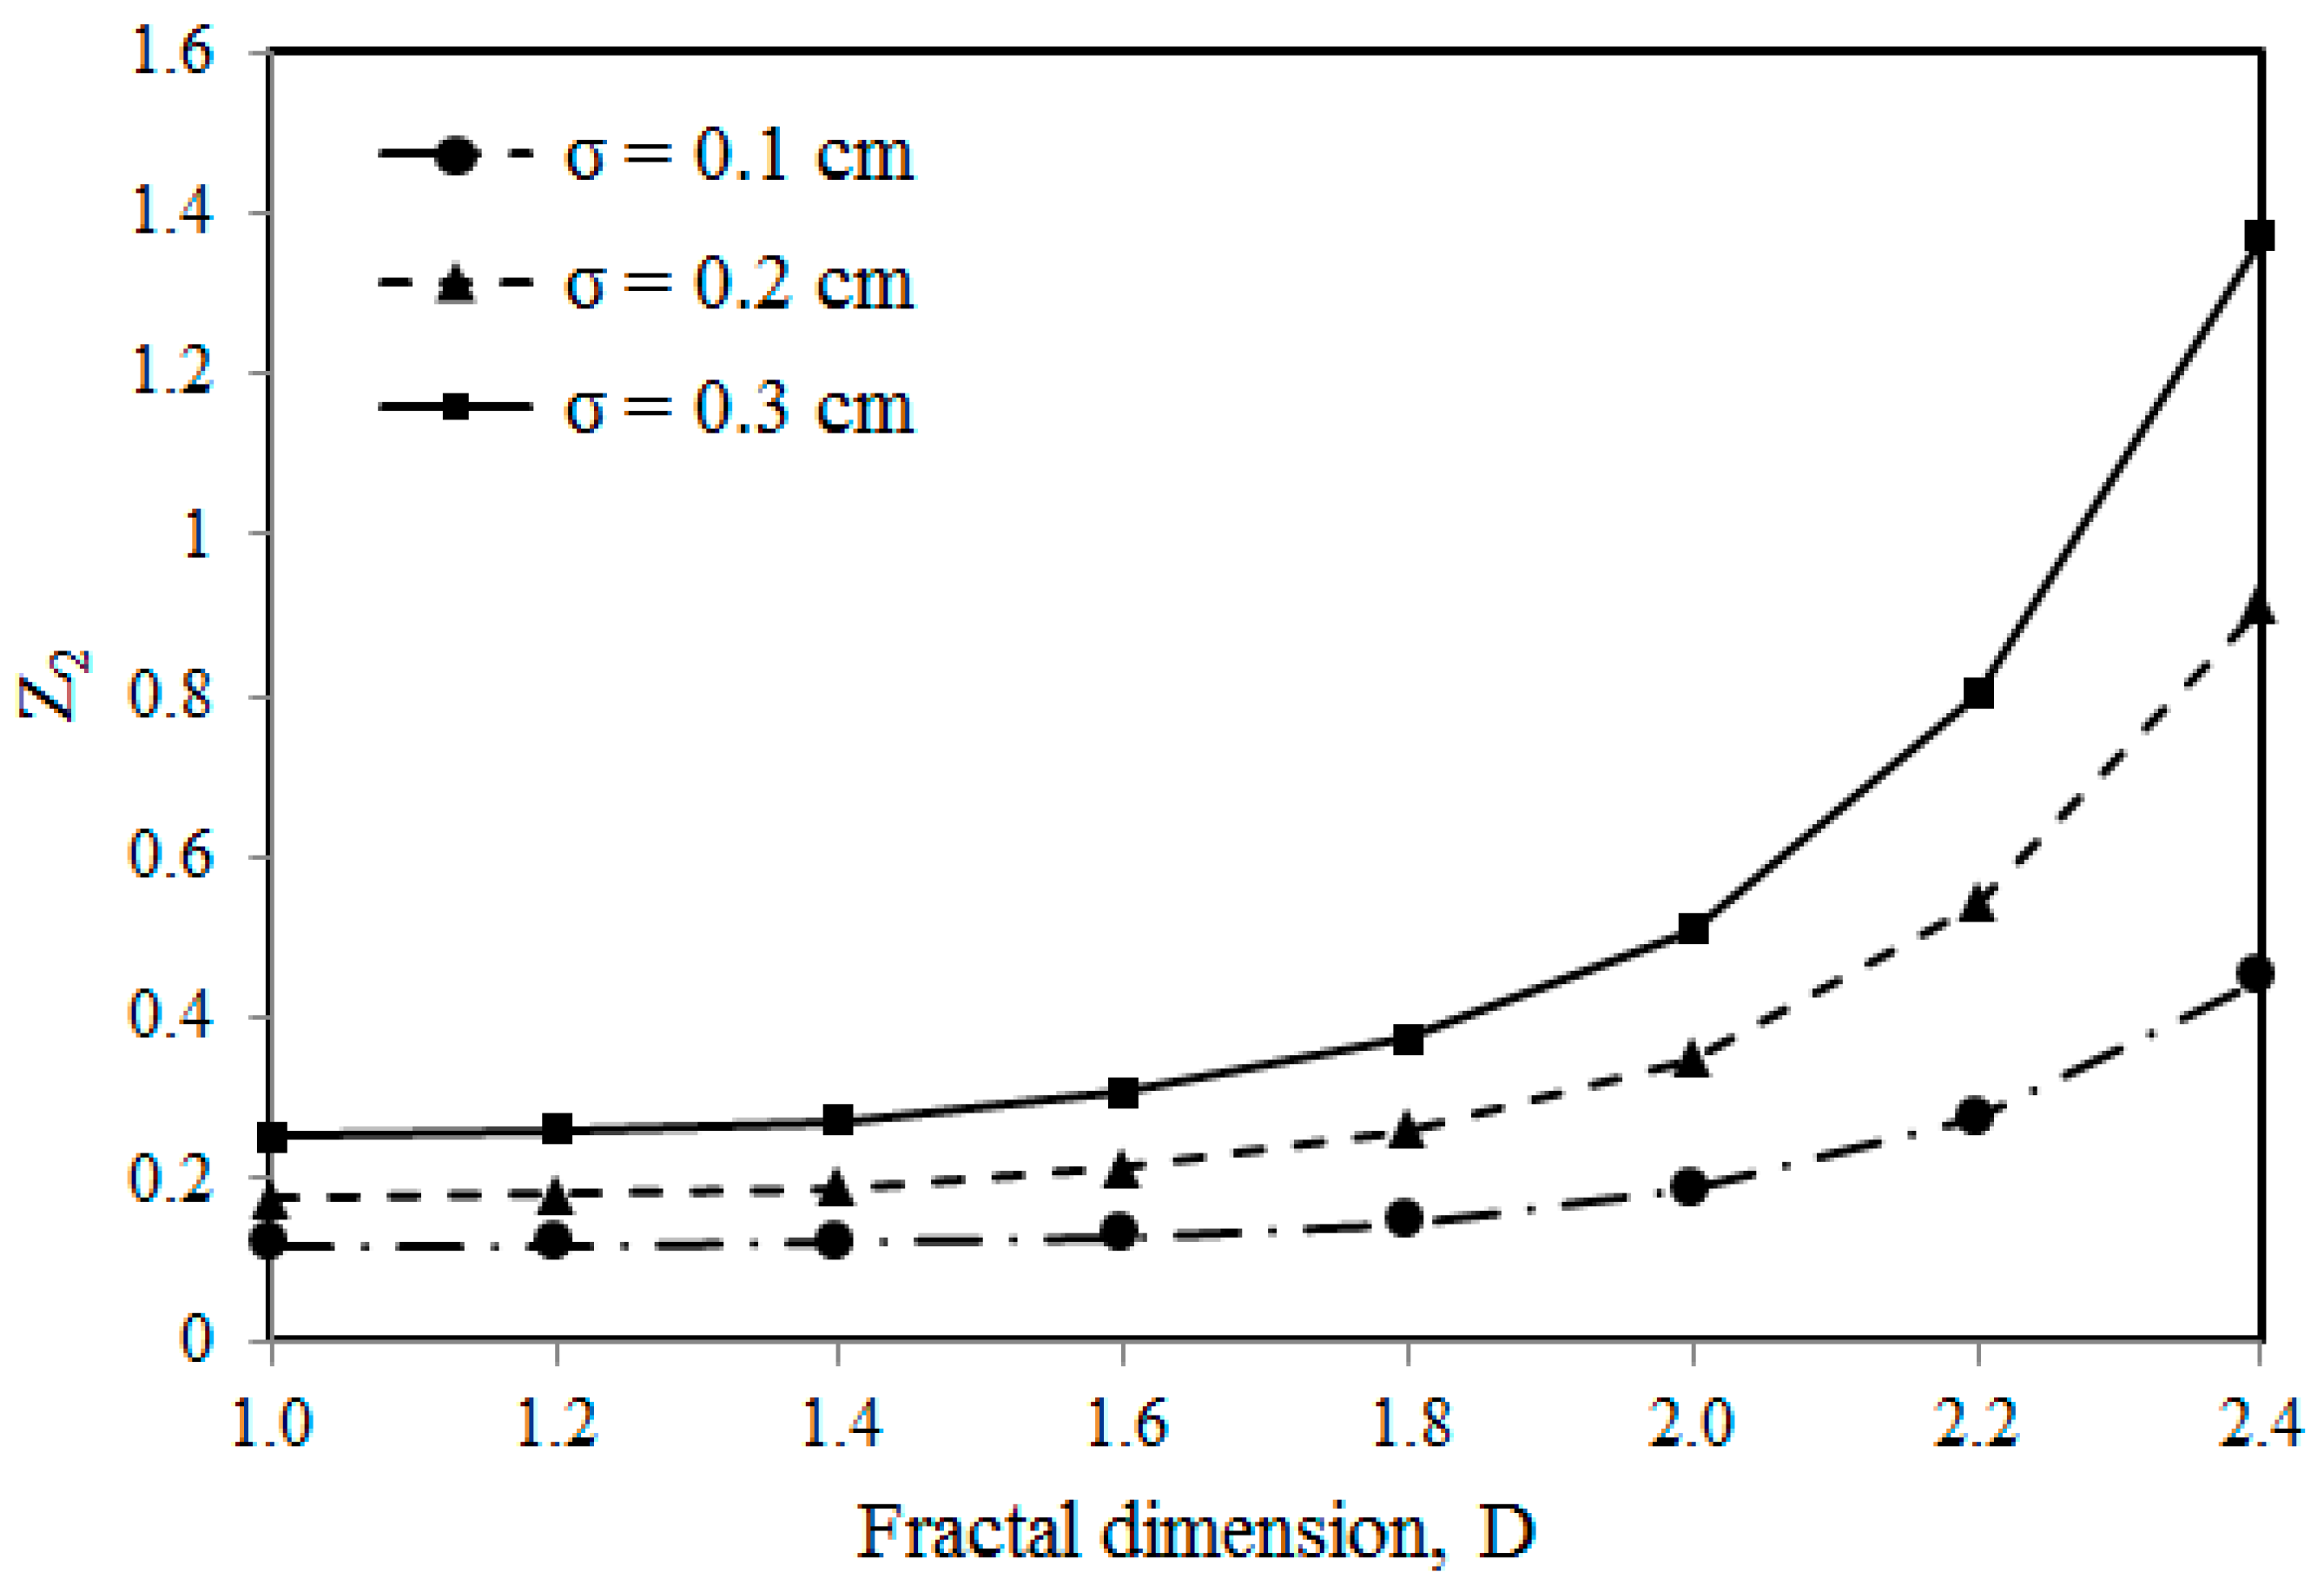
In this part, the synthetic fracture is generated based on the geometric parameters listed in Table 2, and the numerical simulations on corresponding fractured model are conducted through LBM. The boundary condition and parameters used in the numerical simulation are set the same as previous part. The permeability is calculated for different profiles at different apertures as presented in Figure 9, and it is clear that the permeability decreases with the increase in fractal dimension and standard deviation.
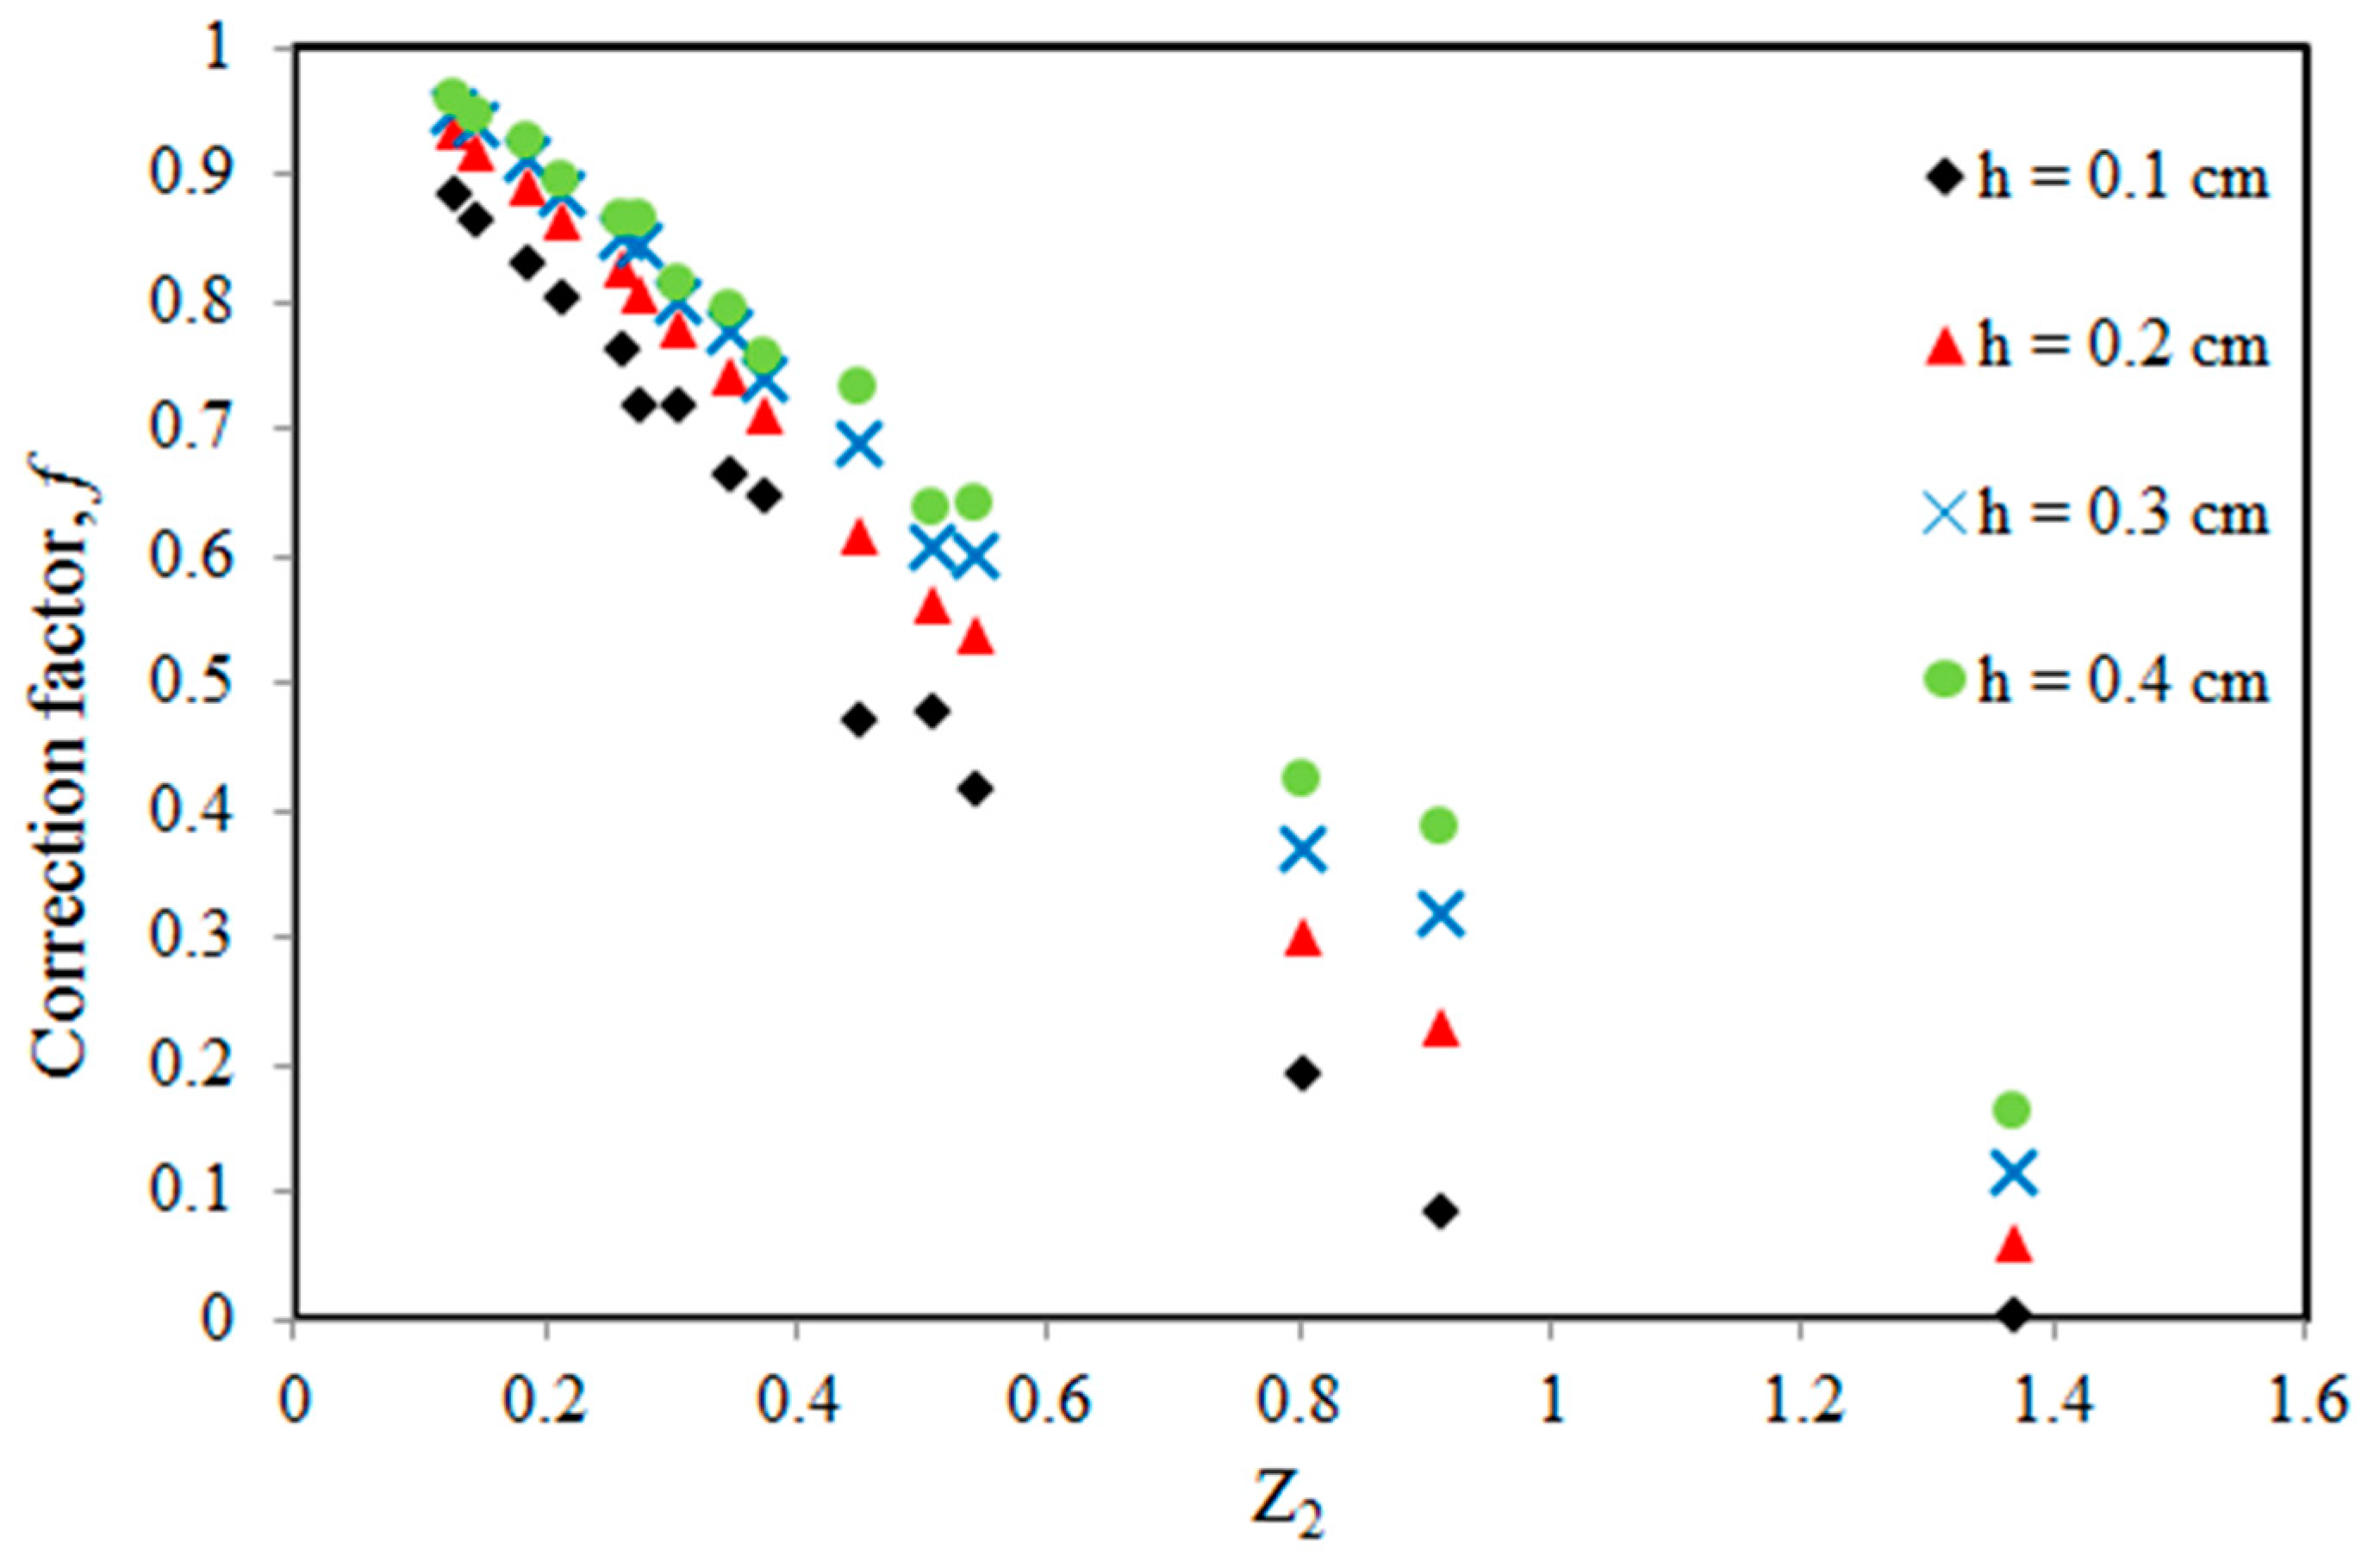
Recall that Z2 is an effective parameter to estimate the permeability of single fracture with roughness. To validate the proposed equation, Z2 is calculated for each of the synthetic profiles, and the relationship between Z2 and fractal dimension is presented in Figure 10. Accordingly, based on the numerical results in Figure 9, the relationship between correction factor, aperture and Z2 is summarized in Figure 11, and a decrease trend of the correction factor with increasing Z2 being observed for apertures varies from 0.1 and 0.4 cm.
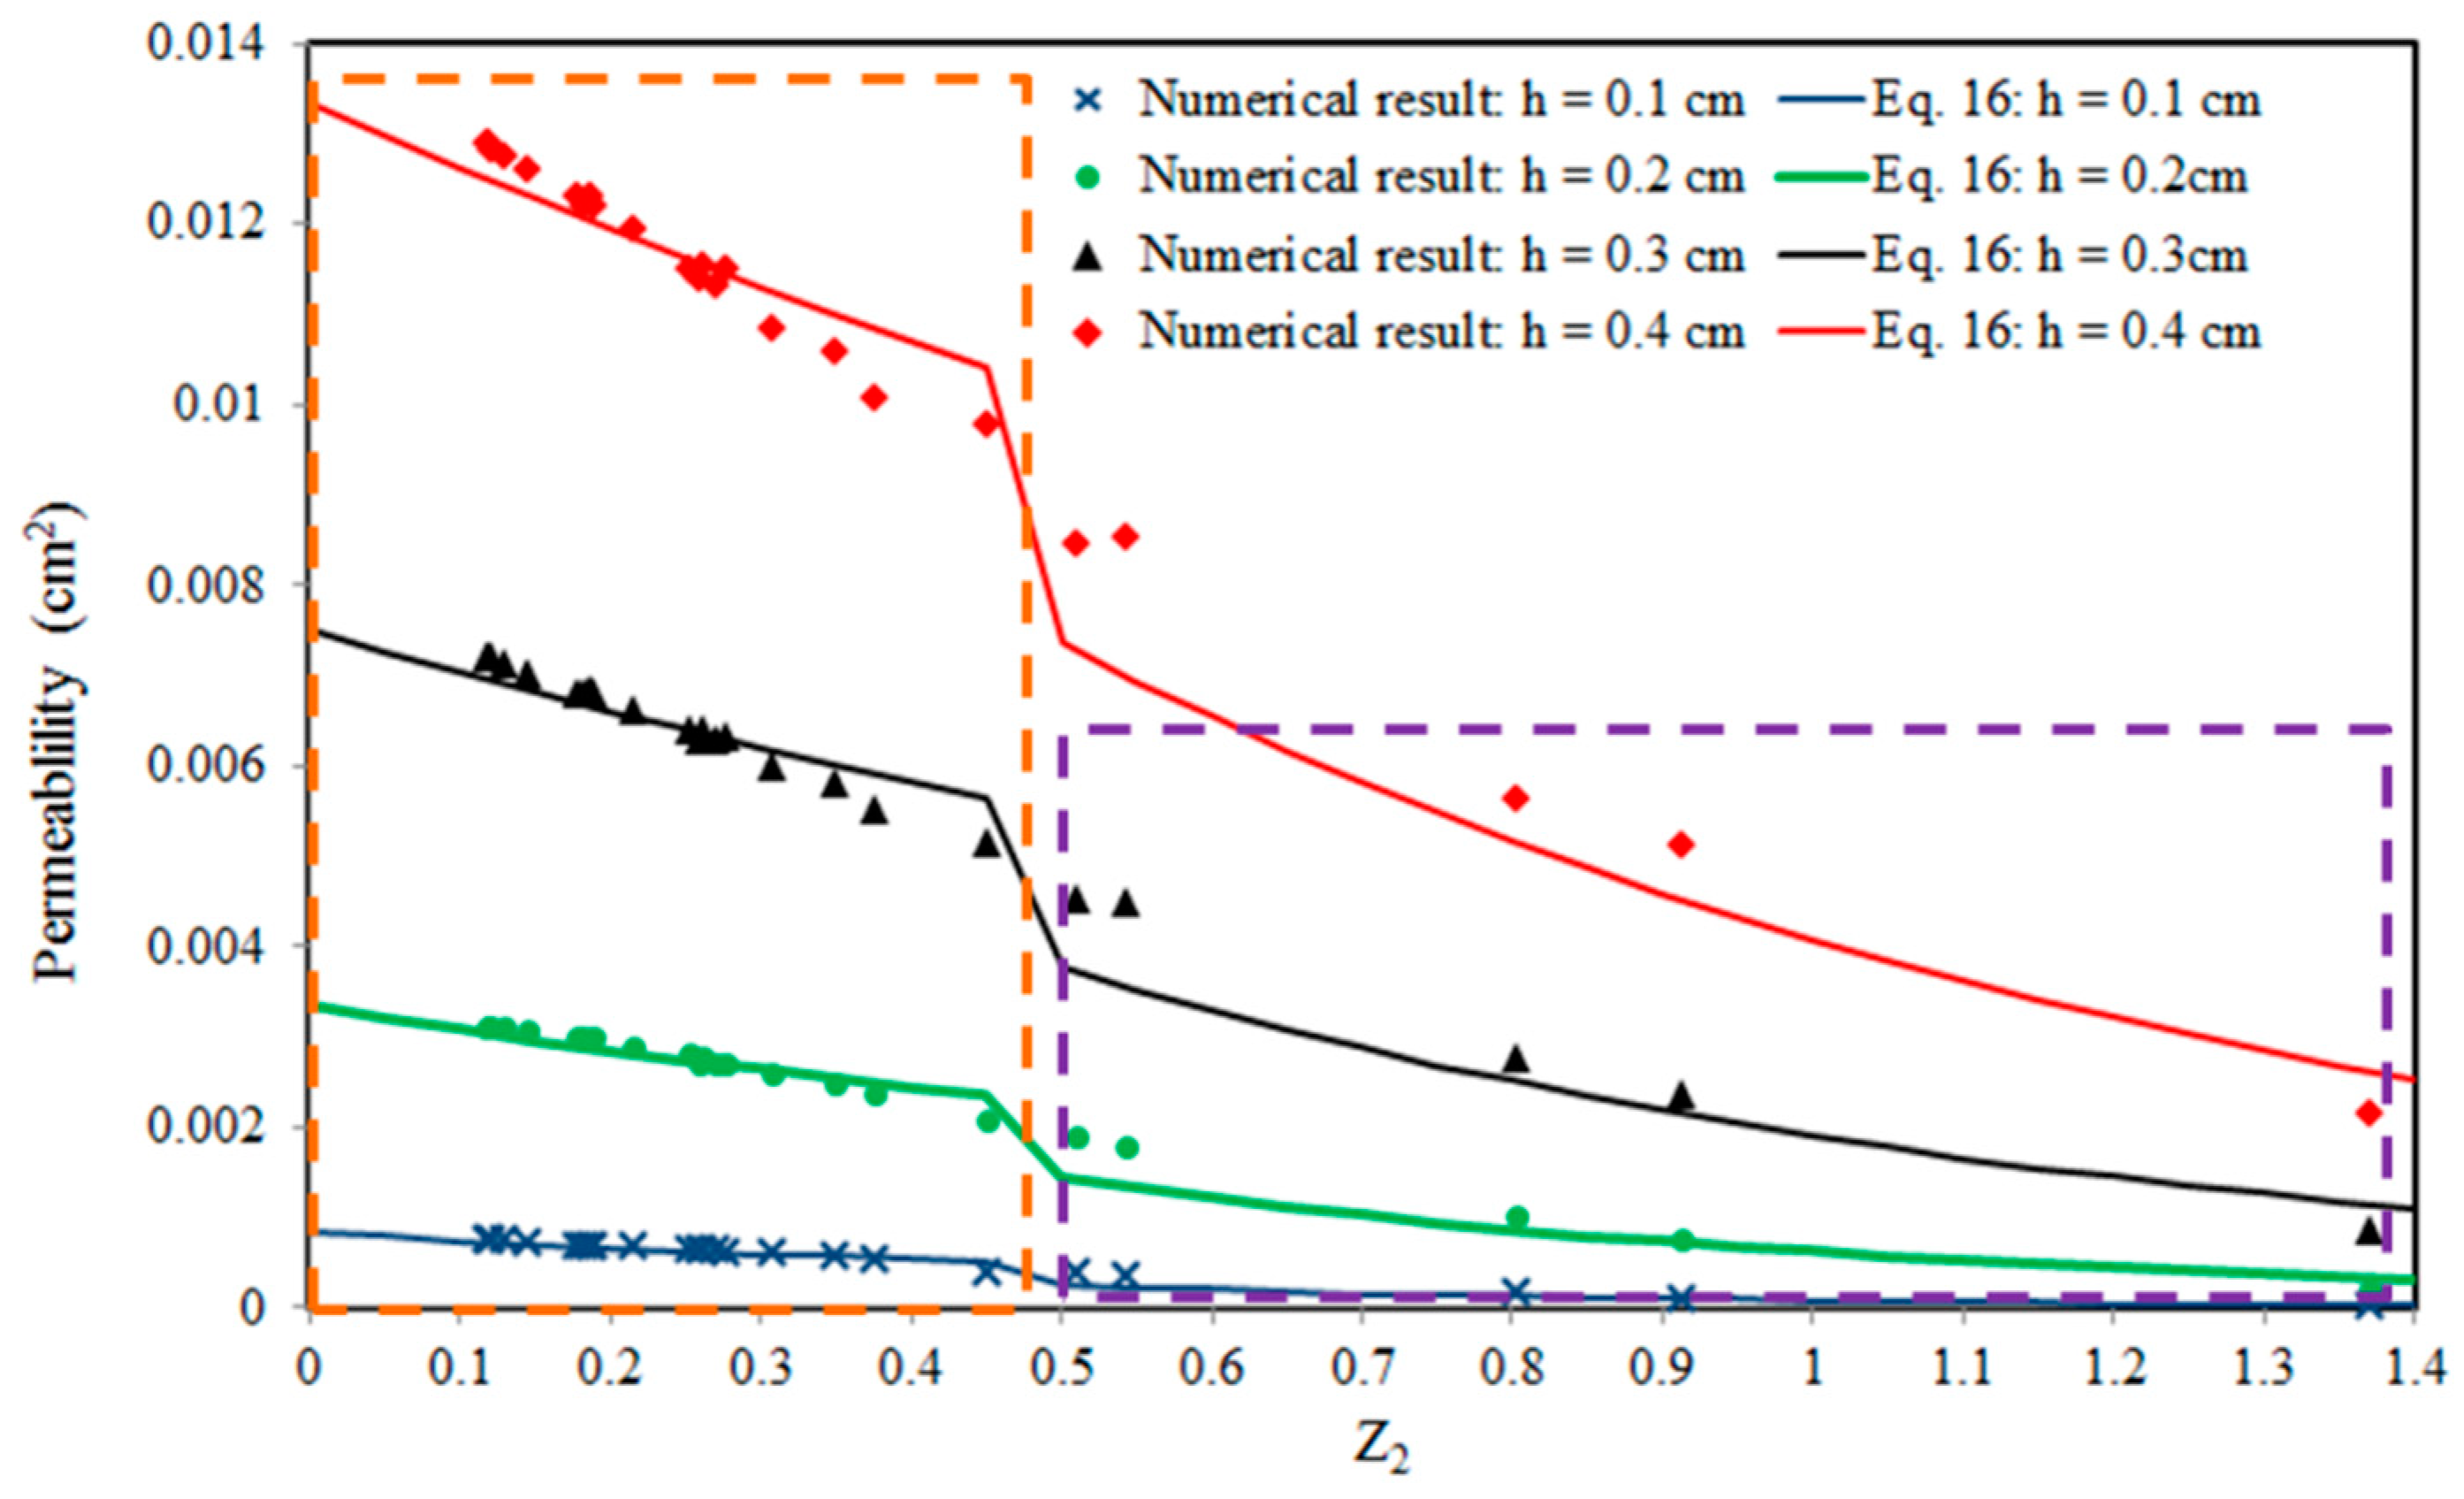
Meanwhile, Equation (15) is used to predict the permeability of fractures characterized by fractal dimension and standard deviation. It was found that a good agreement has been obtained in the range from Z2 = 0 to Z2 = 0.5. When Z2 is larger than 0.5, a large deviation of the numerical results from the prediction has been observed. It should be mentioned that the proposed equation is obtained from the result of fluid flow through fracture characterized with Barton’s profile, where Z2 varies from 0 to 0.4 as demonstrated in Figure 7a. Therefore, Equation (15) with is not applicable for the fracture geometry with Z2 > 0.5. To validate the generic feature of the proposed equation, the curve fitting is conducted for the numerical result of Z2 > 0.5, and is obtained as −0.75. To this end, Equation (15) can be modified as,
Accordingly, the numerical results are compared with Equation (16), and excellent agreement has been obtained, which is presented in Figure 12. It was also concluded that the fluid flow behaves differently for and , and the proposed equation is capable to predict the permeability for rough fracture with desirable accuracy.
4. Conclusions
Based on the numerical study of fluid flow through fractures characterized by the joint roughness coefficient, fractal dimension and standard deviation, it was found that the lattice Boltzmann method is an effective tool to solve the fluid flow problem with a complex boundary condition at desirable accuracy. The following conclusions can be drawn:
- (1)
- The JRC is not an ideal choice to characterize the fluid flow in fractures and the permeability increases with the JRC at the values of 8~12 and 14~16, which is inconsistent with the roughness characterization.
- (2)
- The root mean square of the first derivative of profile (Z2) is found to be an effective parameter that shows good agreement between the roughness and permeability, and the correction factor increases with aperture and deceases with roughness represented by Z2.
- (3)
- An equation with a simple form has been proposed to estimate the permeability from aperture and Z2, and the applicability of the proposed equation is also validated from fluid flow in a synthetic fracture of a wide range of fractal dimensions and standard deviations.
- (4)
- The critical value of Z2 (0.5) on the estimation of permeability in fractures has been obtained, and the proposed equation has been improved to characterize flow behavior at a large degree of roughness.
Author Contributions
Conceptualization, P.Y. and L.H.; methodology, J.M.; software, C.Z.; validation, J.M., C.Z. and P.Y.; formal analysis, L.H.; Writing—Original Draft preparation, P.Y.; Writing—Review and Editing, L.C.H.
Funding
This work is supported by National Natural Science Foundation of China (NSFC, NO. 51708564 and 51678578), China Postdoctoral Science Foundation (No. 2017M613031), Guangdong Natural Science Foundation (GNSF, NO. 2016A030313233), Guangzhou Science & Technology Program (GSTP, NO. 201704020139), and Central Universities of China (No. 310821171010). The financial support is gratefully acknowledged.
Conflicts of Interest
The authors declare no conflict of interest.
References
- Lomize, G.M. Flow in Fractured Rocks; Gosenergoizdat: Moscow, Russian, 1951. [Google Scholar]
- Louis, C. A study of groundwater flow in jointed rock and its influence on the stability of rock masses, Imperial College. Rock Mech. Res. Rep. 1969, 10, 1–90. [Google Scholar]
- Witherspoon, P.A.; Wang, J.S.Y.; Iwai, K.; Gale, J.E. Validity of Cubic Law for fluid flow in a deformable rock fracture. Water Resour. Res. 1908, 16, 1016–1024. [Google Scholar] [CrossRef]
- Tsang, Y.W. The effect of tortuosity on fluid flow through a single fracture. Water Resour. Res. 1984, 20, 1209–1215. [Google Scholar] [CrossRef]
- Brown, S.R. Transport of fluid and electric current through a single fracture. J. Geophys. Res. Solid Earth 1989, 94, 9429–9438. [Google Scholar] [CrossRef]
- Zimmerman, R.W.; Bodvarsson, G.S. Hydraulic conductivity of rock fractures. Transp. Por. Med. 1996, 23, 1–30. [Google Scholar] [CrossRef] [Green Version]
- Barton, N.; Quadros, E.F. Joint aperture and roughness in the prediction of flow and groutability of rock masses. Int. J. Rock Mech. Min. Sci. 1997, 34, 525. [Google Scholar] [CrossRef]
- Murata, S.; Saito, T. Estimation of Tortuosity of Fluid Flow Through a Single Fracture. J. Can. Pet. Technol. 2003, 42, 39–45. [Google Scholar] [CrossRef]
- Min, K.B.; Rutqvist, J.; Tsang, C.F.; Jing, L. Stress-dependent permeability of fractured rock masses: A numerical study. Int. J. Rock Mech. Min. Sci. 2004, 41, 1191–1210. [Google Scholar] [CrossRef]
- Rasouli, V.; Hosseinian, A. Correlations developed for estimation of hydraulic parameters of rough fractures through the simulation of JRC flow channels. Rock Mech. Rock Eng. 2011, 44, 447–461. [Google Scholar] [CrossRef]
- Xiong, X.; Li, B.; Jiang, Y.; Koyama, T.; Zhang, C. Experimental and numerical study of the geometrical and hydraulic characteristics of a single rock fracture during shear. Int. J. Rock Mech. Min. Sci. 2011, 48, 1292–1302. [Google Scholar] [CrossRef]
- Indraratna, B.; Kumara, C.; Zhu, S.P.; Sloan, S.W. Mathematical Modeling and Experimental Verification of Fluid Flow through Deformable Rough Rock Joints. Int. J. Geomech. 2015, 15, 04014065. [Google Scholar] [CrossRef] [Green Version]
- Roy, D.G.; Singh, T.N. A Numerical Study of the Effect of Surface Roughness on the Fluid Flow through Rock Joint. In Proceedings of the GEOINDIA 2015 & 3rd South Asian Geosciences Conference and Exhibition, New Delhi, India, 11–14 January 2015. [Google Scholar]
- Ma, J.; Zhao, G.; Khalili, N. A fully coupled flow deformation model for elasto-plastic damage analysis in saturated fractured porous media. Int. J. Plast. 2016, 76, 29–50. [Google Scholar] [CrossRef]
- Ma, J.; Wang, J. A Stress-Induced Permeability Evolution Model for Fissured Porous Media. Rock Mech. Rock Eng. 2016, 49, 477–485. [Google Scholar] [CrossRef]
- Chen, Y.; Liang, W.; Lian, H.; Wang, J.; Nguyen, V.P. Experimental study on the effect of fracture geometric characteristics on the permeability in deformable rough-walled fractures. Int. J. Rock Mech. Min. Sci. 2017, 98, 121–140. [Google Scholar] [CrossRef]
- Niya, S.M.R.; Selvadurai, A.P.S. Correlation of joint roughness coefficient and permeability of a fracture. Int. J. Rock Mech. Min. Sci. 2019, 113, 150–162. [Google Scholar] [CrossRef]
- Chen, S.; Dooolen, G.D. Lattice Boltzmann method for fluid flows. Annu. Rev. Fluid Mech. 1998, 30, 329–364. [Google Scholar] [CrossRef]
- Guo, Z.; Shi, B.; Wang, N. Lattice BGK model for incompressible Navier-Stokes Equation. J. Comput. Phys. 2000, 165, 288–306. [Google Scholar] [CrossRef]
- Latt, J. Choice of Units in Lattice Boltzmann Simulations. Available online: www.lbmethod.org (accessed on 15 April 2008).
- Yan, Y.; Zu, Y.; Dong, B. LBM, a useful tool for mesoscale modelling of single-phase and multiphase flow. Appl. Therm. Eng. 2011, 31, 649–655. [Google Scholar] [CrossRef]
- Eker, E.; Akin, S. Lattice Boltzmann Simulation of Fluid Flow in Synthetic Fractures. Transp. Por. Med. 2006, 65, 363–384. [Google Scholar] [CrossRef] [Green Version]
- Wang, M.; Chen, Y.F.; Ma, G.W.; Zhou, J.Q.; Zhou, C.B. Influence of surface roughness on nonlinear flow behaviors in 3D self-affine rough fractures: Lattice Boltzmann simulations. Adv. Water Resour. 2016, 96, 373–388. [Google Scholar] [CrossRef]
- Ju, Y.; Zhang, Q.; Zheng, J.; Chang, C.; Xie, H. Fractal model and Lattice Boltzmann method for characterization of non-Darcy flow in rough fractures. Sci. Rep. 2017, 7, 41380. [Google Scholar] [CrossRef]
- Dou, Z.; Zhou, Z. Lattice Boltzmann simulation of solute transport in a single rough fracture. Water Sci. Eng. 2014, 7, 277–287. [Google Scholar]
- Bakhshian, S.; Hosseini, S.A. Pore–scale analysis of supercritical CO2–brine immiscible displacement under fractional–wettability conditions. Adv. Water Res. 2019, 126, 96–107. [Google Scholar] [CrossRef]
- Bakhshian, S.; Hosseini, S.A.; Shokri, N. Pore-scale characteristics of multiphase flow in heterogeneous porous media using the lattice Boltzmann method. Sci. Rep. 2019, 9, 3377. [Google Scholar] [CrossRef]
- Barton, N.; Choubey, V. The shear strength of rock joints in theory and practice. Rock Mech. 1977, 10, 1–54. [Google Scholar] [CrossRef]
- Brown, S.R. Simple mathematical model of a rough fracture. J. Geophys. Res. Solid Earth 1995, 100, 5941–5952. [Google Scholar] [CrossRef]
- Ogilvie, S.R.; Isakov, E.; Glover, P.W.J. Fluid flow through rough fractures. II: A new matching model for rough rock fractures. Earth Planet Sci. Lett. 2006, 241, 454–465. [Google Scholar] [CrossRef]
- Zou, Q.; He, X. On pressure and velocity flow boundary conditions for the lattice Boltzmann BGK model. Phys. Fluids. 1996, 9, 1591–1598. [Google Scholar] [CrossRef]
- Bakhshian, S.; Sahimi, M. Computer simulation of the effect of deformation on the morphology and flow properties of porous media. Phys. Rev. E 2016, 94, 042903. [Google Scholar] [CrossRef] [Green Version]
- Snow, D. A Parallel Plate Model of Fractured Permeable Media. Ph.D. Thesis, University of California, Berkeley, CA, USA, 1965. [Google Scholar]
- Myers, N. Characterization of surface roughness. Wear 1962, 5, 182–189. [Google Scholar] [CrossRef]
- Li, Y.; Zhang, Y. Quantitative estimation of joint roughness coefficient using statistical parameters. Int. J. Rock Mech. Min. Sci. 2015, 77, 27–35. [Google Scholar] [CrossRef] [Green Version]
Figure 1.
Process to obtain the height of Barton’s standard profiles: (a) Standard profiles from Barton et al. [28]; (b) Profile extraction; (c) Binarization of profile based on image processing; (d) Digitalization of the standard profiles according to the location of the black line (0) in the binarized image.

Figure 2.
Profiles for synthetic fractures with different fractal dimensions and standard deviations: (a) profiles of different fractal dimensions with standard deviations of 1 mm; (b) profiles with different standard deviations at a fractal dimension of 2.4.
Figure 2.
Profiles for synthetic fractures with different fractal dimensions and standard deviations: (a) profiles of different fractal dimensions with standard deviations of 1 mm; (b) profiles with different standard deviations at a fractal dimension of 2.4.

Figure 3.
The setup of a fractured model and the boundary conditions.

Figure 4.
The comparison between the analytical solution and numerical simulation for fluid flow through the parallel plate model with different apertures.
Figure 4.
The comparison between the analytical solution and numerical simulation for fluid flow through the parallel plate model with different apertures.

Figure 5.
The mass conservation for fluid flow through rough fracture: (a) the velocity distribution for the fluid flow in the fracture with JRC = 17~18 and aperture = 0.4 cm; (b) the velocity profile at different locations.
Figure 5.
The mass conservation for fluid flow through rough fracture: (a) the velocity distribution for the fluid flow in the fracture with JRC = 17~18 and aperture = 0.4 cm; (b) the velocity profile at different locations.

Figure 6.
The relationship between the JRC, aperture and permeability: (a) the relationship between permeability and the JRC; (b) the relationship between the correction factor and the JRC.
Figure 6.
The relationship between the JRC, aperture and permeability: (a) the relationship between permeability and the JRC; (b) the relationship between the correction factor and the JRC.

Figure 7.
The relationship between the correction factor, the JRC and Z2: (a) relationship between Z2 and the JRC, (b) relationship between the correction factor and Z2.
Figure 7.
The relationship between the correction factor, the JRC and Z2: (a) relationship between Z2 and the JRC, (b) relationship between the correction factor and Z2.

Figure 8.
The relationship between Z2, aperture and permeability.

Figure 9.
The influence of fractal dimension and standard deviation on the permeability of a single fracture: (a) aperture = 0.1 cm; (b) aperture = 0.2 cm; (c) aperture = 0.3 cm; (d) aperture = 0.4 cm.
Figure 9.
The influence of fractal dimension and standard deviation on the permeability of a single fracture: (a) aperture = 0.1 cm; (b) aperture = 0.2 cm; (c) aperture = 0.3 cm; (d) aperture = 0.4 cm.

Figure 10.
Relationship between Z2, fractal dimension and standard deviation.

Figure 11.
Relationship between the correction factor and Z2 for fluid flow through a synthetic fracture.
Figure 11.
Relationship between the correction factor and Z2 for fluid flow through a synthetic fracture.

Figure 12.
Comparison between numerical results and proposed equation.


Table 1.
Parameters used in the lattice Boltzmann model.
| Parameters | Physical Model | Dimensionless Model | Lattice Model |
|---|---|---|---|
| Reynolds number, Re | 100 | 100 | 100 |
| Model length, Lx | 10 cm | 10 | 1001 |
| Model width, Ly | 2 cm | 2 | 201 |
| Reference velocity, u | 0.01 cm/s | 0.01 | 1 |
| Density, | 1.0 g/cm3 | 1.0 | 1.0 |
| Viscosity, 1.0 | 0.01 cm/s | 0.01 | - |
| Relaxation time, | - | - | 0.53 |
| Grid spacing, dx | - | 0.01 | 1 |
| Time step, dt | - | 0.0001 | 1 |
| Pressure gradient, ∆P/L | - |
Table 2.
Parameters of the synthetic fractures.
| Fractal Dimension | Standard Deviation (cm) | Aperture, h (cm) |
|---|---|---|
| 1.0; 1.2; 1.4; 1.6 1.8; 2.0;2.2;2.4 | 0.1; 0.2; 0.3 | 0.1; 0.2; 0.3; 0.4 |
© 2019 by the authors. Licensee MDPI, Basel, Switzerland. This article is an open access article distributed under the terms and conditions of the Creative Commons Attribution (CC BY) license (http://creativecommons.org/licenses/by/4.0/).
Share and Cite
MDPI and ACS Style
Yin, P.; Zhao, C.; Ma, J.; Huang, L. A Unified Equation to Predict the Permeability of Rough Fractures via Lattice Boltzmann Simulation. Water 2019, 11, 1081. https://doi.org/10.3390/w11051081
AMA Style
Yin P, Zhao C, Ma J, Huang L. A Unified Equation to Predict the Permeability of Rough Fractures via Lattice Boltzmann Simulation. Water. 2019; 11(5):1081. https://doi.org/10.3390/w11051081
Chicago/Turabian StyleYin, Peijie, Can Zhao, Jianjun Ma, and Linchong Huang. 2019. "A Unified Equation to Predict the Permeability of Rough Fractures via Lattice Boltzmann Simulation" Water 11, no. 5: 1081. https://doi.org/10.3390/w11051081
Note that from the first issue of 2016, this journal uses article numbers instead of page numbers. See further details here.