The System Evaluation of Grain Production Efficiency and Analysis of Driving Factors in Heilongjiang Province


School of Water Conservancy & Civil Engineering, Northeast Agricultural University, Harbin 150030, China
*
Author to whom correspondence should be addressed.
Water 2019, 11(5), 1073; https://doi.org/10.3390/w11051073
Submission received: 13 April 2019
/
Revised: 17 May 2019
/
Accepted: 19 May 2019
/
Published: 23 May 2019
(This article belongs to the Section Water, Agriculture and Aquaculture)
Abstract
:Considering that grain production in Heilongjiang province, northeast China, consumes a lot of water and land, it is necessary to explore the grain production level under restricted water and land resources. This study uses the data envelopment analysis and Malmquist index models of grain production efficiency at the province and country levels from the perspective of space during the period of grain-growing. Furthermore, a logarithmic mean Divisia index model was introduced to construct the system dynamics model. The driving factors of food production efficiency in Heilongjiang province were revealed from the time angle, and the evolution of driving factors was simulated. The results showed the following: (1) although the decrease in the area of the rural population and crop planting has inhibited the growth of grain output in Heilongjiang province, the grain output will increase slightly in the future and is estimated to reach 65.01 million tons by 2030. (2) In 2015, the average grain production efficiency in Heilongjiang Province was 92.3%, and the index of change in grain production efficiency during the grain-growing period was 0.986, which indicates that the overall grain production efficiency in the region was declining, and the input and output were lower than expected. In the future, regional grain production inputs should be allocated to the areas where the grain production efficiency is not as effective as is desired. (3) The cultivated area has the largest contribution of grain production during the period of grain-growing, and the cumulative effect is 21.6 million tons; however, it is estimated that grain yield per hectare will exceed the cultivated land in 2021 as the leading factor promoting grain production, which shows that technological progress is the most important factor moving forward to promote grain production efficiency in Heilongjiang province. Therefore, the subsequent technical measures should be taken to improve grain-production conditions, and the parameter of grain yield per hectare should be used to improve grain production efficiency. The research framework of grain production efficiency is constructed based on space and time. It is of great practical significance to explore food security and reduce the demand for soil and water resources.
1. Introduction
Water and land resources are indispensable resources for food production and economic/social development, and the supply and demand of water and land resources is related to the country’s food security and sustainable development [1,2,3,4]. With the increase in population growth and the accelerating process of industrialization and urbanization, grain demand gradually increases [5], while the use of some land and water resources is shifting to “non-agricultural” purposes, which is irreversible. The conflict between regional water use and food demand has increasingly intensified, and food security and water and land resources have been threatened [6,7,8]. Considering the limitation of water and land resources, the expansion in food demand should not depend on the unlimited expansion of input factors but should be based on the continuous improvement of grain production levels, that is, the grain production efficiency. Therefore, exploring the efficiency and driving factors of grain production under the constraints of limited resources is of great practical significance for ensuring food security and alleviating the restrictions on water and land resources.
At present, grain production research mainly focuses on regional spatial econometric analysis by building mathematical and statistical models, such as the stochastic production function and the data envelopment analysis (DEA) model, analyzing the level of grain production, spatial distribution, and contribution of each production factor at the regional scale from an economic standpoint [9,10], or analyzing regional food security by measuring food production capacity and potential [11]. However, there are few studies on the dual dimensions of time and space and lack of motive analysis for food production change, leading to one-sided research results and limiting the direction of follow-up research. In this paper, we used the DEA and the Malmquist index to construct a grain production efficiency model to analyze the regional differences in grain production efficiency from a spatial perspective at the provincial and national levels. The logarithmic mean Divisia index (LMDI) method was introduced into the system dynamics (SD) model [12,13] to decompose and predict the driving factors of food production from the perspective of time; analyze the motivation for food production in order to expand existing research dimensions; and to promote the efficient utilization of regional water and land resources, in addition to providing a basis for improving food production capacity.
2. Research Methods
2.1. DEA Method
DEA is currently the most commonly used efficiency analysis method. This method selects m input indicators and n output indicators, and while keeping the input and output in the evaluation region (DMUj, j = 1, 2, …, L) unchanged, estimates the relatively efficient frontier of grain production and calculates the input-output index during T (T = 1, 2, …, t) by comparing the distance from each evaluation area to the frontier of effective grain production [14,15,16,17,18]. This method does not require data to be dimensionless and does not require estimation of the function form and weight, thereby it simplifies the interference of subjective factors.
This paper establishes an input-oriented DEA model [18], in which food production inputs include labor force, capital, as well as water and land resources [19,20,21,22,23]. Considering the availability of data and resource constraints, this study constructed the evaluation index system of food production efficiency (Table 1).
To evaluate the grain production efficiency in each region, let Xj = (x1j, x2j, …, xmj) be the m-dimensional input vector of the jth region and Yj = (y1j, y2j, …, ynj) be the output vector of the jth region. In this study, m = 4 and n = 1. The linear programming DEA model with slack variables is as follows:
where, x0 = xj0, y0 = yj0 (0 < j0 < k, 0 < k < l) are the input and output data of the j0th region; is the weight vector of the input and output index of the j0th region; , are slack variables, is technical efficiency (TE), generally, the closer is to 1, the higher the grain production efficiency in the region. When = 1, the grain production efficiency in the region is optimal.
In order to comprehensively analyze the regional TE, Banker et al [24] proposed an improved scheme of the above model. This scheme decomposes the TE into pure technical efficiency (PTE) and scale efficiency (SE) by increasing , which is the convexity assumption. Among them, TE is the maximum output that the current input combination can achieve. PTE is the resource allocation efficiency under the condition of constant input–output, and SE is the input and output ratio of resources. The relationship between the three terms is as follows:
2.2. Malmquist Index Method
In order to explore the evolution of grain production efficiency, this paper references the Malmquist index efficiency evaluation method based on the DEA model. This method decomposes the total factor productivity changes (Tfpch) of the evaluation region into efficiency changes (Effch) and technical changes (Techch), Effch can continue to be decomposed into pure efficiency changes (Pech) and scale efficiency changes (Sech). In the Malmquist index model of this study, Tfpch represents the change of grain production efficiency in each region, Effch represents the ratio of regional grain output to the optimal grain output in each period, Techch represents the optimal grain output ratio of each period in the case of constant input, Pech represents the change of grain production management technology at different periods, and Sech represents the change of the grain production efficiency in various periods.
A Malmquist index model of Tfpch based on output during t1 and t2 was constructed as follows:
where, and are the change rate of Tfpch at the time of t1 and t2, respectively, and are the input–output data of t1 and t2, respectively, and are the relative TE levels based on the technical level of t1 and t2, respectively. In this study, t1 is 2003 and t2 is 2015.
The rate of change of Tfpch based on the geometric mean of Formula (3) is constructed as follows:
where, is the change rate of Tfpch. If Tfpch > 1, the production efficiency increases during the period of t1 to t2, otherwise it decreases [25,26].
Tfpch is decomposed into Pech, Sech, and Techch as follows:
2.3. LMDI Method
Different combinations of resource endowments and resource utilization are the driving factors of the differences in grain production efficiency in the region. This paper analyzes the various driving factors that affect food production efficiency by building LMDI models and observes the impact and action direction of each driving factor on food production efficiency. It also analyzes the driving factors of food production efficiency and their contribution degree by measuring the changes in food input and output.
The factors affecting grain output are decomposed into:
In the formula, F is the total grain output of the study area, which characterizes the grain output level; is the pth decomposition factor of the study area, which characterizes the grain input level. Heilongjiang Province was selected as the research area for this study.
Land resources are the basis and constraint factors of grain output. A change in land quantity and quality will lead to a change in the grain output pattern [27,28]; therefore, the influence factors of food output are divided into four land resource feature inputs: grain output per hectare, proportion of food area, multiple cropping index, and cultivated land.
where, G is the sown area of food crops in the study area, S is the sown area of all crops in the study area, and C is the cultivated land in the study area. Let be grain output per hectare, be the proportion of food area, and be multiple crop index.
The change trend of regional grain output from period T to the base period T0 can be expressed as follows:
The natural logarithm of both sides of Formula (8) is taken and both sides are multiplied by giving:
where, is the change effect of grain output from period T to the base period T0. , , , and are the grain output change effect of grain output per hectare, proportion of food area, multiple cropping index, and cultivated land from period T to the base period T0, respectively. In the study, the base period T0 was 2003.
2.4. Construction of the SD Model for Grain Production
In order to analyze and predict the driving factors of grain production efficiency and intuitively understand the relationship among the driving factors, Vensim DSS software was used to construct the SD model of grain production in Heilongjiang Province based on Qiuxiang’s model [2], which is introduced in LMDI (Figure 1); words between the “< >” symbols indicate that the variable is repeated. Consider data availability and “12 consecutive increases”, the time boundary of the model is from 2003 to 2030, of which 2003 to 2014 are the historical years, 2015 is the base year, and 2016 to 2030 are the planning years. The annual data of the historical years and current year are derived from relevant statistical data. The data of social and economic development in the planning year are set according to relevant development plans of the country and region. The data of relevant indicators for the development and utilization of land and water resources in the planning year are extended with the status quo. The model consists of a grain output subsystem and grain output decomposition factor subsystem; the grain output subsystem simulates and forecasts the grain production status in Heilongjiang Province. The grain output decomposition factor subsystem was introduced in LMDI models to calculate the change effect of cultivated land, the change effect of multiple cropping index, the change effect of grain output per hectare, and the change effect of proportion of food area so as to realize the dynamic simulation of the driving factors of grain production efficiency in Heilongjiang Province.
2.5. General Situations of the Study Region and Data Sources
2.5.1. General Situations of the Study Region
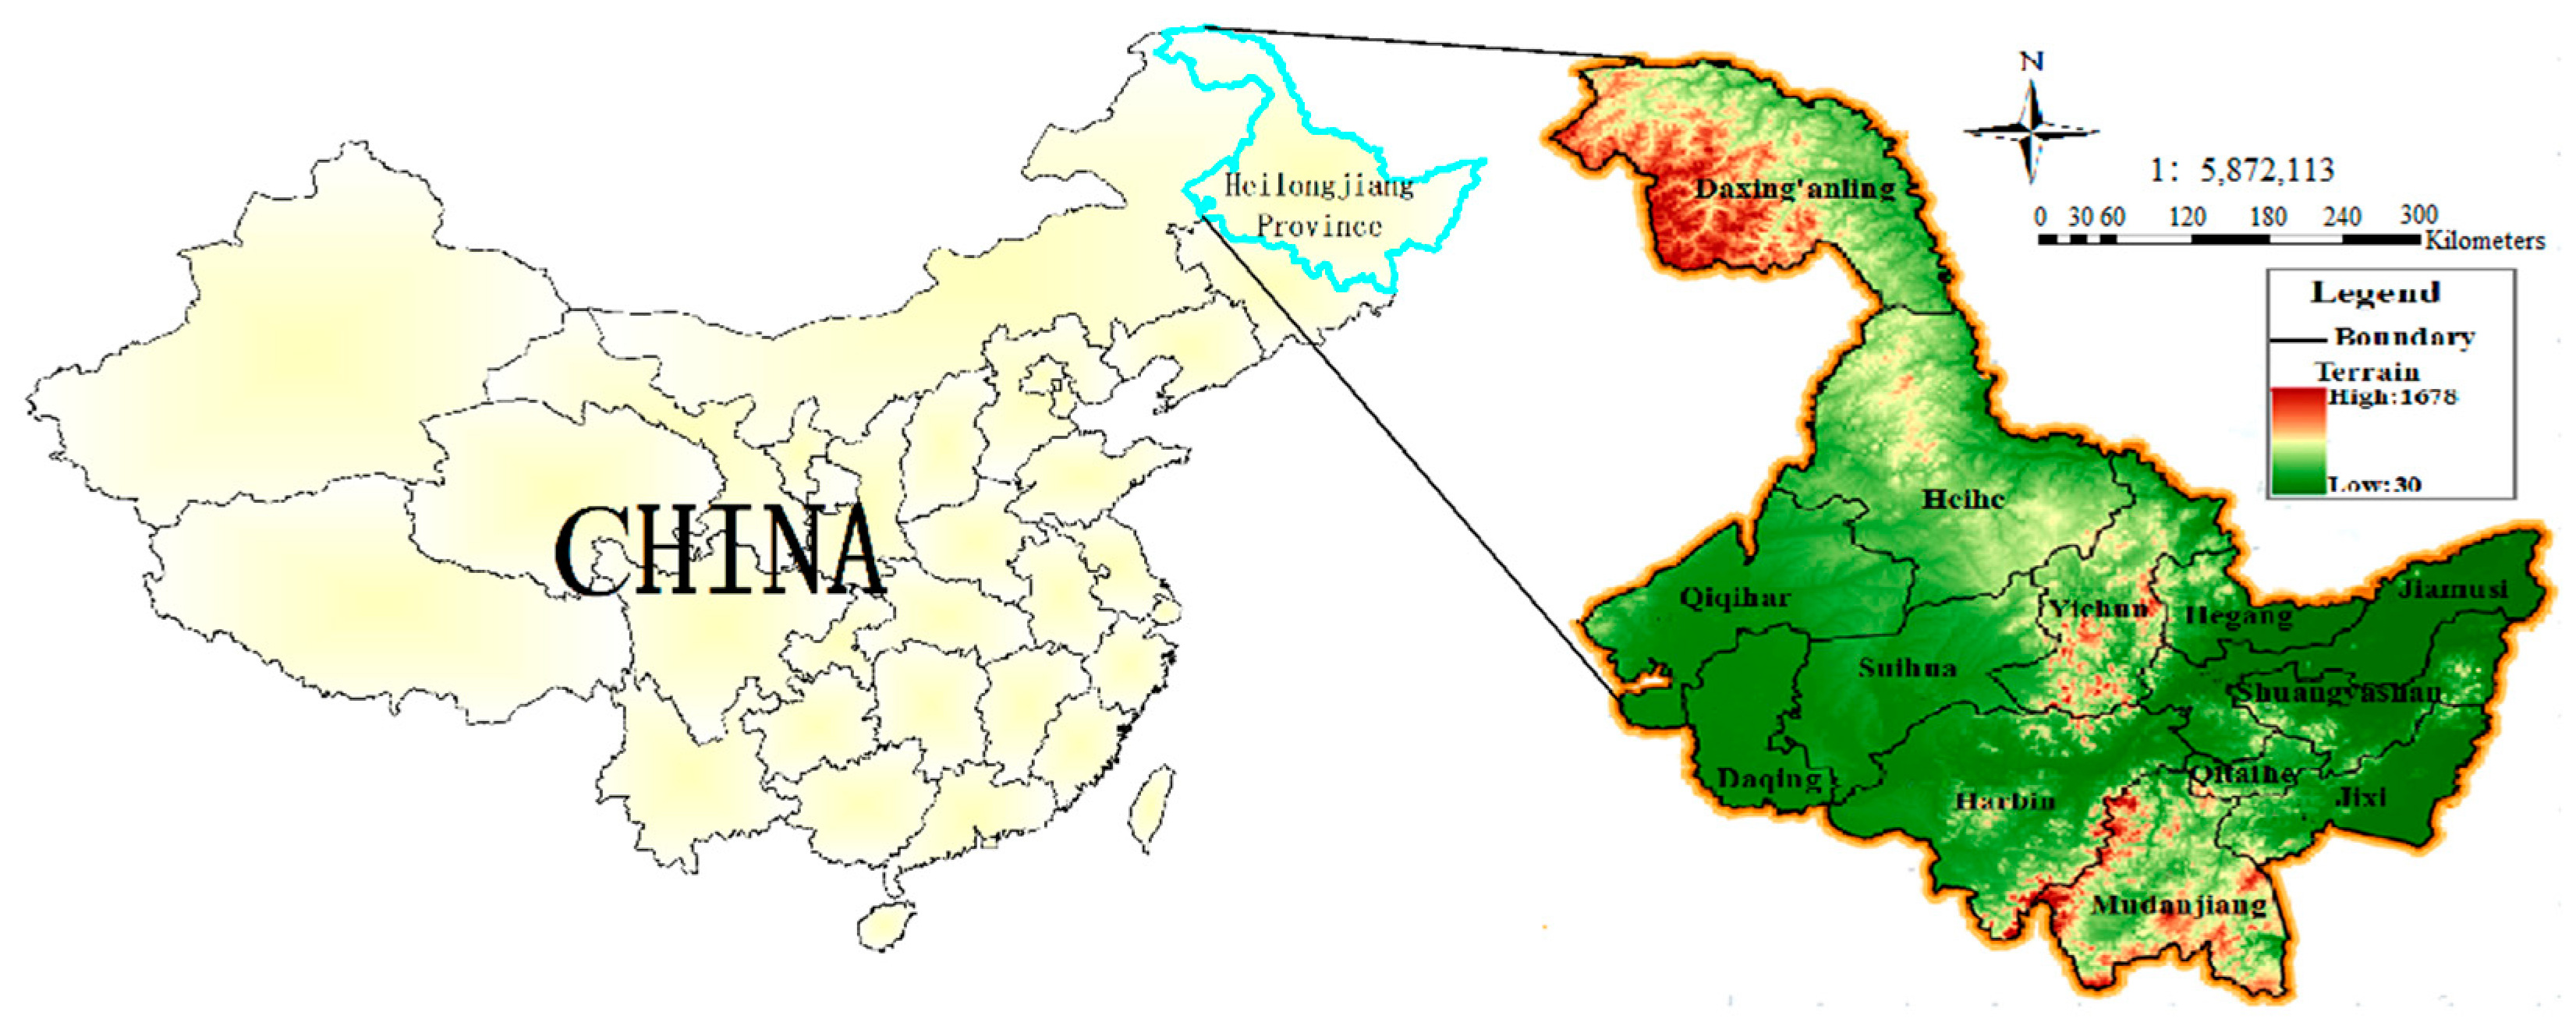
Heilongjiang Province is located in the northeastern part of China (Figure 2), it mainly has a temperate continental monsoon climate. In summer, the temperature is higher and precipitation is sufficient. Winter is long, cold, and dry. The province has approximately 2,300–2,800 sunshine hours per year, and solar energy resources are relatively abundant. Heilongjiang Province contains large tracts of land. In 2015, the cultivated land in Heilongjiang Province accounted for 11.75% of the country’s total. The cultivation conditions are favorable and suitable for the growth of crops. It is an important commodity grain production base in China. In recent years, the state has adopted a series of economic policies to revitalize the traditional northeast old industrial base and develop the economy of Heilongjiang Province; meanwhile, the grain output in Heilongjiang Province has also realized “12 consecutive increases” in 2003–2015. However, with the development of the economy and the increase of grain output, the water and land resources in Heilongjiang Province face a sharp increase in demand and even an over-reclamation of land resources, leading to an imbalance between the supply and demand of water and land resources in the region, thereby curbing regional economic development and grain production capacity improvement. Another factor is that Heilongjiang province grain output was not able to continue the trend of “12 consecutive increases” in 2016. Considering the future development of the regional economy, the food production situation, and the limited water and land resources, studying Heilongjiang Province grain production efficiency in the period of grain-growing (2003–2015) is of great significance to guide the sustainable utilization of water and land resources, maintain the safety of land and water resources, and achieve economic and social sustainable development.
2.5.2. Data Sources
In this paper, data on the grain crops sown area, cultivated land, grain output, crop sown area, total power of agricultural machinery, and rural population of Heilongjiang Province and 13 prefecture-level cities in Heilongjiang Province are all from the Heilongjiang Statistical Yearbook [29] and the agricultural water consumption data is from Heilongjiang Province Water Resources Bulletin [30]. The data of grain output, crop sown area, total power of agricultural machinery, and rural population in 31 provinces and cities in China except Heilongjiang Province all come from the “China Statistical Yearbook” [31].
3. Results and Analysis
3.1. Simulation of the SD Model for Grain Production
In order to make the simulation results of grain production in Heilongjiang Province more objective and accurate, the effectiveness of this model was verified by a historical test. The model simulation value was compared to the actual value, and the specific results are shown in Table 2. It can be seen from Table 2 that the error between the simulated value and the actual value of the variables is within ±10% of the year of history, the relative error is small, the simulation results of the model are in good agreement with the actual situation, and the model can be used to evaluate the grain production efficiency and analyze and predict the driving factors in Heilongjiang Province.
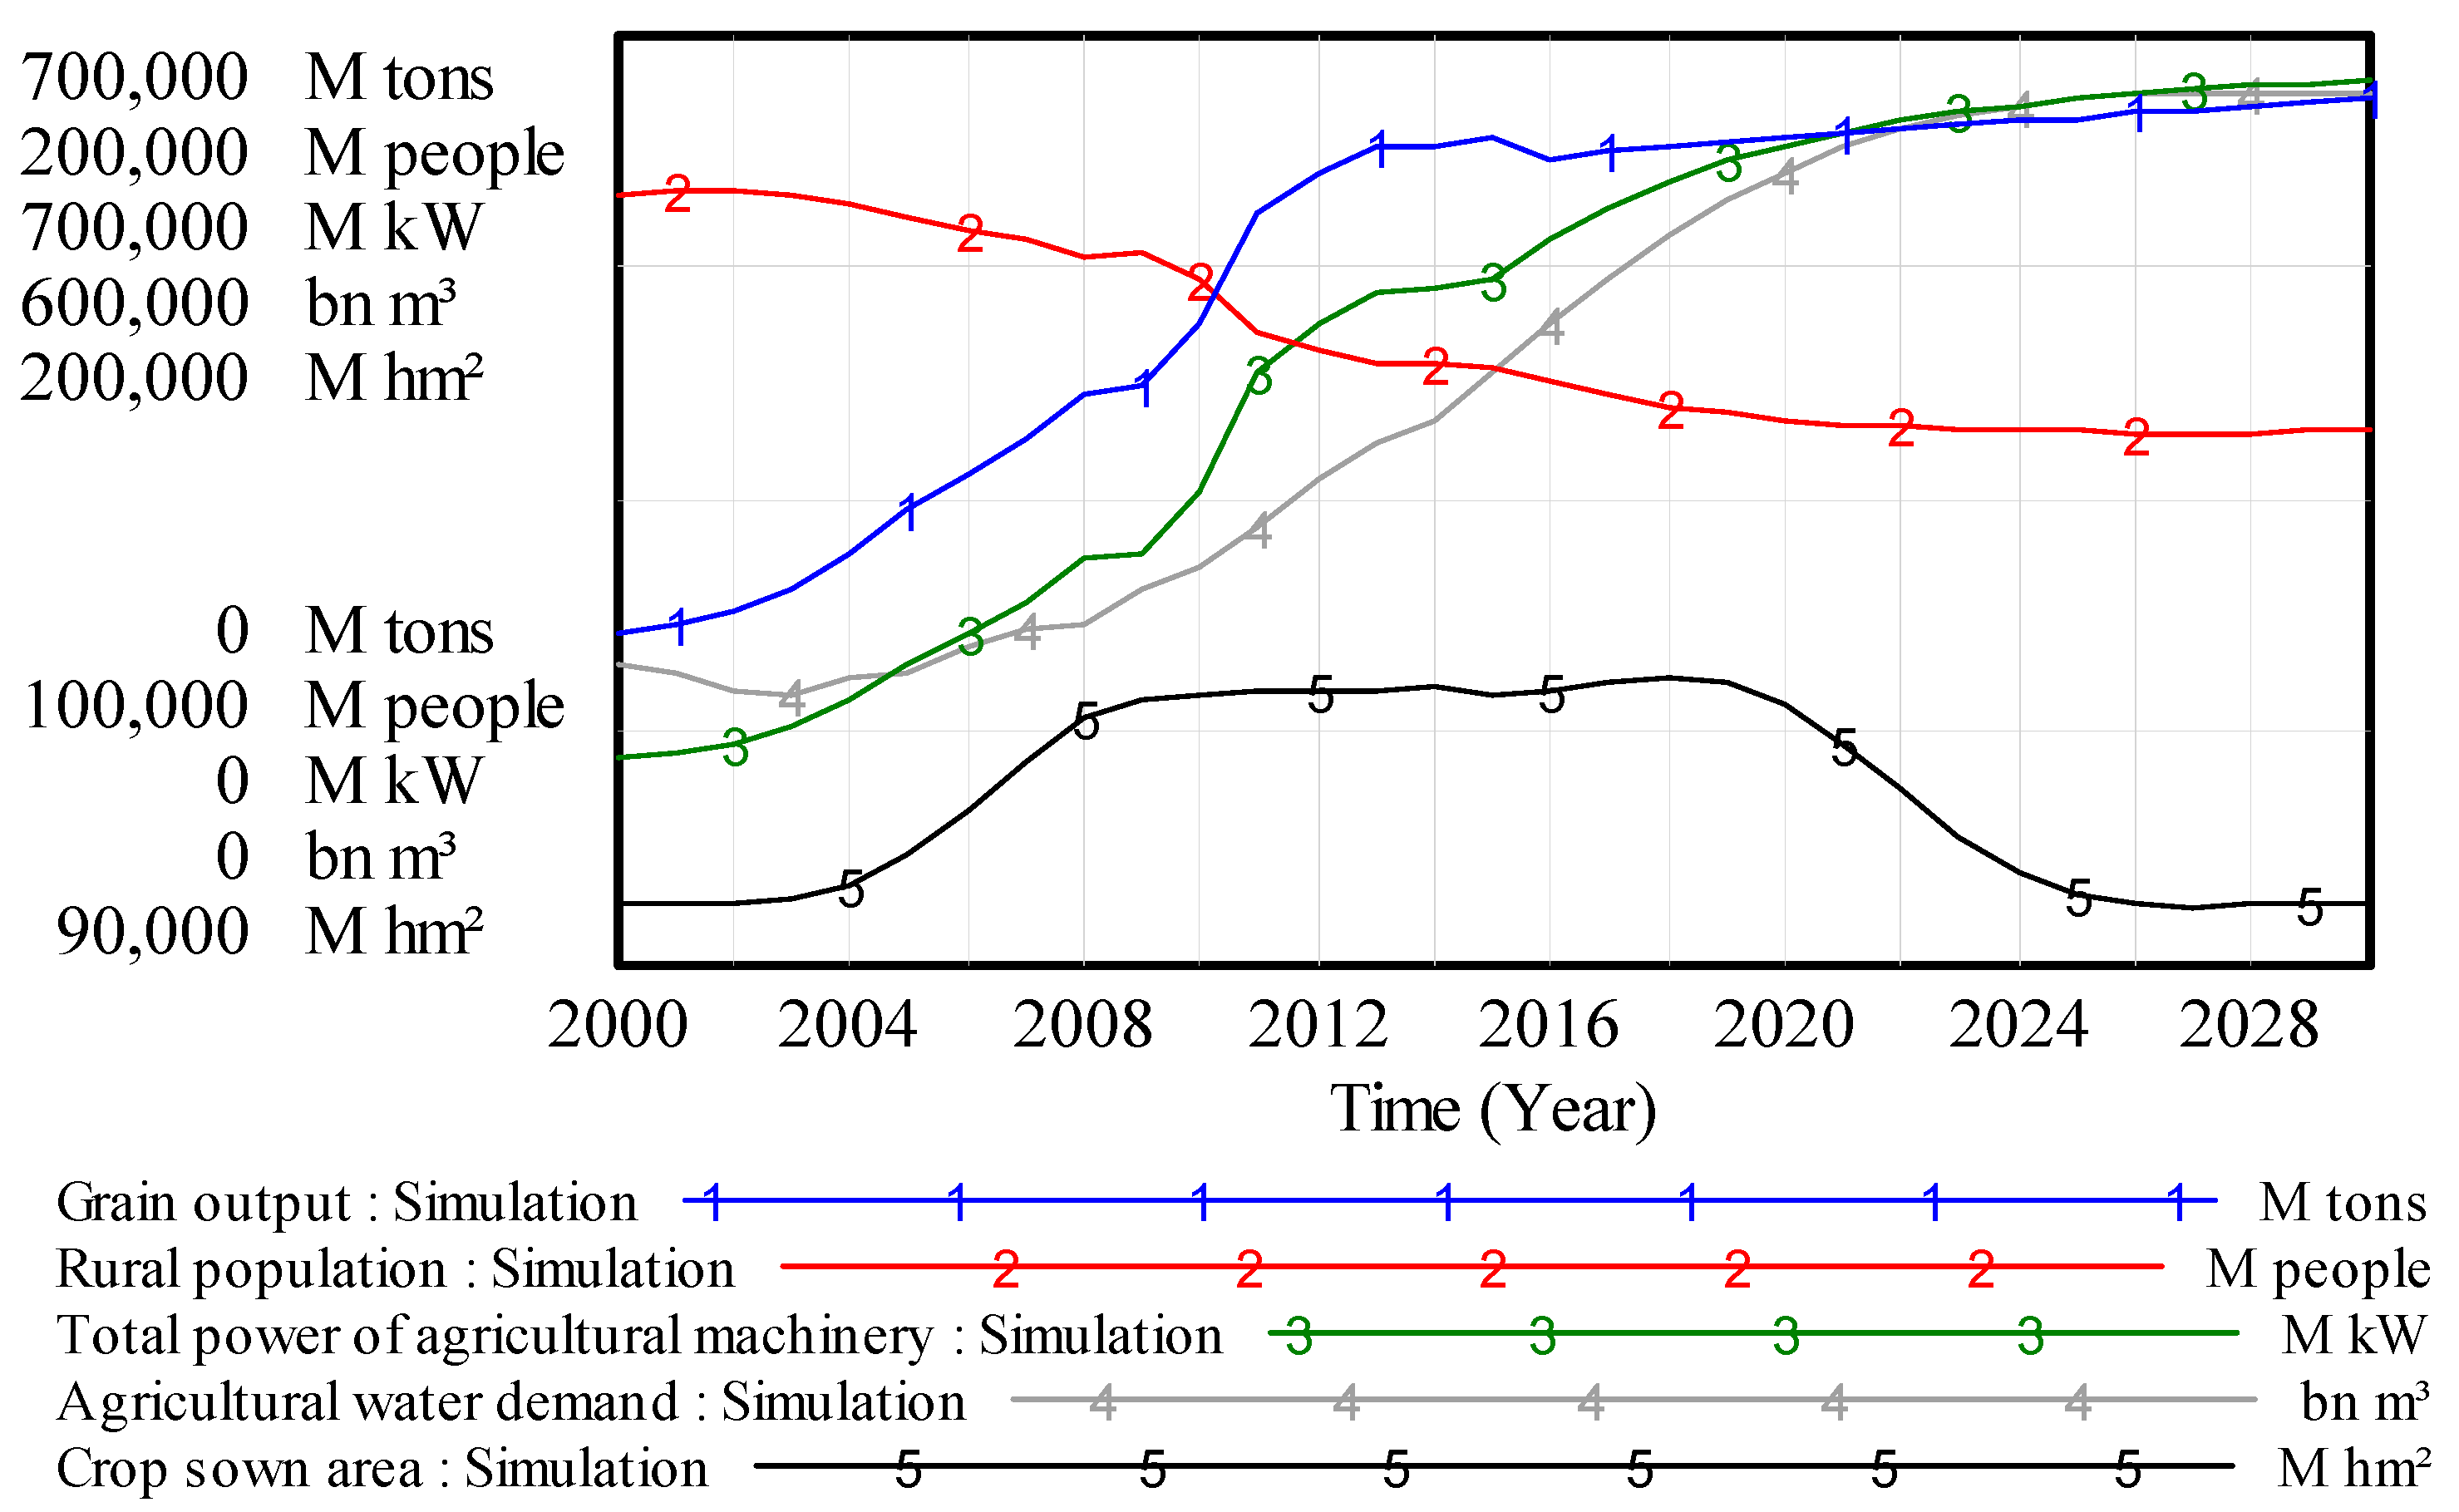
In order to analyze the state of grain production in Heilongjiang Province, the dynamic simulation of the grain production SD model was carried out in this paper, and the simulation results are shown in Figure 3. From the output perspective, the grain output in Heilongjiang Province increased continuously from 2003 to 2013 and remained steady after 2014. With reductions in government subsidy for planting food crops, an imperfect food production subsidy policy, and a rural labor force shortage, the grain output “12 consecutive increases” in Heilongjiang Province was not achieved in 2016. Considering the demand for food due to population growth, the total grain output will continue to rise slightly and steadily in the future, it is estimated that the grain output in 2030 will reach to 65.01 million tons and the growth momentum will be good. From the perspective of inputs, in the future, Heilongjiang Province is still an important commodity grain production base in China, and the agricultural water supply is an important need for supply of food. With the increase of grain output, agricultural water demand will show a rigid growth and it is estimated to reach 56.1 billion m3 in 2030. The total power of agricultural machinery, to some extent, reflects the region modernization level of grain production. Heilongjiang Province, as a major grain-producing province, has a strong momentum towards modernization of grain production. The total power of agricultural machinery is gradually raised with the increase of grain output, and the total power of agricultural machinery is predicted to reach 66.58 million kW by 2030. With the acceleration of urbanization and industrialization, the rural population continued to decline due to massive outflows and is expected to drop to 15.72 million in 2030. After a steady increase in the sown area of crops from 2003 to 2004, with the support of the national benefiting-farmers policy in 2004, the sown area of crops rapidly increased to 12.09 million hm2 in 2008, and then subsequently increased steadily and slightly. Considering the “non-agriculturalization” of regional land brought by economic development, a large amount of agricultural land was turned into urban and industrial land, which led to an inevitable decline of the sown area of crops in the future and is expected to be basically stabilized at 9.7 million hm2 by 2025.
The simulation results show that the decrease of input of rural population and crop sown area in Heilongjiang Province are some of the reasons why grain production in Heilongjiang Province experienced a bottleneck in 2016. However, the increase of total power of agricultural machinery and agricultural water input are slightly higher than the grain output, which both show inefficient input and output in Heilongjiang Province, a trend which may continue in the future.
3.2. Analysis of Grain Production Efficiency in Heilongjiang Province at the Provincial Level
In order to comprehensively analyze the reasons why Heilongjiang Province experienced a grain production bottleneck in 2016, the current year grain production efficiency in Heilongjiang Province in 2015 was studied. Taking input as the guide, the DEAP 2.1 software program was used to construct the DEA model with Heilongjiang Province and its 13 prefecture-level cities to analyze the 2015 regional grain production efficiency: the specific calculation results are shown in Table 3.
According to Table 3, the average TE (Technical Efficiency) of grain production in Heilongjiang Province in 2015 is 92.3%, which is less than 100%, suggesting that the grain production efficiency in the region is not yet effective, indicating that under the current grain output level, the input of water and land resources, labor force, and capital need to be reduced by 7.7% so that grain production efficiency can reach an effective level. Therefore, there is still some development space for the input and output efficiency of regional grain production. Among the prefecture-level cities in Heilongjiang Province, grain production efficiency in six prefecture-level cities, i.e., Jixi, Hegang, Yichun, Qitaihe, Suihua, and Daxinganling, were relatively effective (TE, PTE, and SE are all 100%). According to the Statistical Yearbook of Heilongjiang Province in 2015 and the Bulletin of Heilongjiang Water Resources, the above six prefecture-level cities account for 31% of agricultural water use in Heilongjiang Province and 27.3% of agriculture land use in Heilongjiang Province, but provided 30% of the grain for Heilongjiang Province. The input and output of grain production reached the optimal status in these six regions. The grain production efficiency of the remaining seven regions never reached the point of being effective, of which Heihe City, the lowest grain production city had a TE of 73.3%. The input and output of food production there remain unreasonably low, indicating that there are large differences in the regional grain production efficiencies in Heilongjiang Province. Harbin, Daqing, Jiamusi, and Mudanjiang have relatively ineffective grain production efficiency due to the lack of SE (PTE is 1 and SE is not 1). Among them, the decreasing ES characteristics of Harbin City should appropriately reduce the input scale of water and land resources, labor force, and capital in Harbin City; while the ES of Daqing City, Jiamusi City and Mudanjiang City are in an increasing state, so the investment scale should be increased appropriately. Thus, Harbin, as the capital city, is the primary location for water and land resources inputs, economic inputs, and labor force inputs in Heilongjiang Province, but the output is less than ideal. The center of gravity of inputs should be transferred appropriately, and the resources should be allocated to the remaining areas where the grain production efficiency is not as effective as is desired due to low SE.
3.3. Analysis of Grain Production Efficiency in Heilongjiang Province at the National Level
To assess the extent of grain production changes under the current conditions of development and technology in the region, we explored the differences between the changes in grain production efficiency in Heilongjiang Province and other regions in China during 2003–2015. We analyzed the trend of grain production efficiency and clarified the supporting factors for grain growth. Based on input-orientation, the software was used to evaluate grain production efficiency in 31 provinces and cities in China. The Malmquist index was used to analyze the input and output index data of the start-up year 2003 and the termination year 2015 of the grain-growing period. The specific calculation results are shown in Table 4.
From a national perspective, the Tfpch value of the grain-growing period in Heilongjiang Province was 0.986, the overall grain production efficiency in Heilongjiang Province showed a declining trend, ranked 14th in 31 provinces and cities in China. Compared with Heilongjiang Province, the grain production efficiency in Liaoning, which is similar to Heilongjiang in geographical conditions in the northeast region, has increased along with those in Shandong, Henan, Hebei, Tianjin, Inner Mongolia, Jiangsu, which are the major grain-producing areas. It can be seen that Heilongjiang Province, as China’s main grain production area, has a growing gap between its grain production efficiency and most main grain production provinces. In terms of the decomposition factor of grain production efficiency, except for technical progress, all the other decomposition factors in Heilongjiang Province are greater than 1, while the top-ranking Shandong, Henan, Beijing, Hebei, Tianjin, and other provinces and cities have a relatively higher Techch index. In these areas, technological innovations were carried out during 2003–2015, but the growth trends in different regions are different given their own development characteristics and investment conditions. Overall, Techch in Heilongjiang Province has declined, while Effch, Pech, and Sech have increased. It can be seen that the technological progress in the period of grain-growing is the major factor restricting the grain production efficiency in Heilongjiang Province, the reason for which is the overcapacity caused by the ineffective investment in the previous period. Paying attention to the increase in grain demand while ignoring the grain production efficiency is one of the reasons leading to the decline in grain production efficiency in Heilongjiang Province. Compared with the decline of Techch, the Pech of Heilongjiang Province is 1, indicating that under the current technological level, the allocation of grain production resources in Heilongjiang Province is more reasonable and the space for improvement of Pech is limited. From the national average point of view, Heilongjiang Province Techch was below the national average, so there is some potential for improvement. Compared with other regions, Heilongjiang Province has a lack of Techch. In the future, policy makers must focus on the introduction of advanced agricultural production technologies, strengthen regional cooperation, utilize the experience of high-tech-level areas, and take such measures as site-specific fertilization, rational close planting, timely irrigation, pest control and other technical measures to promote grain production in Heilongjiang Province [32,33].
3.4. Grain Production Efficiency Drivers and Forecast
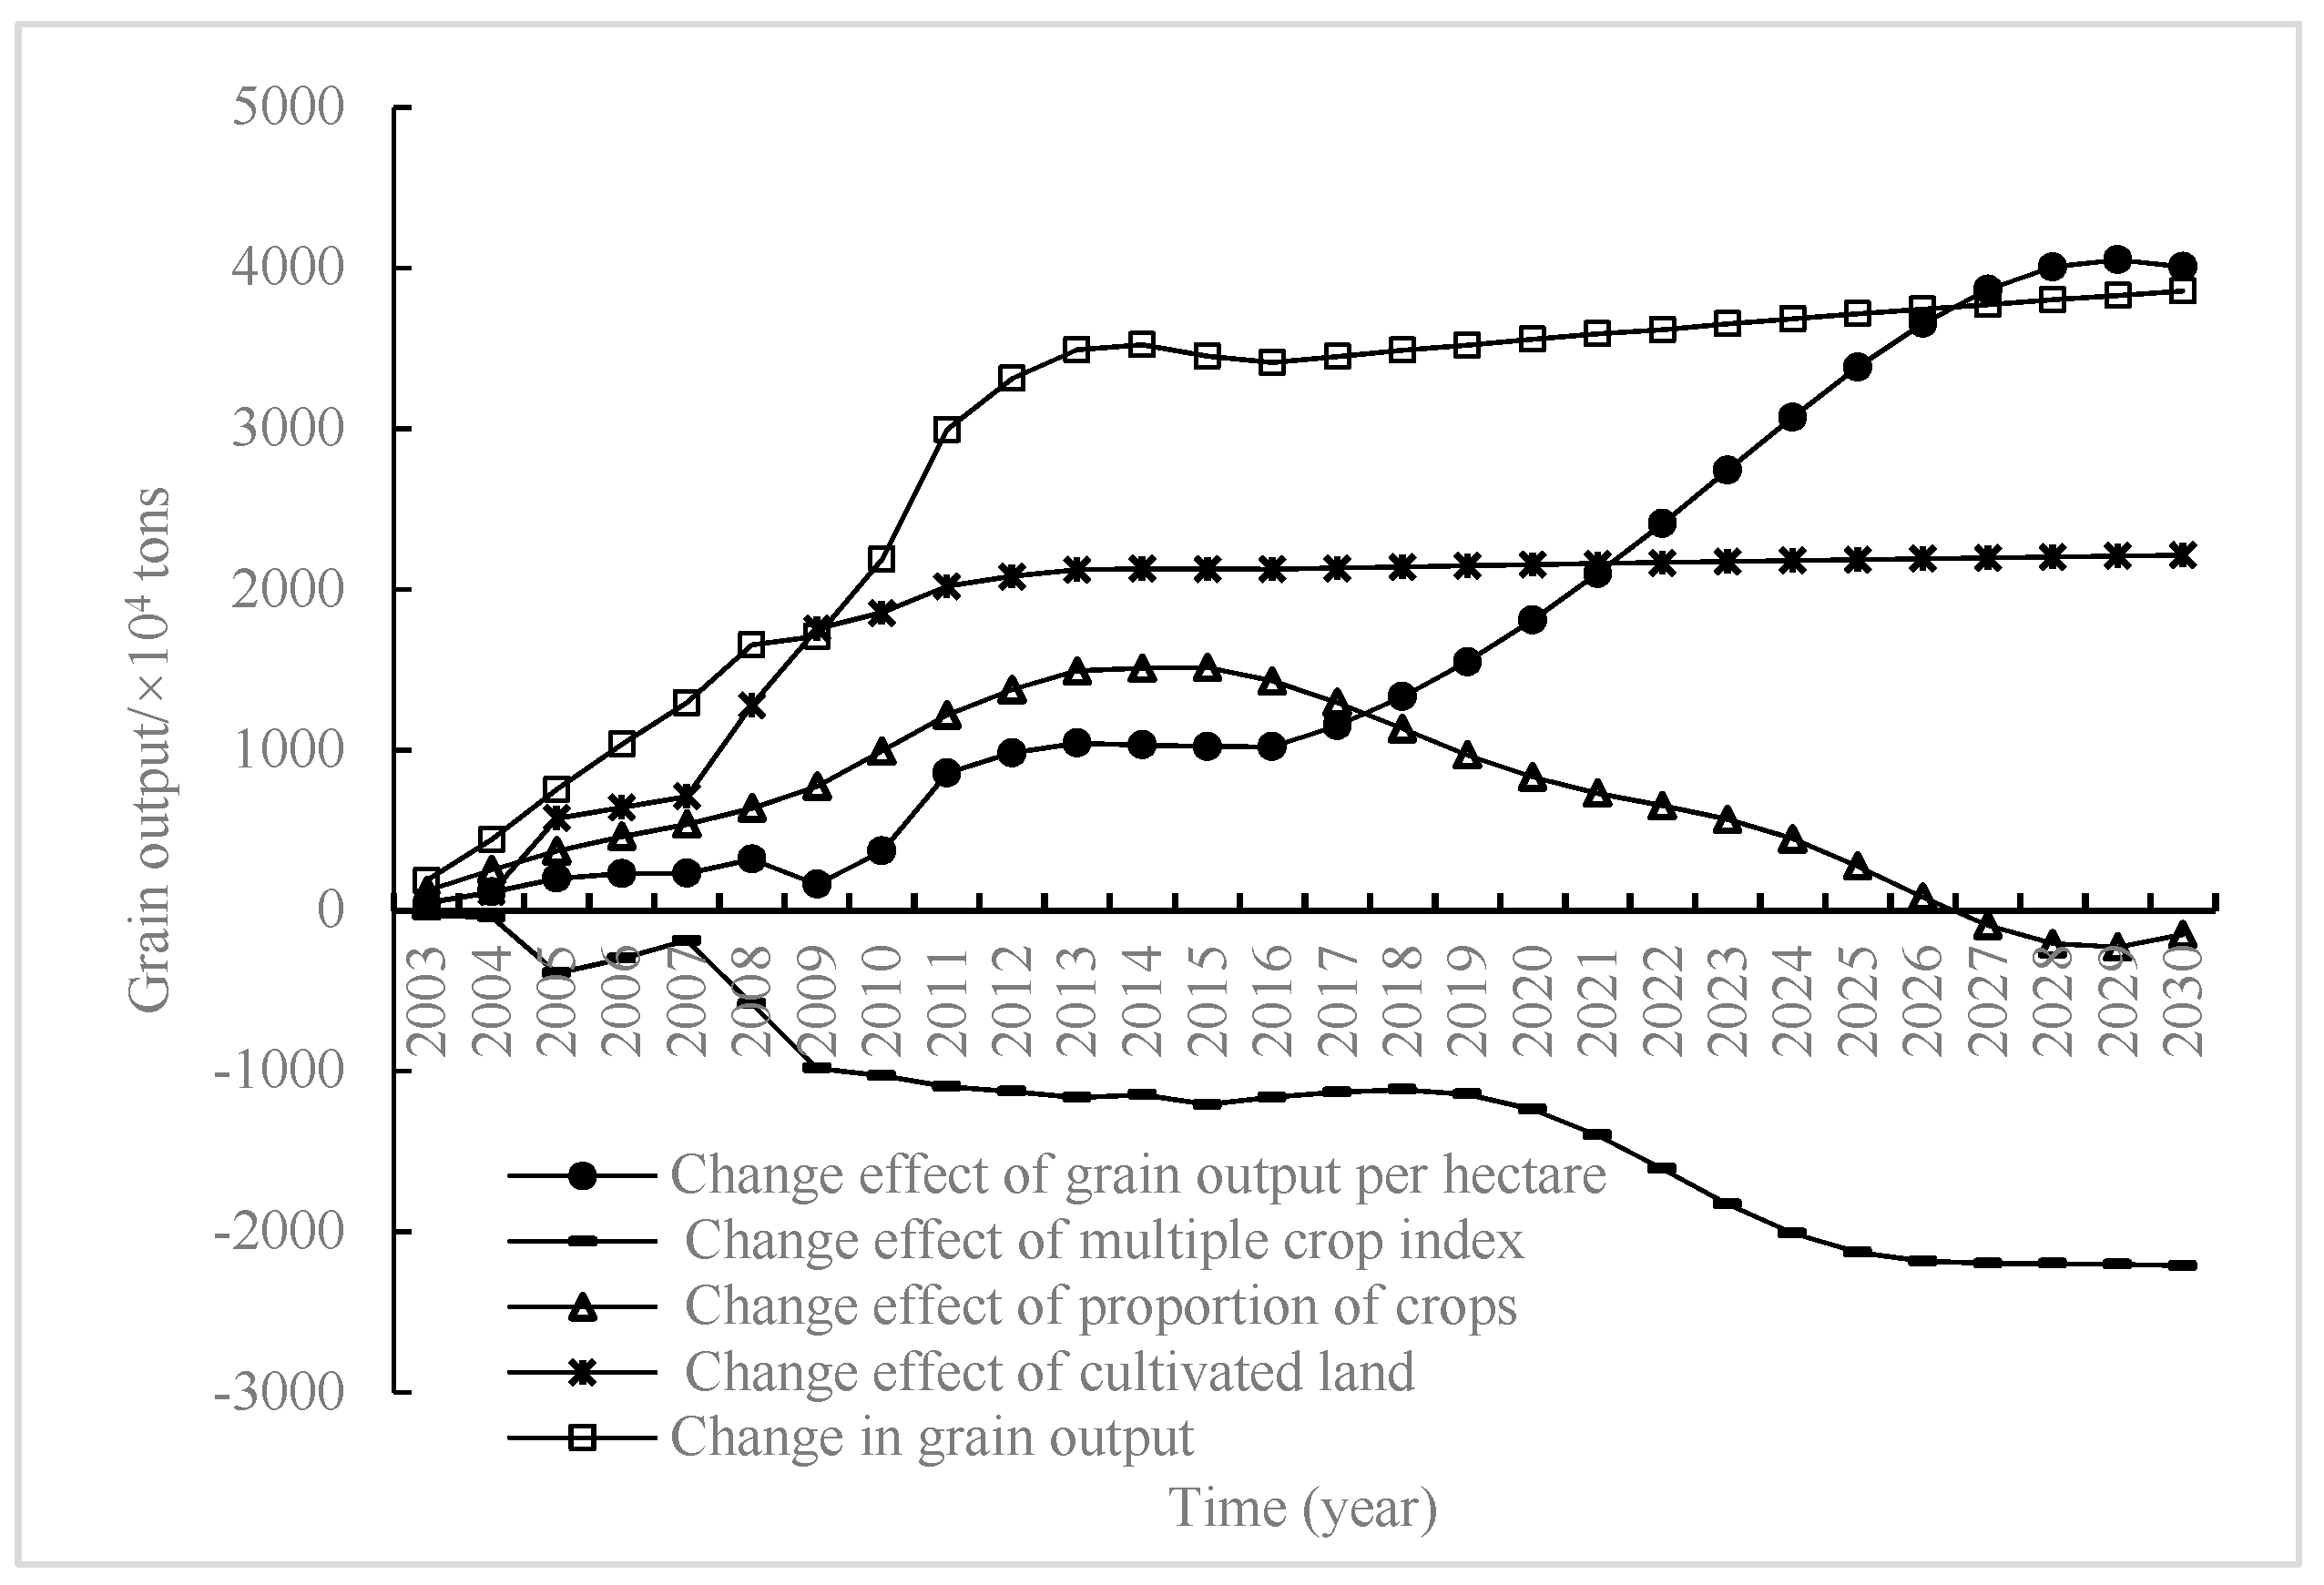
In order to improve grain production efficiency and increase the potential of grain production in Heilongjiang province, it is necessary to scientifically analyze the driving factors of grain production efficiency. Therefore, the SD model was used, which introduced LMDI to decompose the influencing factors of grain output during the grain-growing period in Heilongjiang province and predicted the evolution of the influencing factors in the next 15 years (Figure 4), the changes in grain input and output were observed, and finally, the drivers of food production efficiency were analyzed.
Decomposing the grain output in Heilongjiang Province shows that under the influence of many factors, the direction and intensity of grain output fluctuates in different ways and shows an overall growth trend.
The cultivated land has the greatest contribution to food production efficiency in historical years. The cumulative effect of cultivated land input on grain output is 21.26 million tons during the grain-growing period and there is an upward trend predicted for the next 15 years, but the growth rate would obviously slow down. In the future, the impact of cultivated land input on the increase of grain output will decrease, and the contribution of the indicator of the driving factor of cultivated land to the grain production efficiency is predicted to be reduced. The cultivated land is the positive driving factor during the period of grain-growing, meaning that the cultivated land is the dominant factor for promoting grain production efficiency. Analysis of the reasons shows that guided by relevant policies of the state, Heilongjiang Province has vigorously developed agriculture and adopted measures such as land consolidation to increase the cultivated land in 2009 by 63.7% as compared with that in 2003, and the increase of cultivated land will surely bring about an increase in grain output. With development of the economy and society, in addition to the increase in urbanization rate, cultivated land is occupied by industrial and domestic land. Under the strict red line of the national cultivated land, the cultivated land in Heilongjiang Province in 2010 remained stable at 15.85 million hm2 and has not seen a trend in growth over that of the status quo in 2015. Therefore, after 2010, the contribution of cultivated land area in Heilongjiang Province to grain production efficiency tended to be stable.
Compared with the cultivated land, the contribution of grain output per hectare in historical years is weaker. The accumulated effect of the input from grain output per hectare on grain output is 10.2 million tons, and its positive effect will continue to rise rapidly in the next 15 years. It is estimated to exceed 21.6 million tons of the cumulative positive effect of the cultivated land in 2021; therefore, grain output per hectare would become the key factor in boosting grain output and raising grain production efficiency. The positive effect of grain output per hectare improvement shows that technological progress is the most important factor in promoting grain production in Heilongjiang Province in the future, and there is room for the input of productive forces to improve grain production efficiency. In the future, it will be necessary to take measures such as increasing agricultural investment and agricultural development, popularizing seed agriculture, raising the level of agricultural management and other technical measures, and carrying out land consolidation, transformation of middle and low-yield fields, promotion of agricultural infrastructure and other projects to improve agricultural production conditions and continue to promote grain output per hectare contribution for the improvement of grain production efficiency [34].
Contribution from the food area proportion changed a lot. The cumulative effect of the proportion of crop input to grain output during the historical year was 11.53 million tons. However, its contribution effect gradually decreased during the planning year, with a negative impact on grain output after 2027. It is estimated that by the year 2030, a decrease of 1.51 million tons of grain output will occur, and the contribution of the proportion of food area driving factor to grain production efficiency would continue to decrease. Analysis of the causes shows that in 2004, the state implemented four subsidies for the market reform of grain, reducing the cost of grain growing. At the same time, with the steady rise of grain prices, rural residents’ incomes and the willingness to grow grain also gradually increased, which promoted the increase of the contribution of the proportion of food area to grain production efficiency. However, along with the improvement in the quality of life, the demand for cash crops is becoming greater and greater, and the proportion of land transfer applied to “non-grain” high-efficiency agriculture has also been increasing. As a result, the contribution of food area proportion to the grain production efficiency in Heilongjiang Province decreased year after year, and a certain degree of negative impact is expected in the future. In the future, we should comprehensively adjust the planting structure in the region, develop high-efficiency agriculture, reduce the cost of growing grains, and increase the income of rural residents and their willingness to grow grain.
The multiple cropping contribution index fluctuation declined and was negative in each time period. The historical multiple cropping index input has decreased by 12.07 million tons of grain output. The pull-down effect has been increasing year after year in the planning year, and a 21.13 million tons decrease in grain output is expected by 2030. The negative impact of the multiple cropping index driving factor on grain production efficiency continues to increase. Human behavior has a greater impact on the multiple cropping index, relative to the non-agricultural income, agricultural income is lower, while the reduction of the multiple cropping index helps to obtain higher non-agricultural income, thus, the multiple cropping index tends to decrease in the region. A food area proportion that is too low also hindered the increase of grain output, so the future proportion of food area and multiple cropping index would jointly hinder the improvement of grain production efficiency in Heilongjiang Province. In Heilongjiang Province, the land resource endowment is excellent, and the multiple cropping index has a higher room for improvement. In the future, the government should increase agricultural subsidies and increase rural residents’ agricultural income and their willingness to grow grain so as to promote the improvement of grain production efficiency [35,36].
4. Conclusions
In this paper, the DEA model and the Malmquist index model of grain production efficiency were used, which respectively reflect the input–output relationship of grain production from the whole province level and the whole country level. Furthermore, the LMDI model based on exponential statistics was constructed to analyze the driving factors of grain production efficiency and establish the SD model of grain production in Heilongjiang Province to simulate and predict the evolution of various indicators of grain production. The results showed that the average grain production efficiency in Heilongjiang Province in 2015 was 92.3%, which was weakly efficient; the index of Tfpch in the period of grain-growing was 0.986, which means that the grain production efficiency decreased. To ensure food security in the region, it is necessary to increase investment in technology, introduce advanced agricultural technologies, and conduct scientific management according to local conditions in order to promote the improvement of grain production efficiency in Heilongjiang Province.
With population growth and the rise of industry and agriculture, food security is increasingly becoming an important indicator by which to measure the overall strength of the region. This paper constructed an “efficiency-driven factor” evaluation chain based on grain-production efficiency and revealed the process of evolution of grain production efficiency under resource constraints in order to provide some opinions for coordinating the relationship between grain input and output, and also for realizing a reasonable grain production from a broad viewpoint. In addition, this paper combines the LMDI model and the SD model; it not only dynamically decomposes the motivation of grain water production efficiency in historical years but also predicts the evolvement of driving factors of grain production efficiency in a planning year. It also makes up for the lack of time dimension and motivation analysis of grain production efficiency.
Author Contributions
Conceptualization, Y.Z.; methodology, Y.Z.; software, Y.Z.; validation, Y.Z. and Q.J.; writing—original draft preparation, Y.Z.; writing—review and editing, Y.Z. and Q.J.; supervision, Q.J. and Z.W.; funding acquisition, Q.J.
Funding
The authors wish to thank the National Natural Science Foundation of China (No.51679040), University Nursing Program for Young Scholars with Creative Talents in Heilongjiang Province of China (No.UNPYSCT-2017022), Postdoctoral Scientific Research Developmental Fund of Heilongjiang Province of China (No.LBH-Q17022), Natural Science Foundation of Heilongjiang Province (No.E2016004) and “Academic Backbone” Project of Northeast Agricultural University (No.18XG17) for their financial support.
Acknowledgments
The authors wish to thank the reviewers and the editor for their valuable suggestions.
Conflicts of Interest
The authors declare no conflict of interest.
References
- Liu, D.; Liu, C.; Fu, Q.; Li, M.; Faiz, M.A.; Khan, M.I.; Li, T.; Cui, S. Construction and application of a refined index for measuring the regional matching characteristics between water and land resources. Ecol. Indic. 2018, 91, 203–211. [Google Scholar] [CrossRef]
- Jiang, Q.; Zhao, Y.; Wang, Z.; Fu, Q.; Wang, T.; Zhou, Z.; Dong, Y. Simulating the Evolution of the Land and Water Resource System under Different Climates in Heilongjiang Province, China. Water 2018, 10, 868. [Google Scholar] [CrossRef]
- Wang, J.; Clarke-Sather, A.; Ma, J.; Qu, J. Estimating Changes in the Green Water Productivity of Cropping Systems in Northern Shaanxi Province in China’s Loess Plateau. Water 2018, 10, 1198. [Google Scholar] [CrossRef]
- Spiertz, J.H.J.; Ewert, F. Crop production and resource use to meet the growing demand for food, feed and fuel: Opportunities and constraints. NJAS Wagening. J. Life Sci. 2009, 56, 281–300. [Google Scholar] [CrossRef]
- Bos, J.F.F.P.; Smit, A.L.; Schröder, J.J. Is agricultural intensification in The Netherlands running up to its limits? NJAS Wagening. J. Life Sci. 2013, 66, 65–73. [Google Scholar] [CrossRef] [Green Version]
- Fatemeh, K.; Arjen, H. Informing National Food and Water Security Policy through Water Footprint Assessment: The Case of Iran. Water 2017, 9, 831. [Google Scholar]
- Wang, Q.; Liu, X.; Yue, T.; Wang, C.; Wilson, J.P. Using models and spatial analysis to analyze spatio-temporal variations of food provision and food potential across China’s agro-ecosystems. Ecol. Model. 2015, 306, 152–159. [Google Scholar] [CrossRef]
- Geng, Q.; Wu, P.; Zhao, X.; Wang, Y. A framework of indicator system for zoning of agricultural water and land resources utilization: A case study of Bayan Nur, Inner Mongolia. Ecol. Indic. 2014, 40, 43–50. [Google Scholar] [CrossRef]
- Rosegrant, M.W.; Paisner, M.S.; Meijer, S.; Witcover, J. Global Food Projections to 2020: Emerging Trends and Alternative Futures; Implications Investment vision Discussion Paper; International Food Policy Research Institute: Washington, DC, USA, 2001; Volume 1, pp. 251–263. [Google Scholar]
- Faisal, I.M.; Parveen, S. Food security in the face of climate change, population growth, and resource constraints: Implications for Bangladesh. Environ. Manag. 2004, 34, 487–498. [Google Scholar] [CrossRef]
- Xin, L.J.; Li, X.B.; Tan, M.H. Changes of comparative advantages of regional grain production in China. Trans. Chin. Soc. Agric. Eng. 2009, 25, 222–227, (In Chinese with English abstract). [Google Scholar]
- Sterman, J.D. Business Dynamics: Systems Thinking and Modeling for a Complex World; Irwin-McGraw Hill: Boston, MA, USA, 2000. [Google Scholar]
- Forrester, J.W. Industrial dynamics. J. Oper. Res. Soc. 1997, 48, 1037–1041. [Google Scholar] [CrossRef]
- Deilmann, C.; Hennersdorf, J.; Lehmann, I.; Reißmann, D. Data envelopment analysis of urban efficiency—Interpretative methods to make DEA a heuristic tool. Ecol. Indic. 2018, 84, 607–618. [Google Scholar] [CrossRef]
- Johanna, C.G.; Stefano, P. Data Envelopment Analysis of sustainability indicators of European agricultural systems at regional level. Agric. Syst. 2013, 118, 78–90. [Google Scholar]
- Abdul, W.; Ben, W. Farm household efficiency in Bangladesh: A comparison of stochastic frontier and DEA methods. Appl. Econ. 2000, 32, 1665–1673. [Google Scholar]
- Haji, J. Production efficiency of smallholders’ vegetable-dominated mixed farming system in eastern ethiopia: A non-parametric approach. J. Afr. Econ. 2007, 16, 1–27. [Google Scholar] [CrossRef]
- Charnes, A.; Cooper, W.W.; Rhodes, E. Measuring the efficiency of decision making units. Eur. J. Oper. Res. 1978, 2, 429–444. [Google Scholar] [CrossRef]
- Galanopoulos, K.; Abas, Z.; Laga, V.; Hatziminaoglou, I.; Boyazoglu, J. The technical efficiency of transhumance sheep and goat farms and the effect of EU subsidies: Do small farms benefit more than large farms? Small Rumin. Res. 2011, 99, 1–7. [Google Scholar] [CrossRef]
- Tang, X.L.; Wang, J.Q.; Zhang, B.; Zhang, L. Application of the DEA on the performance evaluation of the agricultural support policy in China. Agric. Econ. 2017, 63, 510–523. [Google Scholar]
- Atici, K.B.; Podinovski, V.V. Using data envelopment analysis for the assessment of technical efficiency of units with different specialisations: An application to agriculture. Omega 2015, 54, 72–83. [Google Scholar] [CrossRef] [Green Version]
- Liu, S.; Zhang, P.; He, X.; Li, J. Efficiency change in North-East China agricultural sector: A DEA approach. Agric. Econ. Czech. 2015, 61, 522–532. [Google Scholar] [CrossRef]
- Zong, Y.; Li, X. The evaluation on agricultural support level of agricultural policy in China. China Soft Sci. 2006, 7, 33–41, (In Chinese with English abstract). [Google Scholar]
- Banker, R.D.; Charnes, A.; Cooper, W.W. Some models for estimating technological and scale inefficiencies in data envelopment analysis. Manag. Sci. 1984, 30, 1078–1092. [Google Scholar] [CrossRef]
- Fare, R.; Grosskopf, S.; Norris, M. Productivity growth, technical progress, and efficiency change in industrialized countries: Reply. Am. Econ. Rev. 1994, 87, 1040–1044. [Google Scholar]
- Yunos, J.M.; Hawdon, D. The efficiency of the National Electricity Board in Malaysia: An intercountry comparison using DEA. Fuel Energy Abstr. 1997, 19, 255–269. [Google Scholar] [CrossRef]
- Ang, B.W. Decomposition analysis for policymaking in energy: Which is the preferred method. Energy Policy 2004, 32, 1131–1139. [Google Scholar] [CrossRef]
- Ang, B.W. The LMDI approach to decomposition analysis: A practical guide. Energy Policy 2005, 33, 867–871. [Google Scholar] [CrossRef]
- Heilongjiang Statiscal Bureau. Heilongjiang Statistical Yearbook; China Statistical Publishing House: Beijing, China, 2017.
- Heilongjiang Water Conservancy Department. Heilongjiang Province Water Resources Bulletin; Heilongjiang People’s Publishing House: Harbin, China, 2016.
- State Statistical Bureau. China Statistical Yearbook; China Statistical Publishing House: Beijing, China, 2017.
- Schouten, G.; Vink, M.; Vellema, S. Institutional diagnostics for African food security: Approaches, methods and implications. NJAS Wagening. J. Life Sci. 2018, 84, 1–5. [Google Scholar] [CrossRef]
- Chen, Q.Q.; Zhang, J.B.; Huo, Y. A study on research hot-spots and frontiers of agricultural science and technology innovation-visualization analysis based on the Citespace III. Agric. Econ. 2016, 62, 429–445. [Google Scholar]
- Chen, Y.H.; Nie, P.Y.; Yang, Y.C. Effects of corporate social responsibility on food safety. Agric. Econ. 2017, 63, 539–547. [Google Scholar] [Green Version]
- Demartini, E.; Gaviglio, A.; Pirani, A. Farmers’ motivation and perceived effects of participating in short food supply chains: Evidence from a North Italian survey. Agric. Econ. 2017, 63, 204–216. [Google Scholar]
- Speelman, S.; Buysse, J.; Farolfi, S.; Frija, A.; D’Haese, M.; D’Haese, L. Estimating the impacts of water pricing on smallholder irrigators in North West Province, South Africa. Agric. Water Manag. 2009, 96, 1560–1566. [Google Scholar] [CrossRef]
Figure 1.
SD (System Dynamics) model of grain production in Heilongjiang Province.

Figure 2.
Map of the study area.

Figure 3.
SD model simulation of grain production in Heilongjiang Province.

Figure 4.
Driving factor simulation of grain production efficiency.


Table 1.
Evaluation index of grain production efficiency.
| Objective | Index | Index Selection Significance |
|---|---|---|
| Evaluation of food production efficiency | Grain output | Foodstuff output |
| Rural population | Labor force input | |
| Total power of agricultural machinery | Capital input | |
| Agricultural water demand | Water resource input | |
| Sown area of the crops | Land resource input |
Table 2.
Historical test results of model.
| Projects | Units | 2003 | 2005 | 2007 | 2009 | 2011 | 2013 | 2015 | |
|---|---|---|---|---|---|---|---|---|---|
| Volume of water resources | Simulated value | 108 m³ | 245 | 267 | 296 | 308 | 353 | 374 | 348 |
| Actual value | 108 m³ | 246 | 272 | 291 | 316 | 352 | 362 | 355 | |
| Error | % | −0.33 | −1.84 | 1.43 | −2.50 | 0.13 | 3.32 | −2.02 | |
| Quantity of groundwater resources | Simulated value | 108 m³ | 275 | 269 | 222 | 311 | 240 | 379 | 282 |
| Actual value | 108 m3 | 292 | 289 | 233 | 313 | 237 | 382 | 282 | |
| Error | % | −5.70 | −6.78 | −4.49 | −0.86 | 1.37 | −0.57 | −0.11 | |
| Effective irrigated area | Simulated value | 104 hm2 | 225 | 252 | 294 | 355 | 437 | 539 | 551 |
| Actual value | 104 hm2 | 211 | 239 | 295 | 341 | 434 | 534 | 553 | |
| Error | % | 6.55 | 5.34 | −0.28 | 4.25 | 0.69 | 0.83 | −0.35 | |
| GDP | Simulated value | 108 Yuan | 3861 | 5421 | 7015 | 8338 | 13,045 | 15,150 | 15,491 |
| Actual value | 108 Yuan | 4057 | 5514 | 7104 | 8587 | 12,582 | 14,455 | 15,490 | |
| Error | % | −4.85 | −1.68 | −1.25 | −2.90 | 3.68 | 4.81 | 0.01 | |
| Urbanization rate | Simulated value | % | 52 | 53 | 54 | 55 | 57 | 58 | 58 |
| Actual value | % | 53 | 53 | 54 | 55 | 56 | 57 | 59 | |
| Error | % | −0.20 | 0.40 | 0.41 | −1.31 | 0.94 | 1.10 | −1.04 | |
Table 3.
Grain production efficiency of cities in Heilongjiang Province in 2015.
| Area | Technical Efficiency | Pure Technical Efficiency | Scale Efficiency | Economies of Scale |
|---|---|---|---|---|
| Harbin | 0.991 | 1 | 0.991 | Decreasing |
| Qiqihar | 0.836 | 0.923 | 0.905 | Decreasing |
| Jixi | 1 | 1 | 1 | Constant |
| Hegang | 1 | 1 | 1 | Constant |
| Shuangyashan | 0.924 | 0.927 | 0.997 | Decreasing |
| Daqing | 0.806 | 1 | 0.806 | Increasing |
| Yichun | 1 | 1 | 1 | Constant |
| Jiamusi | 0.821 | 1 | 0.821 | Increasing |
| Qitaihe | 1 | 1 | 1 | Constant |
| Mudanjiang | 0.886 | 1 | 0.886 | Increasing |
| Heihe | 0.733 | 0.74 | 0.991 | Increasing |
| Suihua | 1 | 1 | 1 | Constant |
| Daxing’anling | 1 | 1 | 1 | Constant |
| Provincial average value | 0.923 | 0.968 | 0.954 |
Note: economies of scale (ES) indicate the influence of the output index when the input index geometric is increasing. ES increases when the proportion of output increases more than the input. The opposite is true regarding decreasing. ES is constant when equal.
Table 4.
Tfpch index summary of grain production efficiency for 31 provinces from year 2003 to 2015.
Table 4.
Tfpch index summary of grain production efficiency for 31 provinces from year 2003 to 2015.
| Rank | Area | Tfpch | Effch | Techch | Pech | Sech | Area | Tfpch | Effch | Techch | Pech | Sech | Rank |
|---|---|---|---|---|---|---|---|---|---|---|---|---|---|
| 1 | Shandong | 1.65 | 1.20 | 1.38 | 1.00 | 1.20 | Tibet | 0.94 | 0.69 | 1.36 | 1.00 | 0.69 | 17 |
| 2 | Henan | 1.53 | 1.20 | 1.27 | 1.00 | 1.20 | Xinjiang | 0.91 | 1.03 | 0.88 | 1.04 | 1.00 | 18 |
| 3 | Beijing | 1.51 | 1.11 | 1.36 | 1.00 | 1.11 | Chongqing | 0.91 | 1.00 | 0.91 | 1.00 | 1.00 | 19 |
| 4 | Hebei | 1.48 | 1.06 | 1.39 | 0.95 | 1.11 | Shanxi | 0.89 | 0.86 | 1.04 | 0.88 | 0.98 | 20 |
| 5 | Tianjin | 1.47 | 1.08 | 1.36 | 1.00 | 1.08 | Jiangxi | 0.88 | 1.13 | 0.78 | 1.13 | 1.00 | 21 |
| 6 | Inner Mongolia | 1.31 | 1.37 | 0.95 | 1.44 | 0.95 | Yunnan | 0.83 | 0.94 | 0.88 | 0.84 | 1.12 | 22 |
| 7 | Shanxi | 1.17 | 0.96 | 1.22 | 1.01 | 0.96 | Hunan | 0.82 | 0.79 | 1.04 | 0.71 | 1.11 | 23 |
| 8 | Zhejiang | 1.07 | 0.79 | 1.36 | 0.80 | 0.98 | Fujian | 0.78 | 0.73 | 1.07 | 0.74 | 0.98 | 24 |
| 9 | Shanghai | 1.05 | 1.40 | 0.75 | 1.00 | 1.40 | Guangdong | 0.77 | 0.70 | 1.10 | 0.68 | 1.02 | 25 |
| 10 | Jiangsu | 1.03 | 0.91 | 1.13 | 0.80 | 1.14 | Hubei | 0.70 | 0.78 | 0.91 | 0.78 | 0.99 | 26 |
| 11 | Liaoning | 1.01 | 0.88 | 1.14 | 0.88 | 1.00 | Hainan | 0.66 | 0.73 | 0.91 | 0.52 | 1.39 | 27 |
| 12 | Qinghai | 1.00 | 0.74 | 1.36 | 0.64 | 1.16 | Guangxi | 0.62 | 0.58 | 1.08 | 0.59 | 0.98 | 28 |
| 13 | Gansu | 0.99 | 0.95 | 1.04 | 0.95 | 1.00 | Sichuan | 0.62 | 0.73 | 0.85 | 0.75 | 0.98 | 29 |
| 14 | Heilongjiang | 0.99 | 1.03 | 0.96 | 1.00 | 1.03 | Guizhou | 0.57 | 0.66 | 0.86 | 0.64 | 1.03 | 30 |
| 15 | Ningxia | 0.98 | 0.83 | 1.19 | 1.57 | 0.53 | Anhui | 0.23 | 0.62 | 0.37 | 0.74 | 0.83 | 31 |
| 16 | Jilin | 0.98 | 1.00 | 0.98 | 1.00 | 1.00 | National Average | 0.921 | 0.92 | 0.89 | 1.03 | 0.88 |
Note: Tfpch means total factor productivity changes, Effch means efficiency changes, Techch means technical changes, Pech means pure efficiency changes, and Sech means scale efficiency changes.
© 2019 by the authors. Licensee MDPI, Basel, Switzerland. This article is an open access article distributed under the terms and conditions of the Creative Commons Attribution (CC BY) license (http://creativecommons.org/licenses/by/4.0/).
Share and Cite
MDPI and ACS Style
Zhao, Y.; Jiang, Q.; Wang, Z. The System Evaluation of Grain Production Efficiency and Analysis of Driving Factors in Heilongjiang Province. Water 2019, 11, 1073. https://doi.org/10.3390/w11051073
AMA Style
Zhao Y, Jiang Q, Wang Z. The System Evaluation of Grain Production Efficiency and Analysis of Driving Factors in Heilongjiang Province. Water. 2019; 11(5):1073. https://doi.org/10.3390/w11051073
Chicago/Turabian StyleZhao, Youzhu, Qiuxiang Jiang, and Zilong Wang. 2019. "The System Evaluation of Grain Production Efficiency and Analysis of Driving Factors in Heilongjiang Province" Water 11, no. 5: 1073. https://doi.org/10.3390/w11051073
Note that from the first issue of 2016, this journal uses article numbers instead of page numbers. See further details here.