Variations in Illicit Compound Discharged from Treated Wastewater


School of Science and Health, Western Sydney University, Sydney 1797, Australia
*
Author to whom correspondence should be addressed.
†
These authors contributed equally to this work.
Water 2019, 11(5), 1071; https://doi.org/10.3390/w11051071
Submission received: 9 April 2019
/
Revised: 26 April 2019
/
Accepted: 16 May 2019
/
Published: 23 May 2019
(This article belongs to the Special Issue Urban Environmental Vulnerability under Climate Change and Anthropogenic Impacts)
Abstract
:The detection and monitoring of illicit drug concentrations in environmental waters is of increasing interest. This study aimed to determine if illicit and regulated compounds, their potential pre-cursors, and metabolites varied in amount discharged into the environment from treated wastewater at different facilities. Water samples were taken from discharge points of four different tertiary wastewater treatment plants discharging directly into the Hawkesbury-Nepean River (Australia) on two different occasions and analysed to determine the concentrations of compounds including: ephedrine, pseudoephedrine, amphetamine, 3,4-methylenedioxyamphetamine, 3,4-methylenedioxymethamphetamine, methamphetamine, cocaine, and benzoylecgonine. Here, we show that detectable levels of illicit drug and metabolites are being emitted on a consistent basis after having persisted through the wastewater treatment process. The concentrations of methamphetamine are in excess of previously reported surface water concentrations. The estimated total load of compounds being discharged on a daily basis is greater than similar sized catchment areas. The results presented here are of concern from both an ecological and human health perspective.

1. Introduction
Illicit and regulated compounds are considered to be contaminants of emerging concern (CEC) due to the potential negative impacts on the environment and human health [1]. Excreted as either the parent compound or as metabolites, these CECs have been reported to persist into the wider environment [2,3,4,5,6]. Wastewater treatment plants (WTPs) are generally not required to remove illicit and regulated CECs and these compounds are reported to last through the wastewater treatment process [7,8,9]. Receiving water bodies therefore can be considered to be the most susceptible environmental for contamination by CECs [10].
Untreated wastewater influent has been used to estimate the use of illicit drugs by a population [4,5,11]. A study of 23 countries with reported data for methylamphetamine, amphetamine, cocaine, and 3,4-methylenedioxymethamphetamine (MDMA) highlighted that Australia has the second highest total estimated consumption overall after the United States of America [12]. The amount of methamphetamine consumption reported from untreated influent wastewater has been reported as significant compared to many European cities with mean Australian values of 804 mg/day/1000 people [13]. Worldwide, the reported removal rates through the modern treatment of wastewater vary from 13 percent for MDMA and 70 percent for ephedrine [8], to 93 percent for benzoylecgonine [14], and up to 100 percent for amphetamine [15] and mehylamphetamine [16]. Despite reports that WTPs remove the majority of illicit compounds, the discharge of treated wastewater effluent into waterways has resulted in the detection of these compounds in surface waters in Europe [2,7,8] and in North America [17,18,19].
Stimulants such as amphetamine have the potential to influence both the ecological function in aquatic ecosystems as known disruptors to catecholamine production/reception in mammals, and they may also disrupt catecholamines production or function in aquatic algae [1]. Mussels exposed to 50.0 g/L of cocaine had alterations to lysosomal membrane stability and DNA strand breaks in the gills after 96 h of exposure [20]. European eels exposed to 20 ng/L of cocaine over 30 days changed brain dopamine and plasma catecholamine levels and the activity of pituitary–adrenal–thyroid axes [21]. Cocaine has also had effects on European eel histology including skin [22] and muscle [23]. Potential ecological impacts are dependent upon bioaccumulation rates, the persistence of cocaine in natural waters, and proximity to WTP effluent discharge location [10,24]. There is a need for detailed information on the discharge of illicit compounds into the environment that takes note of individual treatment plant size and variances through time.
The present work provides an Australian context to the presence of illicit drugs being released into the aquatic environment from the discharge of tertiary treated municipal wastewater into the Hawkesbury-Nepean River (New South Wales, Australia). The Hawkesbury-Nepean is the largest river system in the Sydney basin, with a rapidly urbanising catchment area of 21,400 km and the studied WTPs servicing a population of over 1.1 million people. The objectives were to evaluate the presence of illicit compounds in discharge water from WTPs, and to compare daily loads of these illicit drugs in the receiving waterways. The reported concentrations and loads were compared with international studies to provide a perspective for illicit and regulated CEC loads in similar urbanised landscapes.
2. Materials and Methods
2.1. Sampling Program
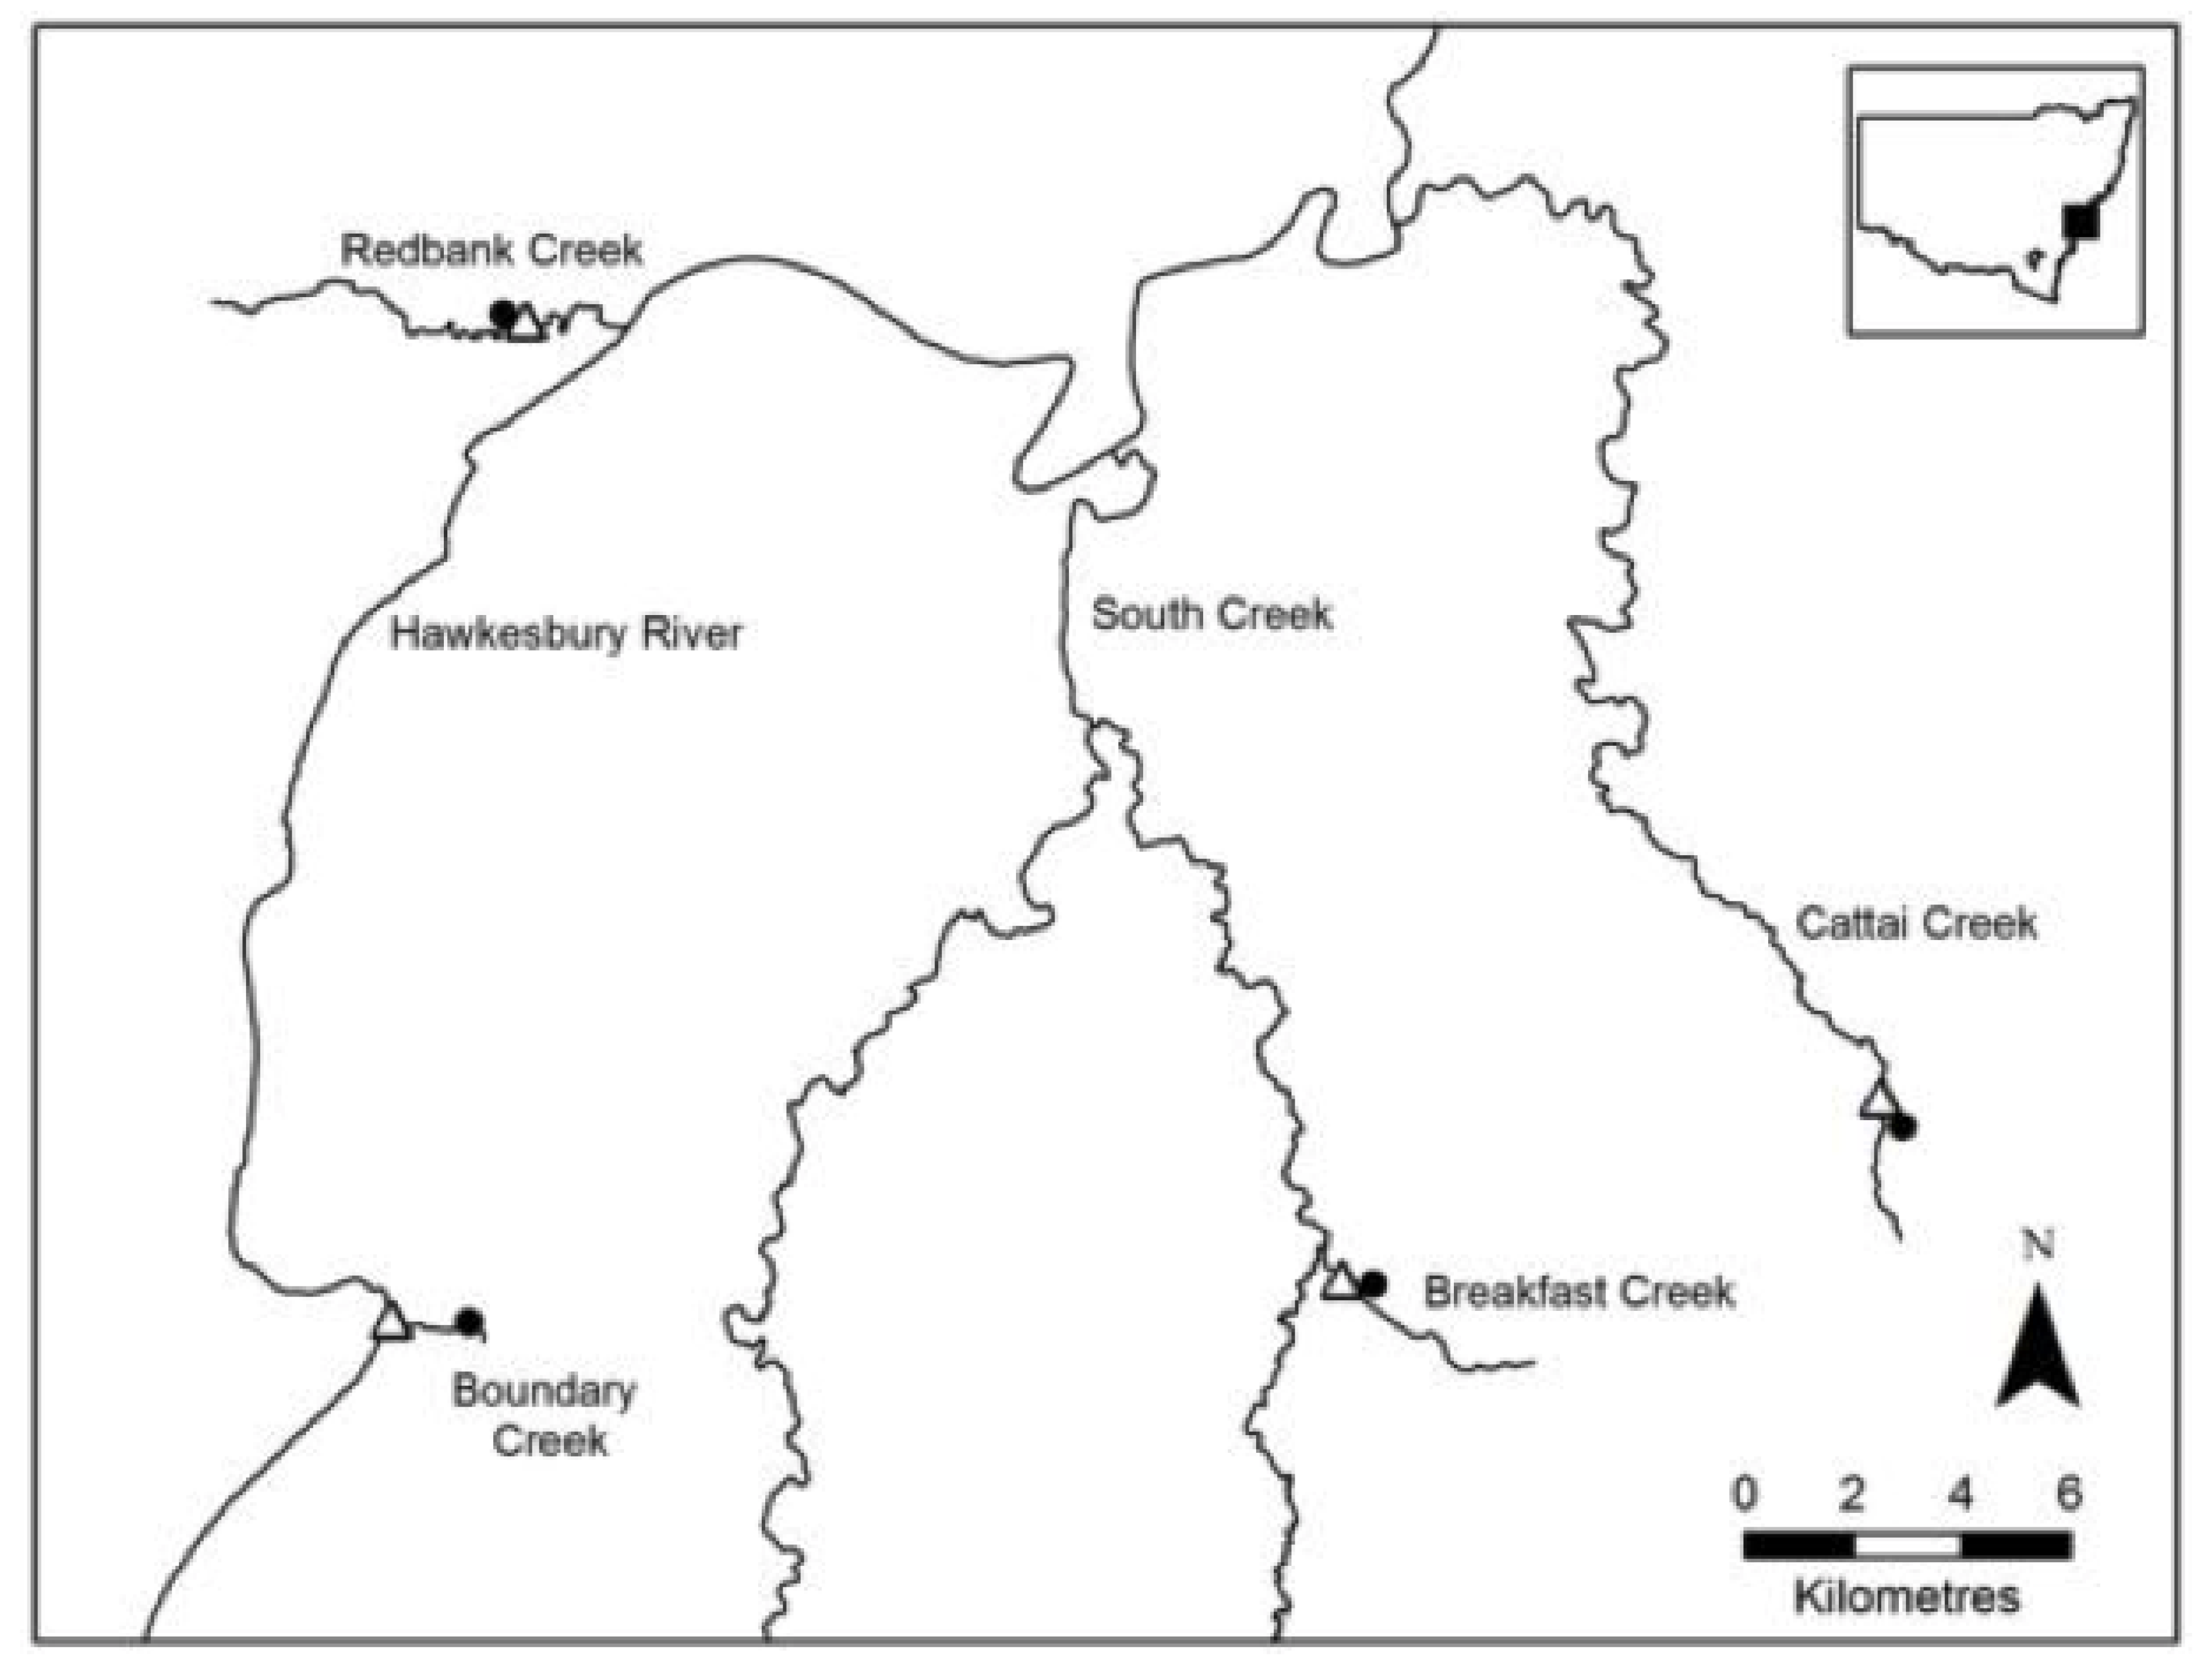
Water samples were collected at the discharge point of four WTPs that discharge tertiary treated wastewater into tributaries of the Hawkesbury-Nepean River, New South Wales, Australia (Figure 1). Duplicate 500 mL grab samples were collected at each of the four discharge points on a single day on two occasions, April 2017 and August 2017. This corresponds to dry autumn and winter conditions with predicted limited variation in illicit drug concentration [8]. Water samples were collected at the effluent discharge point entering the individual creeks as grab samples with control samples at each site collected within 50 m upstream of the discharge point. Samples were maintained at 4 °C until their arrival at the laboratory and then filtered through glass microfiber GF/A filters (Whatman, UK) and stored at 4 °C. All subsequent analytical work was undertaken within 24 h.
2.2. Analytical Techniques
The analytical method tested for the presence of the following illicit drugs, their metabolites and precursors: cocaine (COC), benzoylecgonine (BEN); amphetamine (AMP); methamphetamine (MAMP); 3,4-methyl-enedioxymethamphetamine (MDMA); 3,4-methylenedioxyamphetamine (MDA); pseudoephedrine (PSE); and ephedrine (EPH) (Appendix Table A1). The following six deuterated molecules were used as internal standards: Cocaine-d3, Benzylecgonine-d3, Amphetamine-d5, methamphetamine-d5, MDMA-d5 and MDA-d5. Certified reference standards were sourced from Lipomed (Lipomed Ag, Switzerland) and Chiron (Chiron, Norway) as 1 mg free base in either 1 mL methanol or 1 mL acetonitrile. Working standards were prepared daily by dilution with analytical grade methanol and stored at 5 °C.
The method for compound extraction and analysis was based largely on Castiglioni et al. [15], with the following refinements. Triplicate Solid-Phase Extraction (SPE) phase was performed using mixed reversed-phase cation-exchange cartridges (XCEL I) with 200 mL of the sample spiked with 10 uL of internal standard mix, passed through the SPE cartridge under vacuum at 3 mL/min flow and vacuum dried for 10 min. Elution was performed using 3 mL methanol: ammonium hydroxide (98:2). Mobile phases were filtered through a 0.22 m membrane polypropylene filter (Millipore, USA). Eluents were analysed using Liquid Chromatography–Tandem Mass-Spectrometry using a Shimadzu 8050 HPLC-MS/MS (Shimadzu, Japan) and ACE C18-pentafluorophenyl column (Advanced Chromatography Technologies Ltd., Aberdeen, UK).
Multiple reaction monitoring (MRM) and retention times were verified using the certified reference materials and deuterated compounds. QA/QC where the ratio of the retention times of the analytes in spiked matrix and standard solution were within ±5% tolerance. Method detection limits (LODs) were confirmed by injecting triplicate extracts spiked at 10 ng/L. The limits of quantification (LOQs) were the lower concentration that provided acceptable recovery (relative recoveries ≥ 85%) for spiked water samples in triplicate.
2.3. Calculation of Total Discharge and Mass Amounts
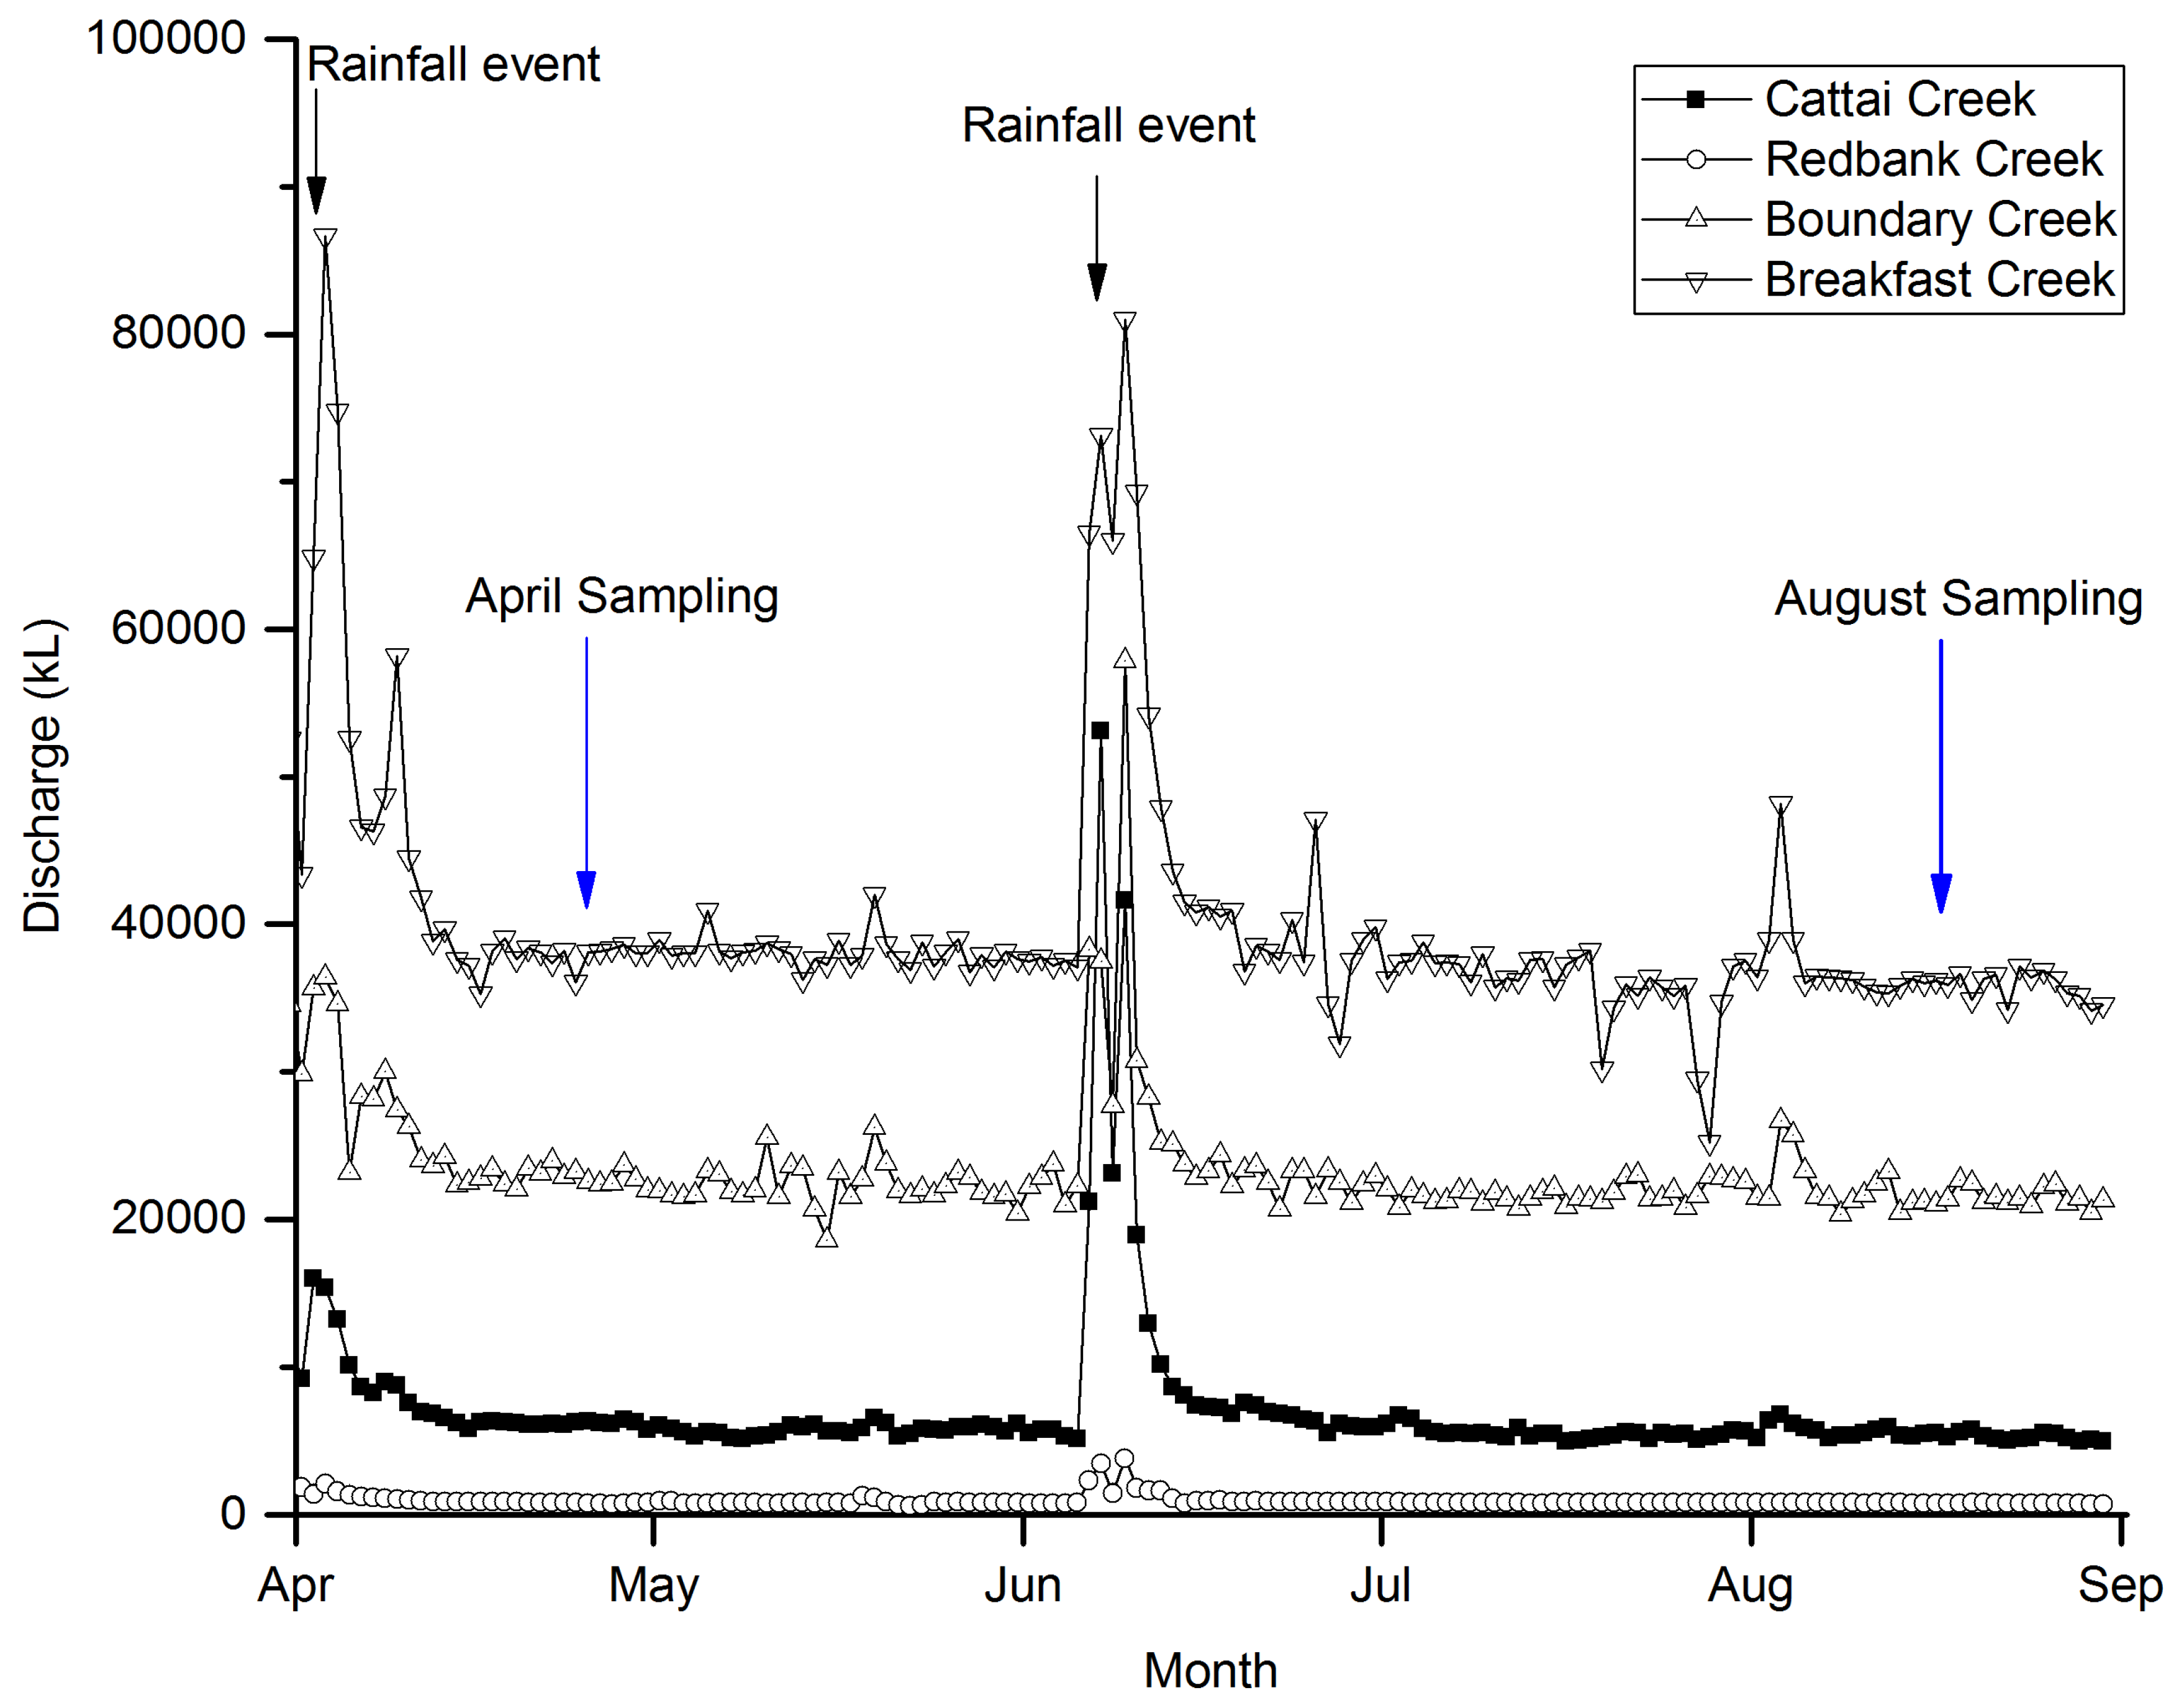
Total daily discharge volumes from each individual wastewater treatment facility over a five-month period was sourced from Sydney Water [25]. The mean daily discharge volumes were used to calculate daily loads of illicit drugs to the receiving creeks from the mean concentrations of illicit drugs in the water (g/L) [25]. The mean daily volume discharge from the selected plants (Figure 2) ranges from a low of 0.9 ML/day at North Richmond WTP which discharges into Redbank Creek, 7 ML/day at Castle Hill WTP discharges into Cattai Creek, 23.4 ML/day from Penrith WTP which discharges into Boundary Creek up to 40 ML/day at Quakers Hill WTP which discharges into Breakfast Creek. Each individual WTP was consistent in discharge volume and at normal operational discharge volumes during the two sampling periods (Figure 2). Conversion of the metabolite benzoylecgonine to the parent cocaine was calculated from the metabolite concentration multiplying by a factor of 2.33. This takes into account the average molar fraction (45%) and molar mass ratio (0.95) of a cocaine dose that is excreted as the metabolite [26].
3. Results
3.1. Detection of Illicit Compounds
All of the investigated compounds were detected at each site across the sampling periods at concentrations in the g/L range (Table 1). The Breakfast Creek with the highest discharge volume at 40 ML/day was the only location where concentrations for MDA in April and ephedrine in August were below the analytical detection limit. Concentrations in August (winter) were higher across all sites for pseudoephedrine, methamphetamine, cocaine, and benzoylecgonine with all other compounds varying between August and April.
The mean concentration of methamphetamine was 9.7 g/L for all sampling periods. The highest concentrations of methamphetamine was recorded for the Redbank Creek (lowest mean discharge volume at 0.9 ML/day) with 25.25 g/L in August and 15.46 g/L in April. Methamphetamine concentrations were higher in the August samples across all sites. This is in contrast to amphetamine with variance between peak concentrations in either the April or August samples depending upon site. Amphetamine had a mean concentration of 0.15 g/L for all sites and a maximum concentration of 0.56 g/L at Boundary Creek in August.
Cocaine and the metabolite benzoylecgonine had mean concentrations of 0.86 g/L and 8.03 g/L for all sites with August samples having higher concentrations than the April samples. The maximum concentration of cocaine was 2.99 g/L at Redbank in August with the same sample providing the maximum metabolite concentration at 21.57 g/L. The treated effluent had ratios of cocaine to benzoylecgonine ranging between a minimum of 0.06 at Boundary Creek in April to a maximum of 0.20 at the same location in August. The mean cocaine to benzoylecgonine ratio for all samples was 0.11 which is greater than previously published surface water data but within the range of untreated influent wastewater data [26].
The stimulants ephedrine and pseuodephedrine had mean concentrations of 1.2 g/L and 9.9 g/L respectively with only pseudoephedrine having higher August concentrations relative to April. As with cocaine and benzoylecgonine, the Redbank Creek in August sample had the highest concentration for ephedrine at 2.21 g/L and pseudoephedrine at 18.63 g/L. This was repeated with MDA with a mean concentration of 0.49 g/L and highest concentration recorded at 1.51 g/L at the Redbank Creek in August sample. However, MDMA with a mean concentration of 0.81 g/L and the highest concentration of 1.99 g/L reported at Cattai Creek in April.
3.2. Discharge Quantities
The discharge of illicit compounds and metabolites was extrapolated to daily loads using the reported discharge volumes from each WTP (Table 2). The discharge rates during the April and August sampling periods were within the 95 % confidence limits of discharge volume mean and ranged from 0.9 ML per day for Redbank Creek to 40 ML per day for Breakfast Creek. The estimated total load of all measured compounds in the discharged effluent from the combined four sites totals 1125 g per day for April and in August reaches a total of 1902 g per day.
Breakfast Creek had the greatest methamphetamine load with a max of 400.5 g per day in August due to the high effluent discharge volume. The mean total load of methamphetamine is 121 g per day for all samples combined. This is in contrast to Redbank Creek which had the highest measured concentration per litre at 25.25 g/L and a mean methamphetamine load of 20.2 g per day. The greatest estimated load for amphetamine is at the Boundary Creek site at 13.1 g per day in August, which had a lower effluent discharge rate than Breakfast Creek that emitted only 3.12 g per day in August.
The mean daily load for cocaine across all sites was 14.61 g/day for April and 52.81 g/day for August, whilst the metabolite benzoylecgonine was 180 g/day for April up to 427 g/day in August. As with methamphetamine, the highest loads for cocaine were at Breakfast Creek with a mean of 17.6 g/day even though Redbank Creek had the greater concentrations. The total load of metabolite benzoylecgonine and cocaine are in line with previously reported concentrations by Zuccato et al. [26], albeit at the higher end.
The greatest mean load for all compounds was the stimulant pseuodephedrine with 498.2 g/day in April and 681.9 g/day in August. In contrast, the stimulant ephedrine had similar loads for the sampling periods at 47.1 g/day in April with a lower load of 40.1 g/day in August. The highest levels of pseudoephedrine were at Breakfast Creek in August, which has the largest effluent discharge volume. In contrast, Boundary Creek with a lower effluent discharge volume had the highest total daily load for amphetamine, MDA and MDMA.
When comparing the sum total daily loads from the individual WTPs, taking into account the effluent discharge volumes from each site, there is a lower estimate of 38.36 g/day (Redbank Creek in April) and an upper estimate of 1076 g/day (Breakfast Creek in August). From the four combined WTPs averaged across the two sampling periods, there is an estimated 1513 g/day load being discharged into the Hawkesbury-Nepean River system.
4. Discussion
The detection of the illicit compounds cocaine and methamphetamine are greater than those reported in comparable literature. Our study found methamphetamine in concentrations varying from 3.09 g/L to 25.25 g/L. These levels are higher than previous studies that have found maximum concentrations of 0.002 g/L [17] and 0.0008 g/L [8] with some studies reporting no detection of methamphetamine or amphetamine [19]. This is not surprising as reported use in European countries is 200 mg/day/1000 people [27] whilst in the New South Wales area (approximate to this study) values have been reported as 595–995 mg/day/1000 people [13]. This is far in excess of reported loads from comparable studies but is within wastewater effluent concentrations reported in Australia [12].
Few studies have reported total daily loads of illicit drugs being discharged into the environment, but there are two studies that we can compare our data to, one from the river Taff in Wales, UK [2] and another from Italy [7]. Zuccato et al. [7] found a daily load of benzoylecgonine ranging from 8 g/day to 391 g/day and a daily load of cocaine of 1.9 to 60 g/day. The total loads reported here averaged across all samples are 274 g/day for benzoylecgonine and 33 g/day for cocaine. This places the results in line with more urbanised systems that have greater populations. The concentrations of cocaine and the metabolite benzoylecgonine were above those reported in European and north American studies. This study reports mean concentrations of 0.86 g/L for cocaine and 8.03 g/L for benzolycogonine. Related studies have reported cocaine and benzoylecgonine in surface waters at concentrations of 0.01 and 0.1 g/L in Spain [28], 0.11 and 0.5 g/L in Belgium [29] with 0.007 and 0.02 g/L in Canadian surface waters [19]. A comprehensive review by Pal et al. [10] found no reported concentrations of cocaine in surface waters greater than the ng/L range with one study in Spain reporting 0.044 g/L [30] and a maximum concentration of benzoylecgonine at in Sar at 0.316 g/L [31]. Comparable concentrations have been reported from direct wastewater analysis with cocaine being reported at 4.7 g/L and benzoylecgonine at 7.4 g/L in Spain [32]. The concentrations of cocaine in this study have been reported to impact mussels [20] and eels [21,22].
Despite elimination rates that can reach >90 per cent during wastewater treatment, cocaine and benzoylecgonine are ubiquitous in surface waters [10] and present in this study. Based on reported human excretion values of cocaine and benzoylecgonine after cocaine consumption (1–9 per cent and 35–54 per cent, respectively) [33] and their molar mass relation, the excreted cocaine to benzoylecgonine ratio should range from 0.02 to 0.27 [26]. Here, the ratios for all samples falls within these bounds with a mean value of 0.11 and a range of 0.04–0.21. Conversion of the benzoylecgonine to total cocaine equivalents load entering the system is estimated to be 428 g/day for April and 898 g/day for August. This is compared to the 3800 g/day reported by Zuccatto et al. [26] for the Po River noting the differences in population between the two study sites and the higher actual concentrations reported in this work.
The mean concentration of the stimulants amphetamine (1.5 g/L), ephedrine (1.2 g/L), MDA (0.5 g/L), and pseudoephedrine (9.9 g/L) were present at all sampling locations and were at and above concentrations reported worldwide. The mean ephedrine concentrations measured in this study at 1.2 g/L are above maximum levels reported in studies from Spain at 0.309 g/L [30]. Pseudoephedrine is not as widely reported, but concentrations in wastewater effluent in the United Kingdom have maximum reported concentrations 0.127 g/L [8] compared to the 9.9 g/L reported in this study. Higher levels of ephedrine/psuedoephedrine can be considered potential illicit drug precursor materials but are more likely due to the widespread use of decongestants with August concentrations generally higher than April concentrations across all sampling sites at these reported concentrations. Amphetamine was detected with a mean of 0.15 g/L across all samples, which is comparable to 0.03 g/L detected in Spain [34] and 0.12 g/L in Canada [19]. Whereas some studies report no detection of MDMA in surface water, this study reports a mean of 0.81 g/L across all sampling sites, suggesting widespread use of this compound. MDMA ranged from 0.03 g/L to 1.99 g/L, in our study and has been previously reported at levels of 0.0005 g/L [17] and 0.0134 g/L [8]. MDA can be used a stimulant and is also an active metabolite of MDMA consumption [35]. Maximum concentrations in UK wastewater have been reported at 0.25 g/L, which is comparable to the mean concentrations reported here at 0.49 g/L.
These differences in both concentration and overall load could be due to a number of factors including different wastewater treatment processes [8,16], the influent volumes (the illicit drug use of the population served) [16] and dilution rates (flow volume of the receiving water body and the volume of WTP effluent). The data reported here were sampled directly at the effluent discharge location and allowed for minimal mixing with the environmental water. The samples were all collected under normal flow regimes from each WTP and no dilution effects (such as rain or additional WTP discharge) were incurred.
5. Conclusions
Our findings show that illicit compounds including methamphetamine and cocaine are a contaminant in the surface waters of tributaries that flow to the Hawkesbury-Nepean River, which is the largest river in the Sydney basin. This presents a problem in rapidly urbanising areas such as this study site that have constrained waterways with increasing daily wastewater load, and no change in the receiving waterways size. Our data show that several contaminants are within range for those reported in surface waters worldwide except for methamphetamine, which is emitted at higher concentrations than previously reported. The treatment protocols in place for the WTP discharge water in this study have not completely removed these emerging contaminants. The concentrations reported here that are discharged into the Hawkesbury-Nepean River system are similar to more heavily urbanised catchments in Europe and pose a concern to the environmental management of these waterways.
Author Contributions
Conceptualisation, J.K.R. and K.P.; methodology, K.P. and J.K.R.; formal analysis, M.R. and I.A.W.; investigation, M.R. and K.P.; and supervision, J.K.R.
Funding
This research received no external funding.
Acknowledgments
The authors wish to thank Sue Cusbert and Michael Franklin for technical support and Envirolab for supporting analytics.
Conflicts of Interest
The authors declare no conflict of interest.
Appendix A

Table A1.
Method validation and LOD and LOQ relative to internal standards and matrix for LC MS/MS.
| Compound | % Recovery ± SD at 10 ng/L | LOD (ng/L) | LOQ (ng/L) |
|---|---|---|---|
| Ephedrine | 93 ± 3.1 | 0.10 | 0.31 |
| Pseudoephedrine | 103 ± 2.8 | 0.08 | 0.25 |
| Amphetamine | 95 ± 3.4 | 0.10 | 0.33 |
| MDA | 101 ± 5.6 | 0.35 | 1.01 |
| Methamphetamine | 107 ± 3.2 | 0.18 | 0.8 |
| MDMA | 101 ± 2.4 | 0.10 | 0.33 |
| Cocaine | 100 ± 3.8 | 0.02 | 0.07 |
| Benzoylecognine | 101 ± 2.7 | 0.06 | 0.18 |
References
- Rosi-Marshall, E.; Snow, D.; Bartelt-Hunt, S.; Paspalof, A.; Tank, J. A review of ecological effects and environmental fate of illicit drugs in aquatic ecosystems. J. Hazard. Mater. 2015, 282, 18–25. [Google Scholar] [CrossRef]
- Kasprzyk-Hordern, B.; Dinsdale, R.M.; Guwy, A.J. The occurrence of pharmaceuticals, personal care products, endocrine disruptors and illicit drugs in surface water in South Wales, UK. Water Res. 2008, 42, 3498–3518. [Google Scholar] [CrossRef]
- Ort, C.; Lawrence, M.G.; Rieckermann, J.; Joss, A. Sampling for pharmaceuticals and personal care products (PPCPs) and illicit drugs in wastewater systems: Are your conclusions valid? A critical review. Environ. Sci. Technol. 2010, 44, 6024–6035. [Google Scholar] [CrossRef]
- Metcalfe, C.; Tindale, K.; Li, H.; Rodayan, A.; Yargeau, V. Illicit drugs in Canadian municipal wastewater and estimates of community drug use. Environ. Pollut. 2010, 158, 3179–3185. [Google Scholar] [CrossRef] [Green Version]
- van Nuijs, A.L.; Castiglioni, S.; Tarcomnicu, I.; Postigo, C.; Lopez de Alda, M.; Neels, H.; Zuccato, E.; Barcelo, D.; Covaci, A. Illicit drug consumption estimations derived from wastewater analysis: A critical review. Sci. Total Environ. 2011, 409, 3564–3577. [Google Scholar] [CrossRef]
- Yadav, M.K.; Short, M.D.; Aryal, R.; Gerber, C.; van den Akker, B.; Saint, C.P. Occurrence of illicit drugs in water and wastewater and their removal during wastewater treatment. Water Res. 2017, 124, 713–727. [Google Scholar] [CrossRef]
- Zuccato, E.; Castiglioni, S.; Bagnati, R.; Chiabrando, C.; Grassi, P.; Fanelli, R. Illicit drugs, a novel group of environmental contaminants. Water Res. 2008, 42, 961–968. [Google Scholar] [CrossRef]
- Baker, D.R.; Kasprzyk-Hordern, B. Spatial and temporal occurrence of pharmaceuticals and illicit drugs in the aqueous environment and during wastewater treatment: New developments. Sci. Total Environ. 2013, 454–455, 442–456. [Google Scholar] [CrossRef]
- Scott, P.D.; Bartkow, M.; Blockwell, S.J.; Coleman, H.M.; Khan, S.J.; Lim, R.; McDonald, J.A.; Nice, H.; Nugegoda, D.; Pettigrove, V.; et al. A national survey of trace organic contaminants in Australian rivers. J. Environ. Qual. 2014, 43, 1702–1712. [Google Scholar] [CrossRef]
- Pal, R.; Megharaj, M.; Kirkbride, K.P.; Naidu, R. Illicit drugs and the environment—A review. Sci. Total Environ. 2013, 463–464, 1079–1092. [Google Scholar] [CrossRef]
- Australian Criminal Intelligence Commission. National Wastewater Drug Monitoring Program Report No. 3; Australian Criminal Intelligence Commission, 2017. Available online: https://acic.govcms.gov.au/ (accessed on 21 May 2019).
- Australian Criminal Intelligence Commission. National Wastewater Drug Monitoring Program Report No. 5; Australian Criminal Intelligence Commission, 2018. Available online: https://acic.govcms.gov.au/ (accessed on 21 May 2019).
- Wilkins, C.; Lai, F.Y.; O’Brien, J.; Thai, P.; Mueller, J. Comparing methamphetamine, MDMA, cocaine, codeine and methadone use between the Auckland region and four Australian states using wastewater-based epidemiology (WBE). N. Z. Med. J. 2018, 131, 12–20. [Google Scholar]
- Bones, J.; Thomas, K.V.; Paull, B. Using environmental analytical data to estimate levels of community consumption of illicit drugs and abused pharmaceuticals. J. Environ. Monit. 2007, 9, 701–707. [Google Scholar] [CrossRef]
- Castiglioni, S.; Zuccato, E.; Crisci, E.; Chiabrando, C.; Fanelli, R.; Bagnati, R. Identification and measurement of illicit drugs and their metabolites in urban wastewater by liquid chromatography-tandem mass spectrometry. Anal. Chem. 2006, 78, 8421–8429. [Google Scholar] [CrossRef]
- Kasprzyk-Hordern, B.; Dinsdale, R.M.; Guwy, A.J. The removal of pharmaceuticals, personal care products, endocrine disruptors and illicit drugs during wastewater treatment and its impact on the quality of receiving waters. Water Res. 2009, 43, 363–380. [Google Scholar] [CrossRef]
- Jones-Lepp, T.L.; Alvarez, D.A.; Petty, J.D.; Huckins, J.N. Polar organic chemical integrative sampling and liquid chromatography-electrospray/ion-trap mass spectrometry for assessing selected prescription and illicit drugs in treated sewage effluents. Arch. Environ. Contam. Toxicol. 2004, 47, 427–439. [Google Scholar] [CrossRef]
- Loganathan, B.; Phillips, M.; Mowery, H.; Jones-Lepp, T.L. Contamination profiles and mass loadings of macrolide antibiotics and illicit drugs from a small urban wastewater treatment plant. Chemosphere 2009, 75, 70–77. [Google Scholar] [CrossRef]
- Rodayan, A.; Afana, S.; Segura, P.A.; Sultana, T.; Metcalfe, C.D.; Yargeau, V. Linking drugs of abuse in wastewater to contamination of surface and drinking water. Environ. Toxicol. Chem. 2016, 35, 843–849. [Google Scholar] [CrossRef]
- dos Santos Barbosa Ortega, A.; Maranho, L.A.; Nobre, C.R.; Moreno, B.B.; Guimarães, R.S.; Lebre, D.T.; de Souza Abessa, D.M.; Ribeiro, D.A.; Pereira, C.D.S. Detoxification, oxidative stress, and cytogenotoxicity of crack cocaine in the brown mussel Perna perna. Environ. Sci. Pollut. Res. 2018. [Google Scholar] [CrossRef]
- Gay, F.; Maddaloni, M.; Valiante, S.; Laforgia, V.; Capaldo, A. Endocrine Disruption in the European Eel, Anguilla anguilla, Exposed to an Environmental Cocaine Concentration. Water Air Soil Pollut. 2013, 224, 1579. [Google Scholar] [CrossRef]
- Gay, F.; Ferrandino, I.; Monaco, A.; Cerulo, M.; Capasso, G.; Capaldo, A. Histological and hormonal changes in the European eel (Anguilla anguilla) after exposure to environmental cocaine concentration. J. Fish Dis. 2016, 39, 295–308. [Google Scholar] [CrossRef]
- Capaldo, A.; Gay, F.; Lepretti, M.; Paolella, G.; Martucciello, S.; Lionetti, L.; Caputo, I.; Laforgia, V. Effects of environmental cocaine concentrations on the skeletal muscle of the European eel (Anguilla anguilla). Sci. Total Environ. 2018, 640–641, 862–873. [Google Scholar] [CrossRef]
- Boles, T.; Wells, M. Analysis of amphetamine and methamphetamine as emerging pollutants in wastewater and wastewater-impacted streams. J. Chromatogr. A 2010, 1217, 2561–2568. [Google Scholar] [CrossRef]
- Sydney Wastewater Treatment Plants. Available online: http://www.sydneywater.com.au/SW/water-the-environment/how-we-manage-sydney-s-water/wastewater-network/wastewater-treatment-plants/index.htm (accessed on 22 May 2018).
- Zuccato, E.; Chiabrando, C.; Castiglioni, S.; Calamari, D.; Bagnati, R.; Schiarea, S.; Fanelli, R. Cocaine in surface waters: A new evidence-based tool to monitor community drug abuse. Environ. Health 2005, 4, 14. [Google Scholar] [CrossRef]
- Thomas, K.V.; Bijlsma, L.; Castiglioni, S.; Covaci, A.; Emke, E.; Grabic, R.; Hernández, F.; Karolak, S.; Kasprzyk-Hordern, B.; Lindberg, R.H.; et al. Comparing illicit drug use in 19 European cities through sewage analysis. Sci. Total Environ. 2012, 432, 432–439. [Google Scholar] [CrossRef] [Green Version]
- Huerta-Fontela, M.; Galceran, M.T.; Ventura, F. Stimulatory Drugs of Abuse in Surface Waters and Their Removal in a Conventional Drinking Water Treatment Plant. Environ. Sci. Technol. 2008, 42, 6809–6816. [Google Scholar] [CrossRef]
- van Nuijs, A.L.; Pecceu, B.; Theunis, L.; Dubois, N.; Charlier, C.; Jorens, P.G.; Bervoets, L.; Blust, R.; Neels, H.; Covaci, A. Cocaine and metabolites in waste and surface water across Belgium. Environ. Pollut. 2009, 157, 123–129. [Google Scholar] [CrossRef]
- Bueno, M.M.; Uclés, S.; Hernando, M.; Fernández-Alba, A. Development of a solvent-free method for the simultaneous identification/quantification of drugs of abuse and their metabolites in environmental water by LC-MS/MS. Talanta 2011, 85, 157–166. [Google Scholar] [CrossRef]
- González-Mariño, I.; Quintana, J.; Rodríguez, I.; Cela, R. Determination of drugs of abuse in water by solid-phase extraction, derivatisation and gas chromatography-ion trap-tandem mass spectrometry. J. Chromatogr. A 2010, 1217, 1748–1760. [Google Scholar] [CrossRef]
- Huerta-Fontela, M.; Galceran, M.; Martin-Alonso, J.; Ventura, F. Occurrence of psychoactive stimulatory drugs in wastewaters in north-eastern Spain. Sci. Total Environ. 2008, 397, 31–40. [Google Scholar] [CrossRef]
- Postigo, C.; de Alda, M.J.; Barceló, D. Fully automated determination in the low nanogram per liter level of different classes of drugs of abuse in sewage water by on-line solid-phase extraction-liquid chromatography-electrospray-tandem mass spectrometry. Anal. Chem. 2008, 80, 3123–3134. [Google Scholar] [CrossRef]
- Vazquez-Roig, P.; Andreu, V.; Blasco, C.; Picó, Y. SPE and LC-MS/MS determination of 14 illicit drugs in surface waters from the Natural Park of L’Albufera (València, Spain). Anal. Bioanal. Chem. 2010, 397, 2851–2864. [Google Scholar] [CrossRef]
- European Monitoring Centre for Drugs and Drug Addiction. Assessing Illicit Drugs in Wastewater: Advances in Wastewater-Based Drug Epidemiology; Insights 22; Publications Office of the European Union: Luxembourg, Luxembourg, 2016. [Google Scholar] [CrossRef]
Figure 1.
The locations of sampling sites (triangles) and wastewater treatment plants (circles) sampled in Western Sydney, New South Wales, Australia.
Figure 1.
The locations of sampling sites (triangles) and wastewater treatment plants (circles) sampled in Western Sydney, New South Wales, Australia.

Figure 2.
Discharge volumes for each sample site in kL/day. Data sourced from Sydney Water. Sampling periods in April and August highlighted in blue arrow.
Figure 2.
Discharge volumes for each sample site in kL/day. Data sourced from Sydney Water. Sampling periods in April and August highlighted in blue arrow.

Table 1.
Concentration of illicit compounds and metabolites and 95 % confidence intervals for the April and August sampling periods (g/L) (bdl = below detection limit).
Table 1.
Concentration of illicit compounds and metabolites and 95 % confidence intervals for the April and August sampling periods (g/L) (bdl = below detection limit).
| Redbank Creek | Boundary Creek | Breakfast Creek | Cattai Creek | |||||
|---|---|---|---|---|---|---|---|---|
| April | August | April | August | April | August | April | August | |
| Ephedrine | 1.78 ± 0.11 | 2.21 ± 0.27 | 0.43 ± 0.04 | 1.16 ± 0.15 | 0.43 ± 0.01 | bdl | 1.72 ± 0.06 | 1.93 ± 0.28 |
| Pseudoephedrine | 11.33 ± 0.07 | 13.82 ± 1.80 | 2.96 ± 0.19 | 6.56 ± 1.71 | 7.46 ± 0.18 | 10.50 ± 0.01 | 7.88 ± 0.21 | 18.63 ± 2.53 |
| Amphetamine | 0.05 ± 0.01 | 0.17 ± 0.01 | 0.03 ± 0.00 | 0.56 ± 0.43 | 0.04 ± 0.00 | 0.08 ± 0.01 | 0.10 ± 0.01 | 0.24 ± 0.07 |
| MDA | 0.21 ± 0.01 | 1.51 ± 0.16 | 0.06 ± 0.00 | 0.60 ± 0.39 | bdl | 0.03 ± 0.00 | 0.97 ± 0.00 | 0.58 ± 0.07 |
| Methamphetamine | 15.46 ± 0.23 | 25.25 ± 2.83 | 3.09 ± 0.03 | 7.55 ± 2.27 | 4.40 ± 0.15 | 10.27 ± 0.22 | 3.89 ± 0.10 | 7.84 ± 1.02 |
| MDMA | 1.13 ± 0.01 | 1.51 ± 0.16 | 0.43 ± 0.00 | 0.60 ± 0.39 | 0.22 ± 0.00 | 0.03 ± 0.00 | 1.99 ± 0.05 | 0.58 ± 0.07 |
| Cocaine | 0.63 ± 0.00 | 2.99 ± 0.51 | 0.07 ± 0.00 | 0.68 ± 0.40 | 0.13 ± 0.01 | 0.75 ± 0.02 | 0.75 ± 0.03 | 0.91 ± 0.10 |
| Benzoylecgonine | 4.28 ± 0.02 | 21.57 ± 1.96 | 1.11 ± 0.02 | 3.29 ± 0.65 | 1.61 ± 0.05 | 5.94 ± 0.10 | 18.87 ± 0.40 | 17.58 ± 1.92 |
| COC:BEN | 0.15 | 0.14 | 0.06 | 0.21 | 0.08 | 0.13 | 0.04 | 0.05 |
Table 2.
Total effluent discharge loads based upon measured concentration and discharge volume in g/day for April and August sampling periods.
Table 2.
Total effluent discharge loads based upon measured concentration and discharge volume in g/day for April and August sampling periods.
| Redbank Creek | Boundary Creek | Breakfast Creek | Cattai Creek | |||||
|---|---|---|---|---|---|---|---|---|
| April | August | April | August | April | August | April | August | |
| Ephedrine | 1.95 | 1.77 | 11.44 | 27.12 | 19.78 | 0 | 13.93 | 11.19 |
| Pseudoephedrine | 12.46 | 11.06 | 78.74 | 153.4 | 343.2 | 409.5 | 63.82 | 108.1 |
| Amphetamine | 0.06 | 0.14 | 0.80 | 13.09 | 1.84 | 3.12 | 0.81 | 1.39 |
| MDA | 0.23 | 1.21 | 1.59 | 14.03 | 0 | 1.17 | 7.86 | 3.36 |
| Methamphetamine | 17.00 | 20.20 | 82.19 | 176.52 | 202.4 | 400.5 | 31.51 | 45.47 |
| MDMA | 1.24 | 1.21 | 11.44 | 14.03 | 10.12 | 1.17 | 16.12 | 3.36 |
| Cocaine | 0.69 | 2.39 | 1.86 | 15.89 | 5.98 | 29.25 | 6.08 | 5.28 |
| Benzoylecgonine | 4.71 | 17.26 | 29.53 | 76.92 | 74.06 | 231.6 | 71.85 | 101.96 |
| Total | 38.36 | 55.22 | 217.6 | 490.9 | 657.3 | 1076 | 211.9 | 280.1 |
© 2019 by the authors. Licensee MDPI, Basel, Switzerland. This article is an open access article distributed under the terms and conditions of the Creative Commons Attribution (CC BY) license (http://creativecommons.org/licenses/by/4.0/).
Share and Cite
MDPI and ACS Style
Paciuszkiewicz, K.; Ryan, M.; Wright, I.A.; Reynolds, J.K. Variations in Illicit Compound Discharged from Treated Wastewater. Water 2019, 11, 1071. https://doi.org/10.3390/w11051071
AMA Style
Paciuszkiewicz K, Ryan M, Wright IA, Reynolds JK. Variations in Illicit Compound Discharged from Treated Wastewater. Water. 2019; 11(5):1071. https://doi.org/10.3390/w11051071
Chicago/Turabian StylePaciuszkiewicz, Kasjan, Michelle Ryan, Ian A. Wright, and Jason K. Reynolds. 2019. "Variations in Illicit Compound Discharged from Treated Wastewater" Water 11, no. 5: 1071. https://doi.org/10.3390/w11051071
Note that from the first issue of 2016, this journal uses article numbers instead of page numbers. See further details here.