Agricultural Drought Risk Assessment in Southwest China


1
Key Laboratory of Land Surface Pattern and Simulation, Institute of Geographic Sciences and Natural Resources Research, Chinese Academy of Sciences, Beijing 100101, China
2
Department of Environment and Resources, University of Chinese Academy of Sciences, Beijing 100049, China
3
CAS Center for Excellence in Tibetan Plateau Earth Sciences, Chinese Academy of Sciences (CAS), Beijing 100101, China
4
Beijing Key Laboratory of Urban Hydrological Cycle and Sponge City Technology, College of Water Sciences, Beijing Normal University, Beijing 100875, China
5
School of Land Science and Technology, China University of Geosciences, Beijing 100083, China
*
Author to whom correspondence should be addressed.
Water 2019, 11(5), 1064; https://doi.org/10.3390/w11051064
Submission received: 10 April 2019
/
Revised: 13 May 2019
/
Accepted: 18 May 2019
/
Published: 22 May 2019
(This article belongs to the Section Water Resources Management, Policy and Governance)
Abstract
:Drought disasters jeopardize agricultural production and are expected to become more serious in the context of global climate change. However, in China, little attention has been paid to evaluating agricultural drought risk in humid areas (such as in Southwest China), which have also been affected by severe drought in recent years. In this work, we used the Standardized Precipitation Evapotranspiration Index (SPEI), which was computed from high-quality monthly precipitation and temperature data from 92 rain-gauge stations across Southwest China, to study the drought characteristics (e.g., intensity, duration, and frequency) and their decadal variations from 1960 to 2017. Furthermore, we applied a widely accepted conceptual model that emphasizes the combined role of drought hazard (calculated by the intensity and frequency of drought) and agricultural drought vulnerability (integrated with high-resolution soil properties, climate, topography, irrigation, and gross domestic product) to conduct a spatial assessment of agricultural drought risk at a 1-km grid scale. The results revealed that drought has become more serious and frequent in Southwest China, especially since the 2000s. About 27.4% of the agricultural area has been exposed to an extremely high risk of drought, 33.5% to a high risk, 22.5% to a moderate risk, and 16.6% to a low risk. The extreme agricultural risk areas were located mainly in northeastern and southeastern Chongqing, southwestern Sichuan, northeastern and eastern Guizhou, and central and eastern Yunnan. Our findings highlighted that more attention should be paid to the agricultural drought risk in humid regions of China. Furthermore, this work could set the stage for policy makers and practitioners to take measures to reduce the agricultural drought risk in Southwest China.
1. Introduction
Drought, commonly defined as a prolonged water deficit of an ecosystem during a determined period [1], is one of the most damaging natural disasters in the world [2]. The widespread drying caused by global climate change that is known to have occurred over most parts of the world from 1950 to 2008 [3,4] has challenged global food security because agriculture is the economic sector primarily affected by drought. Therefore, understanding the spatiotemporal characteristics of drought and assessing the agricultural drought risk are urgently needed to develop mitigation strategies that will alleviate the adverse effects of drought and eventually guarantee regional food security [5,6].
Most drought studies have focused mainly on the arid and semiarid regions of China [7,8,9], whereas little attention has been paid to the humid subtropical regions. However, changes in patterns of precipitation and evaporation with continuing global climate change are expected to result in drought events of greater magnitude and frequency [10,11,12]. The agriculture of humid subtropical areas can also suffer from the warming that accompanies drought, where the temperature may be close to the optimum for maximizing crop yields [13]. Southwest China, a typical humid subtropical region, has suffered great losses from extremely severe drought events, which have occurred with increasing frequency in recent years. For example, in the summer of 2006, the Sichuan and Chongqing provinces were hit by the most severe drought in the previous 50 years [14], with the average air temperature reaching 41–44.5 °C in some regions. This drought affected more than 2.5 million hectares of farmland and caused 30% of these areas to be harvestless. Another extreme drought event, considered a “once-in-a-century” drought, swept Southwest China from the summer of 2009 to the spring of 2010 [15]. It devastated crops across more than 4 million hectares of farmland, causing 25% of the areas to yield no harvest [16]. Such events raise an urgent need to enhance research on the agricultural drought risk in Southwest China.
Various methods have been used to assess the risk of agricultural drought. Among them is a conceptual model generally accepted by the Intergovernmental Panel on Climate Change (IPCC) and the United Nations Office for Disaster Risk Reduction (UNISDR) that defines risk by emphasizing the combined role of physical hazards and the vulnerability of elements to exposure [2,17,18,19]. In this conceptual model, two aspects are required to quantitatively evaluate the risk of agricultural drought: the intensity of the drought hazards and the vulnerability of crop planting areas to the drought events. To obtain a precise, quantitative assessment of drought hazards, various indices have been developed. Among these indices, the Palmer Drought Severity Index (PDSI) is one of the most widely used. It enables measurement of both wetness (positive values) and dryness (negative values) on a long-term scale [20] based on prior precipitation, moisture supply, runoff, and evaporation demand. However, the PDSI has a fixed temporal scale and lacks the multiscale character essential for determining the effect of drought events on different hydrological systems, natural vegetation, and agricultural areas, as well as for differentiating various drought types (e.g., meteorological, agricultural, hydrological, and socioeconomic) [21]. The meteorological drought is caused by precipitation deficits and may be combined with above-normal potential evaporation rates. If the precipitation deficits and/or increased evaporation rates are sustained for a sufficient period, which may result in agricultural drought with lower-than-average soil moisture available and hydrological drought with lower streamflow and groundwater levels [22,23]. The Standardized Precipitation Index (SPI) and the Standardized Runoff Index (SRI), developed by McKee et al. [24] and Shukla and Wood [25], respectively, has been widely used to study the meteorological and hydrological droughts because of their simplicity of calculation and because they can be calculated at different timescales to monitor droughts with respect to different usable water resources [26,27]. However, the deficiency of the SPI is that it is based only on precipitation data and the SRI is based only on runoff data. Within the context of global climate change, drought indices should preferably include the dynamics of temperature. Therefore, a new drought index proposed by Vicente-Serrano, et al. [28], the Standardized Precipitation Evapotranspiration Index (SPEI), has increasingly been used. It is calculated according to the difference between precipitation and potential evapotranspiration (PET). The SPEI combines the sensitivity of the PDSI to changes in evaporation demand (mainly caused by temperature fluctuations and trends) and the multi-temporal nature of the SPI, which is particularly appropriate for characterizing and reflecting the drought conditions under global climate change. Combining this drought index with several natural and social factors used to quantify agricultural drought vulnerability has yielded a conceptual model has increasingly been applied throughout the world in recent decades to determine the agricultural drought risk [29,30,31]. However, the reliability and accuracy of the evaluations depend not only on a suitable drought index and the performance of the evaluation model, but also on the availability of sufficiently high-quality empirical data sets. At present, the large number of meteorological stations across croplands in China can provide a high spatial resolution and monthly resolved weather data. These high-quality weather data in combination with high-resolution soil, topographic, and irrigation data provide a valuable data set to accurately assess the agricultural drought risk in China.
Previous studies have attempted such an assessment of the agricultural drought risk in China. For instance, Hao et al. [32] used county-level historical data on a drought disaster to evaluate the risk of an agricultural drought in China. Zhang et al. [8] combined the results of drought hazards calculated by the SPI and drought vulnerability, as defined by nine key social and physical factors, to conduct a quantitative assessment of the drought risk in the Tarim River basin, Xinjiang, China. He et al. [33] assessed the agricultural drought risk at a 10 × 10 km grid scale based on natural disaster analysis theory, where the drought hazard was calculated by the SPI and vulnerability was defined by the seasonal crop water deficiency and soil available water-holding capacity (AWC) and irrigation. Their findings provided a preliminary understanding of the process and physical mechanisms of agricultural drought risk and stressed the complexity of drought–climate relationships in China. However, previous studies have not made full use of these high-resolution data because of the limited number of stations in the study regions [7,8]. Additionally, most studies have assessed agricultural drought risk at the county level [8,32], which may not reflect the details of drought risk because environmental factors can vary enormously within an administrative district. Furthermore, previous studies have mainly used natural factors to quantify the agricultural drought risk, without considering the social coping capacity to alleviate the risk [33]. In addition, although previous studies have analyzed the agricultural drought risk based on a conceptual model that emphasizes the roles of the drought hazard and the agricultural drought vulnerability, the drought hazard has mainly been quantified based on the SPI [8,33,34], which may underestimate the risk of agricultural drought under global climate change. Therefore, a strong need exists to undertake a comprehensive analysis of the spatial pattern of agricultural drought risk at a regional level. This work represents an attempt to study the drought hazard based on the SPEI and to assess the agricultural drought risk at a 1-km grid scale in Southwest China.
This article addresses three projects. First, we analyzed the temporal variability of the SPEI during the period from 1960 to 2017. Second, we explored the spatial distribution of drought frequency and duration based on the SPEI at 3-, 6-, and 12-month timescales, and we calculated the decadal temporal variations of drought frequency and duration from 1960 to 1979, 1980 to 1999, and 2000 to 2017, respectively. Finally, we analyzed the spatial distribution of the drought hazard, agricultural drought vulnerability, and agricultural drought risk at a 1-km grid scale specifically for crop planting areas.
2. Study Area and Data
2.1. Study Area
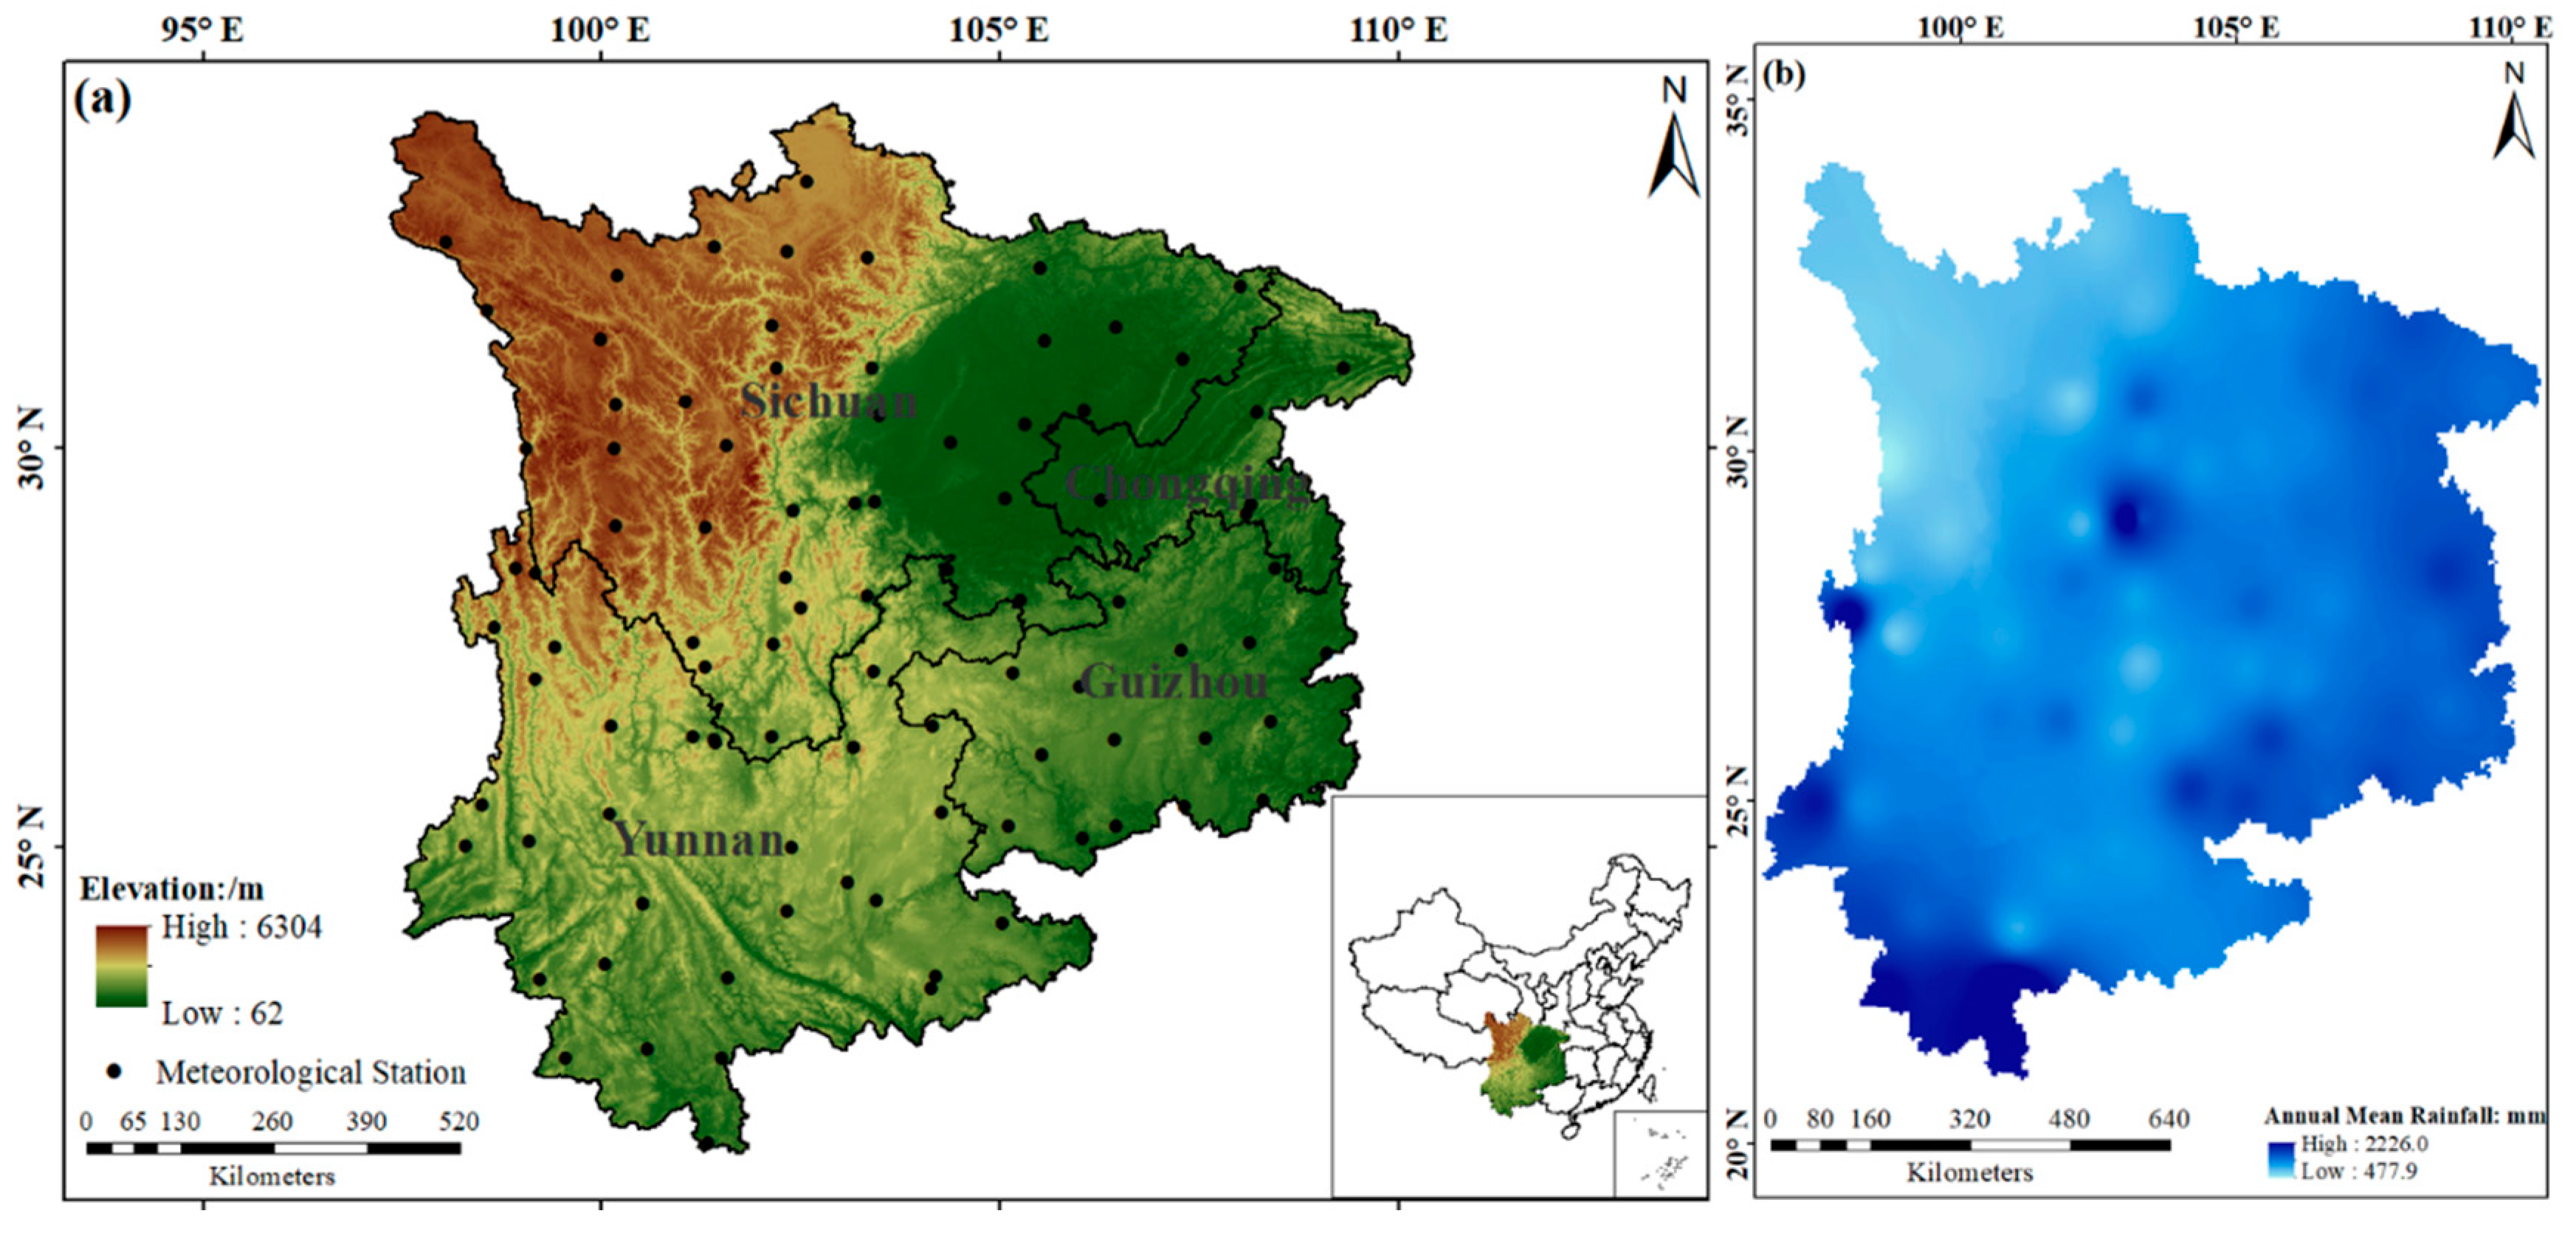
Southwest China is specified between 21–34° N and 97–110° E, which consists of three provinces, Yunnan, Sichuan, and Guizhou, and a municipality, Chongqing. It is a main grain producing area, providing approximately 16% of the national food supply, and the main planting rice (accounting for about 35.1% of the total grain production), corn (accounting for about 23.2%), potato (accounting for about 18.5%), wheat (accounting for about 11.6%), rapeseed, flue-cured tobacco, and other crops. Southwest China covers parts of the Tibetan Plateau, which has an average elevation of 4500 m; the Chengdu Plain, which has a flat terrain; most of the Sichuan Basin; and the Yunnan-Guizhou Plateau, which has different landforms and a complex topography. This latter area is also rich in limestone and has a rugged karst landform, which causes the surface water to infiltrate quickly and the soil organic matter to be lost. There are many rivers and lakes in these regions, including the Yangtze River, Pearl River, Dianchi Lake, and the Erhai. The climate is predominantly a subtropical monsoon type. The average annual temperature is 14–24 °C in most areas, and precipitation is between 600 and 2300 mm. However, seasonal precipitation has an uneven distribution, with the mean annual precipitation in the rainy season (April to October) constituting more than 85% of the total [35]. The annual precipitation in the region varies from 10% to 20%, which is higher than the international average coefficient of 8%.
2.2. Data Source and Processing
High-quality monthly precipitation and temperature data in the period from 1960 to 2017, which were recorded by 92 stations throughout Southwest China, were collected from the China Meteorological Data Sharing System [36]. The locations of the rain-gauge stations in Southwest China are shown in Figure 1. The missing data were replaced by the average data for the same month in the neighboring years.
Data on the irrigation area in Southwest China was extracted from irrigated land type data of China with a 100-m resolution and were subsequently transformed into 1 × 1 km raster data. The gross domestic product (GDP) data were extracted from the GDP data set at a kilometer scale in China. They were collected from the National Earth System Science Data Sharing Infrastructure [37].
The terrain slope of farming area (slope) was analyzed and calculated from the data set of the altitude in China; the soil AWC data were analyzed and calculated from the data set of Chinese soil types; and the farmland production potential (FPP) data were extracted from the data set of the potential annual average climate production data. All data sets were collected from the Resource and Environment Data Cloud Platform [38].
3. Method
3.1. Calculation of the SPEI
The SPEI is a drought index based on the difference between precipitation and PET that describes the degree of deviation in regional dry and wet conditions from climatological mean conditions. The SPEI is computed as follows:
(1) The PET is calculated [39] by
where T is the monthly mean temperature (°C); H is the heat index, calculated as the sum of 12 monthly index values; K is a correction coefficient, computed as a function of the latitude and month; and m is a coefficient depending on H, which is defined as
(2) The monthly difference between the precipitation and the PET is calculated by
where Pj is the total precipitation in month j (mm) and PETj is the total PET in month j (mm).
(3) The accumulated difference between the precipitation and the PET at different timescales (3, 6, 12, and 24 months) is calculated. The accumulated difference () in a given month j and year i depends on the chosen timescale k. For example, the accumulated difference for l month in a particular year i at the 12-month timescale is calculated by using
where Di,l (mm) is the P − PET difference in the first month of year i.
(4) The data sequence is normalized into a log-logistic probability distribution to obtain the SPEI index series. The SPEI uses the three-parameter log-logistic probability distribution suggested by Vicente-Serrano et al. [28]. For the data sequence of all timescales, the cumulative function of the log-logistic probability distribution F(X) is
where α, β, and γ are scale, shape, and origin parameters, respectively.
The SPEI can thus be obtained as the standardized values of F(X). P is the probability of a defined value
where for P ≤ 0.5 and P = 1 − F(X). If P > 0.5, then P is replaced by 1 − P and the sign of the resultant SPEI is reversed. The constants are as follows: C0 = 2.515517, C1 = 0.802853, C2 = 0.010328, d1 = 1.432788, d2 = 0.189269, and d3 = 0.001308.
Table 1 provides a categorization of drought severity based on the SPEI, in which the more negative the SPEI value, the more severe the drought. However, the SPEI has different implications at different timescales. For example, the SPEI for shorter timescales (1 or 3 months) can mirror prompt changes in soil moisture, which is important for food production, and the SPEI at longer timescales (6 and 12 months) can reflect medium-term trends in the precipitation patterns and may provide an annual estimation of the water conditions, which are usually associated with stream flows, reservoir levels, and even groundwater levels [40]. Therefore, the SPEI was calculated at 3- (SPEI3), 6- (SPEI6), and 12-month (SPEI12) timescales by using the monthly precipitation and temperature data during the period from 1960 to 2017, with the goal of exploring the variation in drought at short-term (interseasonal) and long-term (interannual) timescales.
3.2. Assessment of Agricultural Drought Risk
We considered both the drought hazard and the vulnerability of the exposed elements in assessing the agricultural drought risk, on the basis of the generally accepted conceptual model of disaster risk assessment [2,17,18,19]. In other words, such a conceptual model of risk assessment can be split into a hazard assessment and an assessment of the vulnerability of the exposed elements (agricultural). Because the focus of this study was on the drought risk to agriculture, we conducted the drought risk assessment only in the crop planting areas of Southwest China. The spatial resolution was at a 1 × 1 km grid scale. The conceptual model of agricultural drought risk assessment was constructed as [19,33]
where R is the agricultural drought risk. F is the conceptual function for an agricultural drought risk assessment, which consisted by f(h) and f(v). The function f(h) denotes the agricultural drought hazard, and the function f(v) denotes the agricultural drought vulnerability.
3.3. Assessment of Agricultural Drought Hazard
To investigate the spatial and temporal severity of drought in the crop planting areas of Southwest China, SPEI3, SPEI6, and SPEI12 were calculated based on monthly precipitation and temperature data from 1960 to 2017 and then interpolated into the 1 × 1 km raster data by using the kriging interpolation method. The occurrences of drought frequency and severity were identified for each single grid. In this study, the drought frequency with a specific drought severity was computed as the ratio of the drought occurrences to the total drought occurrences for each single grid [33,41]. The drought frequency for each feature of the theme was then classified into four classes by using the natural breaks method. Each drought severity category was assigned a specific weight and each class of occurrences was assigned a rating from 1 to 4 [8,31], with a high value indicating a high drought severity or high frequency of occurrence. The Drought Hazard Index (DHI) was calculated as follows
where M1Dr denotes the rating of a mild drought, M1Dw denotes the weight of a mild drought, M2Dr denotes the rating of a moderate drought, M2Dw denotes the weight of a moderate drought, SDr denotes the rating of a severe drought, SDw denotes the weight of a severe drought, VSDr denotes the rating of a very severe drought, and VSDw denotes the weight of a very severe drought.
3.4. Assessment of Agricultural Drought Vulnerability
Vulnerability was defined as (1) the sensitivity of exposed elements (social, economic, cultural, and environmental) to the effects of and damage suffered from either single or compound hazard events, and (2) the ability of those elements to respond to and recover from the impacts of such hazards [42,43,44,45]. Numerous factors could influence drought vulnerability. Because the focus of this study was on assessing vulnerability to agricultural drought, we selected five key vulnerability factors based on previous agricultural drought vulnerability assessments: (1) the farmland potential productivity (FPP), (2) the soil available water-holding capacity (AWC), (3) the slope of the farmland terrain, (4) the availability of irrigation, and (5) the gross domestic product (GDP) [31,46,47].
The FPP is a climate factor that refers to the possible crop yield per unit area as determined by climatic conditions (light, temperature, and moisture) and the crop variety when other factors (such as soil, nutrients, carbon dioxide, and agricultural technology) are in an optimal condition [48]. High FPP values indicate that the climatic conditions in these areas are more suitable for crop growth and thus have low agricultural drought vulnerability. The terrain in Southwest China is very complex, with interlaced basins, hills, and plateaus. The steep slope accelerates runoff from the surface and subsurface, leading to fast delivery of water [49], which is adverse to water storage in the soil. In this study, the slope of the farmland terrain was calculated from digital elevation model data by using ArcGIS software of 10.2 version. Irrigation is an important artificial measure of resistance to drought; a high ratio of irrigation is a better drought mitigation measure than rain-fed dry lands, and it provides farmers with an improved ability to cope with a short-term drought condition [47]. The GDP was used to quantify the economic conditions related to drought. As a rule, in rich areas, government institutions or farmers can make powerful investments to reduce the drought risk, whereas poor areas suffer more from drought hazards [50,51]. Such a rule is supported by research results indicating that the GDP is consistently correlated with drought vulnerability across China [52]. The soil AWC reflects the ability of different soil types to buffer crops during periods of moisture deficiency, which is commonly defined as the difference in water content between field capacity (FC) and permanent wilting point (WP). Pedo-transfer functions (PTFs), uses actual measured soil data to establish a functional relationship between the physical and chemical properties of the soil and the hydraulic parameters, are widely used method for estimation soil AWC [53,54,55]. One of the PTFs to calculate soil AWC is [53]
where PC is relative percentage of clay (<0.002 mm); PS is relative percentage of sand (0.05–2 mm); POM is relative percentage of soil organic matter. Because the focus of this article is on agricultural drought, the soil data used in this paper is from the tillage layer (0–20 cm).
The values of FPP, AWC, slope, and GDP were classified into one of four classes based on the natural breaks method and were then assigned a weighting from 1 to 4 (with high values indicating high vulnerability), respectively. The irrigation factor was classified into one of two classes with a weighting of 1 or 4. Finally, the Agricultural Drought Vulnerability Index (ADVI) was defined as
where ADVI is the Agricultural Drought Vulnerability Index, SLW is the weighting of the slope, FPPW is the weighting of the crop farmland production potential, AWCW is the weighting of the soil available water-holding capacity, IRRW is the weighting of the availability of irrigation, and GDPW is the weighting of the GDP. The resulting map based on the ADVI value of each grid was reclassified into four classes according to the natural break method: low, moderate, high, and extremely high vulnerability, respectively.
On the basis of the DHI and ADVI, agricultural drought risk patterns were mapped according to the formula [19,31]
where ADRI is the Agricultural Drought Risk Index and the values of DHI and ADVI stand for the category of drought hazard and the class of agricultural drought vulnerability, ranging from 1 to 4. An increasing value indicates a higher risk.
4. Results
4.1. Spatial and Temporal Characteristics of Drought in Southwest China from 1960 to 2017
4.1.1. Temporal Variability of the SPEI
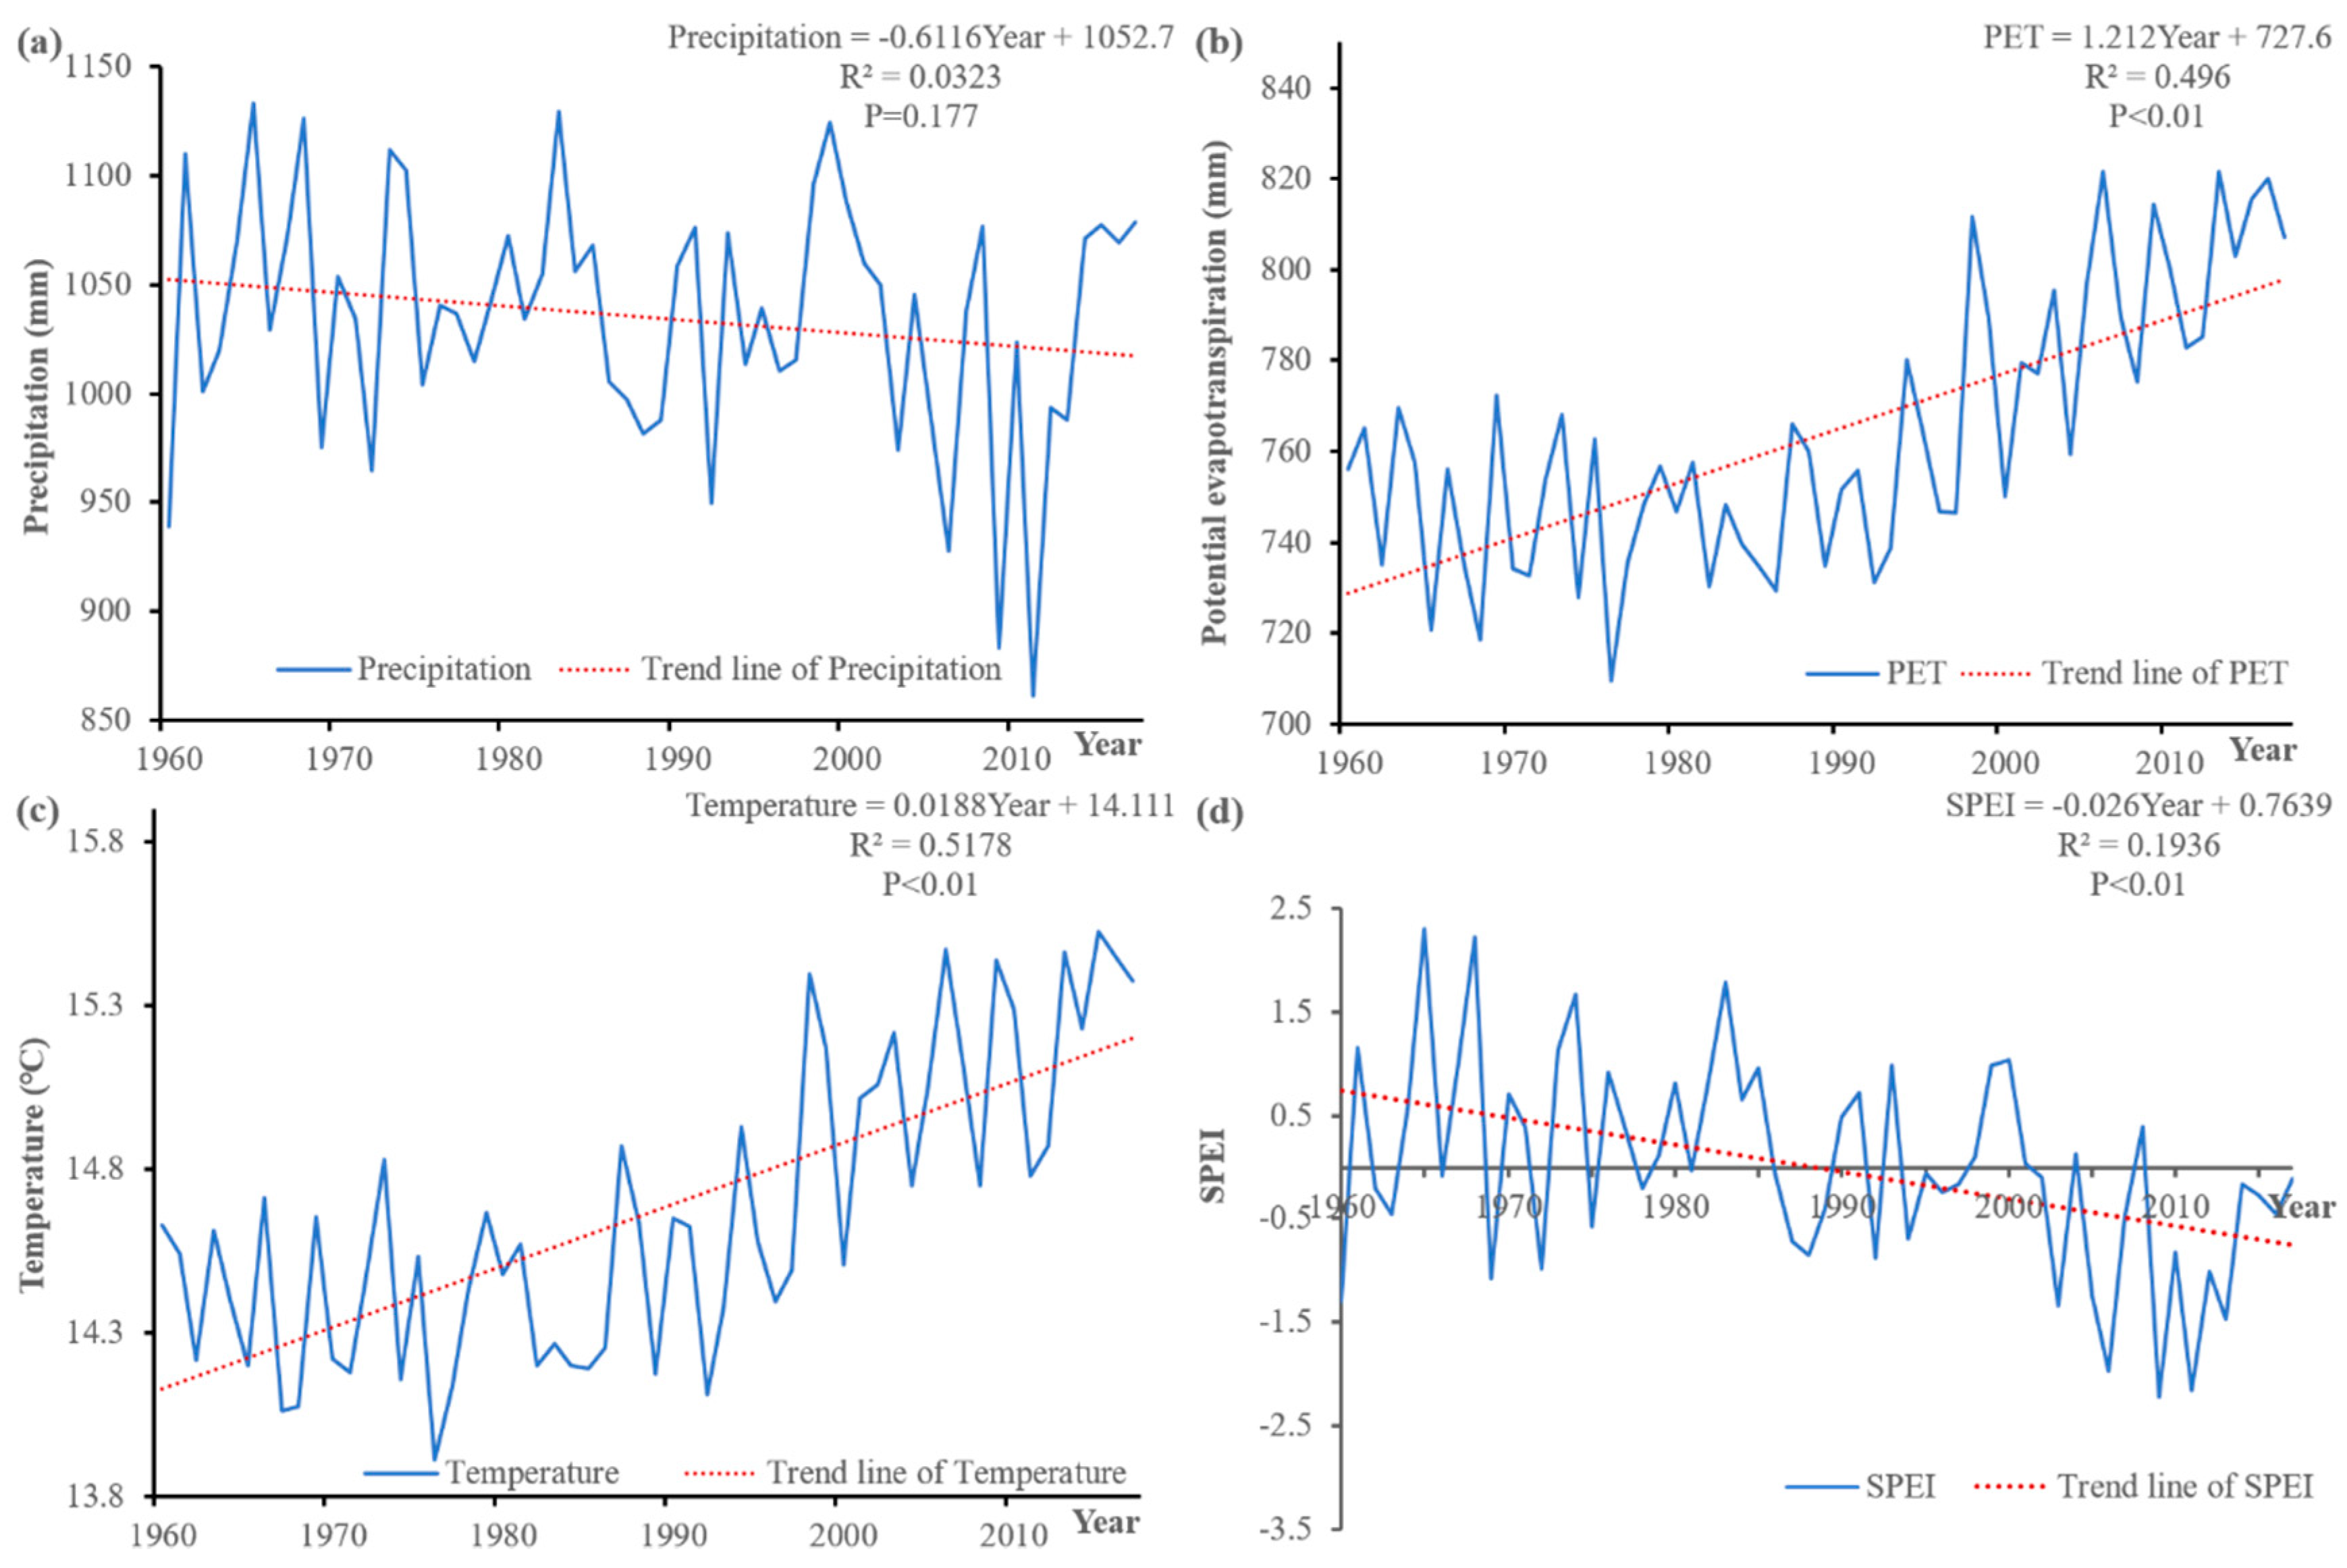
According to the definition of the SPEI index, an SPEI below 0 indicates a dry climate process and an SPEI above 0 indicates a wet climate process. In order to characterize the variation in drought evolution quantitatively when accompanied by the variation in precipitation and temperature, the annual precipitation, temperature, PET, and the SPEI data (an average value of all stations) were used, as shown in Figure 2. No significant increase in PET was observed before 1990, and before 1980, a decreasing trend was even apparent. However, the PET increased significantly after 1990, mainly because of the increase in temperature (Figure 2b,c). With respect to precipitation, a decreasing trend was observed from 1983 to 2014, especially an obviously decreasing trend after 2000 (Figure 2a). In addition, the low values of SPEI were highly consistent with the extremely high temperatures and extremely low rainfall. These results led us to consider that the main meteorological reason for the frequent occurrence of extreme drought in Southwest China after 2000 was the combination of the abnormal decrease in rainfall and the continued increase in temperature.
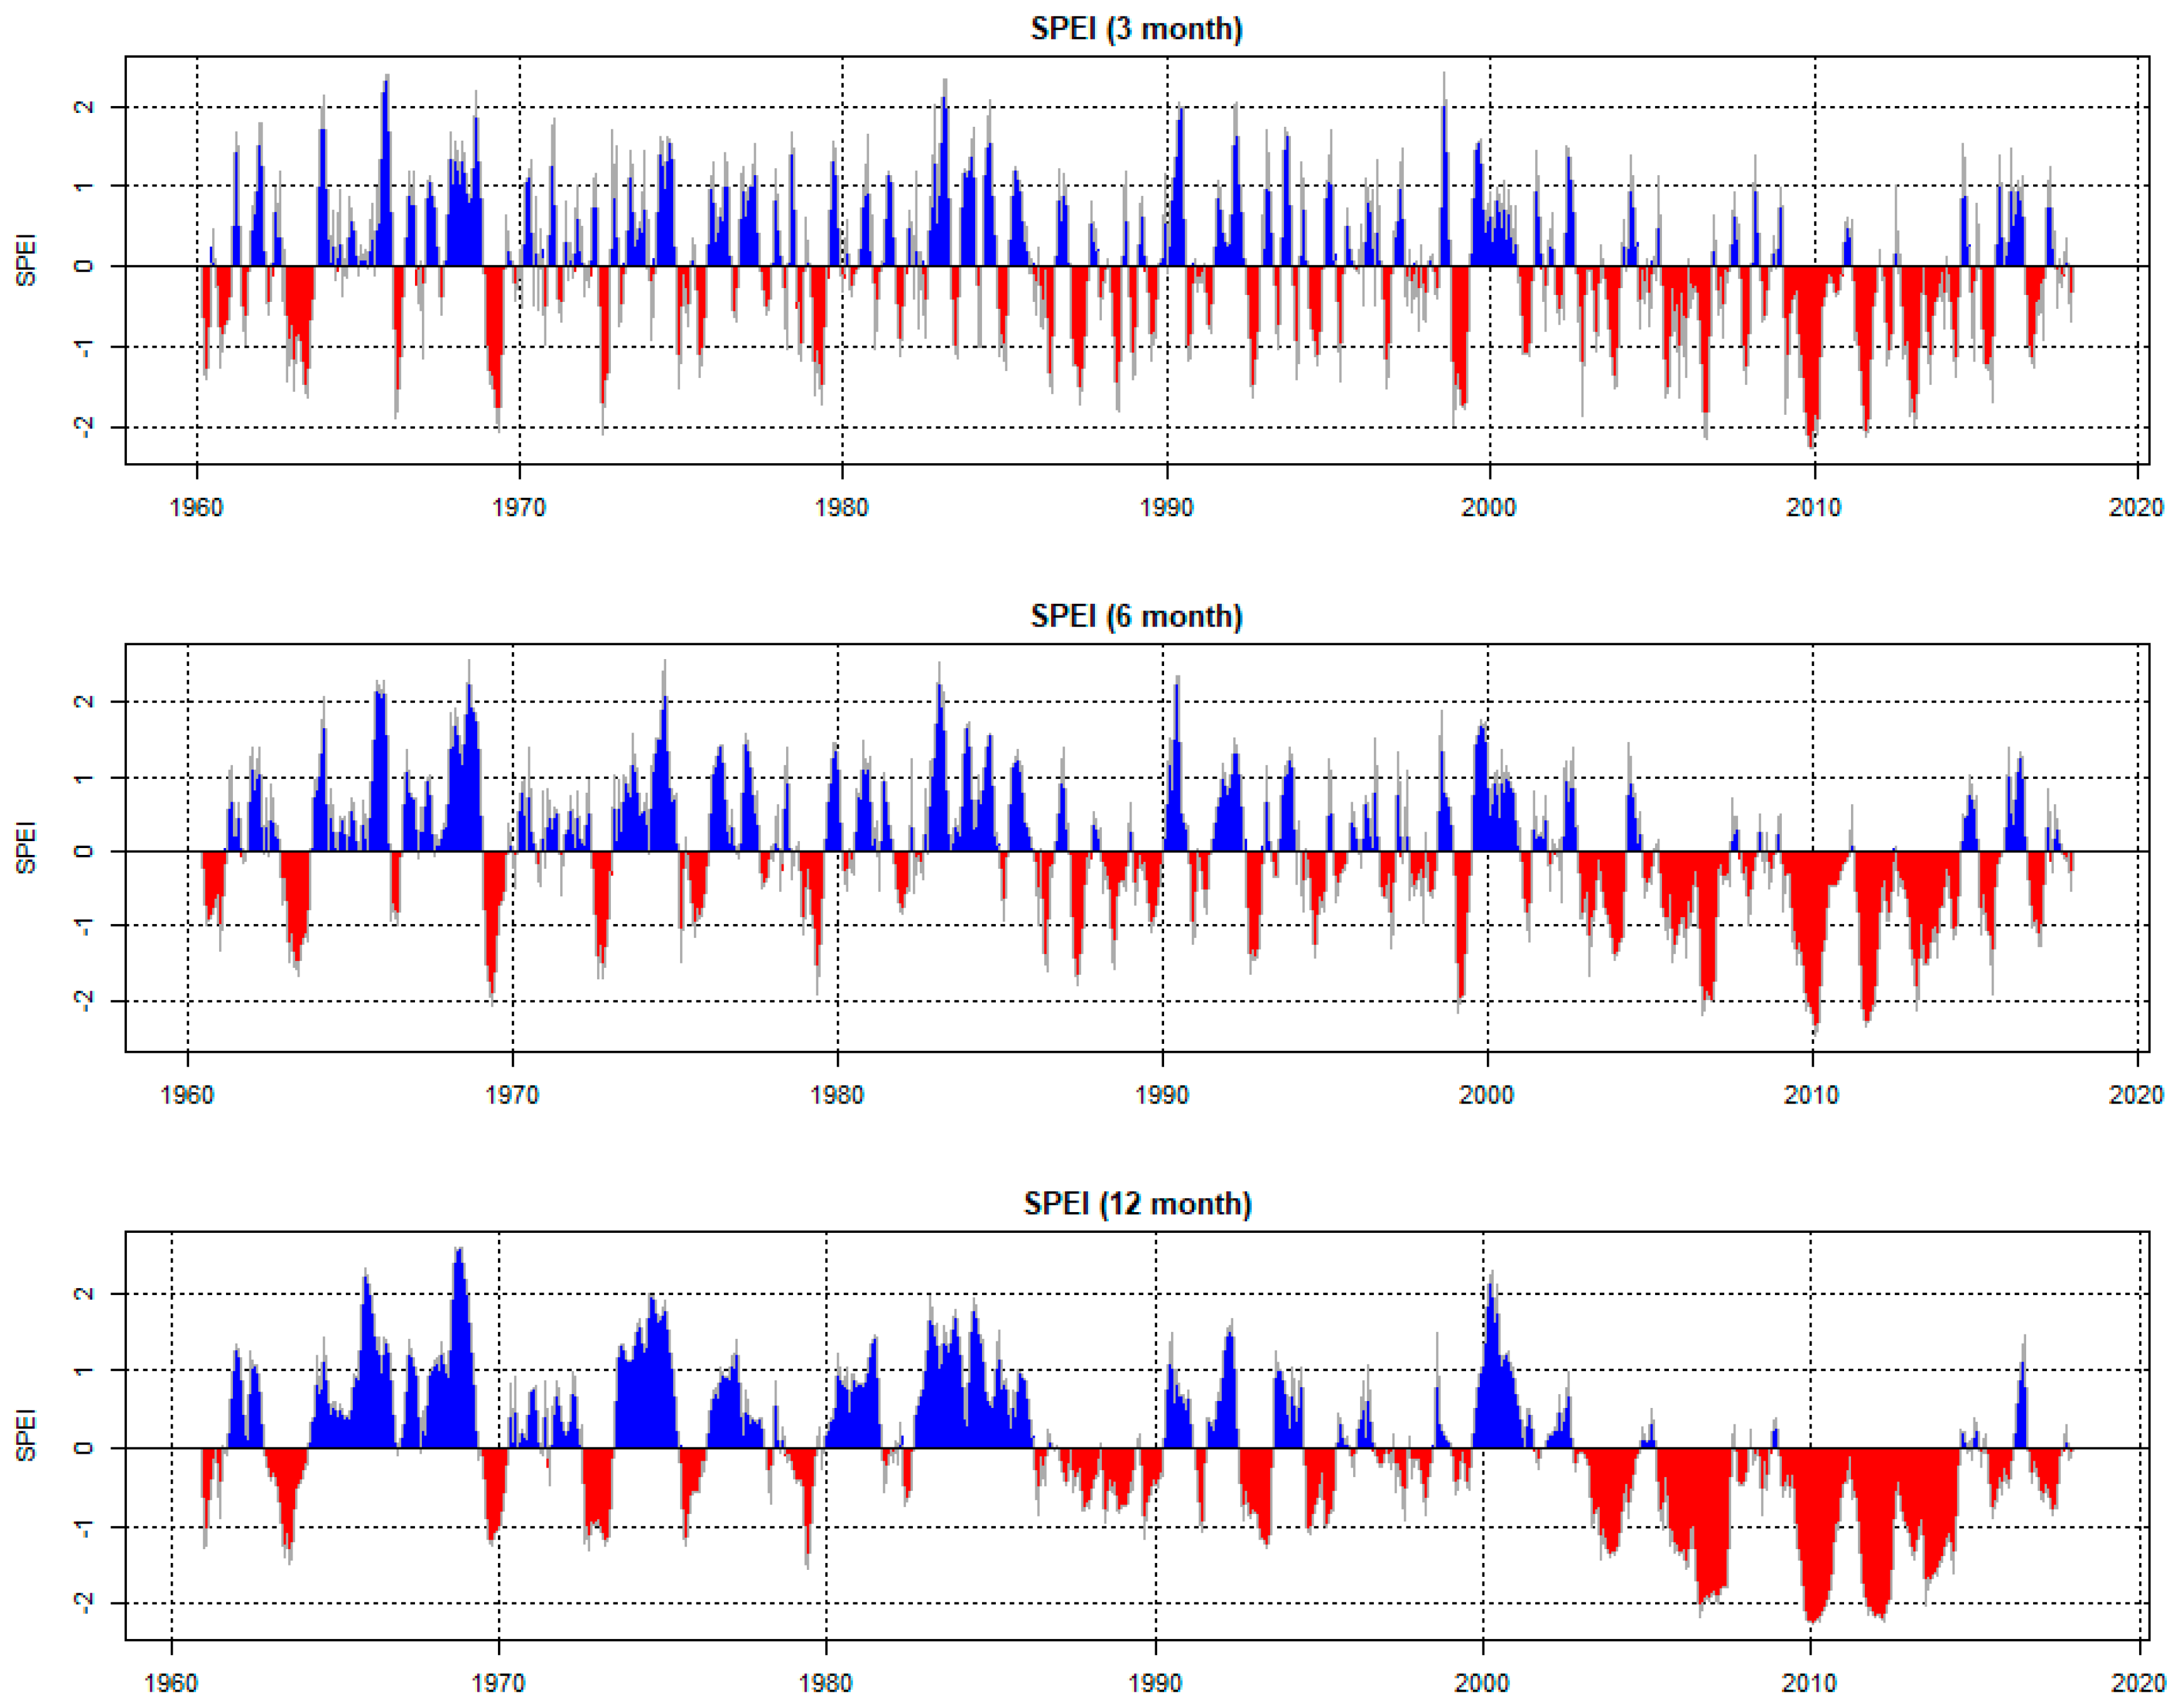
Figure 3 illustrates the changing trend of SPEI at different timescales (3, 6, and 12 months) during the study period of 1960–2017 for Southwest China. The SPEI values at 3- (SPEI3), 6- (SPEI6), and 12-month (SPEI12) timescales all showed an obviously decreasing trend. Notably, the values have decreased sharply since the start of the 21st century, with the lowest values occurring in 2010, consistent with the occurrence of extreme drought in Southwest China. In addition, Figure 3 shows that the dry climate processes and the wet climate processes alternated more frequently at the short timescales than at the long timescales, with more than 90 events occurring for the 3-month scales and only 30 events occurring for the 12-month scales during the period of 1960–2017. In other words, the SPEI3 was more sensitive to short-term drought or wet climate processes than longer ones, and this was closely related to agricultural production. The SPEI12 has been adopted in many previous studies to characterize the evolution of drought across different years. The changing process of SPEI12 indicates that six major wet events (with SPEI > 1.5) occurred between 1960 and 2002, whereas almost no severe or extremely severe drought events occurred. However, from 2003 to 2005, the number of drought events increased significantly, with four severe or extremely severe drought events (with SPEI < 1.5) occurring but almost no wet conditions (with SPEI > 0). Both the frequency and the magnitude of drought events have likely increased in Southwest China, especially since the start of the 21st century.
4.1.2. Drought Frequency and Duration Maps for Different Time Periods and Different Timescales
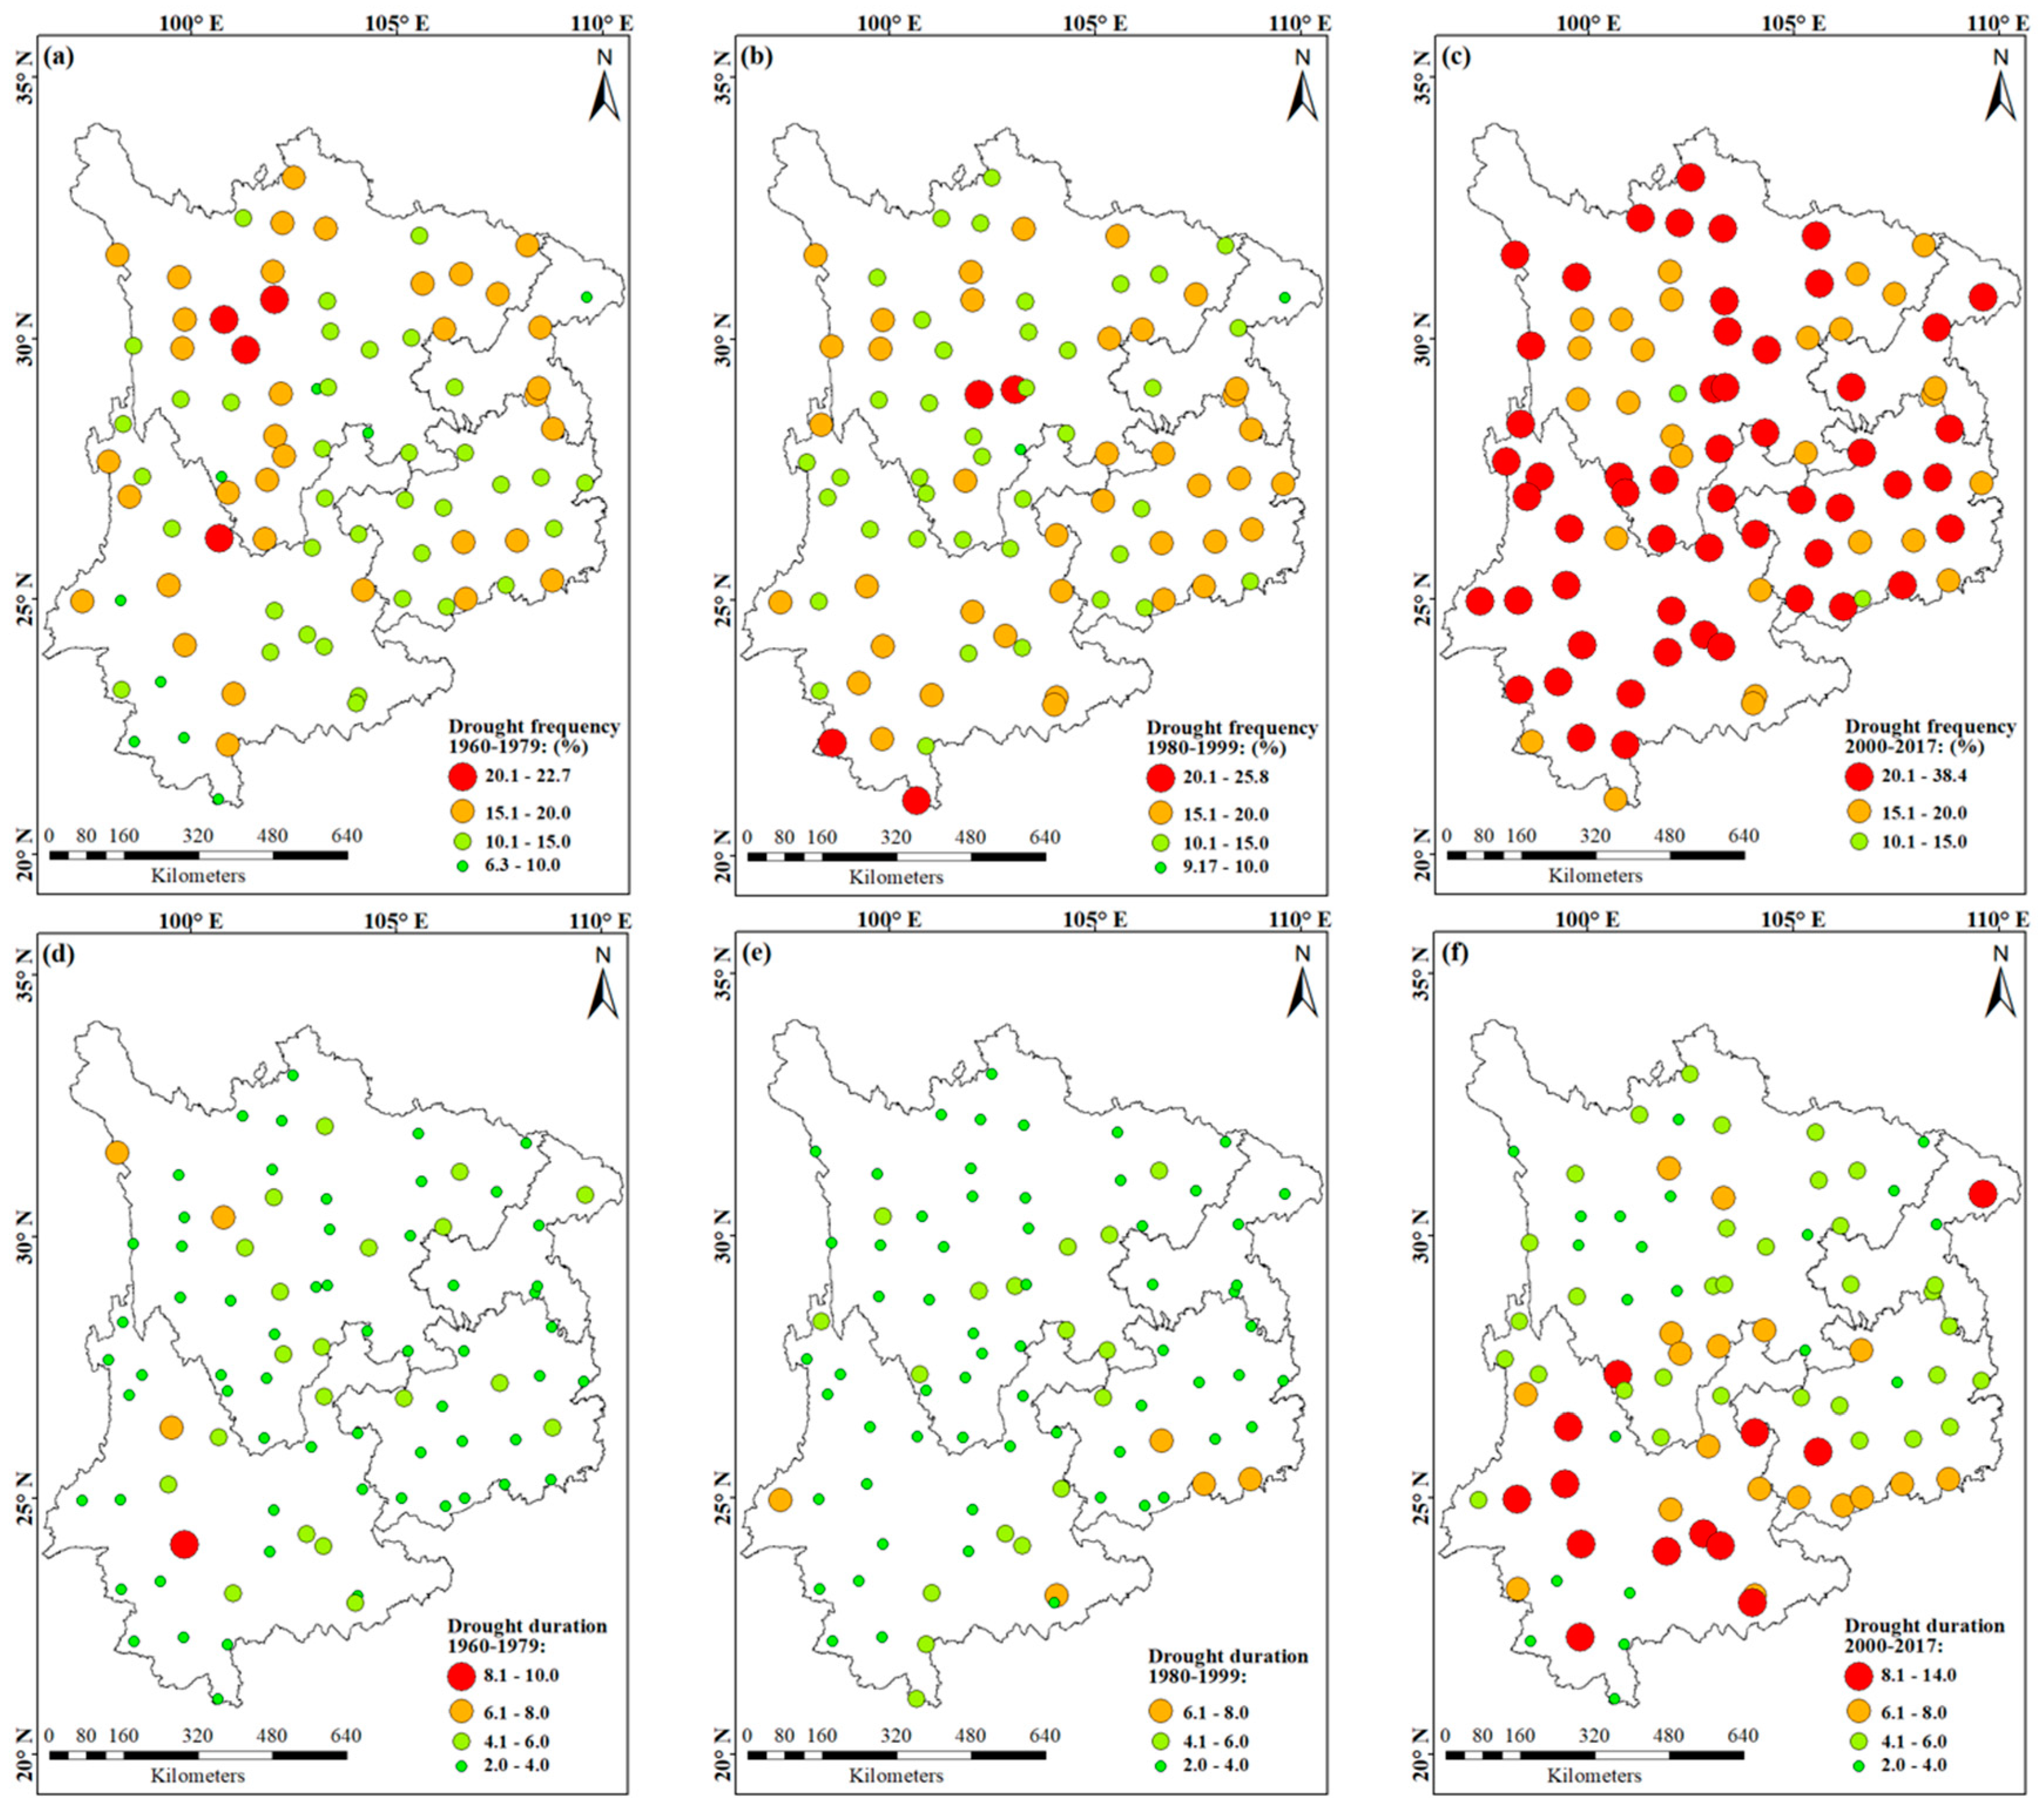
Drought duration in this study was defined as the longest consecutive months with SPEI less than −1. To provide a complete picture of how the drought frequency and duration had changed over the last 58 years, we split the time into three intervals: 1960–1979 (Figure 4a,d), 1980–1999 (Figure 4b,e), and 2000–2017 (Figure 4c,f). These results indicated that the drought frequency and duration showed similar trends. No obvious changes were observed in the periods 1960–1979 and 1980–1999, but a sharp increase occurred in 2000–2017.
The mean values of the drought frequency were 14.3%, 15.4%, and 22.6% in 1960–1979, 1980–1999, and 2000–2017, respectively. In addition, the highest values for drought frequency increased significantly from 22.7% (1960–1979) to 38.4% (2000–2017), with the lowest value increased from 6.3% to 12.5%. During the period of 1980–1999, the drought frequency also increased, from a low value of 9.17% to a high value of 25.8%. It should be noted that only four high drought frequency (>20%) stations were located in the middle of the Sichuan province and the southwestern Yunnan province in the periods 1960–1979 and 1980–1999 (Figure 4a,b). However, since the start of the 21st century, the number of high drought frequency stations has increased to 56 and they now cover almost all areas in Southwest China (Figure 4c). This allowed us to demonstrate that the climate became drier in the period 2000–2017; thus, more farmland was affected by drought. With respect to changes in the drought duration, the mean values were 3.80, 4.06, and 6.17 in the periods 1960–1979, 1980–1999, and 2000–2017, respectively. The drought duration increased to 14 months in 2000–2017 compared with 10 months in 1960–1979 (Figure 4d,f). Furthermore, the number of high drought duration (>6 months) stations increased significantly to 31, compared with 5 in 1980–1999 and 4 in 1960–1979. These were mainly located in the Yunnan province and the southwestern region of the Guizhou province (Figure 4f).
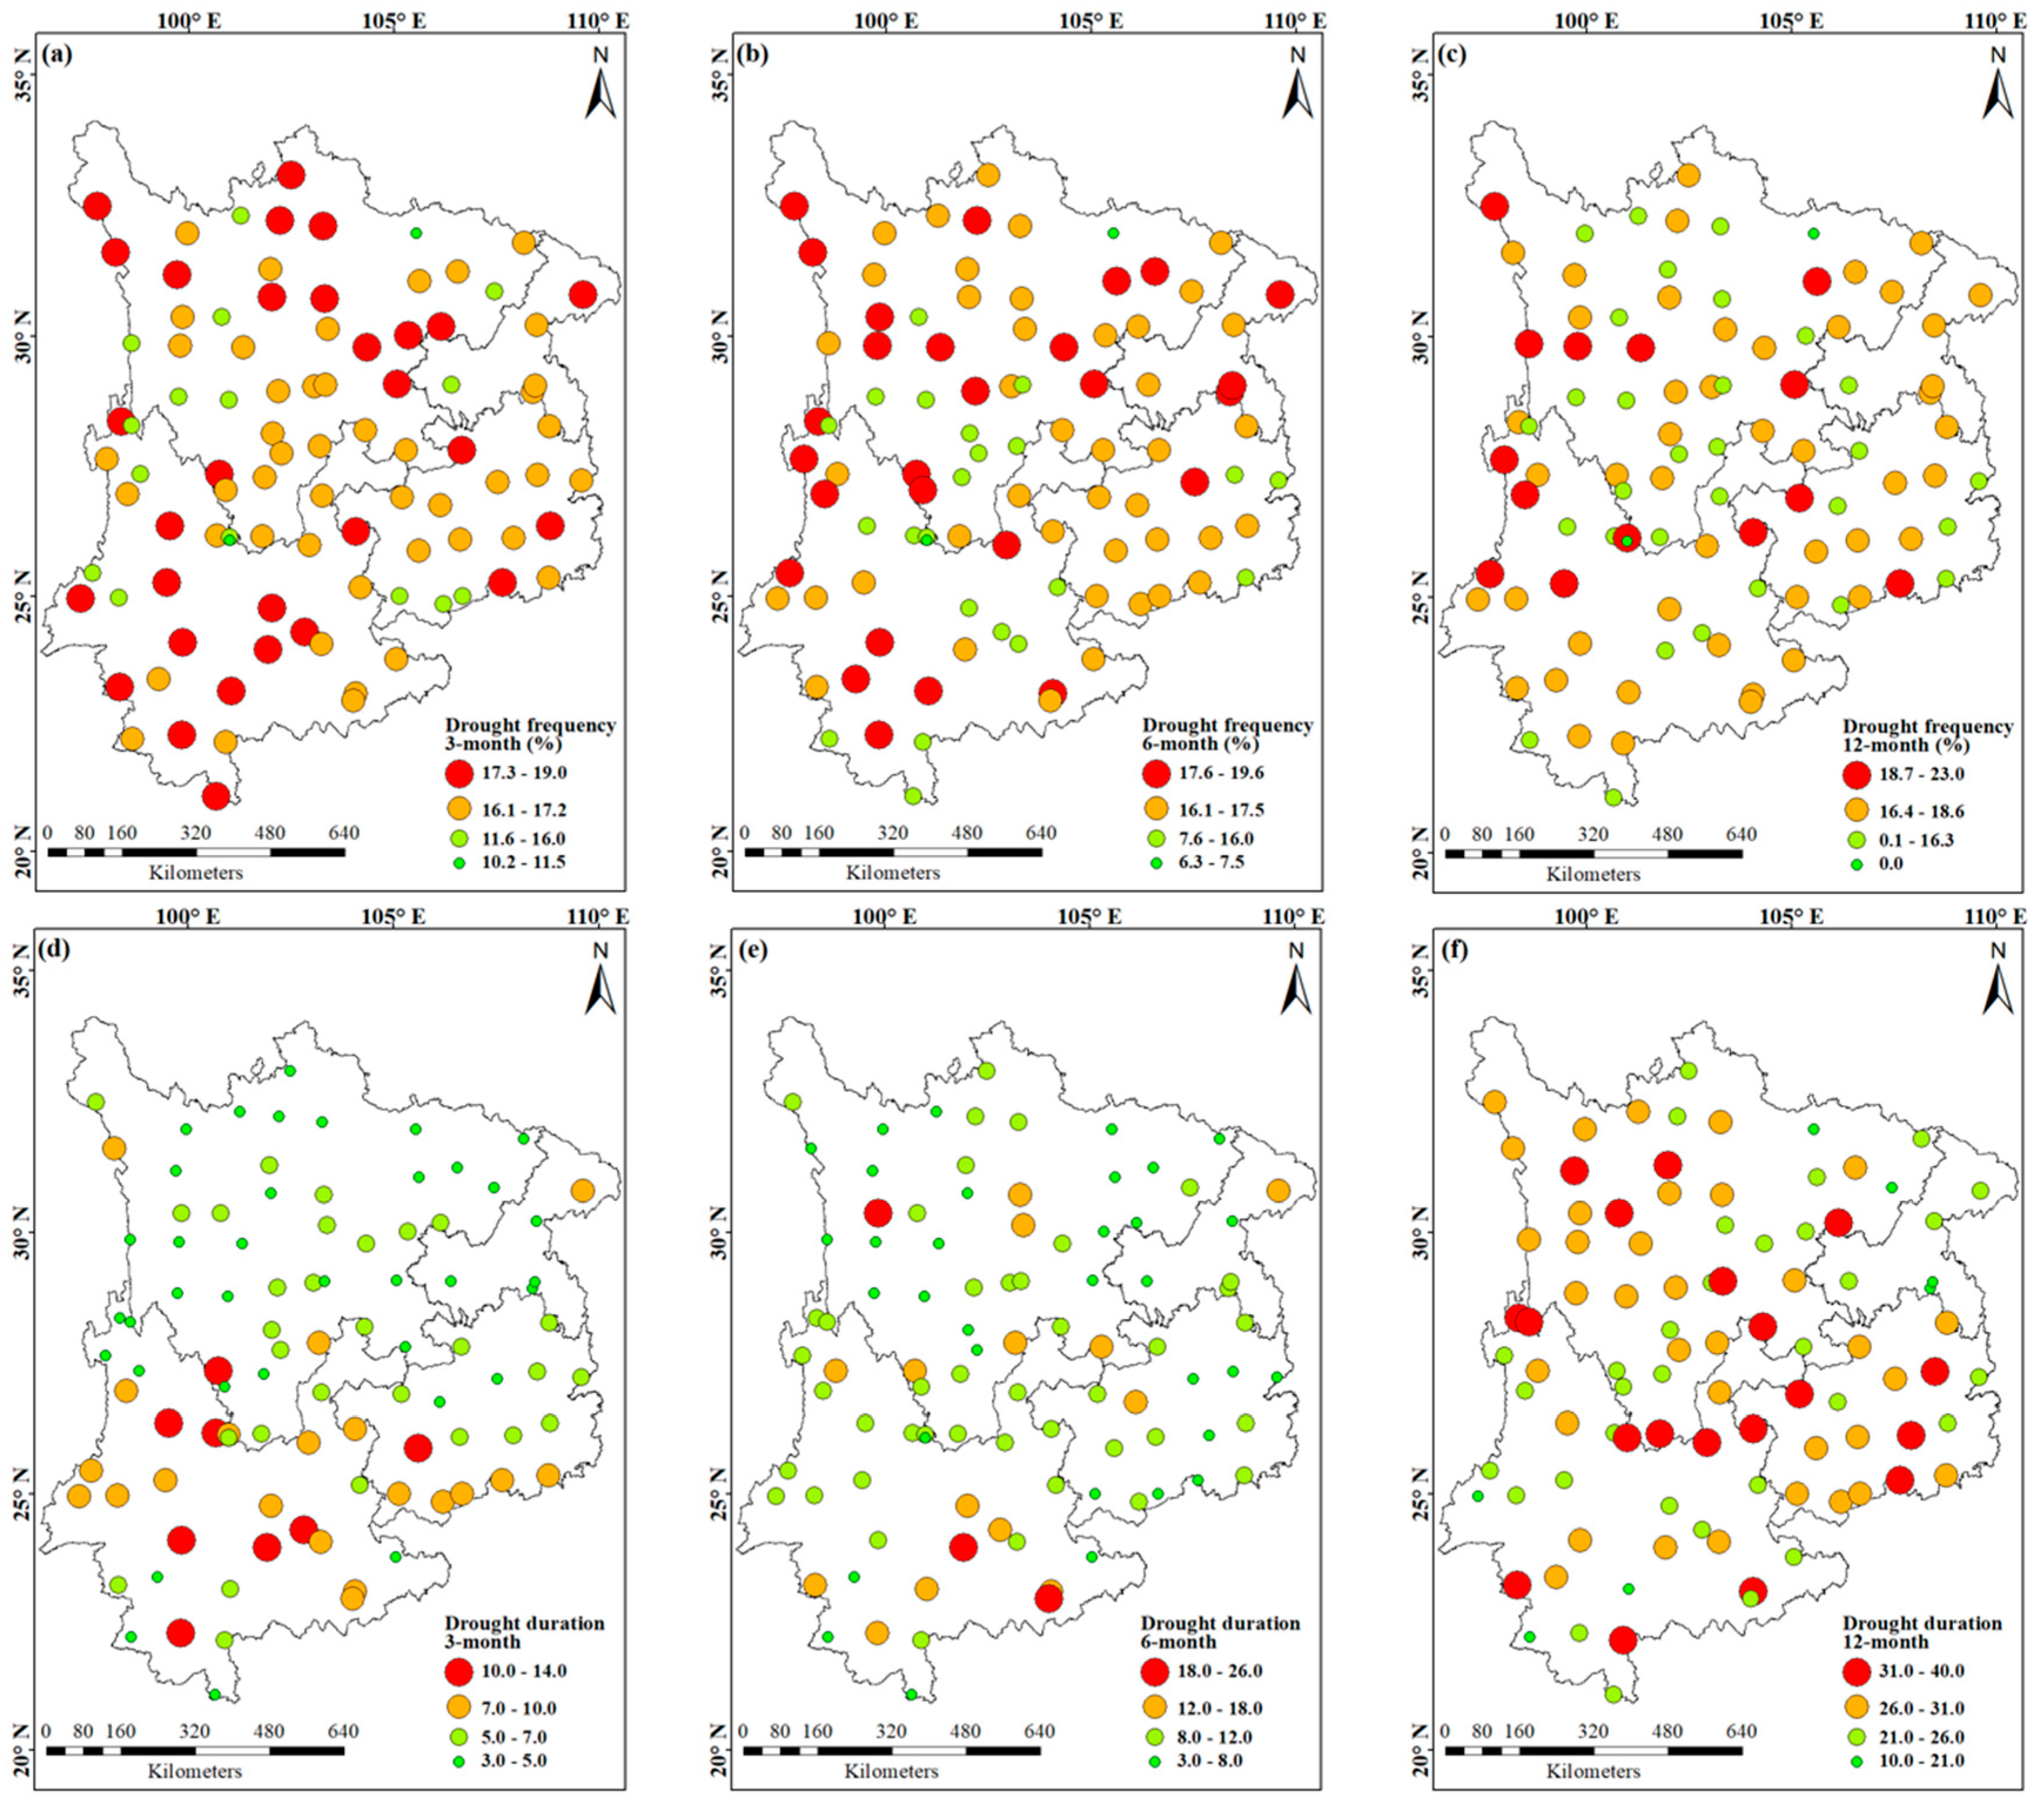
Because the different timescales of the SPEI have different implications, in this study we aimed to address the multifaceted nature of drought, with its frequency, duration, and spatial distribution occurring at multiple time steps (3, 6, and 12 months). The drought frequency and duration values were classified into four levels by using the natural breaks method, as shown in Figure 5. The results showed that the areas of high drought frequency based on SPEI3 and SPEI6 were relatively larger than those based on SPEI12 (Figure 5a–c). Thus, we concluded that the drought in Southwest China had a more seasonal behavior than a long-lasting character. Consequently, agriculture was the most widely drought-affected sector in Southwest China because the seasonal-term drought mainly affected the soil moisture, which is particularly important for agricultural production. In addition, the highest drought frequency value was based on SPEI12 and even reached 23% in northwestern Yunnan, southwestern Guizhou, and eastern Sichuan, whereas it was only 19.6% when based on SPEI6 and 19.0% when based on SPEI3. This result indicated that hydrological droughts occurred more frequently and often caused very difficult water management in these areas; the SPEI12 usually indicates streamflow changes, which are important for reservoir storage.
Figure 5d–f shows the distribution of drought duration at 3-, 6-, and 12-month timescales. According to the SPEI3, the drought duration was 7–14 months at more than one quarter of the stations, which were mainly located in Sichuan province (Figure 5d). As the timescale increased, the distribution of stations with the longest drought duration increased from the southwest to the northeast of the study areas. The stations with the longest drought duration based on SPEI6 were located mainly in the southwest and middle of the study areas (Figure 5e), whereas those based on SPEI12 were located mainly in the middle and northeast of the study areas (Figure 5f). Furthermore, the total number of stations with a long drought duration was greater when based on SPEI12 than when based on SPEI6 or SPEI3, which also indicated that recovery from drought conditions at longer timescales was slower than the recovery at short timescales.
4.2. Agricultural Drought Risk Assessment
4.2.1. Agricultural Drought Hazard in Southwest China
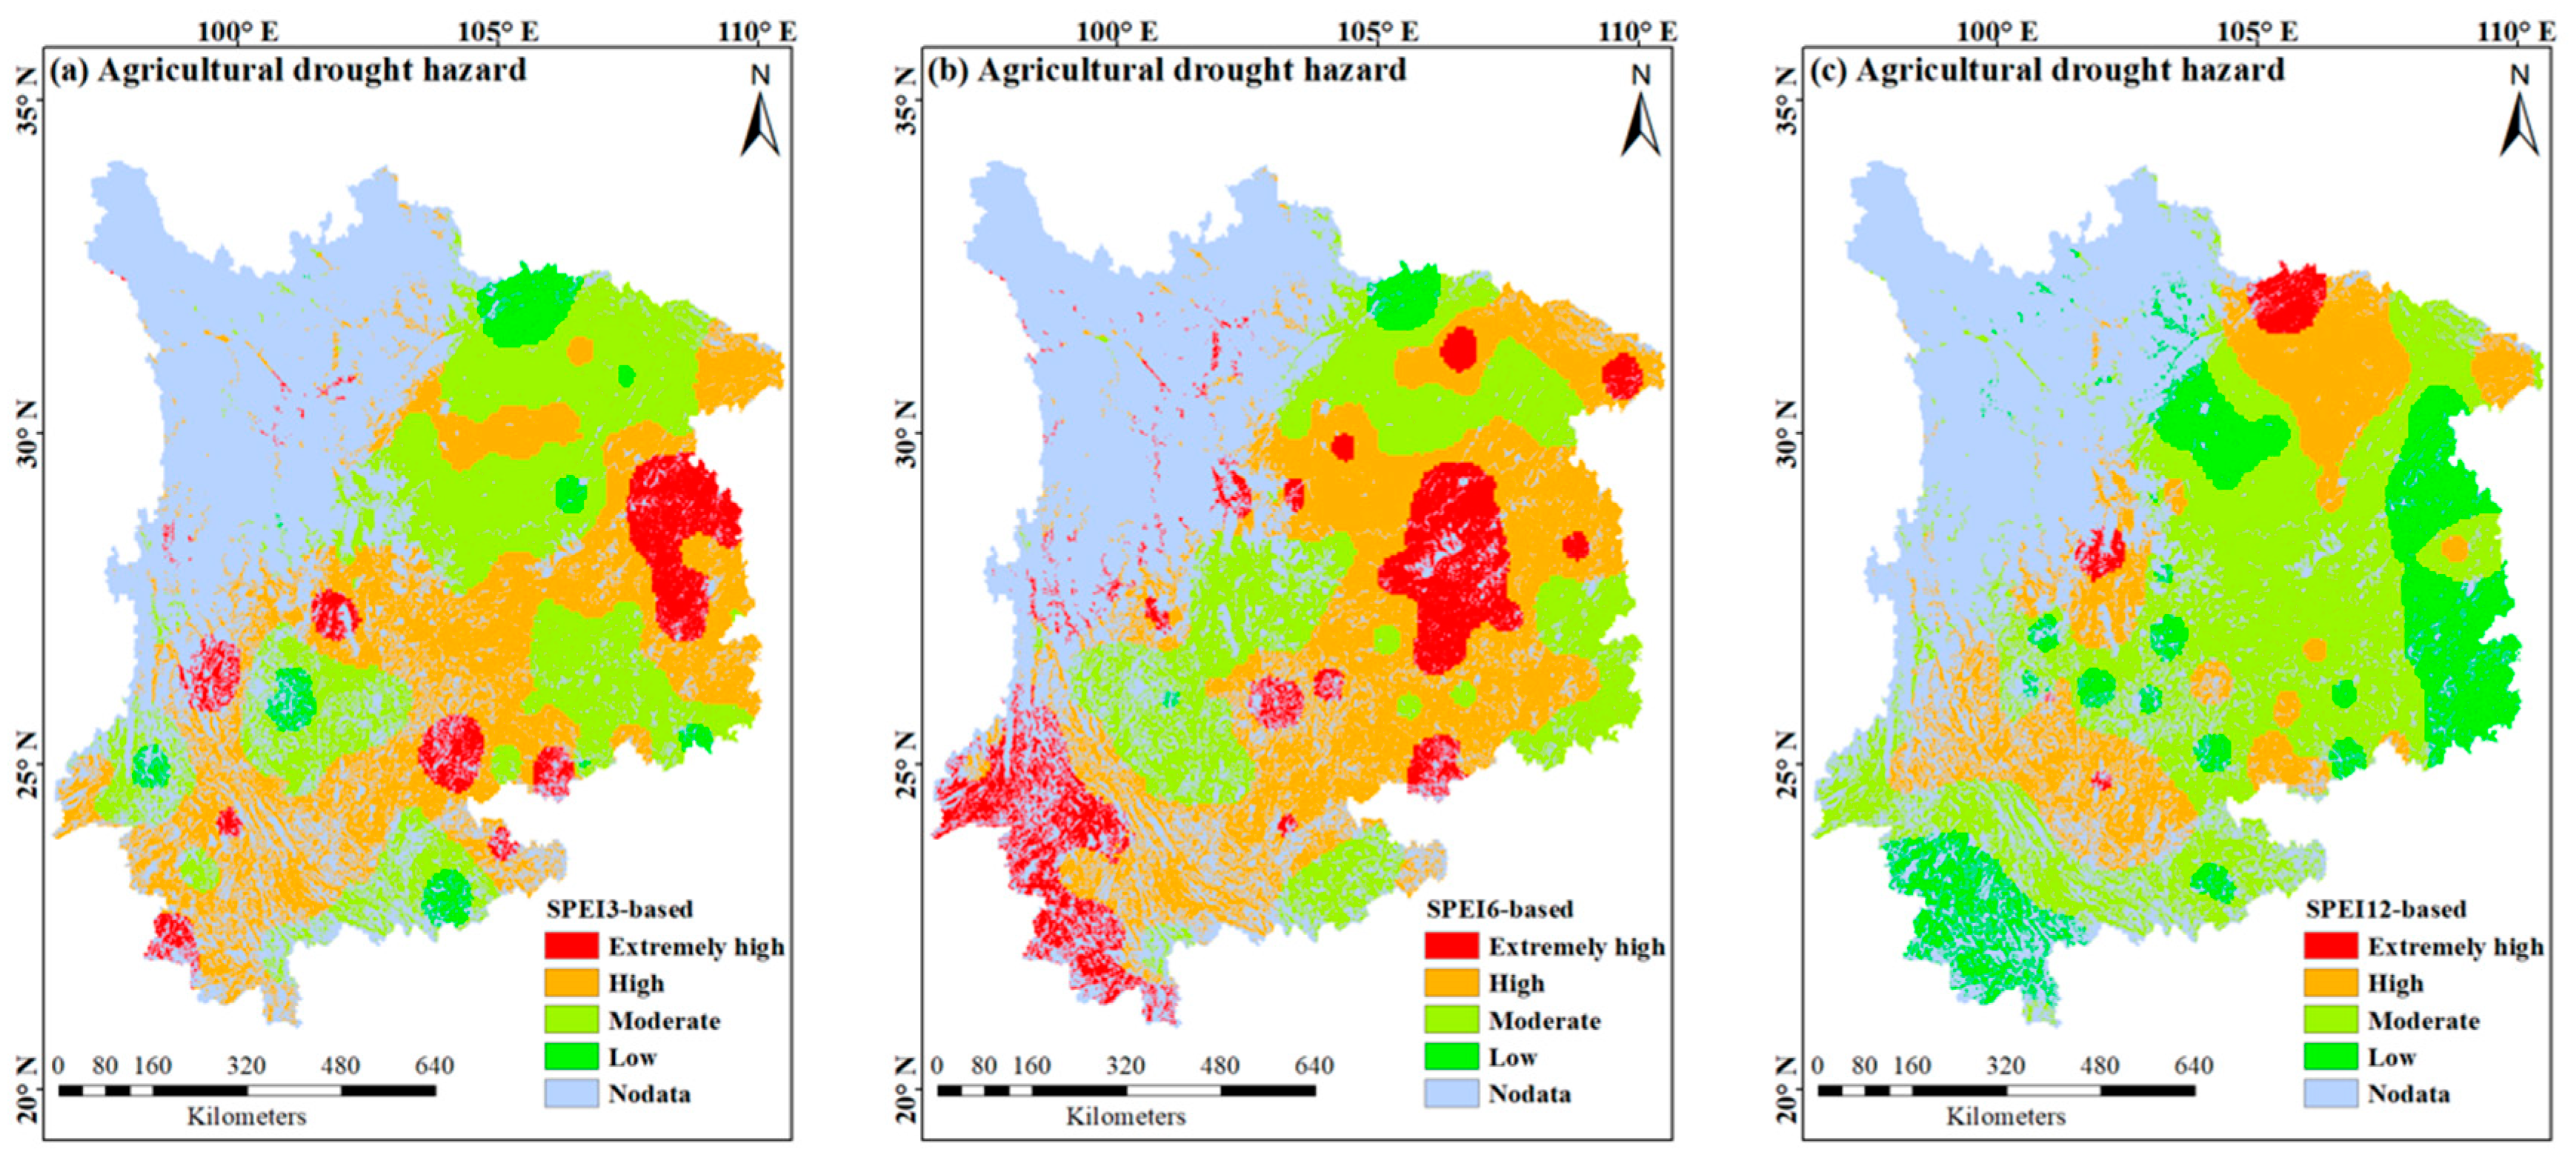
The Agricultural Drought Hazard Index (ADHI) has been investigated based on the frequency of drought and the severity class to which each drought is assigned. The spatial distribution of agricultural drought hazard maps at different timescales is illustrated in Figure 6. The results showed that the area with severe and extremely severe drought hazards was the largest when based on SPEI6 (Figure 6b), followed by SPEI3 (Figure 6a) and then SPEI12 (Figure 6c).
The agricultural areas with an extremely high ADHI based on SPEI3 were located mainly in southeastern Chongqing, northeastern and southwestern Guizhou, and northern and southwestern Yunnan (Figure 6a); these accounted for 9.7% of the total crop planting areas. As the time step increased to 6 months, a significant increase occurred in agricultural areas with an extremely high ADHI; these accounted for 19.5% of the crop planting areas and were located mainly in central Sichuan, southwestern Yunnan, north-central Guizhou, and southeastern Chongqing (Figure 6b). In addition, the agricultural areas with an extremely high ADHI based on SPEI12 showed an obvious decrease; these accounted for only 2.4% of the crop planting areas and were centered mainly in southwestern and north-central Sichuan (Figure 6c). Generally, the agricultural areas with an extremely high ADHI based on SPEI3 and SPEI6 were considerably wider than those based on SPEI12. These results may further indicate that Southwest China is more likely to be affected by agricultural drought events with a faster depletion of soil moisture, considering that the short-term droughts were more frequent and severe.
4.2.2. Agricultural Drought Vulnerability in Southwest China
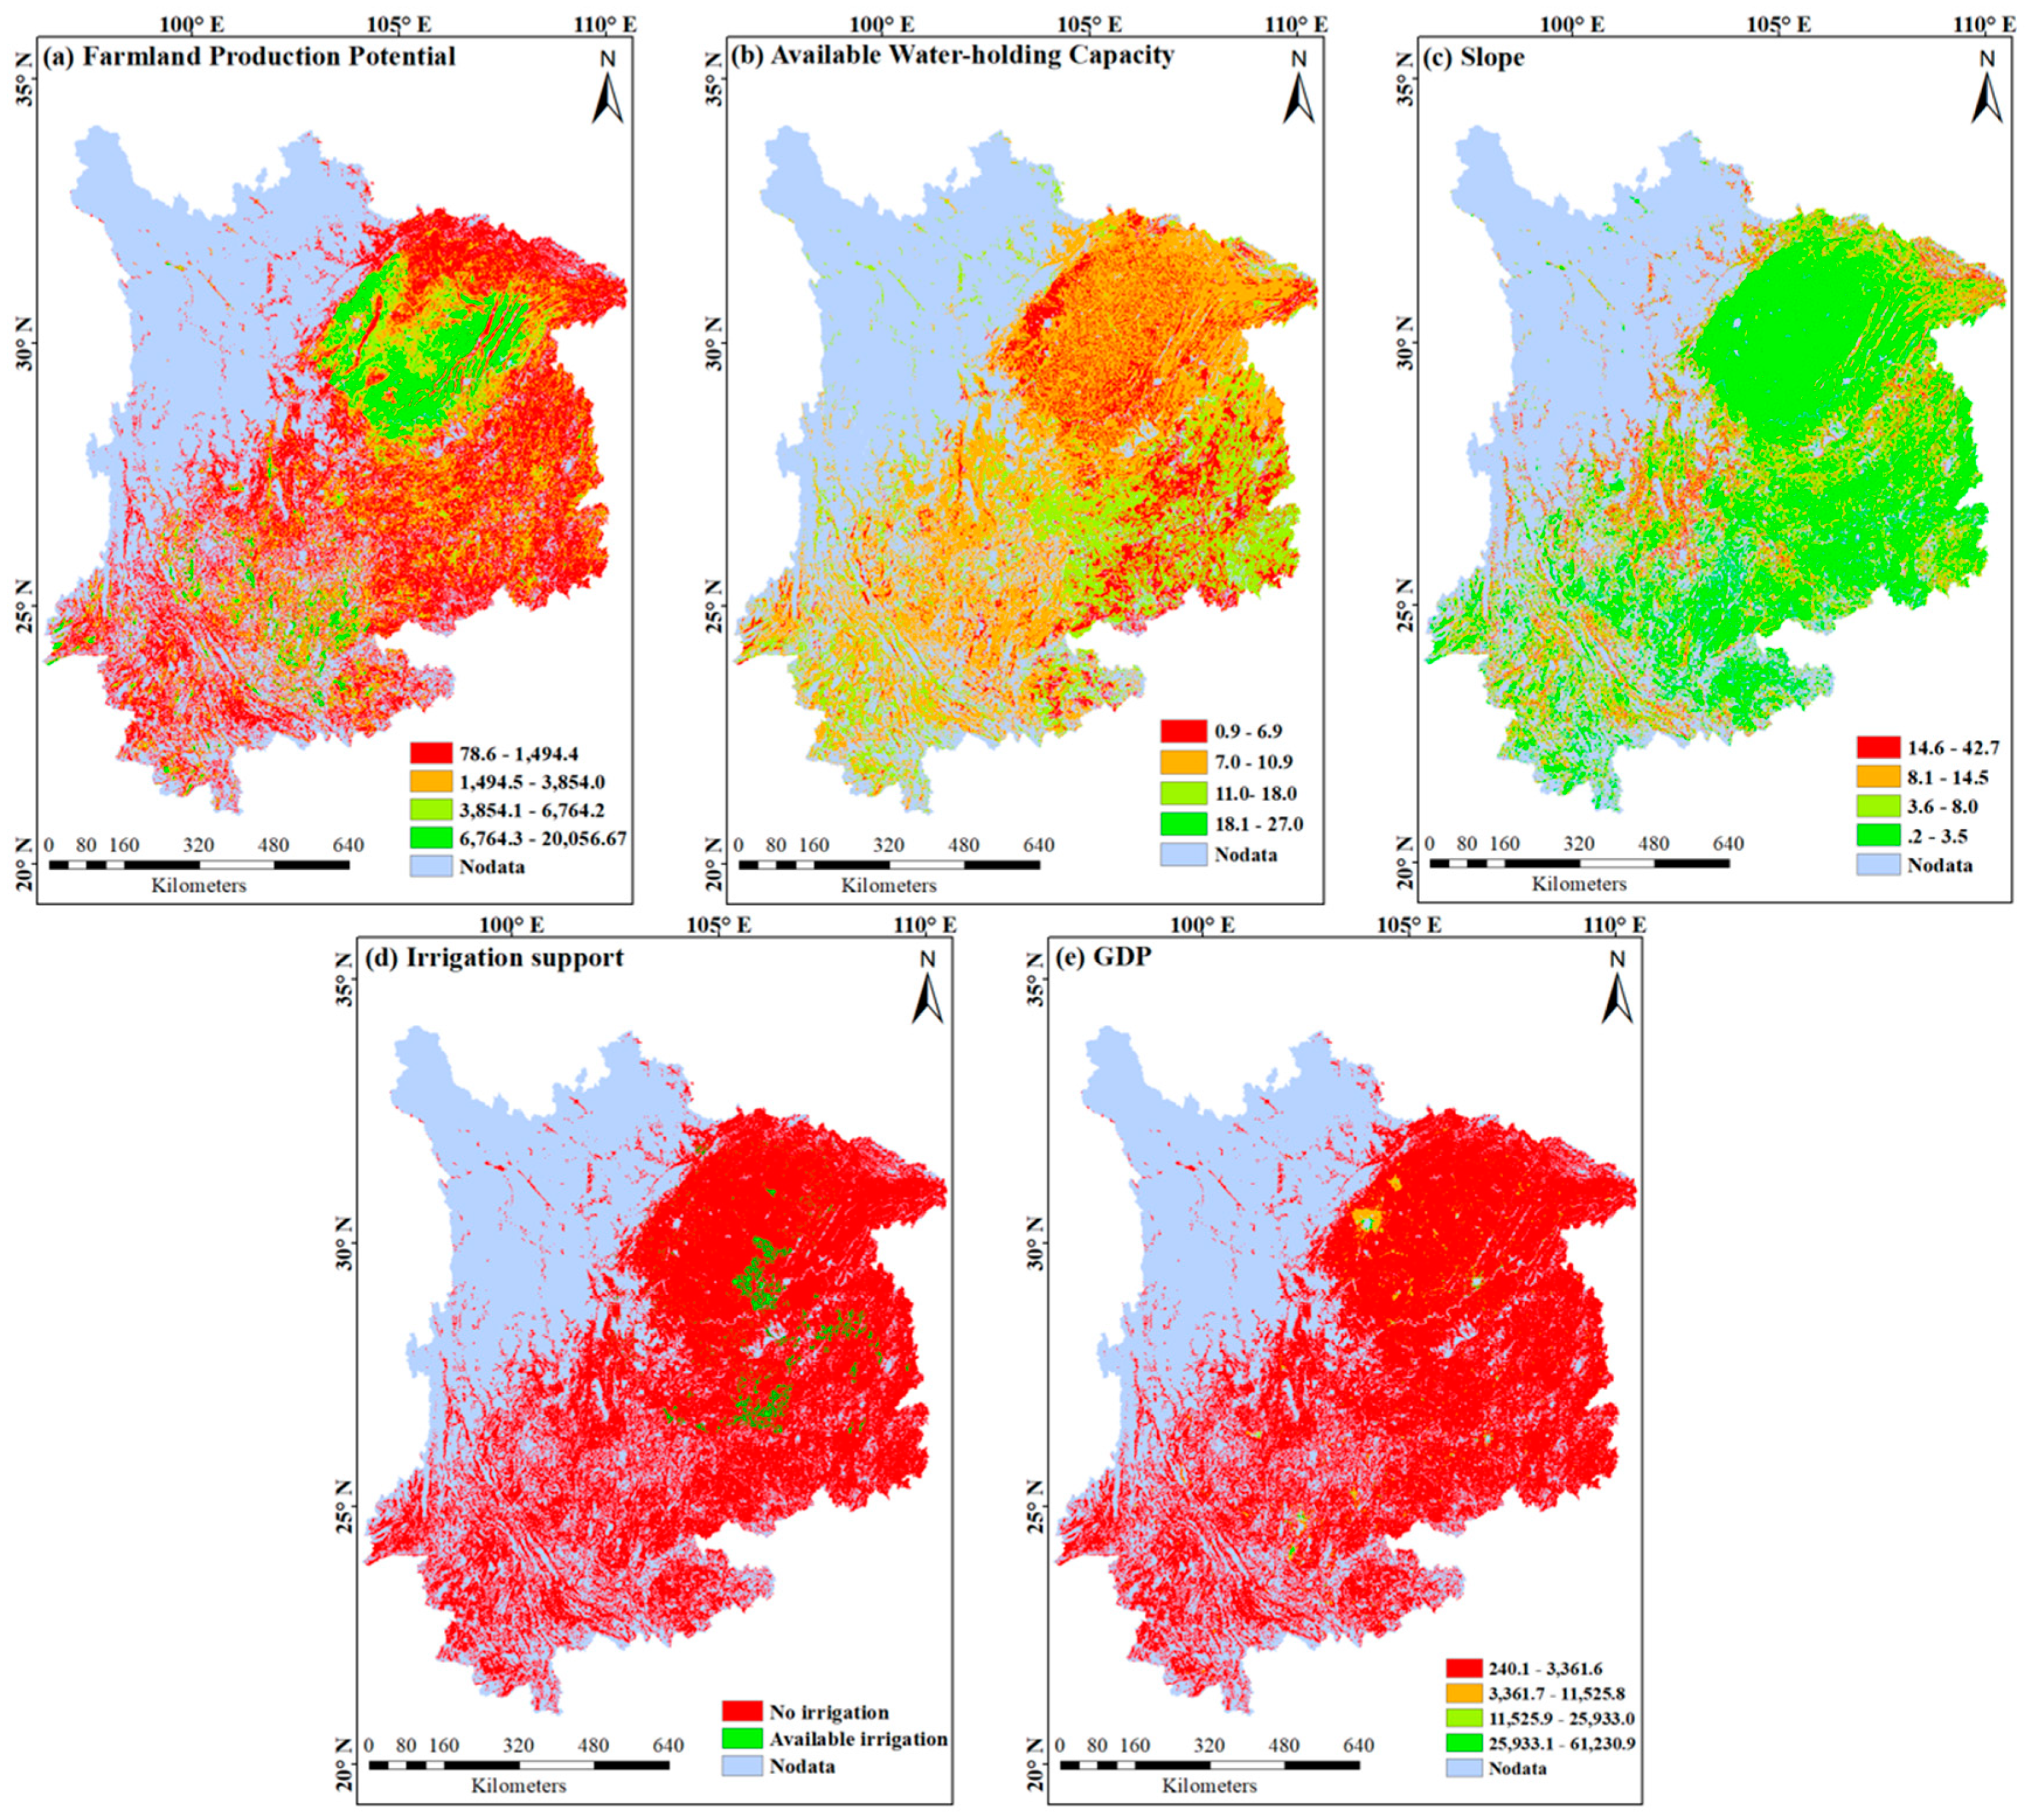
The distribution of each vulnerability indicator is shown in Figure 7. The results showed that high levels of FPP were located mainly in southeastern Sichuan and northwestern Chongqing; these accounted for 7.8% of the total agricultural areas (Figure 7a). Additionally, the relatively high level of soil AWC was located mainly in Guizhou and southwestern Yunnan, which accounted for 25.7% of the total agricultural areas; the low level of soil AWC areas accounted for 21.5% of the total agricultural areas and located mainly in Chongqing and southeastern Sichuan (Figure 7b). With respect to the terrain of Southwest China, most of the agricultural areas were relatively flat, and only 4.6% of the agricultural areas had extremely high slopes. These were located in southwestern Sichuan and northeastern and southwestern Chongqing (Figure 7c). In addition, the proportion of irrigable agricultural areas was very small (2.3%); these were located mainly in southwestern Chongqing and northern Guizhou (Figure 7d). As for the level of economic development, almost all agricultural areas in Southwest China had a low GDP (Figure 7e), which indicates a low-level coping capacity when drought occurs.
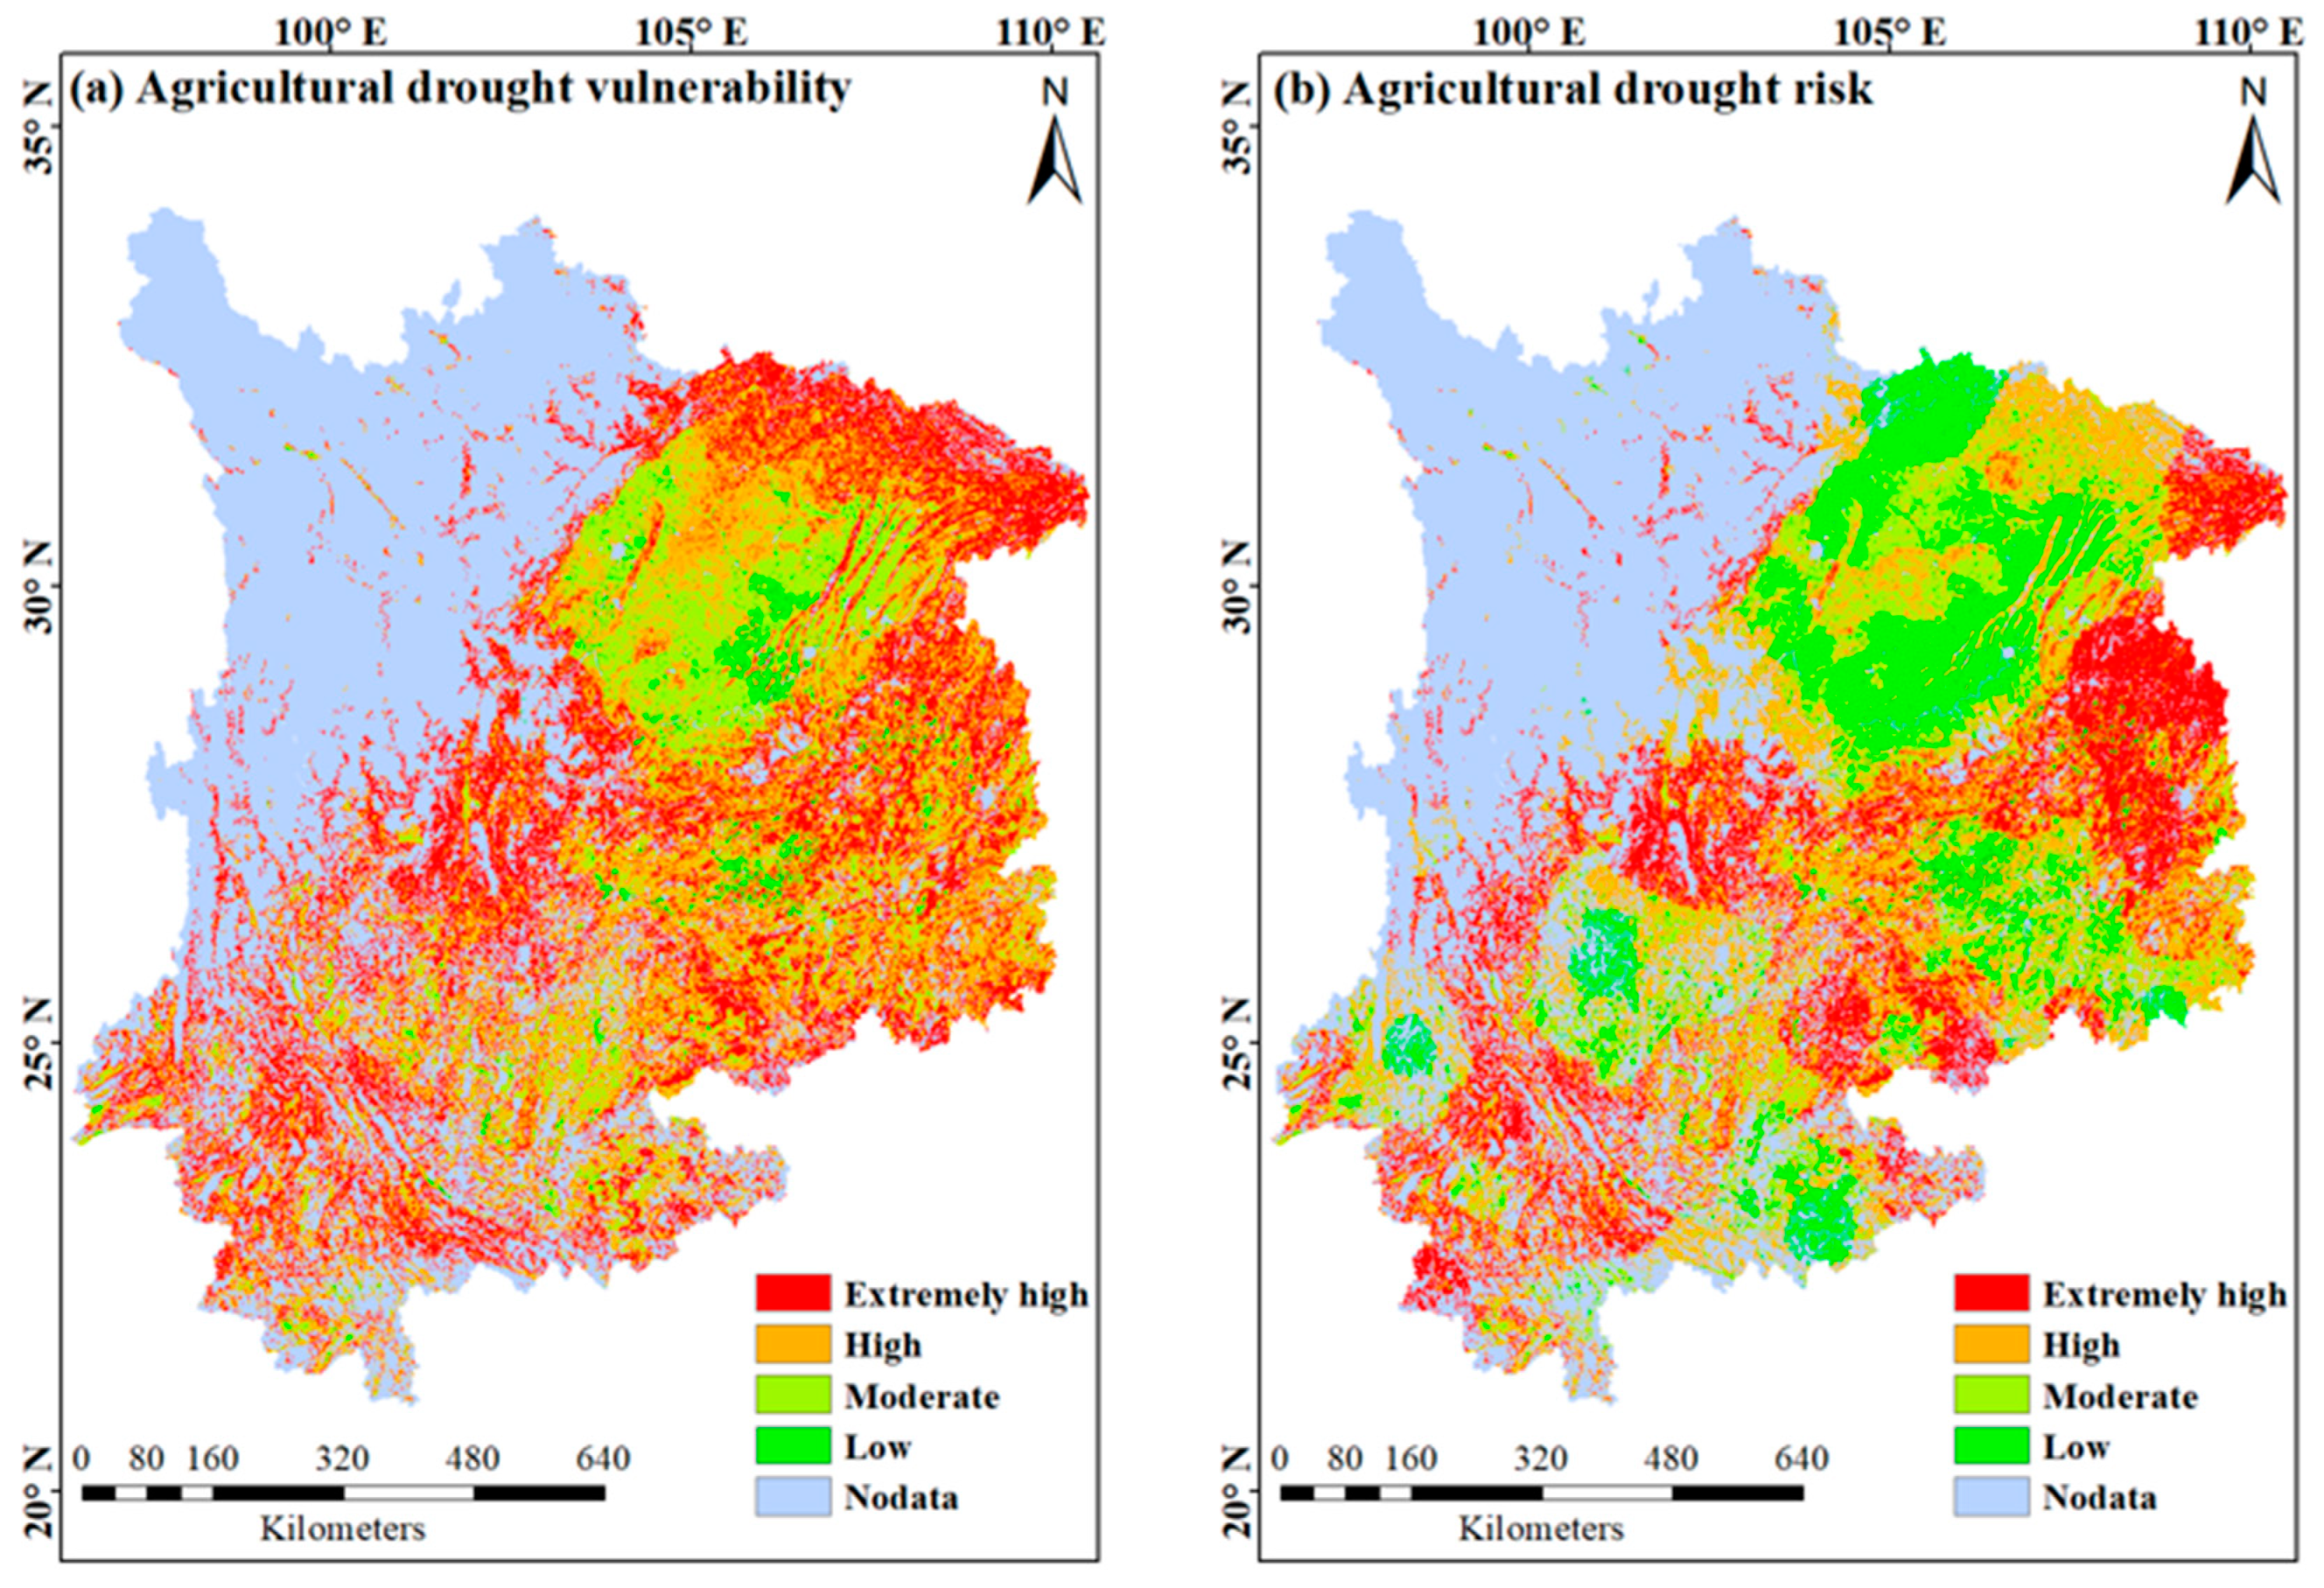
When all the vulnerability indicators were combined to produce a composite agricultural drought vulnerability index map, as shown in Figure 8a, the results revealed that the areas with an extremely severe vulnerability covered 39.8% of the agricultural areas. Indeed, 65.6% of these areas were distributed in Sichuan and Yunnan. These areas were usually characterized by a low FPP, low soil AWC, high slopes, a low GDP, and a low proportion of irrigable agricultural areas. The crops in these areas could be significantly damaged during drought events, mainly because of their low-level coping ability (identified by the low GDP) and the absence of mitigation measures (e.g., irrigation). Furthermore, the areas with severe and moderate vulnerability had a scattered distribution over the entire study area and covered 40.0% and 17.9% of the total crop planting areas, respectively. These areas were often typified by a relatively flat farmland terrain, but the absence of irrigation and the low GDP caused the agriculture in these areas to be affected frequently by drought. In contrast, the areas with a low vulnerability only accounted for 2.3% of the total crop planting areas and were located mainly in southwestern Chongqing and southeastern Sichuan. These areas were characterized by a high FPP and a high proportion of irrigable cropland. Although such areas might also be affected by the negative impacts of a long-term drought, the presence of irrigation provided a good buffer for the crops during periods of deficient moisture. For the most part, these farmers could better withstand a drought and recover faster from it compared with dryland farmers.
4.2.3. Agricultural Drought Risk in Southwest China
The drought hazard based on SPEI3 could reflect prompt changes in the soil moisture, which are important for agricultural production. Therefore, the agricultural drought risk map was produced from a composite of the drought hazard based on SPEI3 and the drought vulnerability maps. These results showed that 27.4% of the agricultural area was exposed to an extremely high risk of drought, 33.5% to a high risk, 22.5% to a moderate risk, and 16.6% to a low risk (Figure 8b).
The extremely high-risk areas were found mainly in northeastern and southeastern Chongqing, southwestern Sichuan, northeastern and eastern Guizhou, and central and eastern Yunnan. These areas are characteristic of an extremely high-level drought hazard and vulnerability. In other words, the high probability of the occurrence of severe droughts, the high variability of annual rainfall, the distance from irrigation sources, low-level soil AWC, and the low-level coping capacity when drought occurs made these areas highly susceptible to droughts. The high-risk area was located mainly in southeastern and northeastern Sichuan, the central parts of Chongqing, northeastern Yunnan, and widely scattered areas of Guizhou. These areas were typified by a moderate-level drought hazard and a high-level drought vulnerability. The low and moderate risk areas were located mainly in southeastern Sichuan, southwestern Chongqing, central and southern Guizhou, and southeastern and northeastern Yunnan. These areas were characterized by a low drought hazard and a low agricultural drought vulnerability. However, in the long run, such areas might also be affected by drought because of their low-level coping capacity when drought occurs.
5. Discussion
5.1. Adaptation of Agriculture to the Increased Drought Risk
The results showed that a great proportion of the farmland was exposed to extremely high risk (27.4%) and high risk (33.5%) in Southwest China (Figure 8b). With rapid urbanization, the demand for industrial and municipal water will increase substantially, which may further reduce the availability of water for agriculture and thus increase the agricultural areas with a high drought risk. Several studies have concluded that drought events will become more frequent in the context of global climate change [10,11,12]. Consequently, drought disasters will be a continual challenge for ecology in the future, especially for agriculture. Therefore, knowing how to effectively minimize the yield losses caused by drought is particularly important. The agricultural drought risk studied here was the combined result of the drought hazard and agricultural drought vulnerability. Mitigating the agricultural drought risk should also be based on ways to mitigate the drought hazard, drought vulnerability, or both. Therefore, the following issues should be addressed.
From the drought hazard perspective, a drought hazard (defined by the frequency of drought occurrences and the severity of the drought) is mainly caused by variations in climatic conditions. In Southwest China, the climate is very changeable, with an annual precipitation variability of 10% to 20%, which is higher than the international coefficient of 8% [56]. Consequently, the wide distribution of extremely severe and severe drought hazards, based on SPEI3, has largely induced a wide distribution of extremely drought-risk agricultural areas. Thus, to improve our ability to detect and monitor drought, we must understand the drivers of regional drought and the long-term variability of the climate system. To date, the possible causes of drought in Southwest China have focused on the influence of monsoons, water vapor transport, the Qinghai–Tibet Plateau, the sea surface temperature, and the polar oscillation, respectively [57,58,59]. However, even a perfect single-factor forecast will not suffice in predicting drought events in Southwest China because not all drought events are this factor driven. The drought in Southwest China is more likely the result of a combination of multiple factors. Therefore, as Wang et al. [60] demonstrated, there is considerable opportunity to better detect and monitor the drought in Southwest China by using multiple climate indicators (not limited to the key issues outlined above). In other words, we suggest that the climate forecasting systems in Southwest China should account for all climate-related factors and their interactions.
From the perspective of vulnerability to agricultural drought, the wide spatial distribution of areas with an extremely high vulnerability to agricultural drought (accounting for 39.8% of the agricultural areas; Figure 8a) is mainly due to the low proportion of irrigable farmland (Figure 7d) and the unavailability of rainwater because of the low soil AWC. This requires that measures and policies be instated, such as those aimed at avoiding water wastage, enhancing water conservation, and improving water-saving techniques to make water use more efficient. In addition, because droughts are difficult to predict or are unpredictable in certain areas, preparedness measures are paramount to cope with agricultural drought [61]. We suggest that the local government establish a standard operational procedure to avoid administrative delays and allow quick decisions in response to requests made by states in the wake of a drought. Furthermore, the wide distribution of high drought-risk areas in Southwest China is correlated with the relatively sluggish development of its economy (Figure 7e). Because of various factors such as its history and economy, Southwest China has a low quality of human capital (e.g., education, health and nutrition, and social well-being) and a large proportion of poverty. However, human capital and financial ability play an important role in coping with the impacts caused by drought events. Poverty affects vulnerability to drought (particularly for rural households that depend on rain-fade farming and that lack access to other income-generating opportunities) through individuals’ expectations regarding the impacts of hazards and their ability to invest to alleviate risks. Furthermore, it affects their coping ability and ability to recover from extreme events by directly constraining opportunities that would allow them to cope and reducing their resilience to impacts [42]. Therefore, we suggest that the local government should increase farmers’ income and provide more opportunities for other jobs. Yet income-earning opportunities are still affected mainly by human capital. For example, education can increase the income opportunities for rural households whose livelihoods depend on agriculture; otherwise, these persons may be excluded from high-paying jobs because of their lack of skills [62,63]. As the Alene in northern Nigeria have shown, not only can education enhance agricultural productivity following technology adoption, but it also promotes technology adoption itself [64]. Therefore, we suggest that the local government should increase its investment in education and guarantee the right of every farmer’s child to receive a better education. For elderly people who are unable to receive an education and gain other work opportunities, we suggest that the local government introduce a novel index-based drought microinsurance product like that in northern Kenya. The results of this project have shown that insured households are, on average, 27–36 percentage points less likely to reduce meals than their uninsured counterparts. Insured households in northern Kenya are less dependent on food aid and other forms of assistance [65].
5.2. Comparison of Our Findings and Risk Assessment Method with Those of Previous Studies
The precipitation patterns of China have changed greatly. The average annual precipitation has decreased by about 0.57 mm/a in China within the context of global climate change [66]. In this study, we have identified the dramatic enhancement of PET induced by warming and the sharply decreasing precipitation after 2000 in Southwest China. We have concluded that the main meteorological reason for the high frequency of extreme drought after the 2000s was the combined effect of abnormal decreases in rainfall and continued increases in temperature. These findings are supported by previous related studies. Han et al. [67] analyzed drought trends based on statistical disaster data in Southwest China over nearly the past 60 years. Their study concluded that extreme drought events in Southwest China have been caused mainly by rising temperatures and that the increase in regional temperatures has caused serious water deficits. Furthermore, their study pointed out that these changes in precipitation were a direct factor in the formation of drought. Wang and Chen [68] have also paid much attention to the characteristics of drought over Southwest China in the last 100 years. They concluded that the emergence of extreme drought in recent years can be attributed to the cooccurrence of precipitation deficits at different timescales and extremely high temperatures.
In addition, our results revealed extremely high drought-risk areas located mainly in northeastern and southeastern Chongqing, southwestern Sichuan, northeastern and eastern Guizhou, and central and eastern Yunnan. These results were generally similar to those of Xu et al. [69], who assessed the agricultural drought risk by using correlations between the drought severity and economic losses, as well as by the physical exposure and resistance of different crops to drought. However, Xu et al. [69] did not indicate in their analysis the extremely drought-risk areas in southwestern Sichuan. The main reason was that in their study, they did not consider the effects of soil, topographic, and irrigation factors on the agricultural drought risk and that the overall risk level could be decreased. Furthermore, Xu et al. [69] focused on economic losses caused by reductions in grain yield, but other disasters in addition to drought can result in reduced grain yields.
The assessment model used in this paper was generally accepted by the IPCC and UNISDR. Using this framework, we were able to accurately define the risk level and evaluate the spatial pattern of agricultural drought risk at a 1-km grid scale. This was a feasible way to reduce uncertainty caused by the research scale, and it allowed us to study agricultural drought risk as advancing from points toward spaces and from small areas toward large areas. This method is more precise than those assessing the administrative unit [8,31,32] because factors within an administrative district may vary enormously. Additionally, to unearth the mechanisms of agricultural vulnerability as accurately as possible, we specifically selected only farming areas as disaster exposure elements and comprehensively selected key natural, social, and economic indicators that are related to agricultural drought.
However, bias may also appear through the selection of factors, the determination of factor weights, or both. In our future work, we will pursue how to make these factors more reasonable. Additionally, the social attributes used in the drought risk assessment are the result of static analyses, which cannot accurately represent the changes in drought risk under rapid economic development. This will require improvements to the analysis and prediction of changing laws and trends in socioeconomic factors in our future work.
6. Conclusions
This study was carried out to identify the characteristics of drought—including its duration, frequency, and severity—against the background of climate change. Furthermore, we applied a more precise method to assess agricultural drought risk quantitatively at a 1-km grid scale. Our main conclusions are as follows:
- The severity and frequency of drought, as indicated by the SPEI at 3-, 6-, and 12-month timescales, all showed an obviously increasing trend, especially since the start of the 21st century. The combined effects of abnormal decreases in rainfall and continued increases in temperature have resulted in the occurrence of extremely serious drought events since the 2000s.
- The areas with severe and extremely severe drought hazards based on SPEI6 were the largest, followed by those based on SPEI3 and then on SPEI12.
- The areas with extremely severe vulnerability covered 39.8% of the agricultural areas, 65.6% of which were distributed in Sichuan and Yunnan. The main reasons for the high level of agricultural drought vulnerability in Southwest China were low-level coping ability and absence of measures for mitigating drought.
- The extremely high drought risk areas were mainly located in northeastern and southeastern Chongqing, southwestern Sichuan, northeastern and eastern Guizhou, and central and eastern Yunnan. Specifically, 27.4% of agricultural areas were exposed to an extremely high risk of drought, 33.5% to a high risk, 22.5% to a moderate risk, and 16.6% to a low risk.
Author Contributions
Z.Z. and W.W. designed the research and performed the analysis, and Z.Z. wrote the first draft. Z.Z., Z.L. and Y.Z. reviewed and edited the draft. Y.G. and H.H. collected the data.
Funding
This research was funded by the Strategic Priority Research Program of the Chinese Academy of Sciences (XDA19040304) and the National Key Research and Development Program of China Grants (2016YFA0602402), and the Postdoctoral Science Foundation of China (2018M641459).
Conflicts of Interest
The authors declare no conflict of interest.
References
- Trenberth, K.E.; Dai, A.; van der Schrier, G.; Jones, P.D.; Barichivich, J.; Briffa, K.R.; Sheffield, J. Global warming and changes in drought. Nat. Clim. Chang. 2014, 4, 17–22. [Google Scholar] [CrossRef]
- Wilhite, D.A. Drought as a Natural Hazard—Concepts and Definitions; Routledge & Kegan Paul Inc.: New York, NY, USA, 2000; pp. 3–18. [Google Scholar]
- Dai, A. Characteristics and trends in various forms of the Palmer Drought Severity Index during 1900–2008. J. Geophys. Res. Atmos. 2011, 116. [Google Scholar] [CrossRef]
- Sheffield, J.; Wood, E.F.; Roderick, M.L. Little change in global drought over the past 60 years. Nature 2012, 491, 435–438. [Google Scholar] [CrossRef] [PubMed]
- Guo, H.; Bao, A.; Liu, T.; Jiapaer, G.; Ndayisaba, F.; Jiang, L.; Kurban, A.; De Maeyer, P. Spatial and temporal characteristics of droughts in Central Asia during 1966–2015. Sci. Total Environ. 2018, 624, 1523–1538. [Google Scholar] [CrossRef]
- Wu, H.; Hubbard, K.G.; Wilhite, D.A. An agricultural drought risk-assessment model for corn and soybeans. Int. J. Climatol. 2004, 24, 723–741. [Google Scholar] [CrossRef] [Green Version]
- Li, R.; Tsunekawa, A.; Tsubo, M. Index-based assessment of agricultural drought in a semi-arid region of Inner Mongolia, China. J. Arid Land 2014, 6, 3–15. [Google Scholar] [CrossRef]
- Zhang, Q.; Sun, P.; Li, J.; Xiao, M.; Singh, V.P. Assessment of drought vulnerability of the Tarim River basin, Xinjiang, China. Theor. Appl. Climatol. 2015, 121, 337–347. [Google Scholar] [CrossRef]
- Zhao, H.; Gao, G.; Yan, X.; Zhang, Q.; Hou, M.; Zhu, Y.; Tian, Z. Risk assessment of agricultural drought using the CERES-Wheat model: A case study of Henan Plain, China. Clim. Res. 2011, 50, 247–256. [Google Scholar] [CrossRef]
- Burke, E.J.; Brown, S.J.; Christidis, N. Modeling the recent evolution of global drought and projections for the twenty-first century with the hadley centre climate model. J. Hydrometeorol. 2006, 7, 1113–1125. [Google Scholar] [CrossRef]
- Rezaei, E.E.; Webber, H.; Gaiser, T.; Naab, J.; Ewert, F. Heat stress in cereals: Mechanisms and modelling. Eur. J. Agron. 2015, 64, 98–113. [Google Scholar] [CrossRef]
- Wanders, N.; Wada, Y. Human and climate impacts on the 21st century hydrological drought. J. Hydrol. 2015, 526, 208–220. [Google Scholar] [CrossRef]
- Prasad, P.; Boote, K.; Allen, L., Jr.; Sheehy, J.; Thomas, J. Species, ecotype and cultivar differences in spikelet fertility and harvest index of rice in response to high temperature stress. Field Crop. Res. 2006, 95, 398–411. [Google Scholar] [CrossRef]
- Hai, X.; Li, Q.; Pen, M.; Xu, G. The serious droughts of Chongqing in 2006 and the causes. J. Shaanxi Norm. Univ. 2008, 36, 85–90. (In Chinese) [Google Scholar]
- Zhang, L.; Xiao, J.F.; Li, J.; Wang, K.; Lei, L.P.; Guo, H.D. The 2010 spring drought reduced primary productivity in southwestern China. Environ. Res. Lett. 2012, 7, 10. [Google Scholar] [CrossRef]
- Yu, M.; Li, Q.; Hayes, M.J.; Svoboda, M.D.; Heim, R.R. Are droughts becoming more frequent or severe in China based on the standardized precipitation evapotranspiration index: 1951–2010? Int. J. Climatol. 2014, 34, 545–558. [Google Scholar] [CrossRef]
- IPCC (Intergovernmental Panel on Climate Change). Managing the Risks of Extreme Events and Disasters to Advance Climate Change Adaptation; A Special Report of Working Groups I and II of the Intergovernmental Panel on Climate Change; Field, C., Barros, V., Stocker, T., Qin, D., Dokken, D., Ebi, K., Mastrandrea, M., Mach, K., Plattner, G.-K., Allen, S., Eds.; Cambridge University Press: Cambridge, UK; New York, NY, USA, 2012; Volume 30, pp. 7575–7613. [Google Scholar]
- UNISDR (United Nations International Strategy for Disaster Reduction). Living with Risk: A Global Review of Disaster Reduction Initiatives; United Nations Publications: Geneva, Switzerland, 2004; Volume 1. [Google Scholar]
- Welle, T.; Birkmann, J. The world risk index—An approach to assess risk and vulnerability on a global scale. J. Extrem. Events 2015, 2, 1550003. [Google Scholar] [CrossRef]
- Guttman, N.B. Comparing the Palmer Drought Index and the standardized precipitation index. J. Am. Water Resour. Assoc. 1998, 34, 113–121. [Google Scholar] [CrossRef]
- Vicente-Serrano, S.M.; Beguería, S.; López-Moreno, J.I.; Angulo, M.; El Kenawy, A. A new global 0.5 gridded dataset (1901–2006) of a multiscalar drought index: Comparison with current drought index datasets based on the Palmer Drought Severity Index. J. Hydrometeorol. 2010, 11, 1033–1043. [Google Scholar] [CrossRef]
- Geyaert, A.I.; Veldkamp, T.I.E.; Ward, P.J. The effect of climate type on timescales of drought propagation in an ensemble of global hydrological models. Hydrol. Earth Syst. Sci. 2018, 22, 4649–4665. [Google Scholar] [CrossRef] [Green Version]
- Xu, K.; Qin, G.X.; Niu, J.; Wu, C.H.; Hu, B.X.; Huang, G.R.; Wang, P. Comparative analysis of meteorological and hydrological drought over the Pearl River basin in southern China. Hydrol. Res. 2019, 50, 301–318. [Google Scholar] [CrossRef]
- McKee, T.B.; Doesken, N.J.; Kleist, J. The relationship of drought frequency and duration to time scales. In Proceedings of the 8th Conference on Applied Climatology, Anaheim, CA, USA, 17–22 January 1993; pp. 179–183. [Google Scholar]
- Shukla, S.; Wood, A.W. Use of a standardized runoff index for characterizing hydrologic drought. Geophys. Res. Lett. 2008, 35. [Google Scholar] [CrossRef] [Green Version]
- Kamali, B.; Kouchi, D.H.; Yang, H.; Abbaspour, K.C. Multilevel drought hazard assessment under climate change scenarios in semi-arid regions—A case study of the Karkheh river basin in Iran. Water 2017, 9, 241. [Google Scholar] [CrossRef]
- Kwon, M.; Sung, J.H. Changes in future drought with HadGEM2-AO projections. Water 2019, 11, 312. [Google Scholar] [CrossRef]
- Vicente-Serrano, S.M.; Begueria, S.; Lopez-Moreno, J.I. A multiscalar drought index sensitive to global climate change: The standardized precipitation evapotranspiration index. J. Clim. 2010, 23, 1696–1718. [Google Scholar] [CrossRef]
- Kim, H.; Park, J.; Yoo, J.; Kim, T.-W. Assessment of drought hazard, vulnerability, and risk: A case study for administrative districts in South Korea. J. Hydro-Environ. Res. 2015, 9, 28–35. [Google Scholar] [CrossRef]
- Li, Y.; Ye, W.; Wang, M.; Yan, X. Climate change and drought: A risk assessment of crop-yield impacts. Clim. Res. 2009, 39, 31–46. [Google Scholar] [CrossRef]
- Shahid, S.; Behrawan, H. Drought risk assessment in the western part of Bangladesh. Nat. Hazards 2008, 46, 391–413. [Google Scholar] [CrossRef]
- Hao, L.; Zhang, X.; Liu, S. Risk assessment to China’s agricultural drought disaster in county unit. Nat. Hazards 2012, 61, 785–801. [Google Scholar] [CrossRef]
- He, B.; Wu, J.; Lu, A.; Cui, X.; Zhou, L.; Liu, M.; Zhao, L. Quantitative assessment and spatial characteristic analysis of agricultural drought risk in China. Nat. Hazards 2013, 66, 155–166. [Google Scholar] [CrossRef]
- Azam, M.; Maeng, S.J.; Kim, H.S.; Murtazaey, A. Copula-based stochastic simulation for regional drought risk assessment in South Korea. Water 2018, 10, 359. [Google Scholar] [CrossRef]
- Qin, N.X.; Chen, X.; Fu, G.B.; Zhai, J.Q.; Xue, X.W. Precipitation and temperature trends for the Southwest China: 1960–2007. Hydrol. Process. 2010, 24, 3733–3744. [Google Scholar] [CrossRef]
- China Meteorological Data Sharing System. Available online: http://cdc.cma.gov.cn (accessed on 21 May 2019).
- National Earth System Science Data Sharing Infrastructure. Available online: http://www.geodata.cn (accessed on 21 May 2019).
- Resource and Environment Data Cloud Platform. Available online: http://www. resdc.cn (accessed on 21 May 2019).
- Thornthwaite, C.W. An approach toward a rational classification of climate. Geogr. Rev. 1948, 38, 55–94. [Google Scholar] [CrossRef]
- Ji, L.; Peters, A.J. Assessing vegetation response to drought in the northern Great Plains using vegetation and drought indices. Remote Sens. Environ. 2003, 87, 85–98. [Google Scholar] [CrossRef]
- Sonmez, F.K.; Komuscu, A.U.; Erkan, A.; Turgu, E. An analysis of spatial and temporal dimension of drought vulnerability in Turkey using the standardized precipitation index. Nat. Hazards 2005, 35, 243–264. [Google Scholar] [CrossRef]
- Adger, W.N.; Kelly, P.M. Social vulnerability to climate change and the architecture of entitlements. Mitig. Adapt. Strateg. Glob. Chang. 1999, 4, 253–266. [Google Scholar] [CrossRef]
- Birkmann, J.; Cardona, O.D.; Carreno, M.L.; Barbat, A.H.; Pelling, M.; Schneiderbauer, S.; Kienberger, S.; Keiler, M.; Alexander, D.; Zeil, P.; et al. Framing vulnerability, risk and societal responses: The MOVE framework. Nat. Hazards 2013, 67, 193–211. [Google Scholar] [CrossRef]
- Cutter, S.L.; Finch, C. Temporal and spatial changes in social vulnerability to natural hazards. Proc. Natl. Acad. Sci. USA 2008, 105, 2301–2306. [Google Scholar] [CrossRef] [Green Version]
- Giupponi, C.; Biscaro, C. Vulnerabilities—Bibliometric analysis and literature review of evolving concepts. Environ. Res. Lett. 2015, 10, 123002. [Google Scholar] [CrossRef]
- Jain, V.K.; Pandey, R.P.; Jain, M.K. Spatio-temporal assessment of vulnerability to drought. Nat. Hazards 2015, 76, 443–469. [Google Scholar] [CrossRef]
- Wilhelmi, O.V.; Wilhite, D.A. Assessing vulnerability to agricultural drought: A Nebraska case study. Nat. Hazards 2002, 25, 37–58. [Google Scholar] [CrossRef]
- Xu, X.; Liu, J.; Cao, M.; Zhang, S. Impact of recent climate fluctuation and LUCC process on potential productivity for crops in Northeast China. Sci. Geogr. Sin. 2007, 27, 318–324. (In Chinese) [Google Scholar]
- Woo, M.-K. Permafrost Hydrology; Springer Science & Business Media: Berlin/Heidelberg, Germany, 2012. [Google Scholar]
- Yang, X.; Lin, E.; Ma, S.; Ju, H.; Guo, L.; Xiong, W.; Li, Y.; Xu, Y. Adaptation of agriculture to warming in Northeast China. Clim. Chang. 2007, 84, 45–58. [Google Scholar] [CrossRef]
- Yodmani, S. Disaster preparedness and management. In Social Protection in Asia and the Pacific; International Labour Organization (ILO): Genève, Switzerland, 2001; pp. 481–502. [Google Scholar]
- Simelton, E.; Fraser, E.D.G.; Termansen, M.; Forster, P.M.; Dougill, A.J. Typologies of crop-drought vulnerability: An empirical analysis of the socio-economic factors that influence the sensitivity and resilience to drought of three major food crops in China (1961–2001). Environ. Sci. Policy 2009, 12, 438–452. [Google Scholar] [CrossRef]
- Batjes, N.H. Development of a world data set of soil water retention properties using pedotransfer rules. Geoderma 1996, 71, 31–52. [Google Scholar] [CrossRef]
- D’Emilio, A.; Aiello, R.; Consoli, S.; Vanella, D.; Iovino, M. Artificial Neural Networks for Predicting the Water Retention Curve of Sicilian Agricultural Soils. Water 2018, 10, 1431. [Google Scholar] [CrossRef]
- Saxton, K.E.; Rawls, W.J. Soil water characteristic estimates by texture and organic matter for hydrologic solutions. Soil Sci. Soc. Am. J. 2006, 70, 1569–1578. [Google Scholar] [CrossRef]
- Wang, D.; Zhang, B.; An, M.; Zhang, T.; Ji, D.; Ren, P. Temporal and spatial distributions of drought in Southwest China over the past 53 years based on standardized precipitation evapotranspiration index. J. Nat. Resour. 2014, 29, 1003–1016. (In Chinese) [Google Scholar]
- Feng, L.; Li, T.; Yu, W. Cause of severe droughts in Southwest China during 1951–2010. Clim. Dyn. 2014, 43, 2033–2042. [Google Scholar] [CrossRef]
- Yang, J.; Gong, D.; Wang, W.; Hu, M.; Mao, R. Extreme drought event of 2009/2010 over southwestern China. Meteorol. Atmos. Phys. 2012, 115, 173–184. [Google Scholar] [CrossRef]
- Zhang, W.; Jin, F.-F.; Zhao, J.-X.; Qi, L.; Ren, H.-L. The possible influence of a nonconventional El Nino on the severe autumn drought of 2009 in Southwest China. J. Clim. 2013, 26, 8392–8405. [Google Scholar] [CrossRef]
- Wang, L.; Chen, W.; Zhou, W.; Huang, G. Drought in Southwest China: A Review. Atmos. Ocean. Sci. Lett. 2015, 8, 339–344. [Google Scholar]
- Pereira, L.S.; Oweis, T.; Zairi, A. Irrigation management under water scarcity. Agric. Water Manag. 2002, 57, 175–206. [Google Scholar] [CrossRef]
- Rakodi, C. A capital assets framework for analysing household livelihood strategies: Implications for policy. Dev. Policy Rev. 1999, 17, 315–342. [Google Scholar] [CrossRef]
- Paavola, J. Livelihoods, vulnerability and adaptation to climate change in Morogoro, Tanzania. Environ. Sci. Policy 2008, 11, 642–654. [Google Scholar] [CrossRef]
- Alene, A.D.; Manyong, V.M. The effects of education on agricultural productivity under traditional and improved technology in northern Nigeria: An endogenous switching regression analysis. Empir. Econ. 2007, 32, 141–159. [Google Scholar] [CrossRef]
- Janzen, S.A.; Carter, M.R. The Impact of Microinsurance on Asset Accumulation and Human Capital Investments: Evidence from a Drought in Kenya; ILO Microinsurance Innovation Facility Research Paper; International Labour Organization (ILO): Genève, Switzerland, 2013. [Google Scholar]
- Wang, Y.; Cao, M.; Tao, B.; Li, K. The characteristics of spatio-temporal patterns in precipitation in China under the background of global climate change. Geogr. Res. 2006, 25, 1031–1040. (In Chinese) [Google Scholar]
- Han, L.; Zhang, Q.; Yao, Y.; Li, Y.; Jia, J.; Wang, J. Characteristics and origins of drought disasters in Southwest China in nearly 60 years. Acta Geogr. Sin. 2014, 69, 632–639. (In Chinese) [Google Scholar]
- Wang, L.; Chen, W. Characteristics of multi-timescale variabilities of the drought over last 100 years in Southwest China. Adv. Meteorol. Sci. Technol. 2012, 2, 21–26. (In Chinese) [Google Scholar]
- Xu, X.; Ge, Q.; Zheng, J. Drought risk assessment on regional agriculture: A case in Southwest China. Prog. Geogr. 2011, 30, 883–890. (In Chinese) [Google Scholar]
Figure 1.
(a) Extent of the study area and the location of rain-gauge stations in Southwest China; (b) Spatial pattern of annual mean rainfall over Southwest China.
Figure 1.
(a) Extent of the study area and the location of rain-gauge stations in Southwest China; (b) Spatial pattern of annual mean rainfall over Southwest China.

Figure 2.
Changing trend of annual (a) precipitation, (b) potential evapotranspiration (PET), (c) temperature, and (d) SPEI in the period from 1960 to 2017.
Figure 2.
Changing trend of annual (a) precipitation, (b) potential evapotranspiration (PET), (c) temperature, and (d) SPEI in the period from 1960 to 2017.

Figure 3.
Time series of the Standardized Precipitation Evapotranspiration Index (SPEI) with 3-, 6-, and 12-month timescales in Southwest China.
Figure 3.
Time series of the Standardized Precipitation Evapotranspiration Index (SPEI) with 3-, 6-, and 12-month timescales in Southwest China.

Figure 4.
Map of drought frequency (a–c) and duration (d–f) over Southwest China for the periods 1960–1979, 1980–1999, and 2000–2017, respectively.
Figure 4.
Map of drought frequency (a–c) and duration (d–f) over Southwest China for the periods 1960–1979, 1980–1999, and 2000–2017, respectively.

Figure 5.
Spatial distribution of drought frequency (a–c) and duration (d–f) with 3-, 6-, and 12-month timescales over Southwest China from 1960 to 2017.
Figure 5.
Spatial distribution of drought frequency (a–c) and duration (d–f) with 3-, 6-, and 12-month timescales over Southwest China from 1960 to 2017.

Figure 6.
Spatial variation in the agricultural drought hazard at (a) 3-, (b) 6-, and (c) 12-month timescales.
Figure 6.
Spatial variation in the agricultural drought hazard at (a) 3-, (b) 6-, and (c) 12-month timescales.

Figure 7.
Grid-based maps of drought vulnerability indicators: (a) farmland production potential, (b) soil available water-holding capacity, (c) slope, (d) irrigation support, and (e) GDP.
Figure 7.
Grid-based maps of drought vulnerability indicators: (a) farmland production potential, (b) soil available water-holding capacity, (c) slope, (d) irrigation support, and (e) GDP.

Figure 8.
Spatial variation in the agricultural drought vulnerability (a) and risk (b) in Southwest China at a 1-km grid scale.
Figure 8.
Spatial variation in the agricultural drought vulnerability (a) and risk (b) in Southwest China at a 1-km grid scale.


Table 1.
Categorization of drought severity by the Standardized Precipitation Evapotranspiration Index (SPEI).
Table 1.
Categorization of drought severity by the Standardized Precipitation Evapotranspiration Index (SPEI).
| Category | SPEI Value |
|---|---|
| Near normal | −1.0 to 1.0 |
| Moderate dryness | −1.49 to −1.0 |
| Severe dryness | −1.99 to −1.5 |
| Extremely dryness | Less than −2 |
© 2019 by the authors. Licensee MDPI, Basel, Switzerland. This article is an open access article distributed under the terms and conditions of the Creative Commons Attribution (CC BY) license (http://creativecommons.org/licenses/by/4.0/).
Share and Cite
MDPI and ACS Style
Zeng, Z.; Wu, W.; Li, Z.; Zhou, Y.; Guo, Y.; Huang, H. Agricultural Drought Risk Assessment in Southwest China. Water 2019, 11, 1064. https://doi.org/10.3390/w11051064
AMA Style
Zeng Z, Wu W, Li Z, Zhou Y, Guo Y, Huang H. Agricultural Drought Risk Assessment in Southwest China. Water. 2019; 11(5):1064. https://doi.org/10.3390/w11051064
Chicago/Turabian StyleZeng, Zhaoqi, Wenxiang Wu, Zhaolei Li, Yang Zhou, Yahui Guo, and Han Huang. 2019. "Agricultural Drought Risk Assessment in Southwest China" Water 11, no. 5: 1064. https://doi.org/10.3390/w11051064
Note that from the first issue of 2016, this journal uses article numbers instead of page numbers. See further details here.