Article

A Revised Method of Surface Water Quality Evaluation Based on Background Values and Its Application to Samples Collected in Heilongjiang Province, China

1
Department of Water Environment, China Institute of Water Resources and Hydropower Research, Beijing 100038, China
2
College of Hydrology and Water Resources, Hohai University, Nanjing 210098, China
3
State Key Laboratory of Simulation and Regulation of Water Cycle in River Basin, China Institute of Water Resources and Hydropower Research, Beijing 100038, China
*
Author to whom correspondence should be addressed.
Water 2019, 11(5), 1057; https://doi.org/10.3390/w11051057
Submission received: 22 April 2019 / Revised: 16 May 2019 / Accepted: 17 May 2019 / Published: 21 May 2019
(This article belongs to the Special Issue Environmental Chemistry of Water Quality Monitoring)

Abstract

:
In China, the use of certain standards to evaluate surface water quality in areas with high background values due to natural factors rather than to human activities results in water quality underestimation and thus affects regional water quality management and decision-making. Herein, we examined river source water function zones of the Heilongjang province characterised by high background values and analysed the corresponding water quality data acquired in 2011–2016. The examined samples featured elevated chemical oxygen demand (COD), permanganate index (CODMn), and ammonia nitrogen (NH3-N) levels, which indicated that water quality was affected by the natural environment. The concentrations of background pollutants almost exceeded the limits stipulated by regional surface water quality standards and exhibited strong spatiotemporal variability. A three-step discrimination method including single index recognition, limiting factors, and a synthetic index was proposed to distinguish the background area among these zones for determining background values, and 10 complete background areas were identified. The background values of COD, CODMn, and NH3-N for the entire area were determined based on the data acquired during background area monitoring. Finally, considering the present procedure of water quality evaluation in China (single factor exponential method), a revised method based on background values was suggested. Thus, the evaluation results objectively and accurately reflect the regional water quality situation and therefore provide a scientific basis for the development of a better water quality assessment and management system in China.

1. Introduction

Since the 1960s, countries around the world have become increasingly concerned about environmental problems. Consequently, the concept of geochemical background values was proposed as a tool for evaluating environmental quality, predicting contaminant transport and transformation of the area, monitoring environmental pollution, and determining the content of chemical elements in the natural environment [1,2,3]. Geochemical background values have since been applied widely in the field of environmental evaluation to describe the differences between element concentrations derived from nature and concentration anomalies derived from human activity [4,5,6].
A large body of research has investigated geochemical background values. Current research primarily focuses on groundwater and soil/sediment, whereas few studies have investigated surface water in rivers or lakes [7,8,9,10]. Compared to soil and groundwater, determining surface water geochemical background values is difficult because of various factors influencing its complexity and variability (e.g., hydrologic and hydraulic conditions, the natural environment, and anthropogenic factors). However, determining surface water geochemical background values is key for guiding environmental legislation, regional water resource protection, and managing the water quality of rivers.
In 2012, a strict water resources management system was implemented in the People’s Republic of China, which has led to increasing interest in background pollutant values in surface water. In Heilongjiang province, numerous rivers originate in or flow through forest zones located in the mountains, where geochemical background values typically exhibit an influence on river water quality. Humic substances produced by the litter layer flow into the river with runoff, which results in elevated pollutant concentrations. This pollutant level increase occurs without anthropogenic influence and has resulted in forest-rivers with high background pollutant values [11,12,13]. In turn, this leads to rivers not reaching the required quality standards, which can be confusing or misleading for water administrators evaluating water quality. Therefore, this research determines water quality background values by systematically identifying typical regional background areas, providing a solution to the long-standing issue that has hindered water quality assessment in watersheds.
Current determination methods predominantly evaluate water quality background values using field studies combined with statistical analyses. The average value of the statistical monitoring data is then defined as the water quality background value of a study area [14,15]. Instead, in this study, the main background pollutants were obtained by analysing the temporal and spatial changes of water quality and the situation of exceeding the standard for many years. For the purpose of water resources management and evaluation, the background values of background pollutants were investigated and studied, and the shortcomings of previous background value studies were summarised (the background of characteristic sampled areas was not demonstrated). Based on land use and other factors, the background areas of the study area were identified. The research work mainly aimed to (1) analyse the water quality of water environment function zones in 2011–2016 and probe the spatiotemporal variation of background pollutant levels; (2) identify the background areas using a three-step discriminant method; (3) install monitoring sites in background areas to calculate background values and compare the results of water quality assessment before and after considering the proposed background values.

2. Materials and Methods
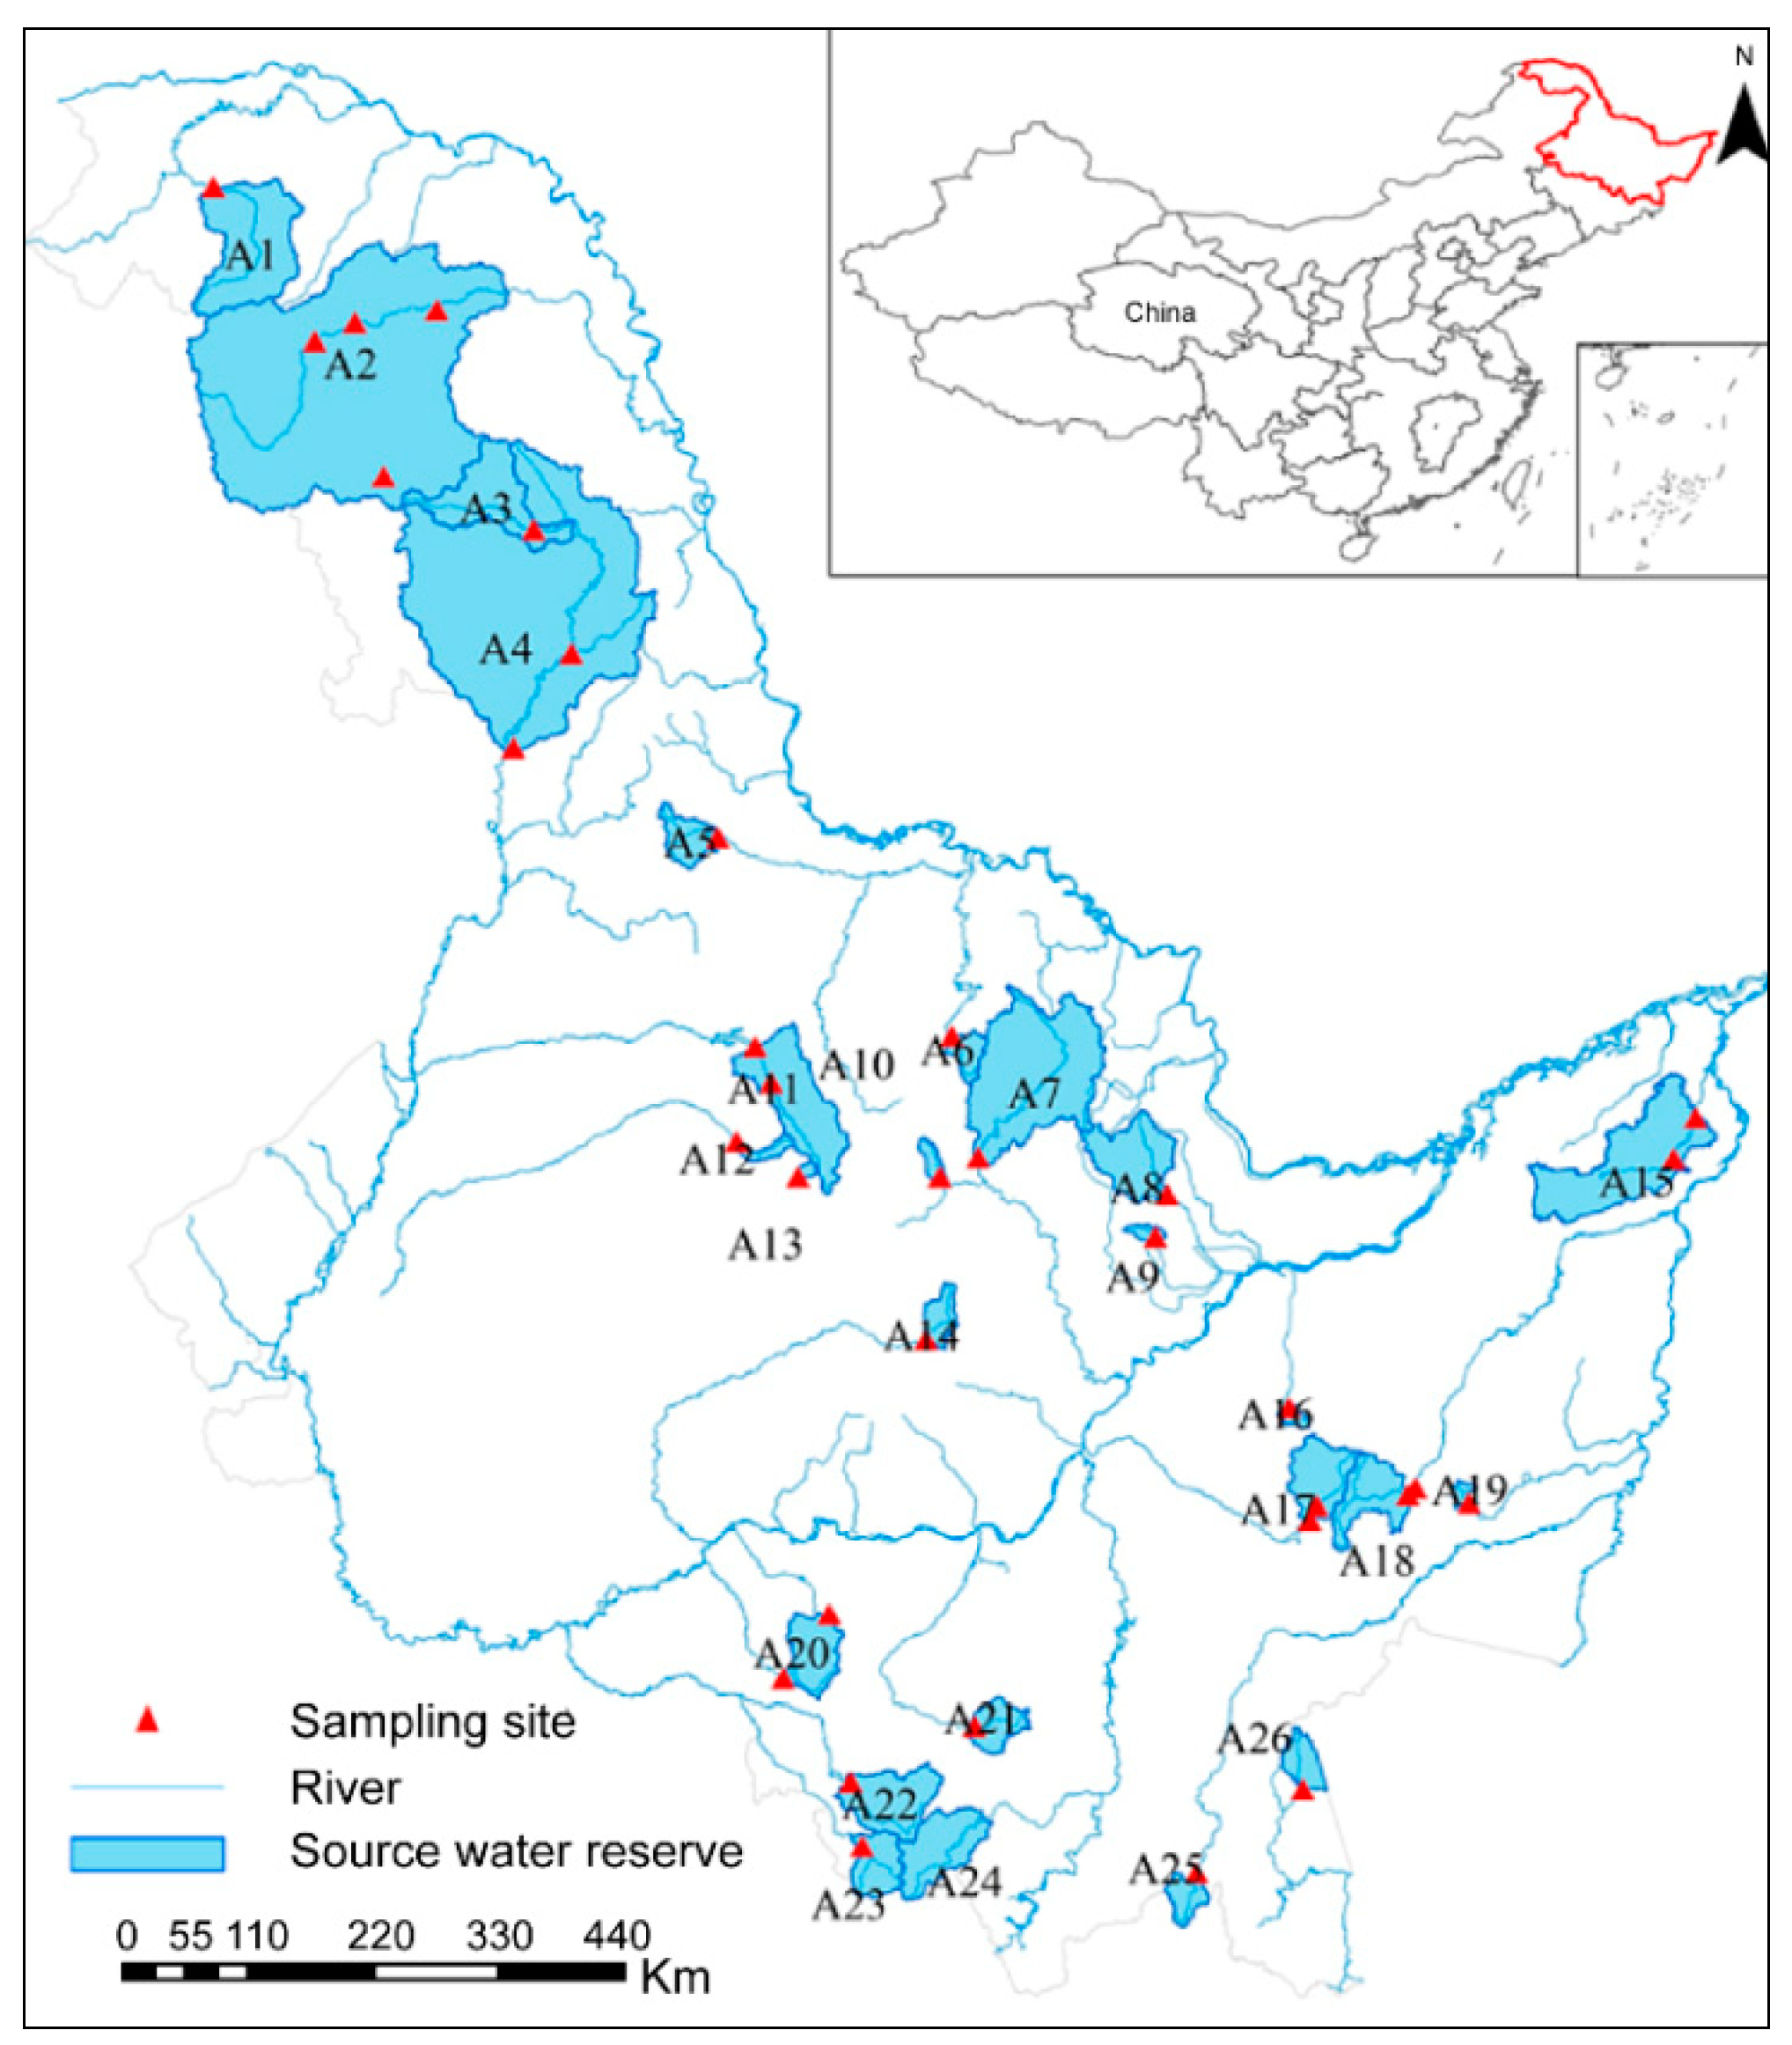
2.1. Study Area

The Heilongjiang Province, located in the most north-eastern part of China and featuring mountains, plains, and mountain-plain zones as the main landforms, borders the Da Hinggan Ling Prefecture in the northwest and the Xiao Hinggan Mountains in the north. In the south-eastern part of the Zhangguangcai and Wandashan Mountains, the forest area accounts for 14% of all forest in China. A total of 194 water environment function zones exist in Heilongjiang Province, 22 of which are river source water environment function zones with the highest water quality standard (type II, Figure 1). The confluence water area of these 22 source water reserves is 41,386 km2 and accounts for 8.8% of Heilongjiang Province (Table 1).

2.2. Sampling Sites and Data Collection

Figure 1 shows the distribution of sampling sites throughout the 22 source water reserves. The total number of water quality data entries of each variable equalled 994. Data were collected from water quality monitoring stations A1–A22 between 2011 and 2016. The impact of human activity on river water quality was determined by estimating land use in the river basin using remote sensing data from 2015. Social data were derived from the yearbook data of the study area. Areas with less or no anthropogenic influence were defined as the surface water background area. A total of 58 sampling sites were located in the background area and used for the surface water quality evaluation.

2.3. Water Quality Assessment

In contrast to the single factor exponential method used in China, the water quality index (originally proposed by the Canadian Council of Ministers of the Environment [16,17]) provides an objective result to managers interested in water quality results by accounting for all variables and producing a single number. Moreover, it is not limited by missing monitoring data of certain variables. The index comprises three factors: Factor 1 (F1) is the percentage of variables exceeding the allowable limits; Factor 2 (F2) is the percentage of samples exceeding allowable quality limits during the study; and Factor 3 (F3) is the amplitude by which the environmental quality standard for water (GB3838-2002) is exceeded [18,19,20,21]. The above factors are calculated as follows:
F 1 = 100 ( 100 × n 1 N )
where N is the total number of variables, and n 1 is the number of variables whose values do not exceed the standard during the monitoring period.
F 2 = 100 ( 100 × n 2 n = 1 N K n )
Here, N is the number of monitoring variables, n 2 is the number of times the monitoring variable does not exceed the standard during the monitoring period; and Kn is the total monitoring frequency of the variable.
F3 is calculated in two steps. When the monitoring value of a variable does not meet the objective and is below the standard value,
e n k = { 0 x n k c n c n x n k 1 x n k < c n
Conversely, when the monitoring value of a variable does not meet the objective and exceeds the standard value,
e n k = { 0 x n k c n x n k c n 1 x n k > c n
where enk is the deviation of the variable, xnk is the monitoring value of the variable, and cn is the standard value.
F 3 = 100 × ( n = 1 N k = 1 K n e n k n = 1 N k = 1 K n e n k + n = 1 N K n )
The values of F3 range from 0 to 100 and reflect the amplitude by which the variable exceeds the standard. Finally, the Canadian Council of Ministers of the Environment Water Quality Index (CCME WQI) is calculated as follows:
C = 100 F 1 2 + F 2 2 + F 3 2 1.732
Five levels of water quality are then defined as follows:
1. Excellent: (CCME WQI 95–100);
2. Good: (CCME WQI 80–94);
3. Fair: (CCME WQI 60–79);
4. Marginal: (CCME WQI 45–59);
5. Poor: (CCME WQI 0–44).

2.4. Statistical Analysis

According to the method proposed by Li et al. [22], the seasonal variation of water quality is analysed using
R M s e , s , p = X ¯ s e , s , p X ¯ s , p
where X ¯ se , s , p is the average concentration of parameter (p) at each site (s) during the study season (se) and X ¯ s , p is the average concentration of parameter (p) at each site (s) across the entire study period (2011–2016). The wet season includes May, July, and September, and the dry season includes January, March, and November. The seasonal average concentration relative to the annual change peak in this season if RMse,s,p > 1 and vice-versa if RMse,s,p < 1.

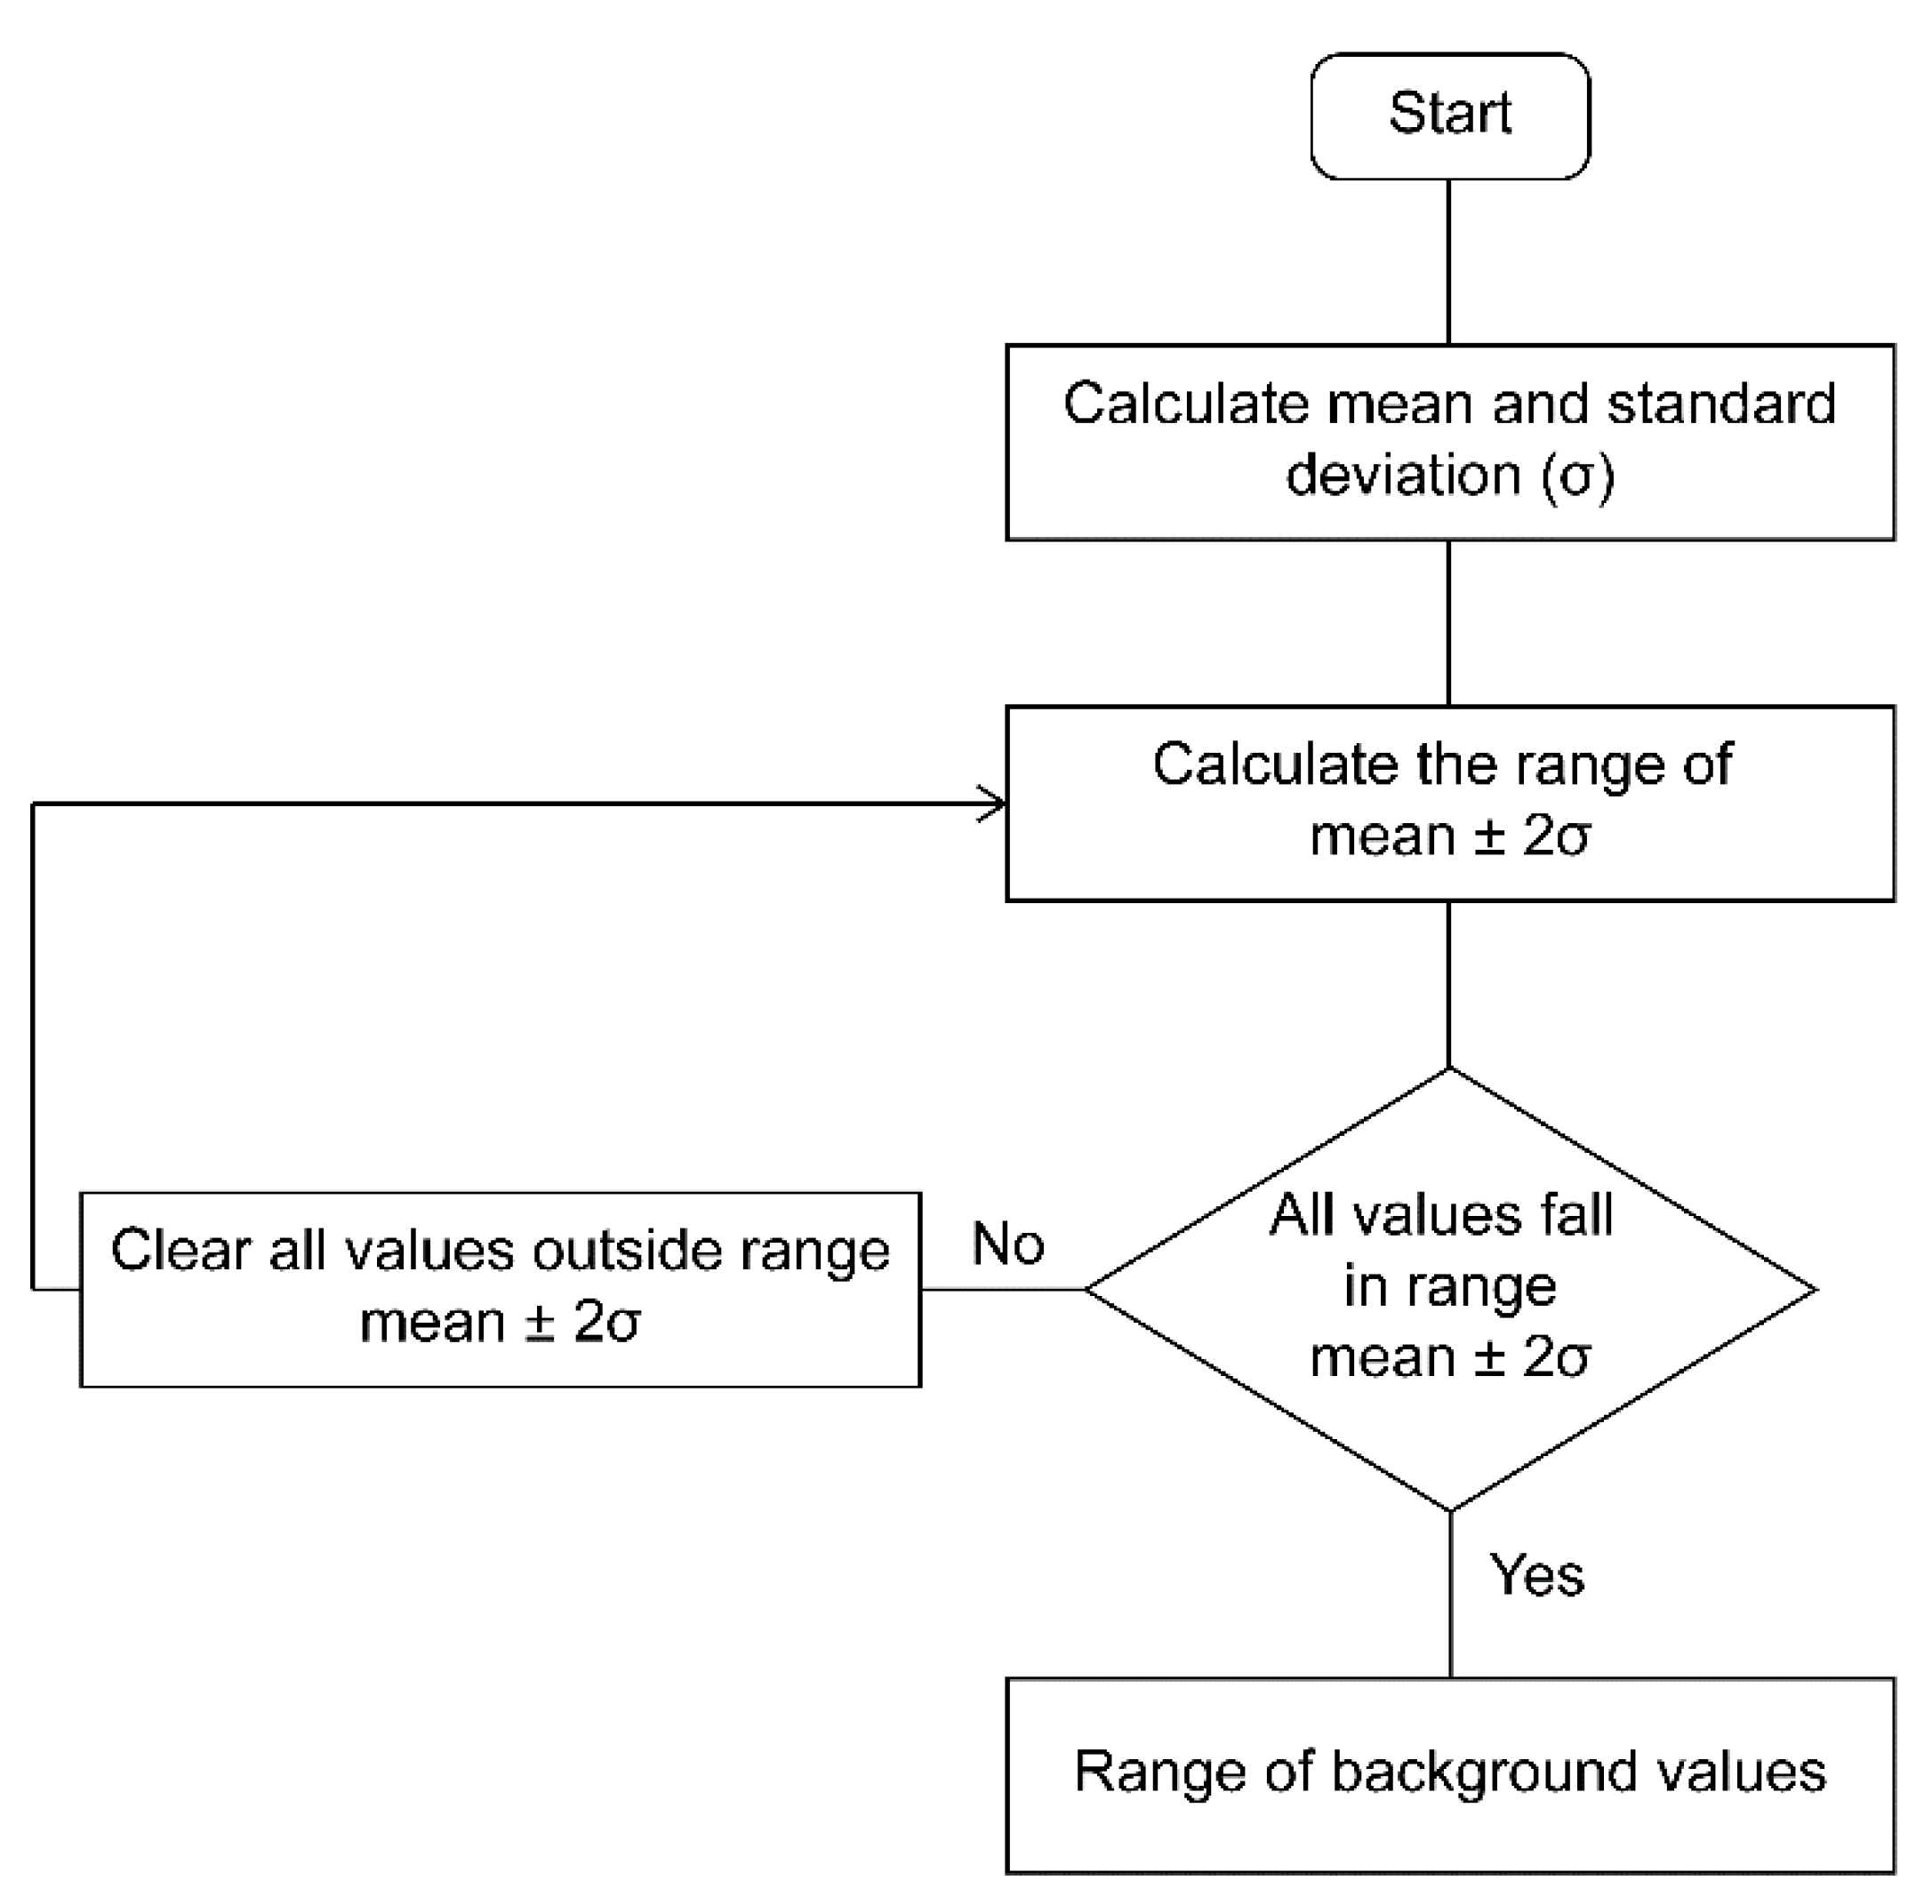
2.5. Iterative 2σ-Technique

The iterative 2σ-technique introduced by Nakic [15] can be used to calculate the background values of chemical variables. The method provides a normal distribution of actual data by deleting the low or high values (anomalies) and leaving a background value range. The low and high values are considered during the calculation to determine the lower and upper limits of background values. The high values, which are typically the result of anthropogenic activities, are positive anomalies, whereas the low values can be considered an abnormal condition or the result of a deviation. Monitoring data obtained from the natural environment does not typically exhibit a normal or log-normal distribution. The advantage of this method over other methods is that does not require a normal or log-normal distribution of all data. If the amount of anomalous data is greater than or equal to that of the background data, the background range is overestimated. However, in this study, this method could be used to calculate background values in the source water reserves, as the monitoring data was acquired from reserves with minimal anthropogenic activities. The specific steps are shown in Figure 2.

3. Results and Discussion

3.1. Water Quality Analysis

There are 24 basic monitoring items of surface water environmental quality in China. Among them, water temperature, pH, total nitrogen, and faecal coliform bacteria contents are not involved in the process of water quality evaluation, while volatile phenols, anionic surfactants, and total phosphorus contents are monitored less than 150 times and less than the detection limit. Therefore, these seven indicators are not considered in the process of water quality evaluation by CCME WQI. CCME WQI provides a single score by combining the measures of 17 routine water quality variables in the study area. The number of failed variables was 5–7 across the study period. Characteristic values of the variables are listed in Table 2 and the proportion of monitoring values that met the water quality requirements are shown in Figure 3. The variables with a higher frequency of exceeding the standard were COD, CODMn, and NH3-N. Therefore, these three variables require further scrutiny.
The CCME WQI values of river source water environment function zones in Heilongjiang Province ranged from 75.32 to 80.71 (Table 2). No statistically significant differences in WQIs were observed during the study period (fair to good water quality). However, according to the environmental quality standards for surface water (GB3838-2002), the results obtained using the single factor method (water quality is assessed by comparing the measured data to the standard, and the worst quality is selected as the evaluation result) of surface water quality evaluation in China were indicative of poor overall water quality, which implied that the zones failed to meet the quality requirements of managers and policy makers.

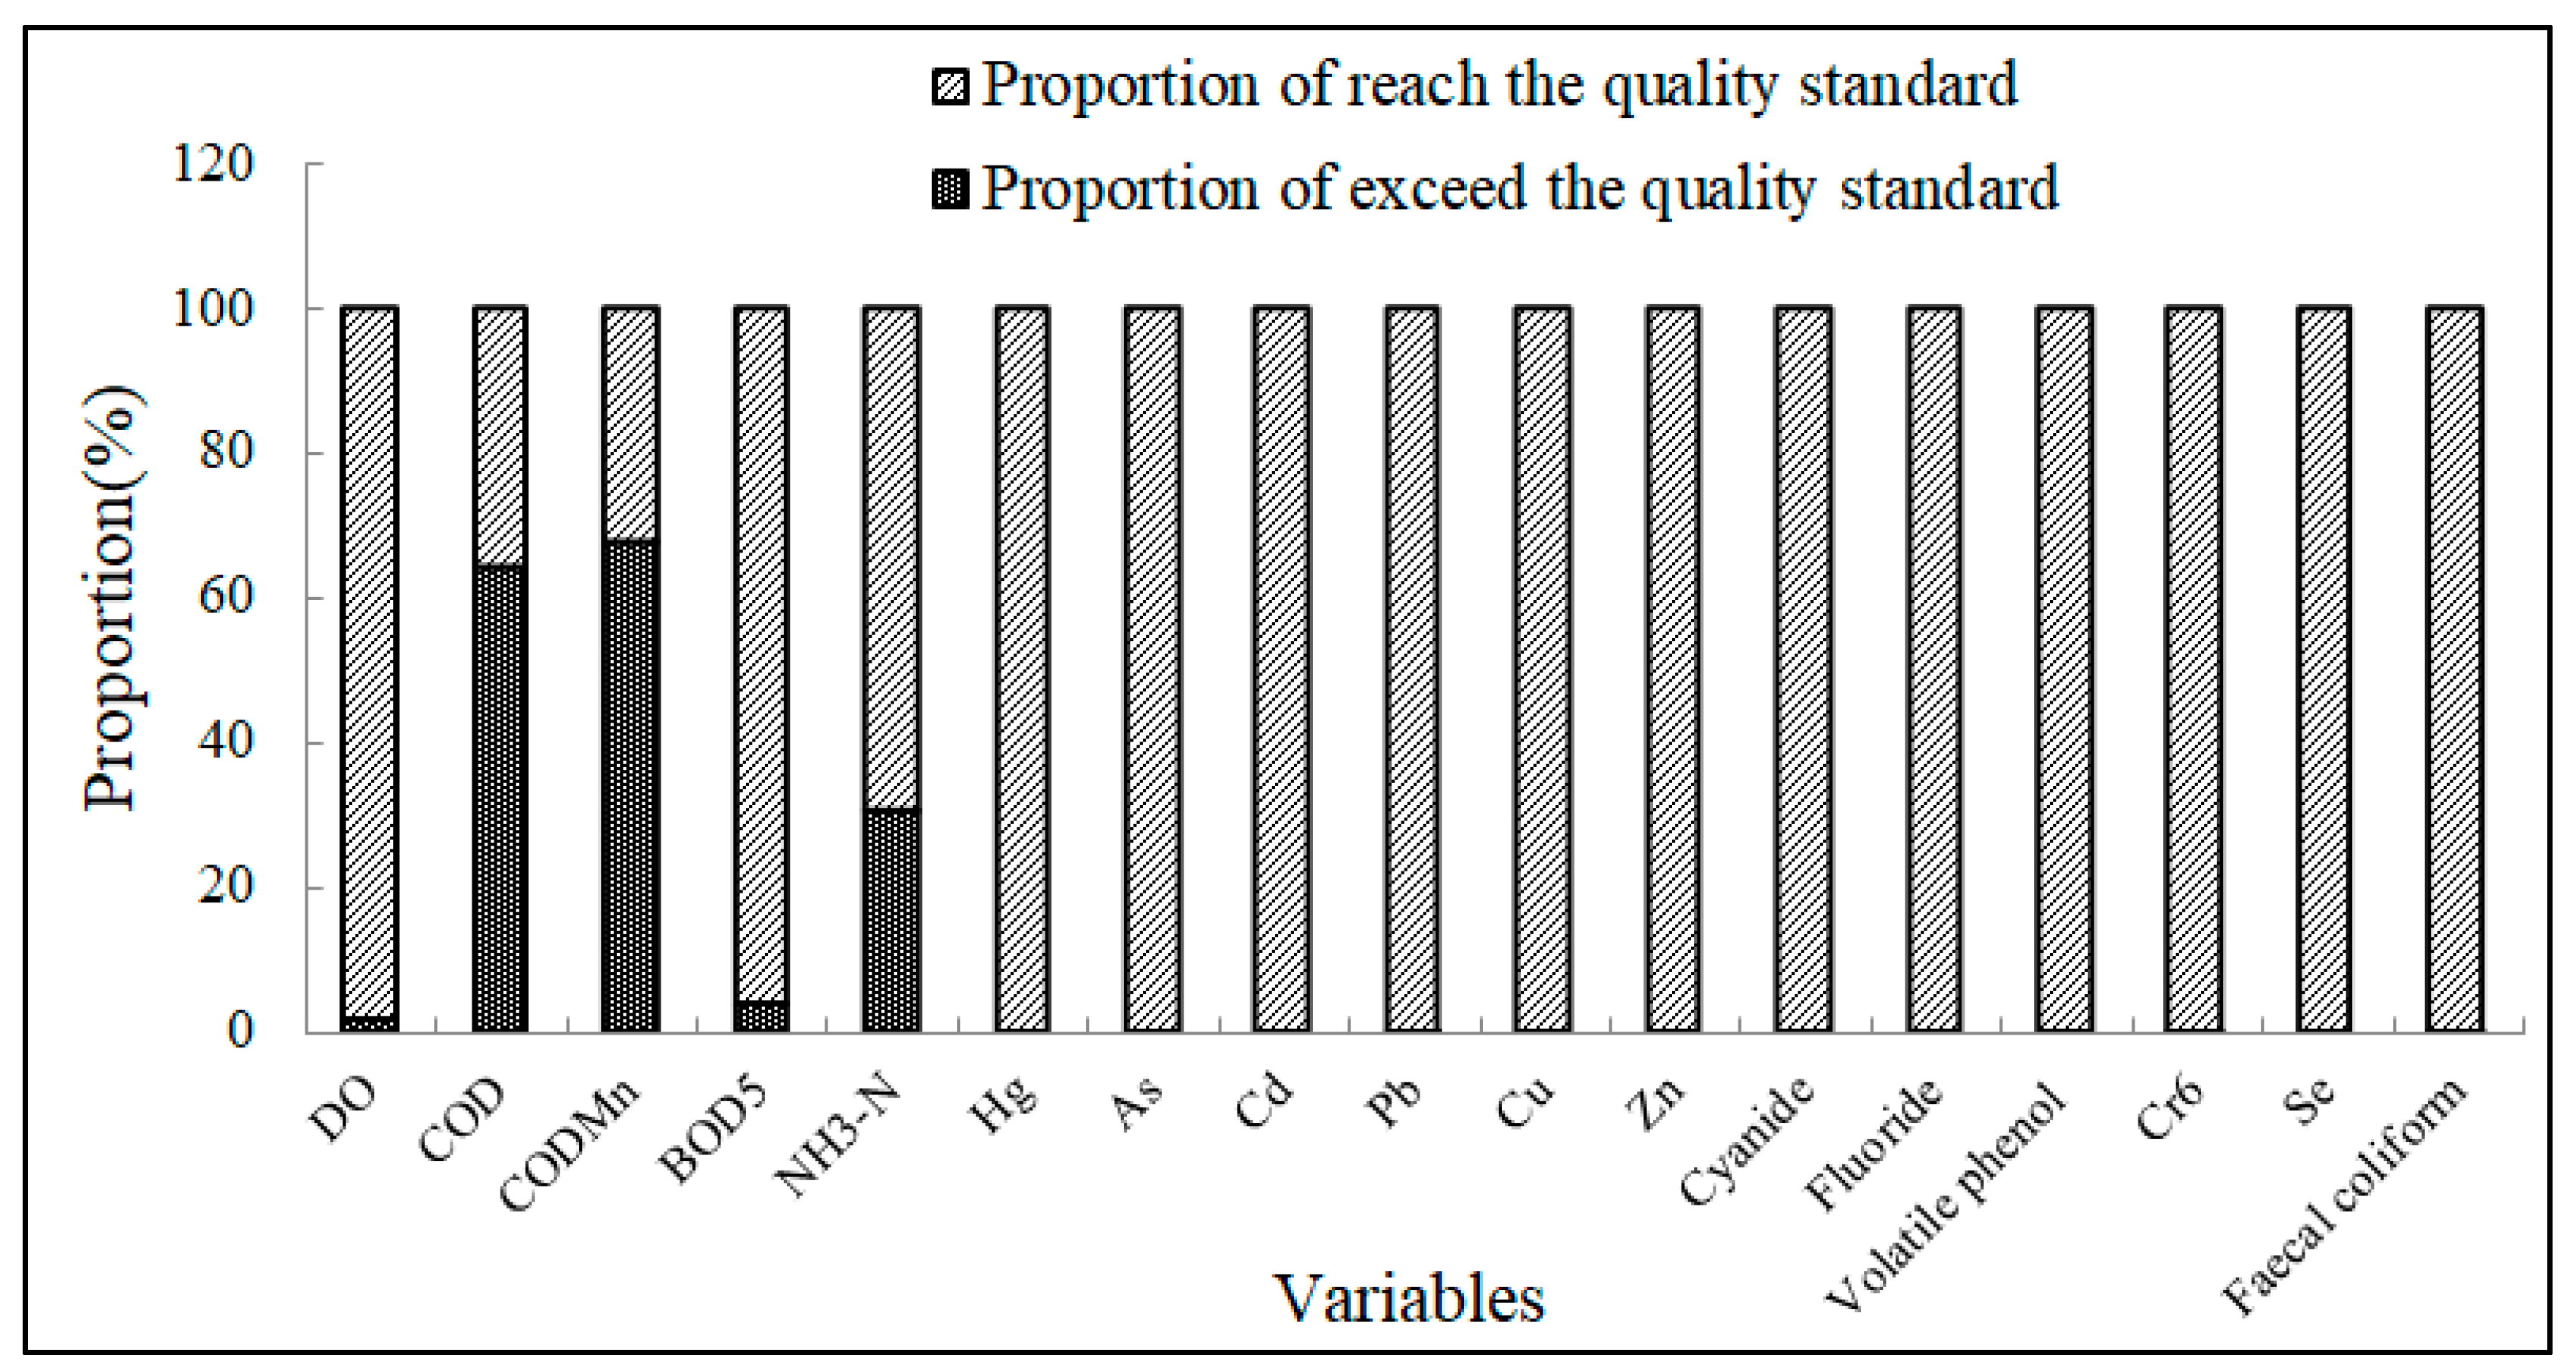
3.2. Characteristic Analysis of Failed Variables

According to the results of the Kruskal-Wallis (K-W) test (Table 3), water quality variables exhibited no significant interannual variations (p > 0.05) except for NH3-N. Three variables exhibited significant spatial variations (p < 0.05). COD, CODMn, and NH3-N varied from 9.5 mg/L (A19) to 30.8 mg/L (A22), 2.7 mg/L (A19) to 11.2 mg/L (A5), and 0.28 mg/L (A10) to 0.77 mg/L (A11). According to the Environmental Quality Standard of Surface Water (ESSW-GB3838-2002), the water quality of the source water reserves corresponds to the second criterion of ESSW (COD < 15 mg/L, CODMn < 4 mg/L, and NH3-N < 0.5 mg/L). However, the rate at which COD exceeded the standard was 64.59% (out of 994 data points, <15 mg/L), that of CODMn was 68% (>4 mg/L), and that of NH3-N was the lowest at 30.68% (>0.5 mg/L).
The relative seasonal average (RMse,s,p) was used to account for the variation of water quality parameters across the seasons. It was found that RMse,s,COD was higher than the annual average (2011–2016) from source water reserves in the wet season (Figure 4). All RMwet,s,COD values remained high, except RMwet,A15,COD and RMwet,A18,COD, and exhibited lower values in the dry season. Furthermore, the annual average values of COD were 24.3 mg/L, 23.8 mg/L, and 22.9 mg/L in May, July, and September, respectively (wet season) and 15.7 mg/L, 15.4 mg/L, and 17.5 mg/L in January, March, and November, respectively (dry season); thus, COD concentration exhibited high variability throughout the year. The seasonal variation in CODMn was similar to that of COD. The range of RMwet,s, CODMn was 0.94–1.44 in the wet season and 0.49–1.16 in the dry season.
The seasonal variation in NH3-N presented a generally similar trend to COD and CODMn. High values of RMse,s,NH3-N occurred in the wet season and low values occurred in the dry season, particularly in July (0.53 mg/L, annual average values) and November (0.4 mg/L, annual average values). In the wet season, seven sample sites (A4, A6, A8, A11, A12, A18, A20) exhibited RMwet,s,NH3-N < 1. Some of the differences between RMse,s,NH3-N and RMwet,s, CODMn and RMwet,s,COD are attributable to different degradation mechanisms of the sources.
The differences in surface water pollutant concentrations between dry and wet seasons can be attributed to rainfall. In the wet season, a large amount of forest humus leaches from the humic layer and drains into the river with surface runoff, increasing pollutant concentrations. In contrast, the river predominantly relies on groundwater recharge in the dry season.
Pollution control and management has been conducted in recent decades in Heilongjiang Province. However, the concentrations of COD, CODMn, and NH3-N exceed the environmental quality standards for surface water. Previous research has proved that dissolved oxygen is opposite to the COD and permanganate index in rivers that are contaminated by human activities [23,24]. However, in this study, pollution in the monitored area is attributable to factors related to the surface runoff of humus in forest soils rather than human activities. Humus is fractionated into humic acid (HA) and fulvic acid (FA) and is difficult to degrade in the natural environment because of its complex structure and high molecular weight [25,26]. Furthermore, its biodegradation and photodegradation are restricted by the specific natural conditions in the region. Heilongjiang Province is characterised as a cool-temperate zone exhibiting a temperate continental monsoon climate, which is rich in rainfall and has a low average temperature. Thus, the concentrations of COD, CODMn, and NH3-N exceed the standard but indicate a higher DO concentration in the surface water.

3.3. Geochemical Background Value

Surface water quality is influenced by both natural and anthropogenic disturbances. Previous research on environmental background values based on monitoring data from the study area obtained the values statistically and ignored the background characteristics of the study area [27,28,29]. Schneider et al. [10] assessed each sampling location in terms of land use and other potential anthropogenic influences on the determined metal background of surface water. However, it is difficult to identify the background area without a clear criterion because true background areas no longer exist due to the development of human society. Herein, background pollution sources and regional characteristics are considered to identify several natural and human factors that have a substantial influence on water quality, and a three-step discriminant method is proposed to identify the background areas (Figure 5).
The background area is relative; although human activities are scarce in the river source zones although there is still a small amount of human activity. Therefore, data were collected in order to understand the regional background properties. The first step is single index recognition, where the index is forced to divide into three categories by cluster analysis. Cluster 1 represents high background properties, cluster 2 represents uncertain regions, and cluster 3 represents the background properties. The second step involves the limiting factor; regions with this factor cannot be regarded as a complete background area. The third step applies the synthetic index. Generally, anthropogenic influences can be inferred intuitively using the land use types of specific regions; i.e., a high correlation between land use and water quality has been reported in previous studies [30,31,32,33,34]. The method is based on the current land use situation and population density. The formula can be defined as:
I = i = 1 n w i y i
where I is the score of the study area; the higher the score, the closer the background area; yi is the normalisation factor, wi is the relative weight of the factor, which is determined by an analytic hierarchy process (Figure 6), and n is the number of factors.
The results of the three-step discrimination are presented in Table 4. In single index recognition, a study area with poor background properties cannot be considered as a complete background area. According to the limiting factor, a study area with a value of five (land area for industrial and mining construction), six (sewage outlet), or seven (location of district and county governments), cannot be a complete background area. According to the synthetic index, an area with a score below the threshold of the study area cannot be considered as a complete background area. Therefore, the intersection of remaining subsets represents the complete background area in the present study. However, no specific methods exist for determining the threshold value from the score for defining background areas, above which the impact of human activity on water quality can be ignored. This study used the average of the comprehensive evaluation scores from 22 source water reserves to determine the threshold value due to reserves with low development intensity. The threshold value was therefore defined as 0.76. Finally, A1-2, A7-10, A12, A15, and A20-21 were defined as background areas where the effect of anthropogenic activity on water quality can be ignored.
Determining the regional background values of contaminants is essential for environmental assessment and control [35,36]. Background values are usually thought to represent the concentration range of a chemical index in a certain media and can be difficult to determine because of multiple and nonpoint sources or because they are reactive in the environment [37,38]. However, in this study, contaminants in the background area are derived from single natural sources. The iterative 2σ-technique was therefore used to determine a plausible and realistic range. A total of 58 sampling sites were used in the upstream areas of the background area with minimal human activity and few reaction contaminants from the natural environment. The sites were used to determine background values by water quality monitoring between March and October 2017. The range of variables is shown in Figure 7. Based on the iterative 2σ-technique, descriptive statistical analysis was performed and water quality background ranges were calculated for wet and dry seasons. The average concentrations (range) of COD, CODMn, and NH3-N were 14.8 (5–55) mg/L, 4.5 (1.1–21.1) mg/L, and 0.33 (0.03–1.26) mg/L in the dry season (March–October), respectively, and 8.7 (5.0–12.6) mg/L, 28.3 (10–74) mg/L, 7.8 (2.2–3) mg/L, and 0.50 (0.03–1.49) mg/L in the wet season (April–September), respectively.
The concentration range of background pollutants in the wet season was higher than that in the dry season. A possible reason could be that rain is abundant and humus in the soil and litter is likely to become runoff into the river in the wet season, increasing the concentration of contaminants [39,40,41]. In contrast, the river was recharged with groundwater instead of runoff in the dry season. Therefore, this research elucidates the background contaminant values of surface water in source water reserves and provides scientific evidence for water quality management and water pollution control.

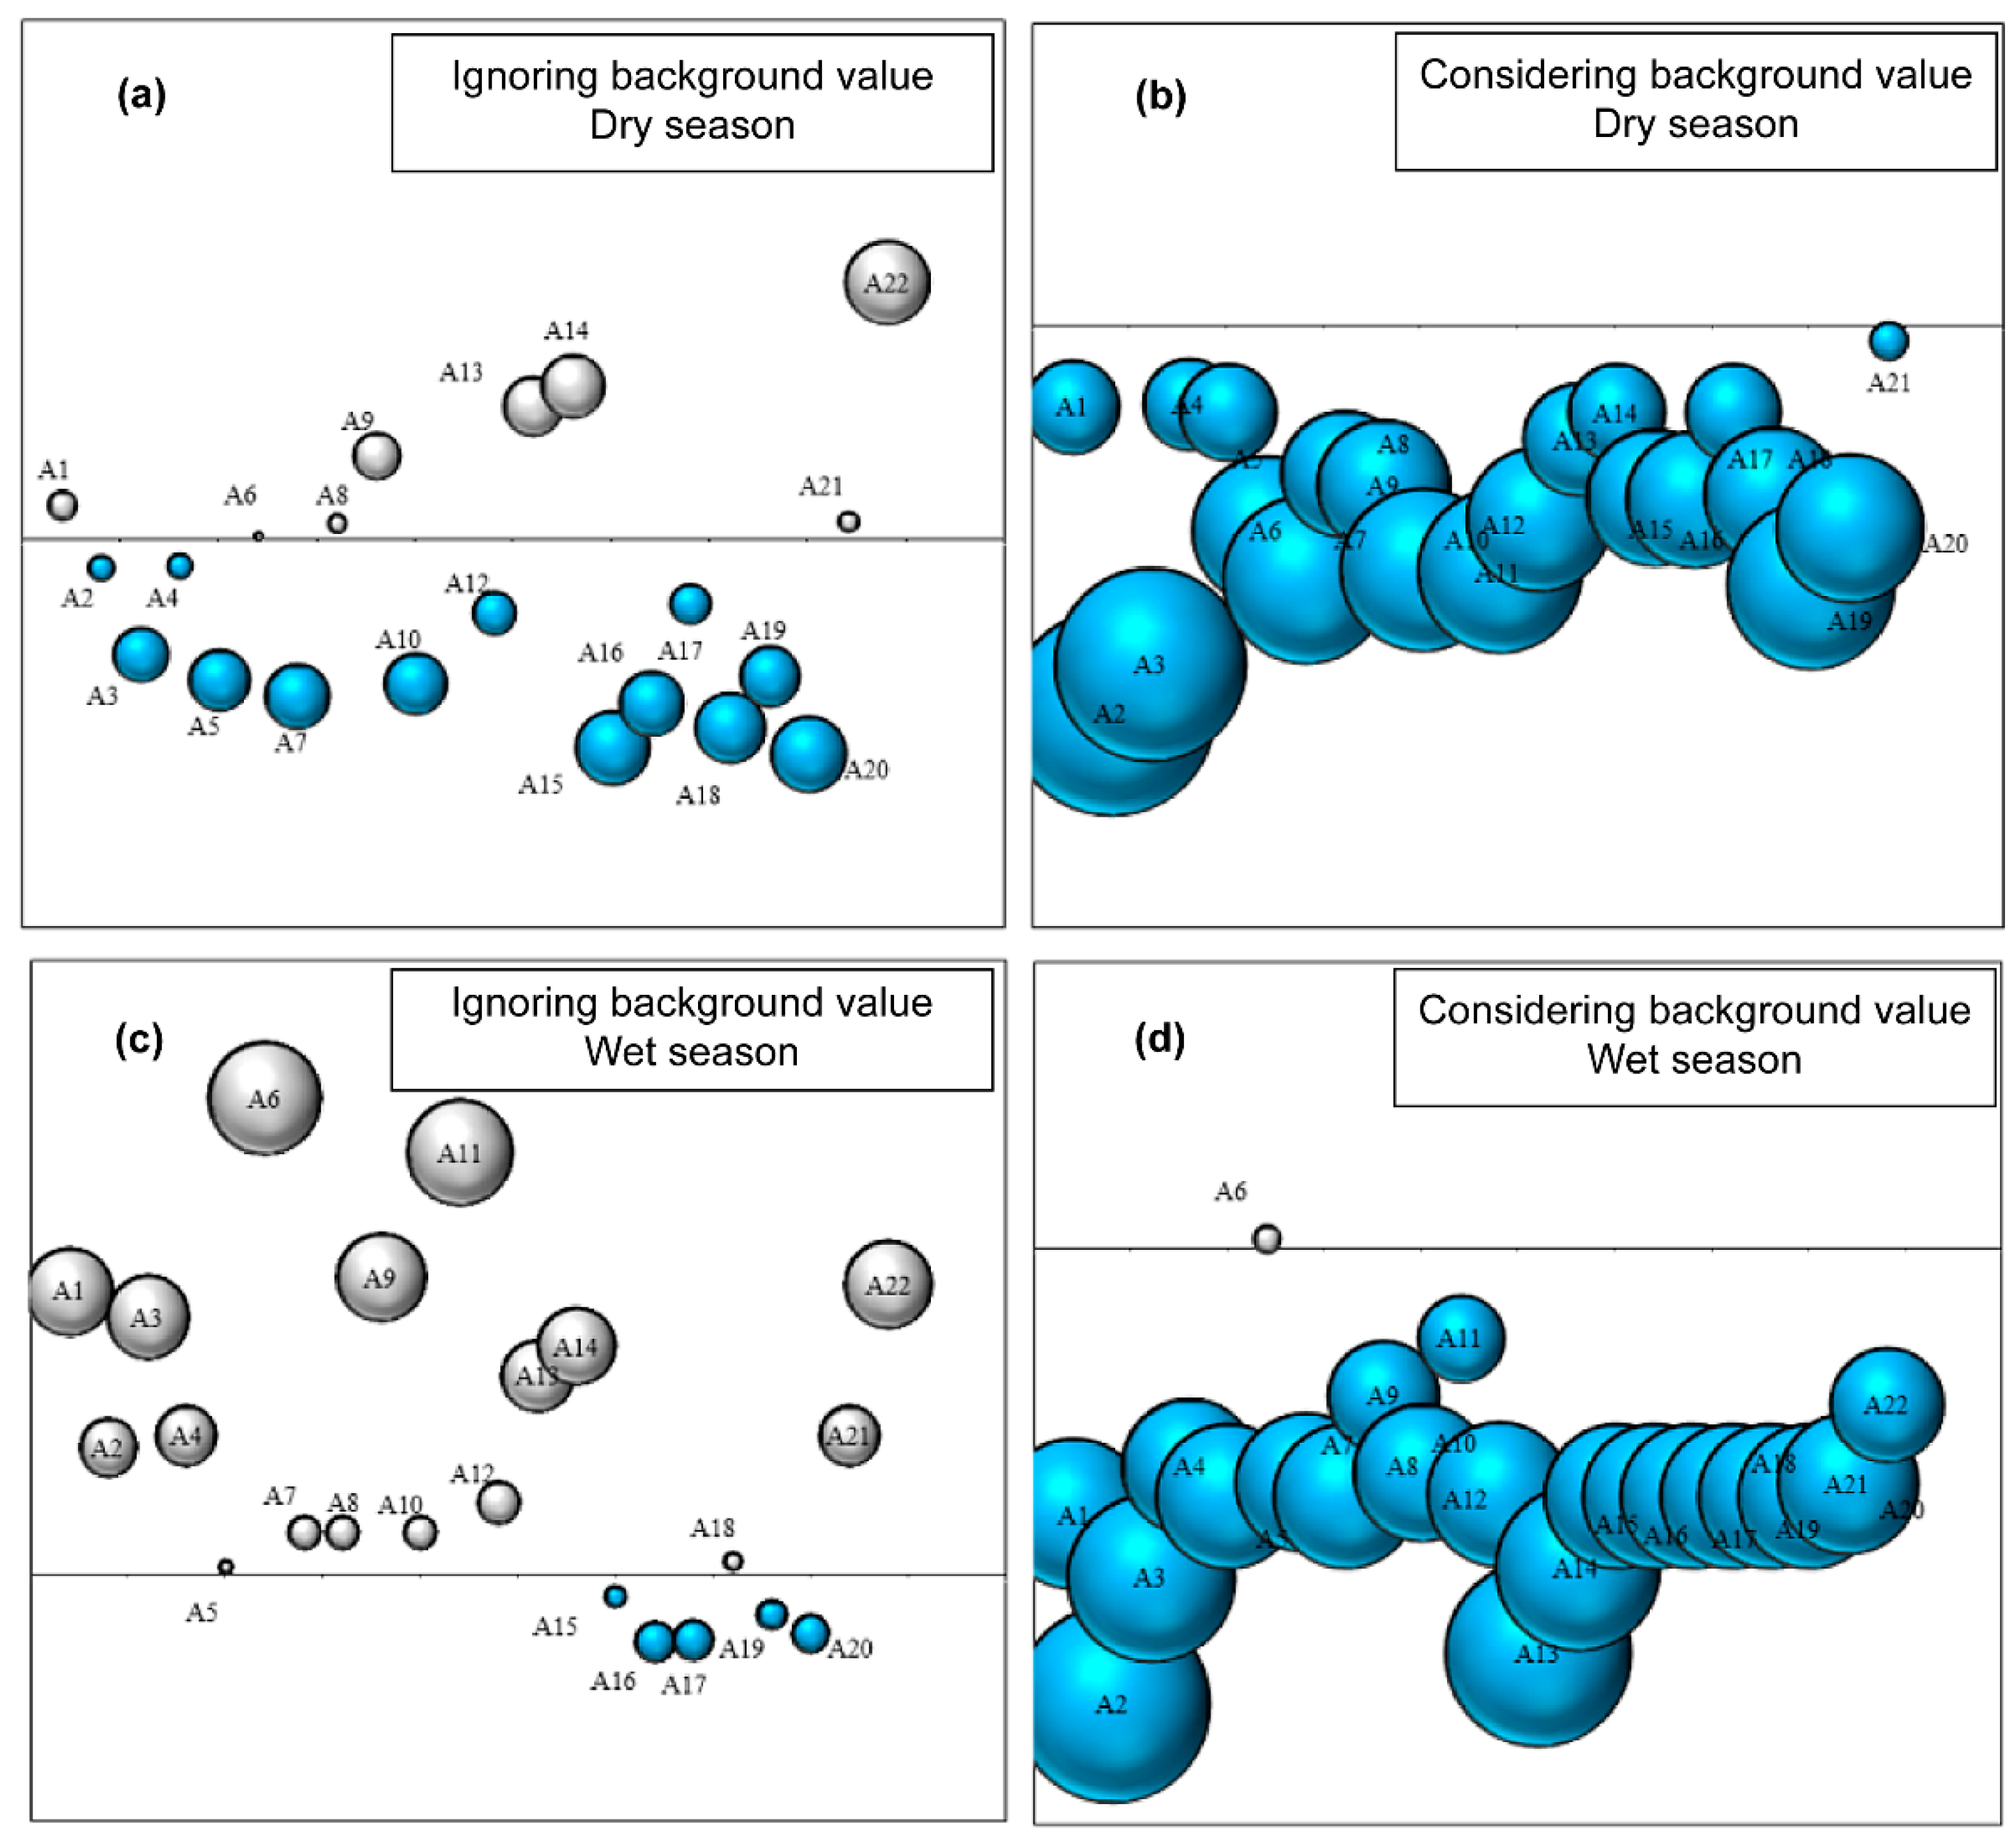
3.4. Evaluation Method Considering Background Values

Variable standard values prescribed by GB3838-2002 were deducted from the monitoring data to reflect the pollution degree. Figure 8 shows the process for calculating the degree to which values exceed the standard. Figure 9 shows the pollution degree in 22 source water reserves throughout 2017 both ignoring and considering the background values. For water management purposes, the result ignoring the background value cannot objectively reflect the impact of human activities on water quality; i.e., it is not appropriate to use the same standard to assess the surface water pollution degree from human activities in river source water environment function zones that are more affected by background pollutants and those that are less affected by background pollutants or contain no background pollutants. Notably, although the environmental quality standard for surface water (GB3838-2002), technological regulations for surface water resources quality assessment (SL395-2007), and technological schemes for water quality assessment of water quality standards for water environment function zones of major rivers and lakes (2012) have mentioned background values, these documents have not described how these values can be determined and applied. Based on the results of this study, a surface water quality evaluation method is proposed that considers geochemical background values. This evaluation should be conducted after deducting the background mean value from the monitoring value. Thus, after background values for the dry and wet periods were deducted, a monthly water quality assessment of each basin was performed (Figure 9). The evaluation results objectively reflect the natural environment rather than the influence of human activities. As river water quality evaluations provide key scientific guidance for water management, the background value should be considered when evaluating water quality.

4. Conclusions

The present work focused on the systematic determination and application of surface water background values in Heilongjiang Province. The proposed method was found to be applicable to river headwater areas with minimal human activities and clear sources of background pollutants, and was therefore concluded to provide a scientific basis for the analysis of specific areas rather than lumping together water quality management. The main conclusions can be summarised as follows:
(1)
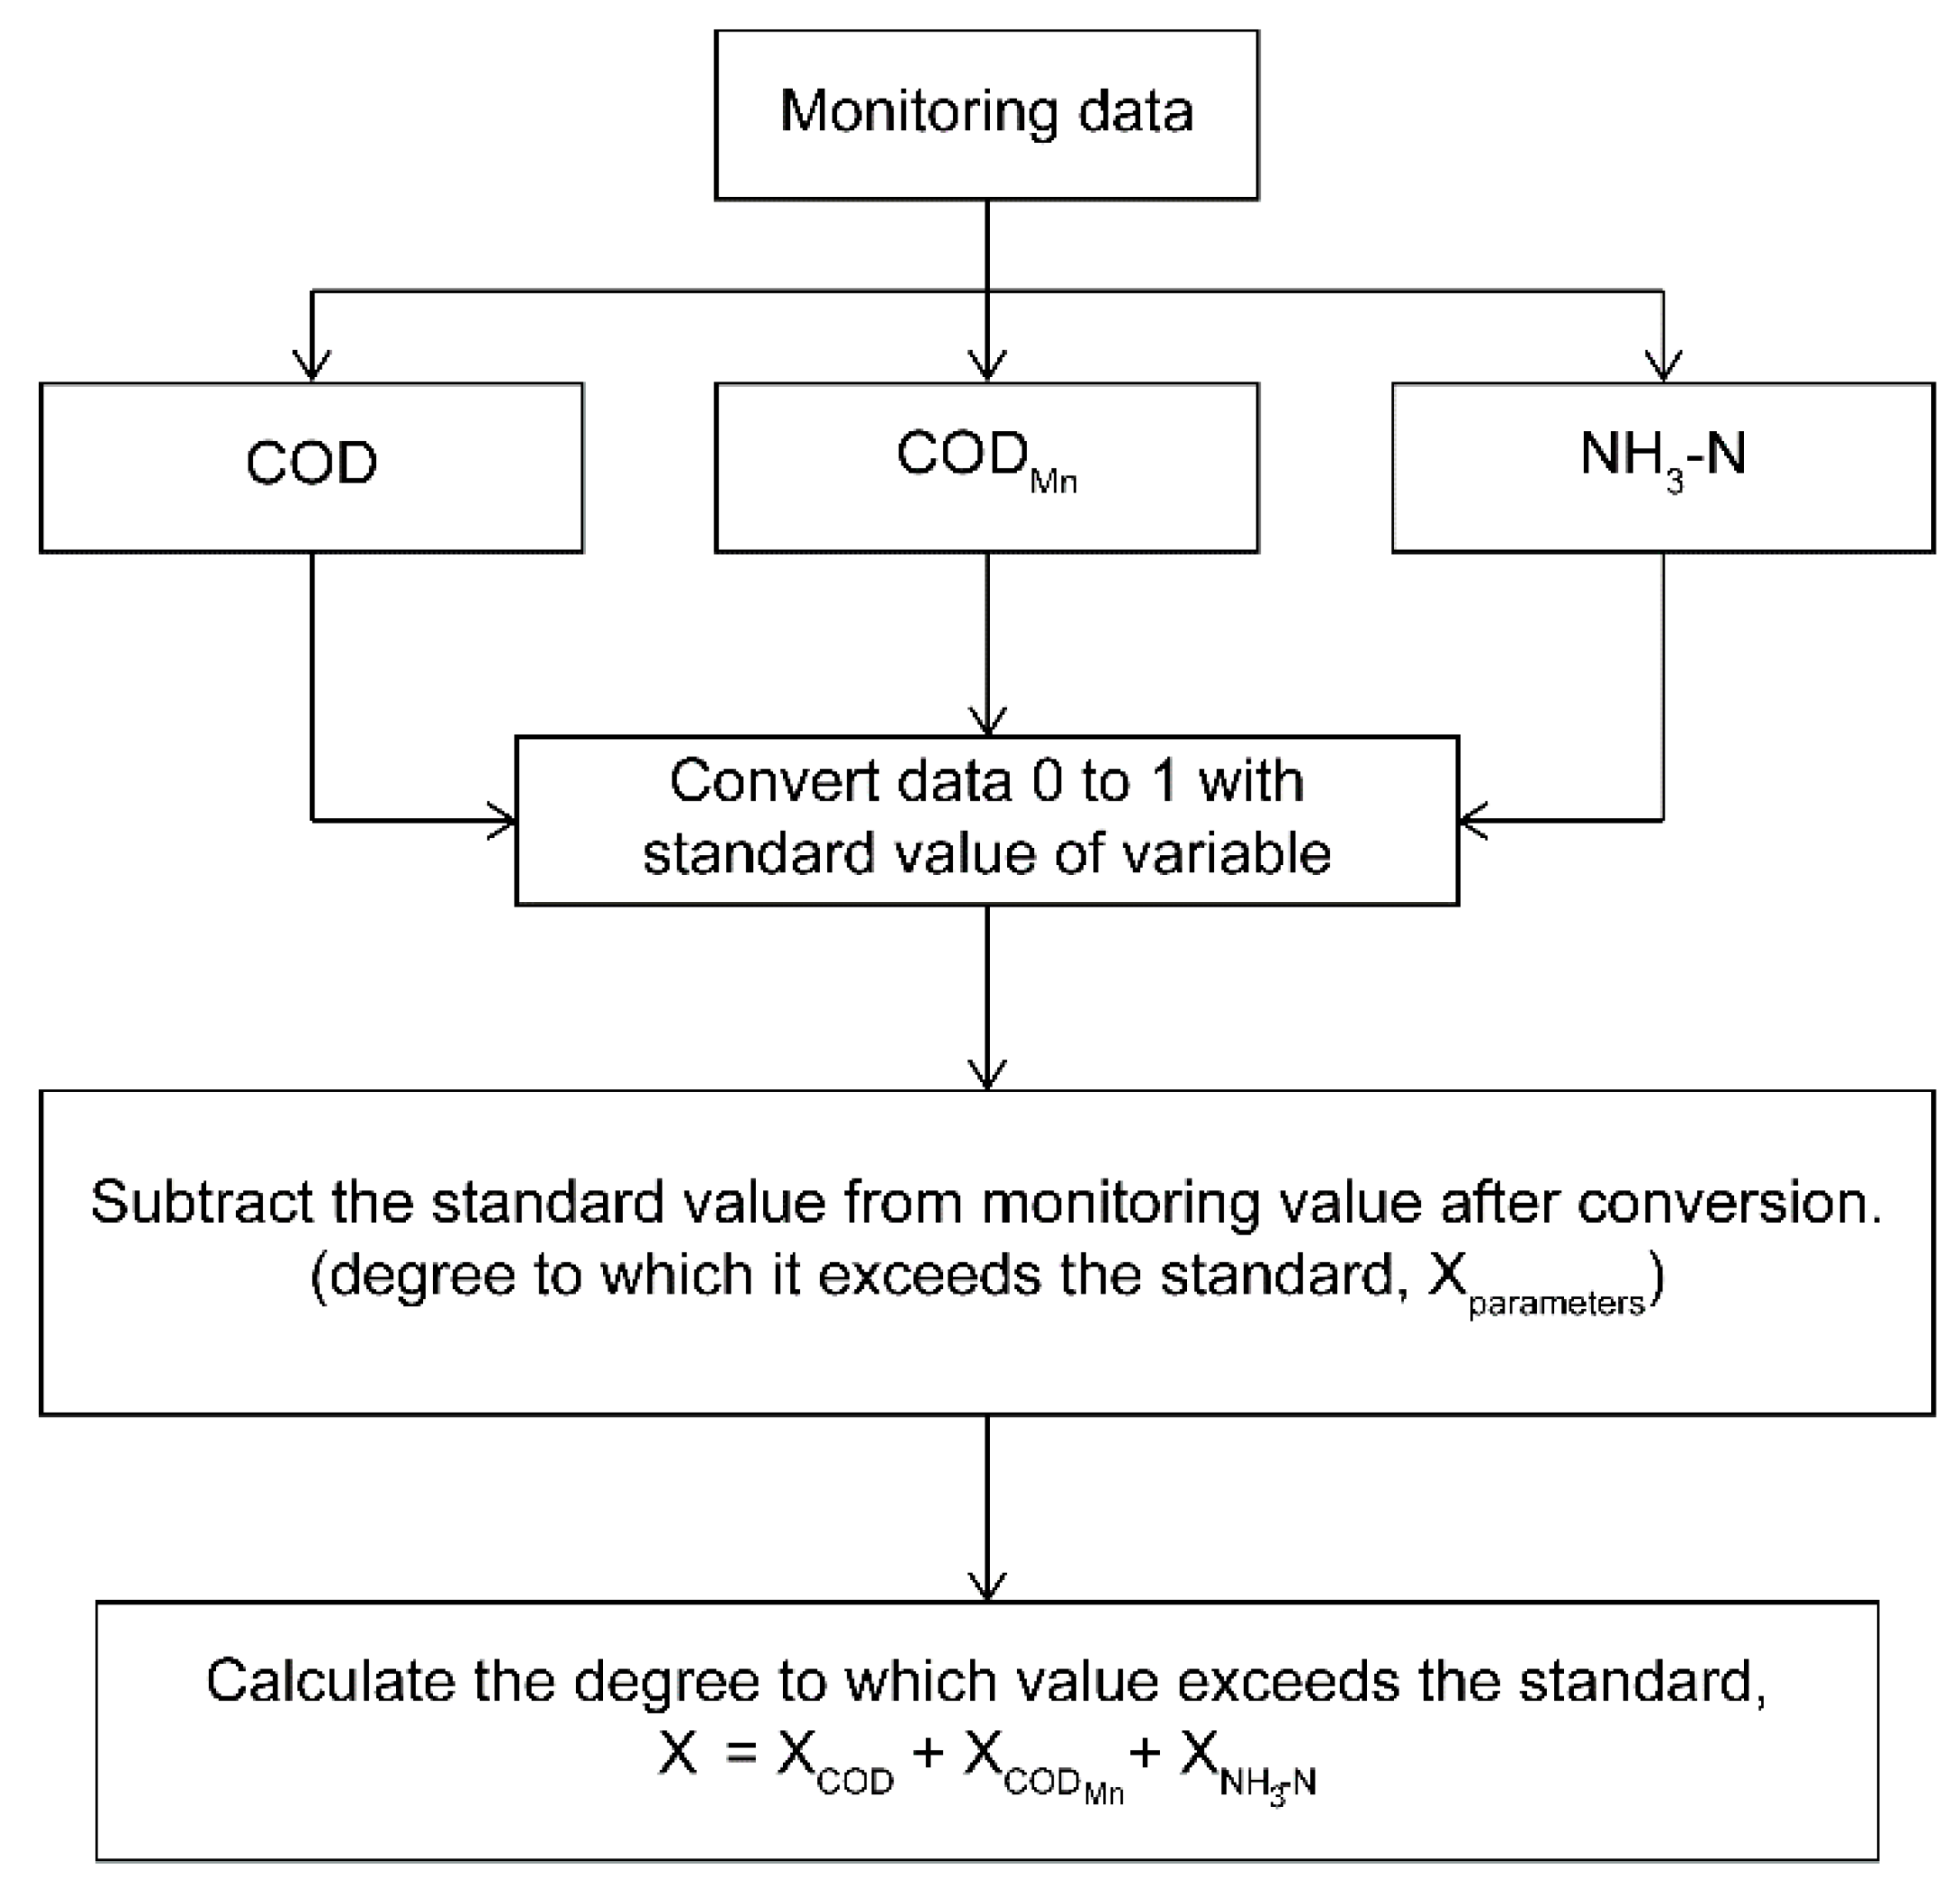
Based on research conducted between 2011 and 2016, the key background pollutants (COD, CODMn, NH3-N) were identified for river source water environment function zones in Heilongjiang Province.
(2)
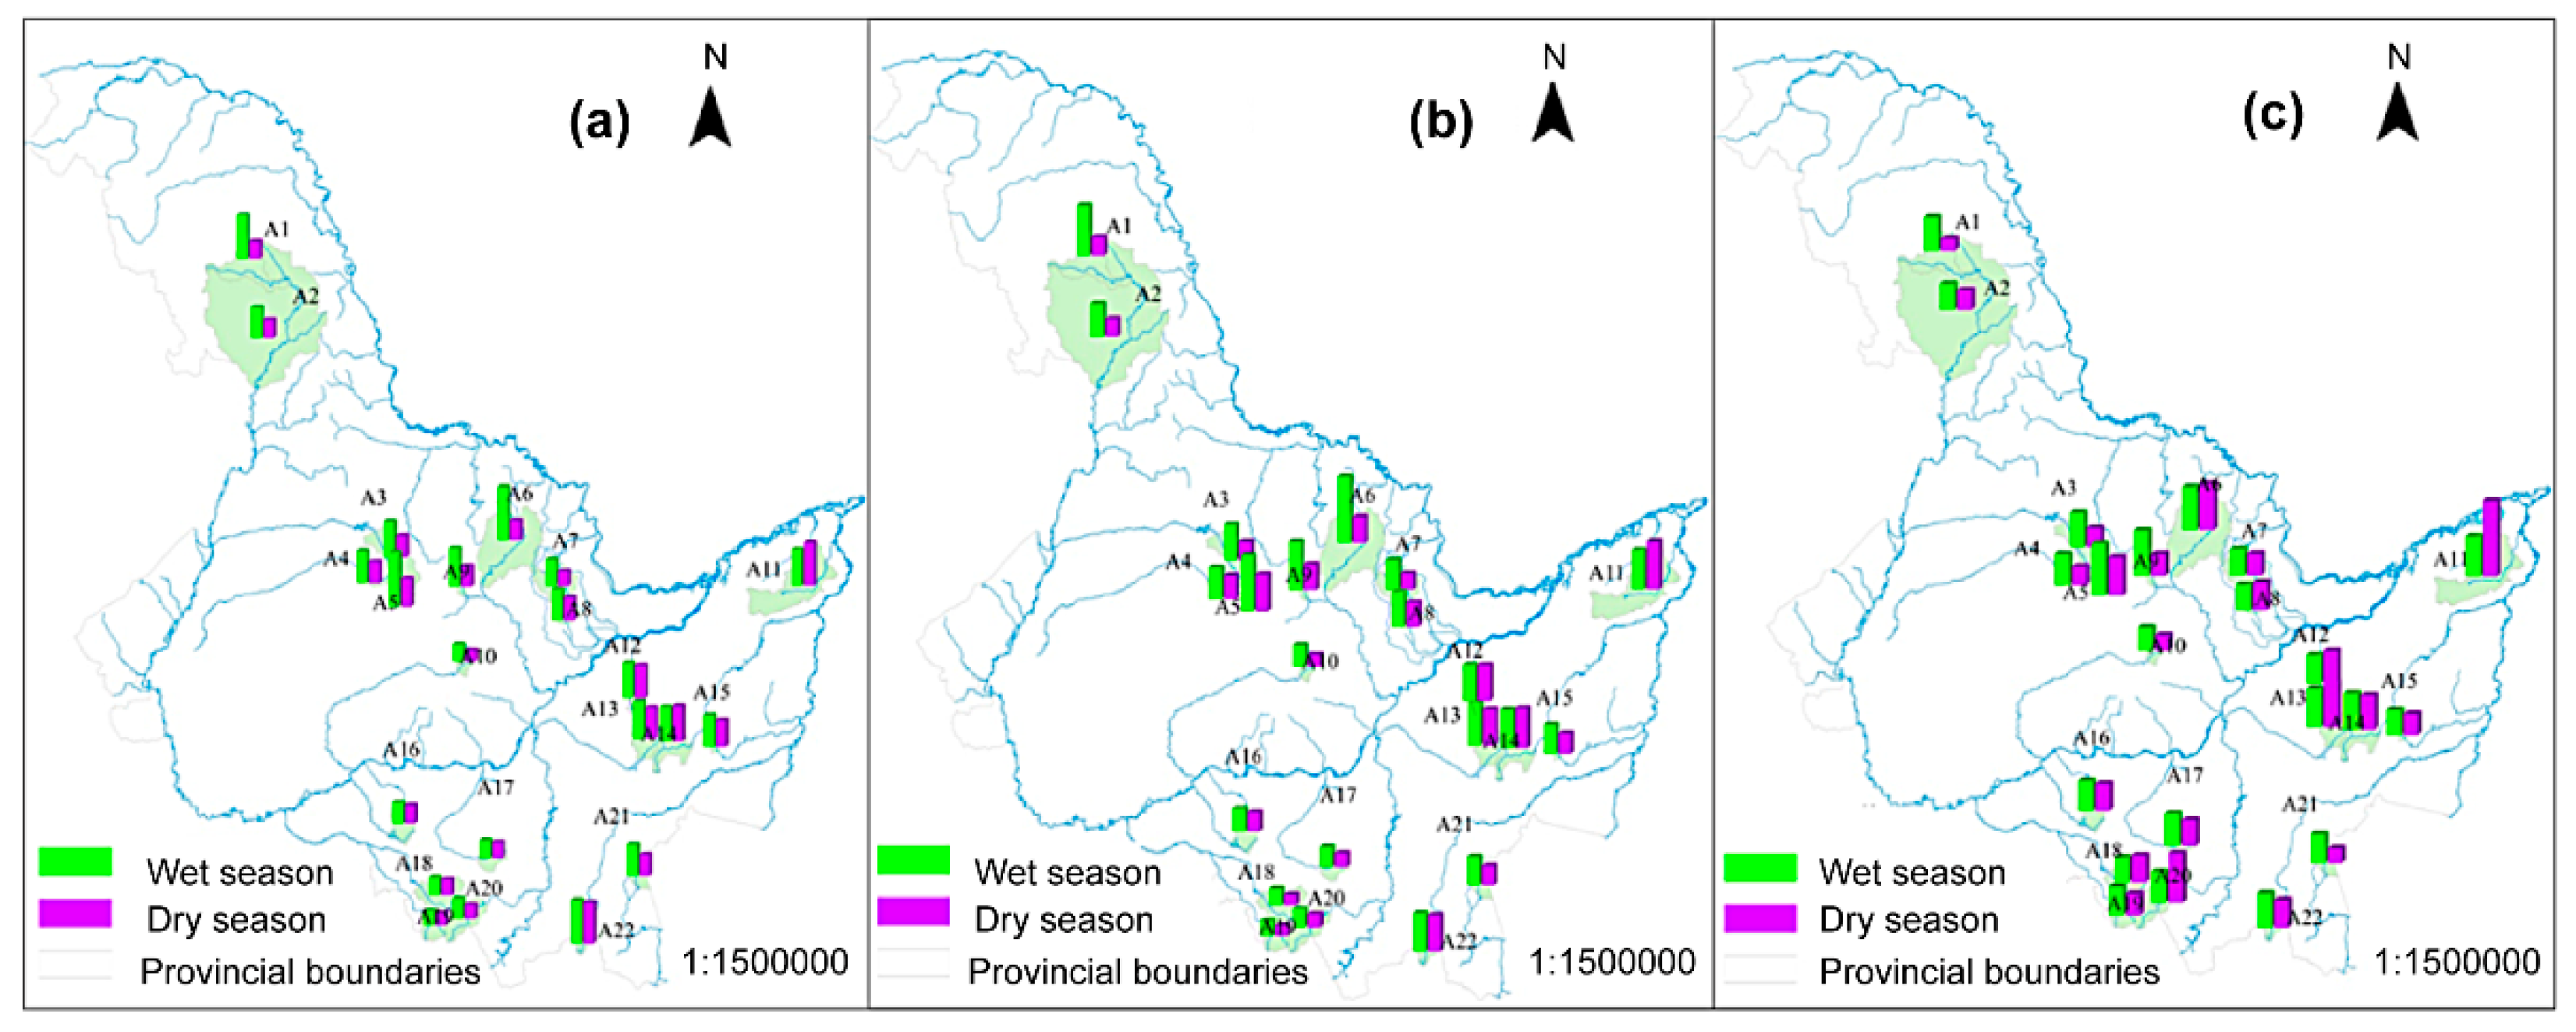
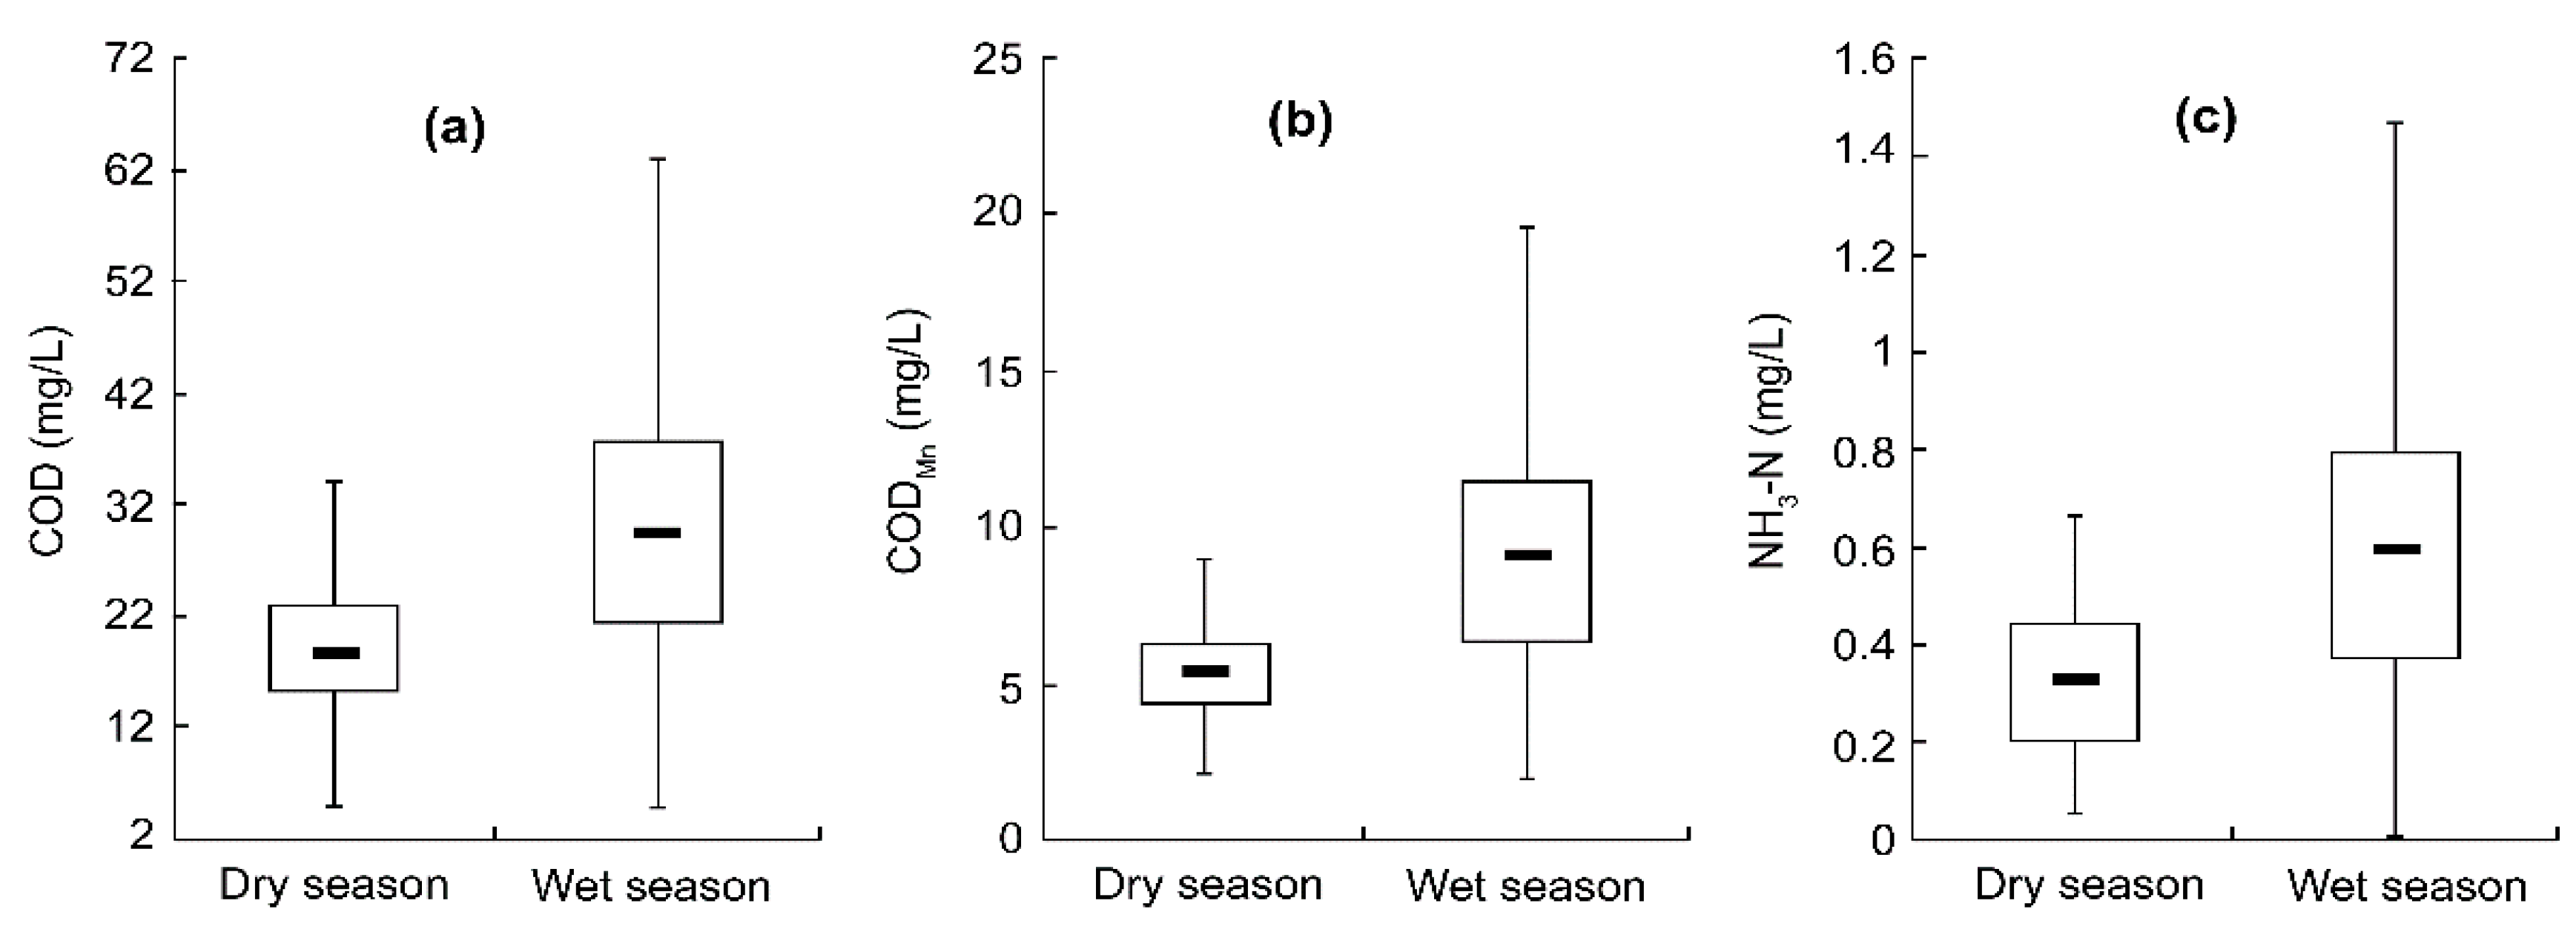
Spatial and temporal variations of background pollutants were analysed, and the obtained relative seasonal averages (RMse,s,p) indicated that concentrations of background pollutants in surface water were higher in the wet season than in the dry season.
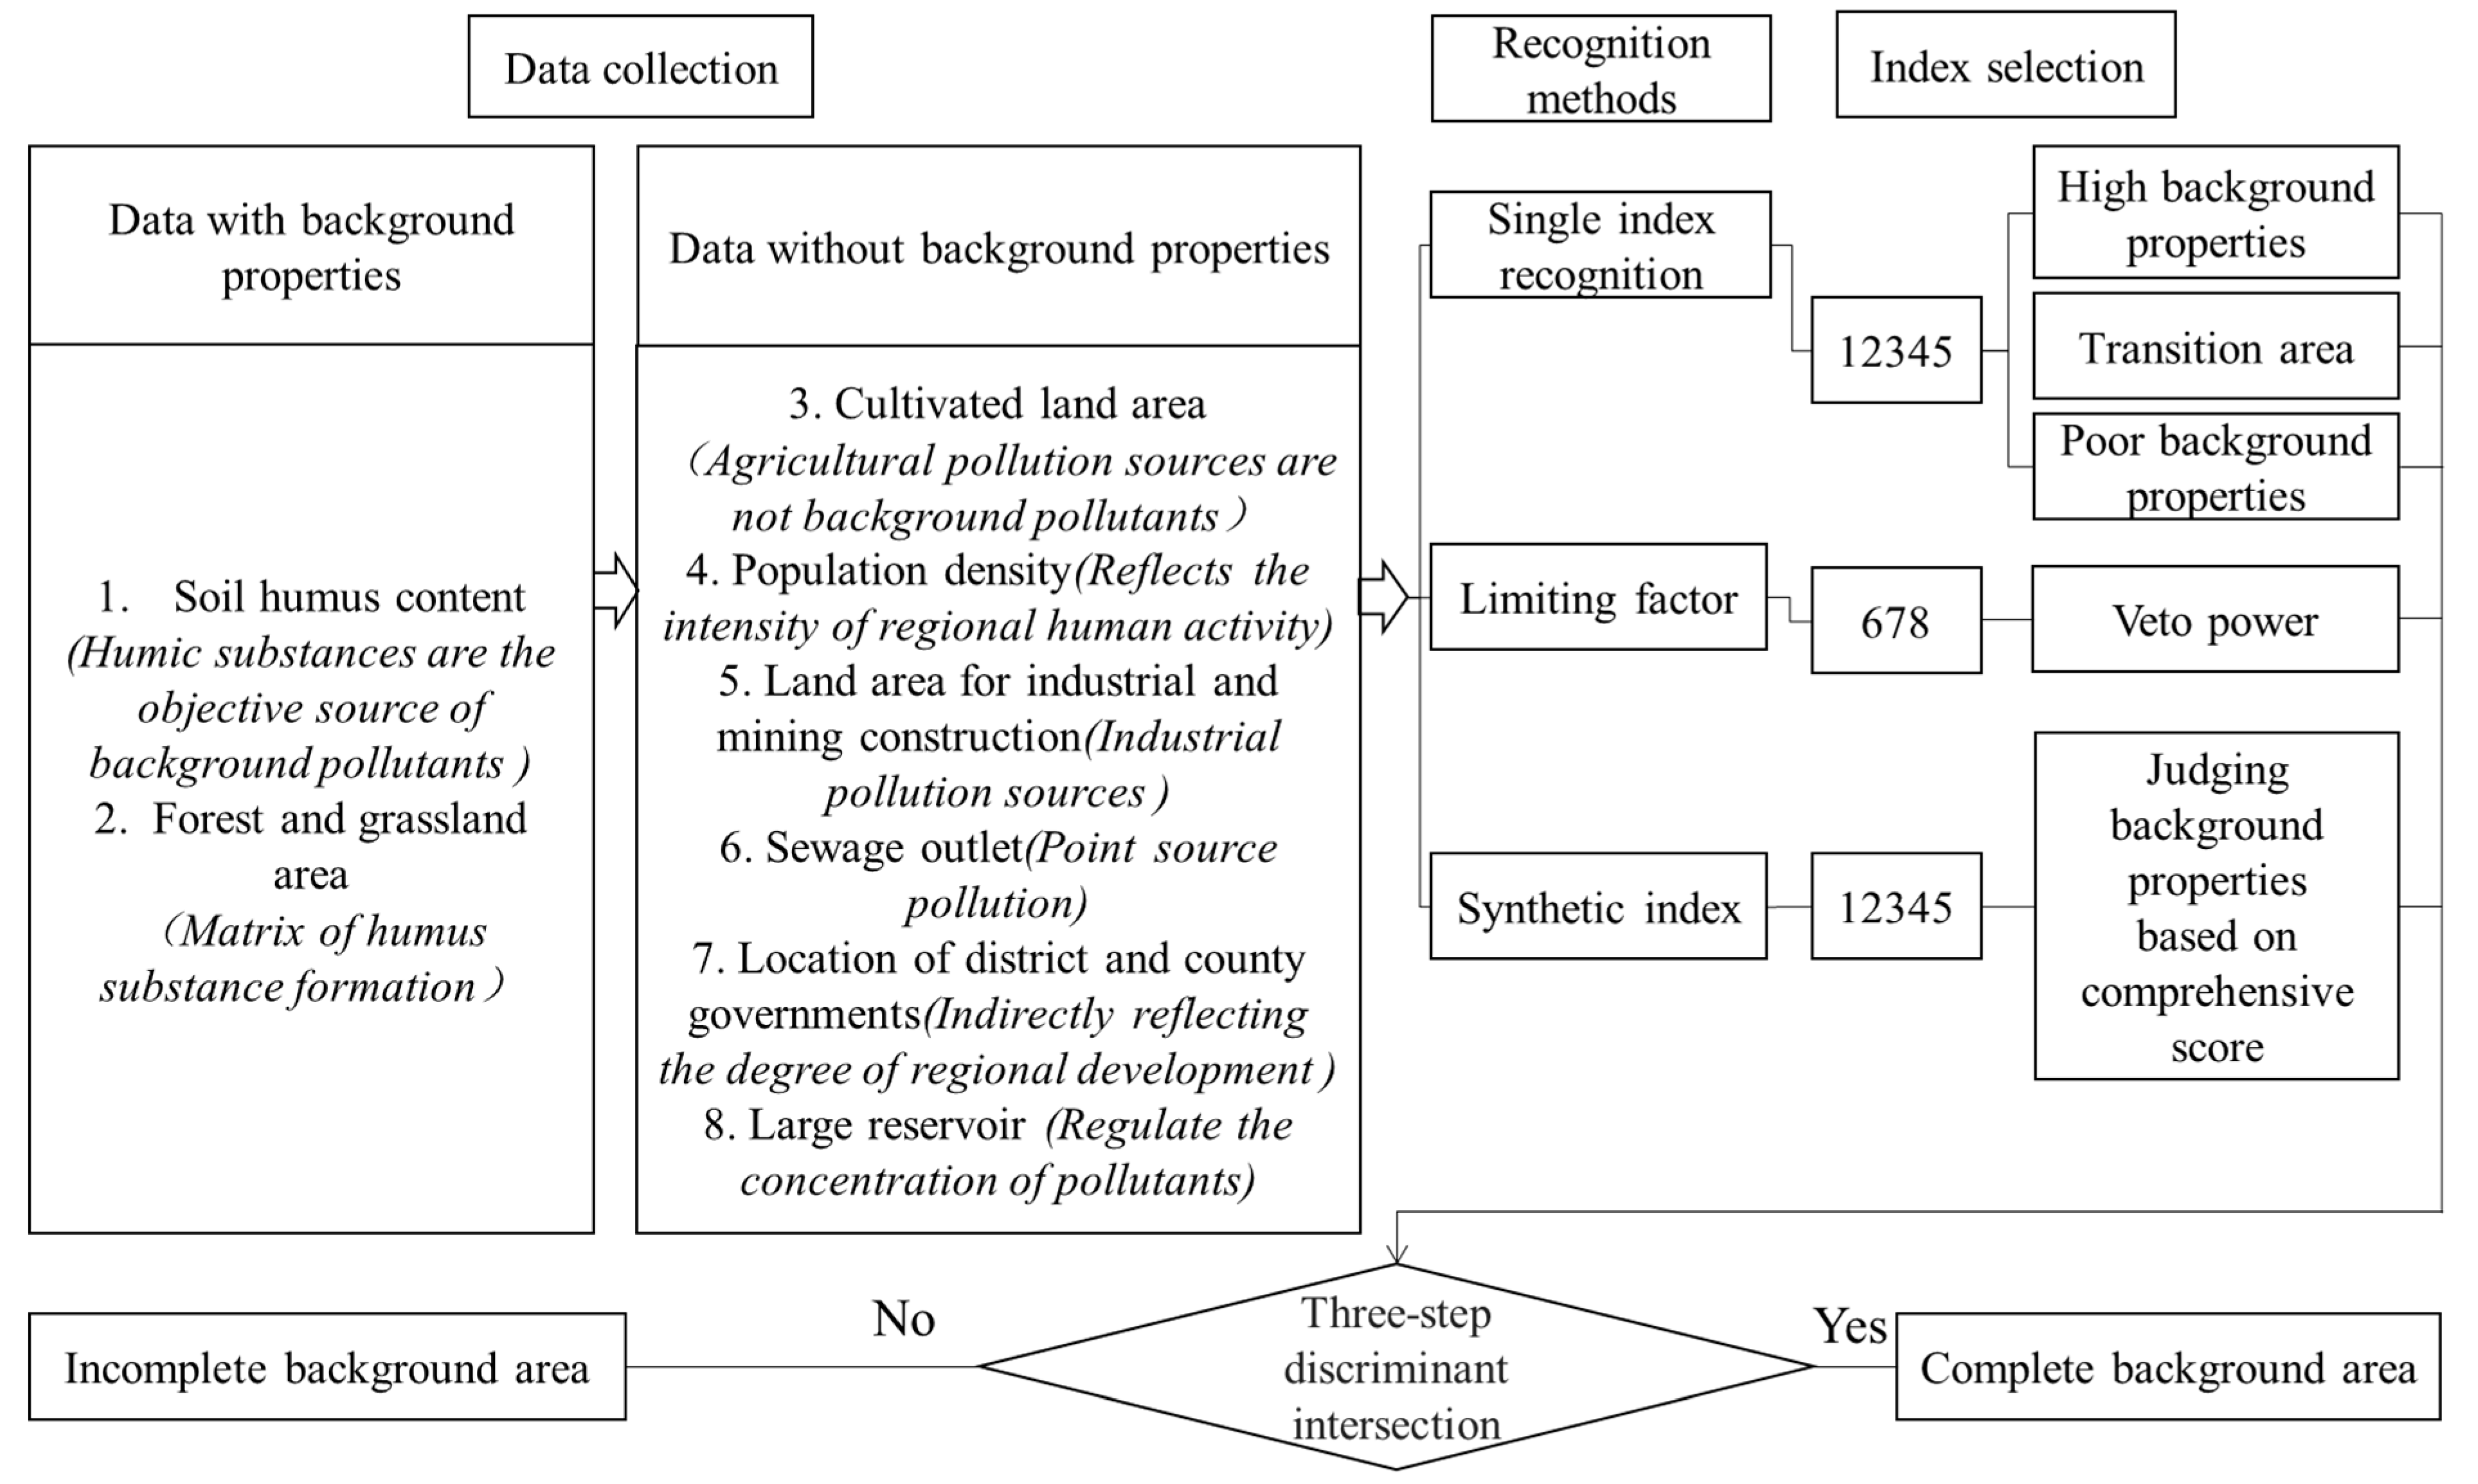
(3)
A three-step discriminant method was first proposed to identify the background area for determining pollutant background values.
(4)
Based on the iterative 2σ-technique, descriptive statistics and the range of water quality background values in the wet and dry seasons were calculated for the 22 source water reserves in 2017. In contrast to the evaluation results obtained by considering background values, those that ignored background values could not objectively reflect the effect of human activities on water quality.
Our research cannot be considered universal. For example, in desert areas, factors affecting background area identification should be reconsidered. Moreover, intensive human activities make it difficult to identify background areas. However, this study is expected to be helpful for the water quality assessment in Heilongjiang Province and for the improvement of China’s water resource management system.

Author Contributions

W.P. provided overall guidance; X.D. and S.Z. analysed the data; L.Y. contributed analysis tools; M.D. wrote the paper.

Funding

This work was jointly supported by the IWHR Research and Development Support Program (Grant No. WE0145B052017).

Conflicts of Interest

The authors declare no conflict of interest.

References

  1. Campos, M.L.; Pierangeli, M.A.P.; Guilherme, L.R.G.; Curi, N. Baseline concentration of heavy metals in Brazilian Latosols. Commun. Soil Sci. Plant. Anal. 2003, 34, 547–557. [Google Scholar] [CrossRef]
  2. Darnley, A.G.; Björklund, A.; Bolviken, B.; Gustavsson, N.; Koval, P.V.; Plant, J.A.; Steenfelt, A.; Tauchid, M.; Xie, X. A Global Geochemical Database for Environmental and Resource Management. Recommendations for International Geochemical Mapping; Final Report of IGCP Project 259; UNESCO Publishing: Paris, France, 1995. [Google Scholar]
  3. Matschulla, J.; Höfle, S.; da Silva, J.; Mello, J.; Melo, G.; Pleßow, A.; Reimann, C. A soil geochemical background for northeastern Brazil. Geochem. Explor. Environ. Anal. 2012, 12, 197–209. [Google Scholar] [CrossRef]
  4. Gałuszka, A.; Migaszewski, Z.; Duczmal-Czernikiewicz, A.; Dołegowska, S. Geochemical background of potentially toxic trace elements in reclaimed soils of the abandoned pyrite–uranium mine (south-central Poland). Int. J. Environ. Sci. Technol. 2016, 13, 2649–2662. [Google Scholar] [CrossRef]
  5. Hawkes, H.E.; Webb, J.E. Geochemistry in Mineral. Exploration; Harper: New York, NY, USA, 1962. [Google Scholar]
  6. Reimann, C.; de Caritat, P. Distinguishing between natural and anthropogenic sources for elements in the environment: Regional geochemical surveys versus enrichment factors. Sci. Total Environ. 2005, 337, 91–107. [Google Scholar] [CrossRef]
  7. Armiento, G.; Cremisini, C.; Nardi, E.; Pacifico, R. High geochemical background of potentially harmful elements in soils and sediments: Implications for the remediation of contaminated sites. Chem. Ecol. 2011, 27, 131–141. [Google Scholar] [CrossRef]
  8. Dung, T.T.T.; Cappuyns, V.; Swennen, R.; Ky Phung, N. From geochemical background determination to pollution assessment of heavy metals in sediments and soils. Rev. Environ. Sci. Biotechnol. 2013, 12, 335–353. [Google Scholar] [CrossRef]
  9. Karim, Z.; Qureshi, B.A.; Mumtaz, M. Geochemical baseline determination and pollution assessment of heavy metals in urban soils of Karachi, Pakistan. Ecol. Indic. 2015, 48, 358–364. [Google Scholar] [CrossRef]
  10. Petra, S.; Ulf, N.; Nicole, G. Determination of the geogenic metal background in surface water: Benchmarking methodology for the rivers of Saxony-Anhalt, Germany. Water 2017, 9, 75–92. [Google Scholar]
  11. Fisher, S.G. Organic matter processing by a stream-segment ecosystem: Fort River. Massachusetts, U.S.A. Int. Rev. Hydrobiol. 2015, 62, 701–727. [Google Scholar] [CrossRef]
  12. Hedges, J.I.; Turin, H.; Ertel, J.R. Sources and distributions of sedimentary organic matter in the Columbia River drainage basin, Washington and Oregon. Limnol. Oceanogr. 1984, 29, 35–46. [Google Scholar] [CrossRef]
  13. Xu, H.; Guo, L. Molecular size-dependent abundance and composition of dissolved organic matter in river, lake and sea waters. Water Res. 2017, 117, 115–126. [Google Scholar] [CrossRef]
  14. Sinclair, A.J. Selection of threshold values in geochemical data using probability graphs. J. Geochem. Explor. 1974, 3, 129–149. [Google Scholar] [CrossRef]
  15. Nakic, Z.; Posavec, K.; Bacani, A. A visual basic spreadsheet macro for geochemical background analysis. Groundwater 2007, 45, 642–647. [Google Scholar] [CrossRef]
  16. CCME. Canadian water quality guidelines for the protection of aquatic life: CCME Water Quality Index 1.0, Technical Report. In Canadian Environmental Quality Guidelines; Canadian Council of Ministers of the Environment: Winnipeg, MB, Canada, 1999. [Google Scholar]
  17. CCME. Behavioural Study and Sensitivity Analysis. Statistics Canada, Ottawa. Available online: http://www.statcan.gc.ca/pub/16-001-m/16-001-m2007003-eng.htm (accessed on 29 July 2011).
  18. De Rosemond, S.; Duro, D.C.; Dubé, M. Comparative analysis of regional water quality in Canada using the Water Quality Index. Environ. Monit. Assess. 2009, 156, 223–240. [Google Scholar] [CrossRef] [PubMed]
  19. Hurley, T.; Sadiq, R.; Mazumder, A. Adaptation and evaluation of the Canadian Council of Ministers of the Environment Water Quality Index (CCME WQI) for use as an effective tool to characterize drinking source water quality. Water Res. 2012, 46, 3544–3552. [Google Scholar] [CrossRef]
  20. Khan, A.A.; Paterson, R.; Khan, H. Modification and application of the Canadian Council of Ministers of the Environment Water Quality Index (CCME WQI) for the communication of drinking water quality data in Newfoundland and Labrador. Water Qual. Res. J. Can. 2004, 39, 285–293. [Google Scholar] [CrossRef]
  21. Lumb, A.; Halliwell, D.; Sharma, T. Application of the CCME Water Quality Index to monitor water quality: A case of the Mackenzie River Basin, Canada. Environ. Monit. Assess. 2006, 113, 411–429. [Google Scholar] [CrossRef] [PubMed]
  22. Li, B.; Yang, G.; Wan, R.; Zhang, Y.; Wang, R.R.; Zhang, Y.H.; Dai, X.; Chen, Y.W. Spatiotemporal variability in the water quality of Poyang Lake and its associated responses to hydrological conditions. Water 2016, 8, 296. [Google Scholar] [CrossRef]
  23. Gong, M.; Wang, Z.; Yuan, Z. Distribution characteristics of DO and COD in the waters near Qinshan Nuclear Power Station. Donghai Mar. Sci. 1991, 9, 27–33. [Google Scholar]
  24. Valente, J.P.S.; Padilha, P.M.; Silva, A.M.M. Dissolved oxygen (DO), biochemical oxygen demand (BOD) and chemical oxygen demand (COD) as pollution parameters in the Lavapés/Botucatu—SP brook. Ecletica Quim. 1997, 22, 752. [Google Scholar]
  25. Changhoon, L.; Hyunsang, S.; Kang, K.H. Chemical and spectroscopic characterization of peat moss and its different humic fractions (humin, humic acid and fulvic acid). J. Soil Groundw. Environ. 2004, 9, 42–51. [Google Scholar]
  26. Peiris, R.H.; Budman, H.; Moresoli, C.; Legge, R.L. Identification of humic acid-like and fulvic acid-like natural organic matter in river water using fluorescence spectroscopy. Water Sci. Technol. 2011, 63, 2427–2433. [Google Scholar] [CrossRef]
  27. Xu, F.; Liu, Z.; Yuan, S.; Zhang, X.; Sun, Z.; Xu, F.; Jiang, Z.; Li, A.; Yin, X. Environmental background values of trace elements in sediments from the Jiaozhou Bay catchment, Qingdao, China. Mar. Pollut. Bull. 2017, 121, 367–371. [Google Scholar] [CrossRef]
  28. Wang, S.; Luo, K.; Ni, R.; Tian, Y.; Gao, X. Assessment of elemental background values and their relation with lifespan indicators: A comparative study of Jining in Shandong Province and Guanzhong area in Shaanxi Province, northern China. Sci. Total Environ. 2017, 595, 315–324. [Google Scholar] [CrossRef]
  29. Fernandes, A.R.; Santos, E.S.; Braz, A.M.D.S.; Birani, S.M.; Alleoni, L.R. Quality reference values and background concentrations of potentially toxic elements in soils from the Eastern Amazon, Brazil. J. Geochem. Explor. 2018, 190, 453–463. [Google Scholar] [CrossRef]
  30. Gazzaz, N.M.; Yusoff, M.K.; Ramli, M.F.; Juahir, H.; Aris, A.Z. Artificial neural network modeling of the water quality index using land use areas as predictors. Water Environ. Res. 2015, 87, 99–112. [Google Scholar] [CrossRef]
  31. Haidary, A.; Amiri, B.J.; Adamowski, J.; Fohrer, N.; Nakane, K. Assessing the impacts of four land use types on the water quality of wetlands in Japan. Water Resour. Manag. 2013, 27, 2217–2229. [Google Scholar] [CrossRef]
  32. Maloney, K.O.; Weller, D.E. Anthropogenic disturbance and streams: Land use and land-use change affect stream ecosystems via multiple pathways. Freshw. Biol. 2011, 56, 611–626. [Google Scholar] [CrossRef]
  33. Mijin, S.; Fouad, J.; Raghavan, S.; Jeong, J. Evaluating the impact of low impact development (LID) practices on water quantity and quality under different development designs using SWAT. Water 2017, 9, 193. [Google Scholar]
  34. Walsh, G.W.; Wepener, V. The influence of land use on water quality and diatom community structures in urban and agriculturally stressed rivers. Water SA 2012, 35, 579–594. [Google Scholar] [CrossRef]
  35. Fei, L.; Huang, J.; Zeng, G.; Yuan, X.Z.; Li, X.; Liang, J.; Wang, X.; Tang, X.; Bai, B. Spatial risk assessment and sources identification of heavy metals in surface sediments from Dongting Lake, Middle China. J. Geochem. Explor. 2013, 132, 75–83. [Google Scholar]
  36. Preziosi, E.; Giuliano, G.; Vivona, R. Natural background levels and threshold values derivation for naturally As, V and F rich groundwater bodies: A methodological case study in Central Italy. Environ. Earth Sci. 2010, 61, 885–897. [Google Scholar] [CrossRef]
  37. Muangthong, S.; Shrestha, S. Assessment of surface water quality using multivariate statistical techniques: Case study of the Nampong River and Songkhram River, Thailand. Environ. Monit. Assess. 2015, 187, 548. [Google Scholar] [CrossRef] [PubMed]
  38. Varol, M.; Gökot, B.; Bekleyen, A.; Sen, B. Spatial and temporal variations in surface water quality of the dam reservoirs in the Tigris River basin, Turkey. Catena 2012, 92, 11–21. [Google Scholar] [CrossRef]
  39. Delpla, I.; Baurès, E.; Jung, A.V.; Thomas, O. Impacts of rainfall events on runoff water quality in an agricultural environment in temperate areas. Sci. Total Environ. 2011, 409, 1683–1688. [Google Scholar] [CrossRef]
  40. Marttila, H.; Klove, B. Managing runoff, water quality and erosion in peatland forestry by peak runoff control. Ecol. Eng. 2010, 36, 900–911. [Google Scholar] [CrossRef]
  41. Piirainen, S.; Domisch, T.; Moilanen, M.; Arola, M. Long-term effects of ash fertilization on runoff water quality from drained peatland forests. For. Ecol. Manag. 2013, 287, 53–66. [Google Scholar] [CrossRef]
Figure 1. Distribution of river source water environment function zones and sampling sites.
Water 11 01057 g001
Figure 2. Flow chart for calculating geochemical background values.
Water 11 01057 g002
Figure 3. Proportion of monitoring values that reached and exceeded the quality standard for different variables (2011–2016). DO: dissolved oxygen; CODMn: permanganate index; BOD: five days biochemical oxygen demand; NH3-N: ammonia nitrogen.
Water 11 01057 g003
Figure 4. Spatiotemporal change of failed variables between dry and wet seasons. (a) COD; (b) CODMn; and (c) NH3-N.
Water 11 01057 g004
Figure 5. Process of discriminating background areas.
Water 11 01057 g005
Figure 6. Selection of model indices and their relative weights.
Water 11 01057 g006
Figure 7. Range of background values for different variables in the dry and wet seasons: (a) COD, (b), CODMn, and (c) NH3-N.
Water 11 01057 g007
Figure 8. Flow chart for calculating the pollution degree.
Water 11 01057 g008
Figure 9. Degree of pollution in 22 source water reserves throughout 2017, (a) and (c) ignoring and (b) and (d) considering background values for (a) and (b) the dry season and (c) and (d) the wet season. Above the horizontal ordinate, the larger the circle, the greater is the degree of water pollution. Conversely, below the horizontal ordinate, which indicates better water quality throughout the year, the larger the circle, the better is the water quality.
Water 11 01057 g009
Table 1. Land use types and catchment areas of different water environment function zones.
CodeReserveArea (km2)Proportion of Land Use Area (%)
FarmlandWoodlandGrassland WaterTownCountry Side Industrial Construction LandUnused Land
A1Nanweng2262.3 98.410.2 0.4
A2Nengjiang14,990.66.265.450.4 0.10.122.8
A3Nanbei2516.529.165.35.30 0.2 0.1
A4Wuyuer227.324233.17.2 0.6 17.1
A5Tongken81.9914.980.30.60 4.2
A6Tangwang5122.51.591.84.80.30.50.60.10.4
A7Wuytong1703.36.384.30.50.4 0.1 8.4
A8Heli145.53.476.219.80.3 0.2 0.1
A9Yichun218.70.592.60.20.3 0.2 6.2
A10Hulan470.75.691.80.9 0.20.7 0.8
A11Bielahong3710.8703.77.3 0.20.4 18.4
A12Anbang143.11.997.30.5 0.3
A13Woken1303.132.355.72.9 0.7 8.4
A14Naoli1328.746.942.74.6 0.9 4.9
A15Qihulin134.41.996.41.3 0.1 0.3
A16Ashi1161.314.679.70.42.70.210.21.2
A17Mayi701.524.7721.6 0.11.5 0.1
A18Mangmiu1628.312.98240.1 0.9 0.1
A19Lalin927.6691.30.81.3 0.5 0.1
A20Hailang1587.61.497.21.10.2 0.1
A21Xiaosuifen556.13.191.64.5 0.2 0.6
A22Muling463.64.188.55.91.3 0.2
Table 2. Specifications of each variable measured during the study period that exceeded the environmental quality standards for surface water.
YearsVariablesFailed VariablesF1 (%)F2 (%)F3 (%)CCME WQI Values
201117633.33 10.56 7.83 79.31
201217527.78 11.08 14.90 80.71
201317633.33 11.49 14.52 77.98
201417527.78 11.41 15.21 80.57
201517738.89 9.55 12.75 75.74
201617738.89 11.14 13.83 75.32
Canadian Council of Ministers of the Environment Water Quality Index (CCME WQI).
Table 3. Results of the Kruskal–Wallis (K–W) test.
VariableGrouping of VariablesTotal Number of Monitoring Data Entries (N)Asymptotic Saliency (p)
COD2011–20169880.083
CODMn9880.093
NH3-N9840.008
CODA1–A229880.00
CODMn9880.00
NH3-N9840.00
Table 4. Three-step discrimination results for each study area. I, II, and III stand for high background properties, transition area, and poor background properties in single index recognition, respectively; × indicates a limiting factor in the study area.
Study AreaSingle Index RecognitionLimiting FactorSynthetic IndexComplete Background Area
12435Single Index Recognition678Limiting FactorScoreSynthetic Index
A1NanwengIIIII 11
A2NengjiangIIIIIII 0.810.81
A3NanbeiIIIIIIII 0.75
A4WuyuerIIIIIIIIIIPoor background properties 0.62
A5TongkenIIIIIII 0.78
A6TangwangIIIIIIII ×× Veto power0.830.83
A7WuytongIIIIIII 0.830.83
A8HeliIIIII 0.960.96
A9YichunIIIII 0.940.94
A10HulanIIIIII 0.78
A11BielahongIIIIIIIIIIPoor background properties× Veto power0.21
A12AnbangIIIIII 0.870.87
A13WokenIIIIIIIIIIPoor background properties× Veto power0.6
A14NaoliIIIIIIIIIIIPoor background properties 0.49
A15QihulinIIIIII 0.910.91
A16AshiIIIIIIIIIIIIIPoor background properties× ×Veto power0.53
A17MayiIIIIIIIII 0.54
A18MangmiuIIIIIIIII 0.72
A19LalinIIIIIII ×Veto power0.810.81
A20HailangIIIIII 0.920.92
A21XiaosuifenIIIIIII 0.860.86
A22MulingIIIII ×Veto power0.890.89

