The Association between Hydro-Meteorological Events and Leptospirosis Hospitalizations in Santa Catarina, Brazil


1
Centro de Investigação em Saúde Pública, Escola Nacional de Saúde Pública, Universidade NOVA de Lisboa, 1600-560 Lisboa, Portugal
2
Universidade de Pernambuco, Campus Petrolina, Petrolina CEP 56328-900, Pernambuco, Brazil
3
Instituto Dom Luiz (IDL), Faculdade de Ciências, Universidade de Lisboa, 1749-016 Lisboa, Portugal
4
Instituto Nacional de Saúde Doutor Ricardo Jorge, Av Padre Cruz, Lumiar, 1649-016 Lisboa, Portugal
*
Authors to whom correspondence should be addressed.
Water 2019, 11(5), 1052; https://doi.org/10.3390/w11051052
Submission received: 15 April 2019
/
Revised: 8 May 2019
/
Accepted: 13 May 2019
/
Published: 20 May 2019
(This article belongs to the Section Hydrology)
Abstract
:Extreme climatic events (ECE) are beginning to be perceived as potential causes of health disturbances. The assessment of the impacts of certain ECE to human health has become essential to health managers and caregivers. The objective of this study was to identify the association between rates of hospitalization for Leptospirosis and the occurrence of extreme hydrological events in the state Santa Catarina (Brazil) between the years 2005 and 2014. The association between Leptospirosis hospitalizations and the occurrence of floods, flash floods, and flooding events was measured through Spearman’s bivariate correlation coefficient. Flash floods corresponded to 92.6% of the total hydrological events. Coastal regions presented higher admission rates than inland. The Leptospirosis presented a seasonal pattern, with a peak in the summer months. Positive and significant correlations for monthly and annual analyzes were identified for some of the analyzed macro-regions, with higher values of correlation in the coastal region. The current results suggest the influence of the occurrence of extreme hydro-meteorological events on the variability of the hospitalization rate by Leptospirosis in the state of Santa Catarina, with significant differences found for the coastal and inland regions.
1. Introduction
In a climate change context, one of the key aims of the health sector for the next few decades will be the identification of the most vulnerable systems and the mitigation of the risk associated with the occurrence of extreme meteorological events [1].
Thus, several studies have been conducted in order to better understand extreme weather events (e.g., floods, droughts, heat waves) and their adverse effects to vulnerable populations [2]. Floods are one of the most common natural disaster globally [3], and are expected to increase in terms of frequency and severity due to climate change [3,4]. Moreover, floods hit most often populations with lower purchasing income [5], being one of the main causes of death among the environmental disasters [6]. On the other hand, floods are often preceded by extreme precipitation events [7] which have large impacts per se to populations and ecosystems [8].
Brazil has been severely affected by floods [9,10], and one of the most striking events resulted from the intense precipitation event that occurred in Rio de Janeiro in 2011 [11]. A set of associated factors such as geomorphology, human occupation and high precipitation rates led to the death of approximately 900 people and the displacement of almost 35,000 from their homes for safety reasons, namely because of the possibility of floods and landslides [11]. The state of Santa Catarina was also hit in the year 2008 with high levels of precipitation which occurred in a very short period of time, causing landslides and sudden floods, which demonstrated the vulnerability of that territorial area [10].
On the other hand, floods have been reported to be associated with the increase of the global burden of disease [12], morbidity [13], mortality [14,15], social and economic disruptions. Regarding flood-related morbidities, an expressive number of articles has been published on the analysis of episodes of waterborne diseases related to the contamination of foods ingested, leading to the emergence of cases of Leptospirosis [13,14,16]. When flood events occur, the patterns of contact are altered, and diseases transmitted by rodents like Leptospirosis can spread out through the contamination of the waters used for human consumption, as well as the contamination of food by human or animal waste [14]. Although Leptospirosis was previously regarded as an occupational illness, its epidemiological pattern is changing and now there are increasing reports of Leptospirosis contracted during accidental events in waters polluted with Leptospirosis and during recreational activities [17,18]. In terms of flood-associated outbreaks of Leptospirosis, several papers have been published focusing on a wide range of countries throughout the world, ranging from countries of temperate zones to tropical areas [10,17,18,19,20,21,22,23,24,25]. Leptospirosis affects indiscriminately different world countries; nevertheless, some areas have higher transmission risk, being confirmed as a steadily increasing public health problem in some of them [25]. Several studies focusing on Brazil reinforce the association between high precipitation and flood events to the increasing occurrence of urban cases of Leptospirosis [19,20,21,23,24,26]. Most authors highlight several factors which may trigger Leptospirosis cases: poor sanitation and housing characteristics, mud and garbage accumulation, large populations of rodents, low socioeconomic levels and work activities [10,19,24,27]. These factors point to the fact that poverty and poor sanitation have high impact on the occurrence of Leptospirosis, thus affecting more low-income populations.
These severe population health impacts will place a continuing stress on health services, especially in low-resource countries [15].
The interaction and interdependence between health and environment highlights the need for the development of strategies to measure and understand their association, enabling the design of strategies to reduce the environmental impacts on human health [28]. The search for quick, efficient and planned responses is vital to lifetime maintenance and possible forecast aggravations that can be predictable [29]. Thus, climatological analysis together with epidemiological data of a particular social group is of fundamental importance to know how such events behaved and the magnitude of its implications. The possibility to associate weather events that compromise the health of a given population it is of the utmost importance, so that responsible entities can identify the phenomenon, allocate services and plan actions to minimize their consequences [30,31].
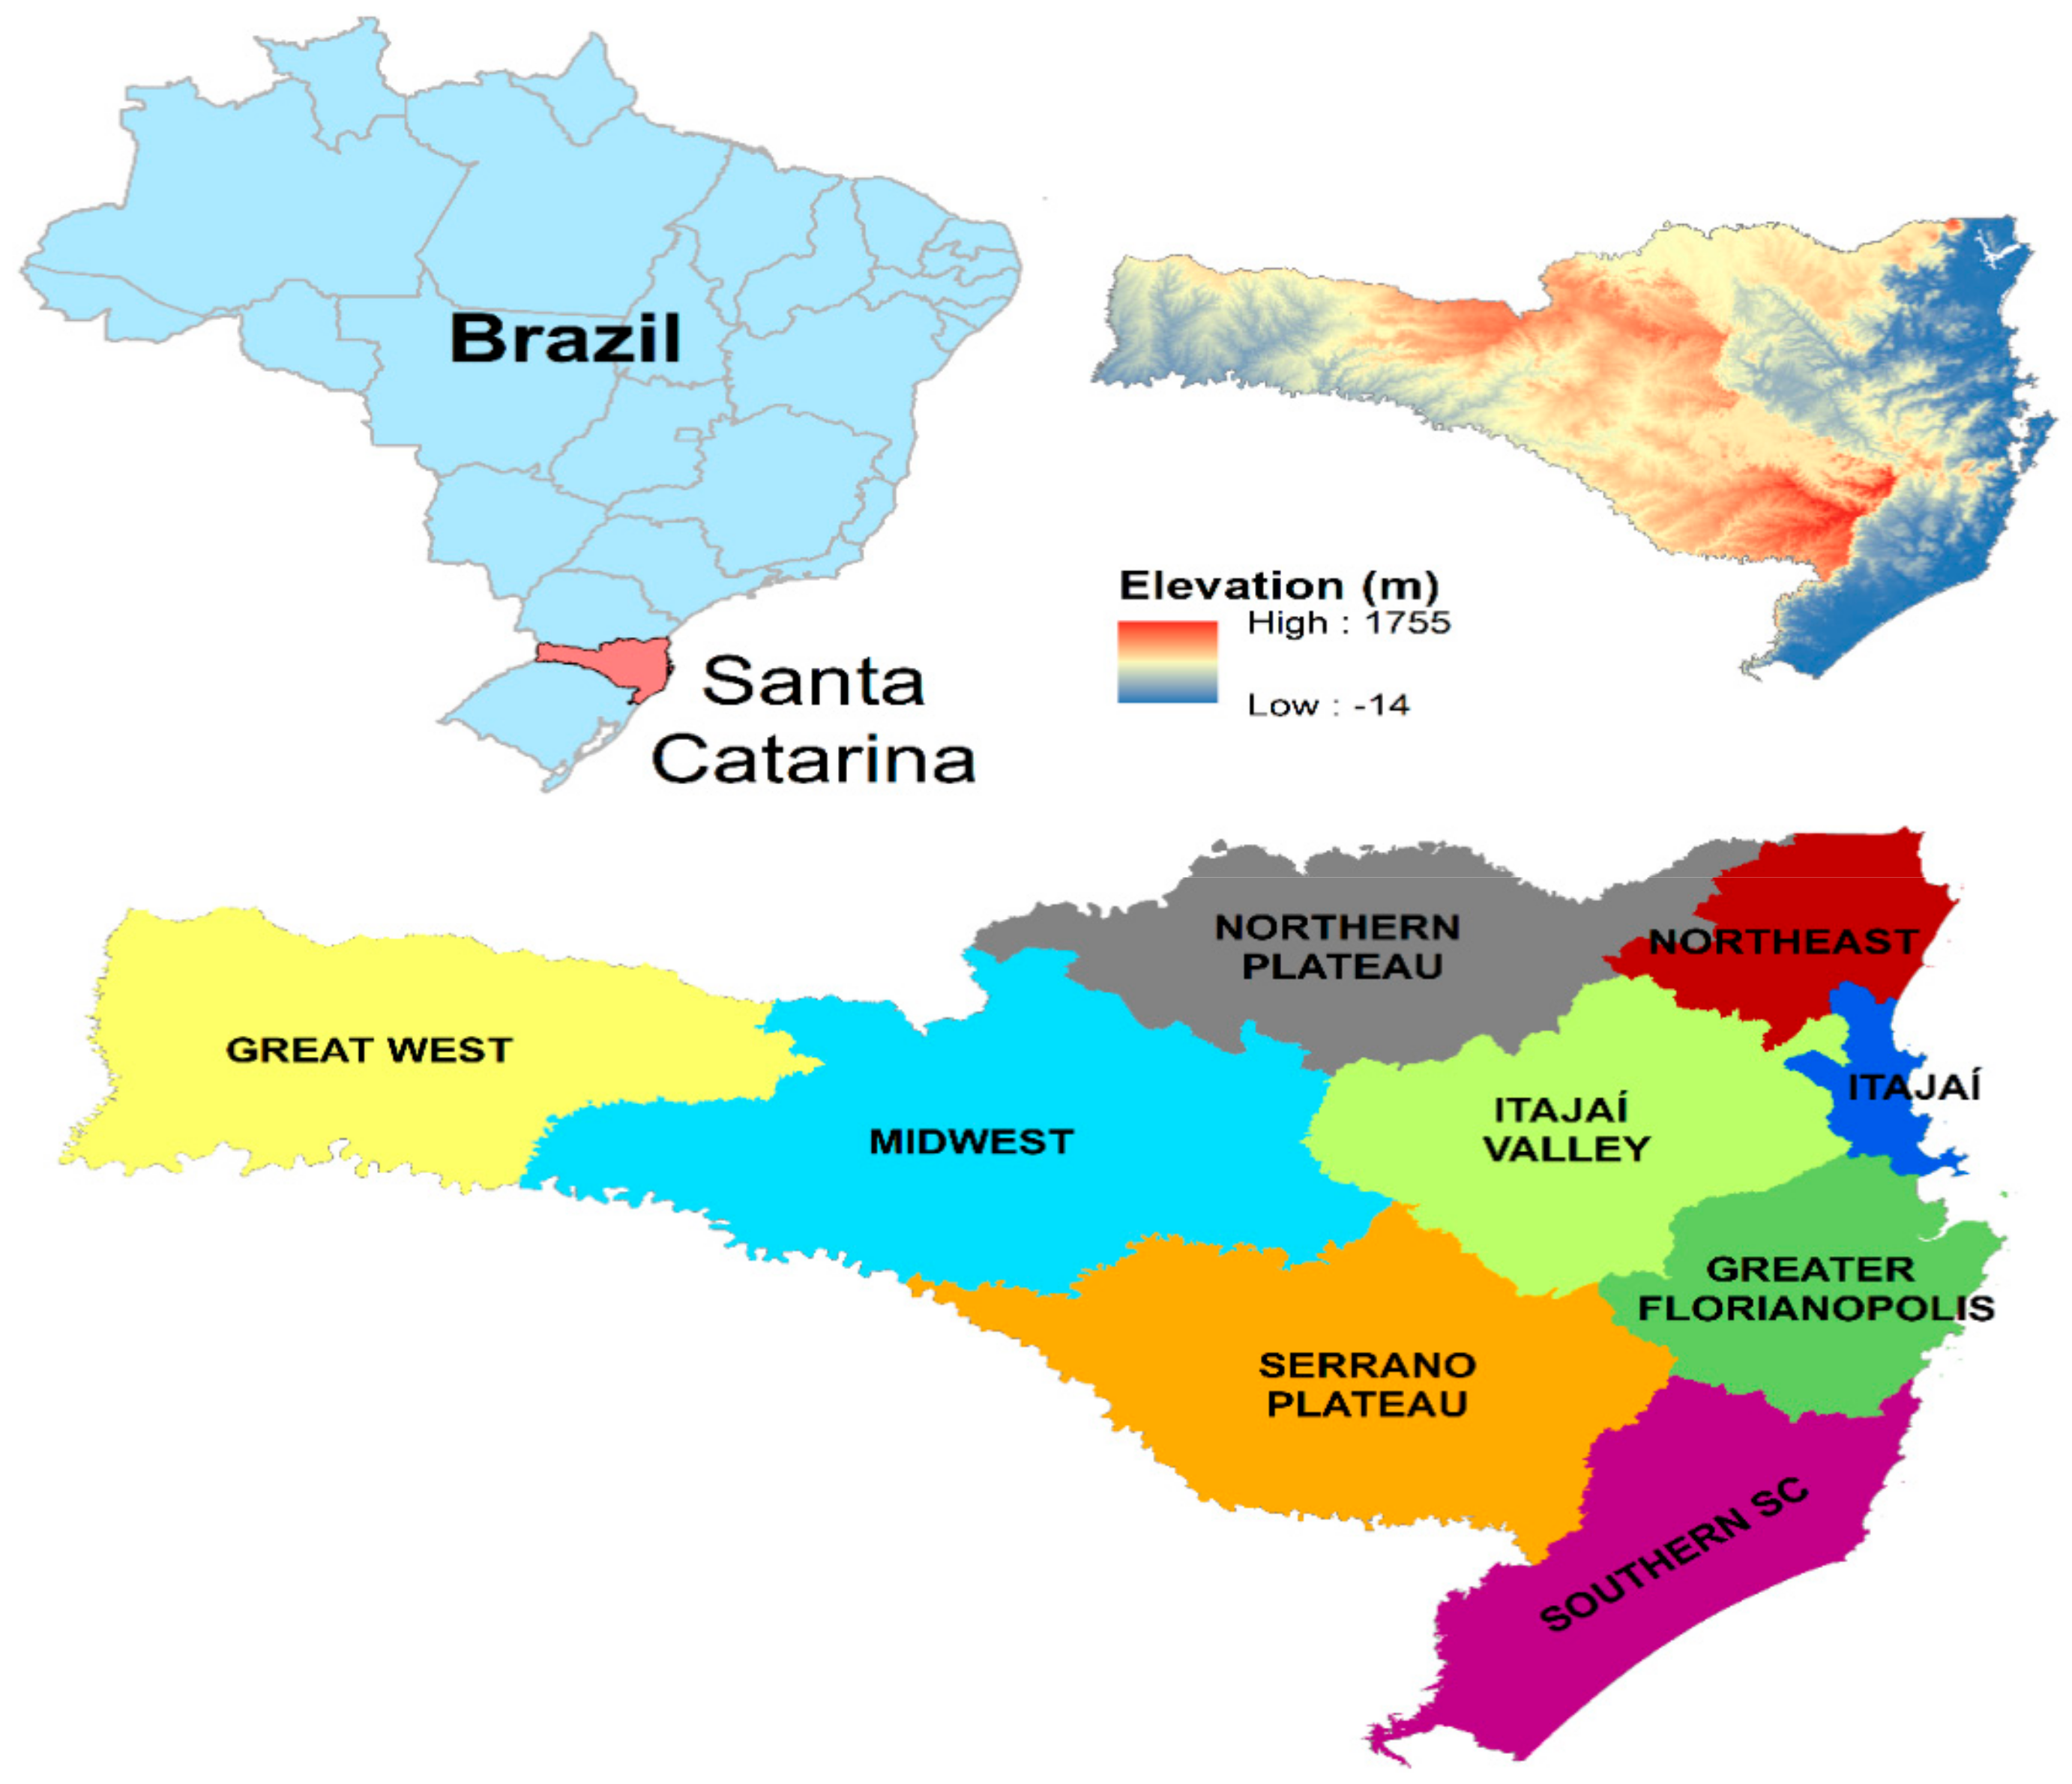
This study was conducted for the State of Santa Catarina (SC) which is located in the southern region of Brazil (Figure 1, top left panel). Santa Catarina has an area of 95,736.165 km², with an estimated population of 6,767,148 inhabitants [32] and with a Human Development Index-HDI of 0.84, being considered as the best ranked State in Brazil, with 27 cities among the 100 with higher quality of life in the country.
The study area is located at an intersection of many routes, which connects the different parts of the country and Latin America, strengthening its positioning as a socioeconomic development pole, supported by the agriculture and industry sectors. SC state has its largest population contingent located in the coastal region (54.5%) where the higher urbanization rates are present and, consequently, a greater coverage of water supply. Potable water reaches 85.6% in the state, but basic sanitation does not exceed 15.5% of wastewater and sewage treated in the state [33], which has one of the lowest rates of sewage treatment in Brazil. Santa Catarina’s coastal region is located in an area of low elevation, while the inland is dominated by plateau areas with altitudes reaching 1755 m. Moreover, the coastal area is dominated by the estuaries of SC’s main rivers (Figure 1, low panel).
The main objective of this study was to measure the association between the occurrence of hydro-meteorological events and hospitalization for leptospirosis in the state of SC, between the years 2005 to 2014. This work constitutes a first step towards the development of a project that can support public managers in the elaboration of policies aiming at the mitigation and the monitoring of the extreme climatic events and their impacts on the indicators of population’s health.
2. Materials and Methods
To achieve the pursued objective, a time-series ecological study is proposed, where the association of the hydro-meteorological events with the monthly hospitalization rates by Leptospirosis in the Santa Catarina State between the years 2005 to 2014 will be attempted.
2.1. Case Study: Santa Catarina (Brazil)
SC’s (Figure 1, low panel) population residing in the 9 macro-regions (Extreme west, Midwest, Southern St. Catarina, Northern Plateau, Serrano Plateau, Itajaí Valley, River Itajaí Estuary, Northeast, Greater Florianopolis) during the period between 2005 and 2014 was collected from an historical dataset of the SC’s population demographic database [32].
The eastern part of SC state has three large topographic units: the Coastal Plains, the Coastal Sierras and the Western Plateau, with very different altitudes and topographic characteristics, namely (1) 77% of its territory is above 300 m of altitude; (2) 56.22% of the area is covered by plateaus between 300 m and 900 m; and (3) 20.45% are mountains higher than 900 m. To the west, we have the region known as Plateau Catarinense, where altitudes vary between 700 and 1800 m. The Coastal Plains are in direct contact with the Atlantic Ocean, the Sierras are arranged obliquely to the shoreline and the Plateau constitutes the most continental and extensive unit of the territory of Santa Catarina [34].
2.2. Hydrological Events
Data was obtained from the Secretariat of State for Civil Defense of the State of Santa Catarina (SDC/SC), which is responsible by the identification of public calamities and the assessment of extreme and adverse climatic events aiming to support the regions and municipalities with resource allocation and the promulgation of situations of “State of Emergency and Public Calamity”. In this way, the SDC/SC organized a database of indicators related to extreme climatic events, where these are classified according to their nature and are recorded based on the date of occurrence and the affected locality. The data for the Municipalities between 2005 and 2014 was used after being aggregated by health macro-regions.
Additionally, data from the SDC/SC were extracted to determine the monthly occurrence of extreme Hydrologic Events—HE. The HEs were divided into four classes of occurrence: (1) flash floods, (2) floods, (3) flooding and (4) cumulative HE (summed occurrence of any type of flash floods, floods and flooding), which were attributed to each different macro-region. The SDC/SC identifies as floods the overflow of the waters of a watercourse (e.g., river flood; maritime flood; dam breakage’s flood). Flash floods are floods which are highly concentrated and energetic floods which produce surface runoff that results from intense or extreme rainfall events. Finally, flooding results on the momentary accumulation of water in certain locations by deficiency in the drainage system, covering a small part of the plain.
Health Indicators
The data on hospitalizations and resident population were extracted from the database of the Department of Informatics of the Unified Health System—DATASUS, of the Ministry of Health—MS, of the Government of Brazil.
To achieve the proposed goal, the number of hospitalizations with a primary diagnose of Leptospirosis (ICD10 A27/A27.9) were extracted by month for each health macro region for the period of 2005 to 2014. Then, the monthly Leptospirosis hospitalization rates were determined and used as a health indicator, dividing the observed number of hospitalizations by the resident population in each year. The specific hospitalization rates for this disease were calculated by age groups and macro-regions of health.
The disease occurrence in subsequent months an accumulated rate was calculated based on the sum of the rates for the month of occurrence (here considered N) and the subsequent month (here considered as N + 1) were considered.
2.3. Statistical Analysis
A descriptive statistical analysis of the hydro-meteorological events and of the hospital admissions rates was performed. Finally, the Spearman’s bivariate correlation coefficient between the monthly hospitalization rates of Leptospirosis and the number of HE for the period was determined. The Spearman correlation analysis was performed by crossing the data from the hospitalization rates for Leptospirosis summed for two consecutive months (months N and N + 1), with the number of hydro-meteorological events occurred in the month N, this analysis was stratified by macro-region and year. All statistical analysis was performed in IBM SPSS version 24 (Chigago, IL, USA) at 5% of statistical significance.
3. Results
3.1. Descriptive Analysis
3.1.1. Hydrological Events
When analyzing the average rainfall data in the state of Santa Catarina, we observed that, in the period under analysis, 37.2% had precipitation values above 150 mm and 35.1% had precipitation values below 100 mm (Figure 2). When evaluating the months with the highest precipitation, we highlight the months of October 2008 (344.78 mm), followed by June 2014 (305.68 mm), January 2011 (298.12 mm), January 2010 (277.79 mm) and January 2007 (269.24 mm).
Flash floods were the HE with the highest incidence among the four studied HE between 2005 and 2014, with 1541 occurrences, corresponding to 92.61% of the total events recorded for the period. The regions most affected by high concentrations of flash floods are the macro-regions of Itajaí Valley, Southern SC, Extreme West, Midwest and Greater Florianópolis (Table 1).
These regions are almost all located on the coastal area of SC’s territory (Figure 1). On the contrary, the macro-regions with smaller frequency of HE are mostly located in the region known as Plateau of SC, where the Plateau Serrano and North Plateau macro-regions are located (Table 1, Figure 3). Moreover, 2011 was the year with higher number of floods, with the largest numbers of occurrences in 7 of the 9 macro-regions. However, the years 2008, 2009, 2010 and 2014 also present a high number of floods (Figure 3). In fact, most of the events were concentrated on five years of the total of nine years, summing total concentrations of occurrences which ranged from 88.43% to 96.67% in each macro-region.
3.1.2. Hospital Admissions by Leptospirosis
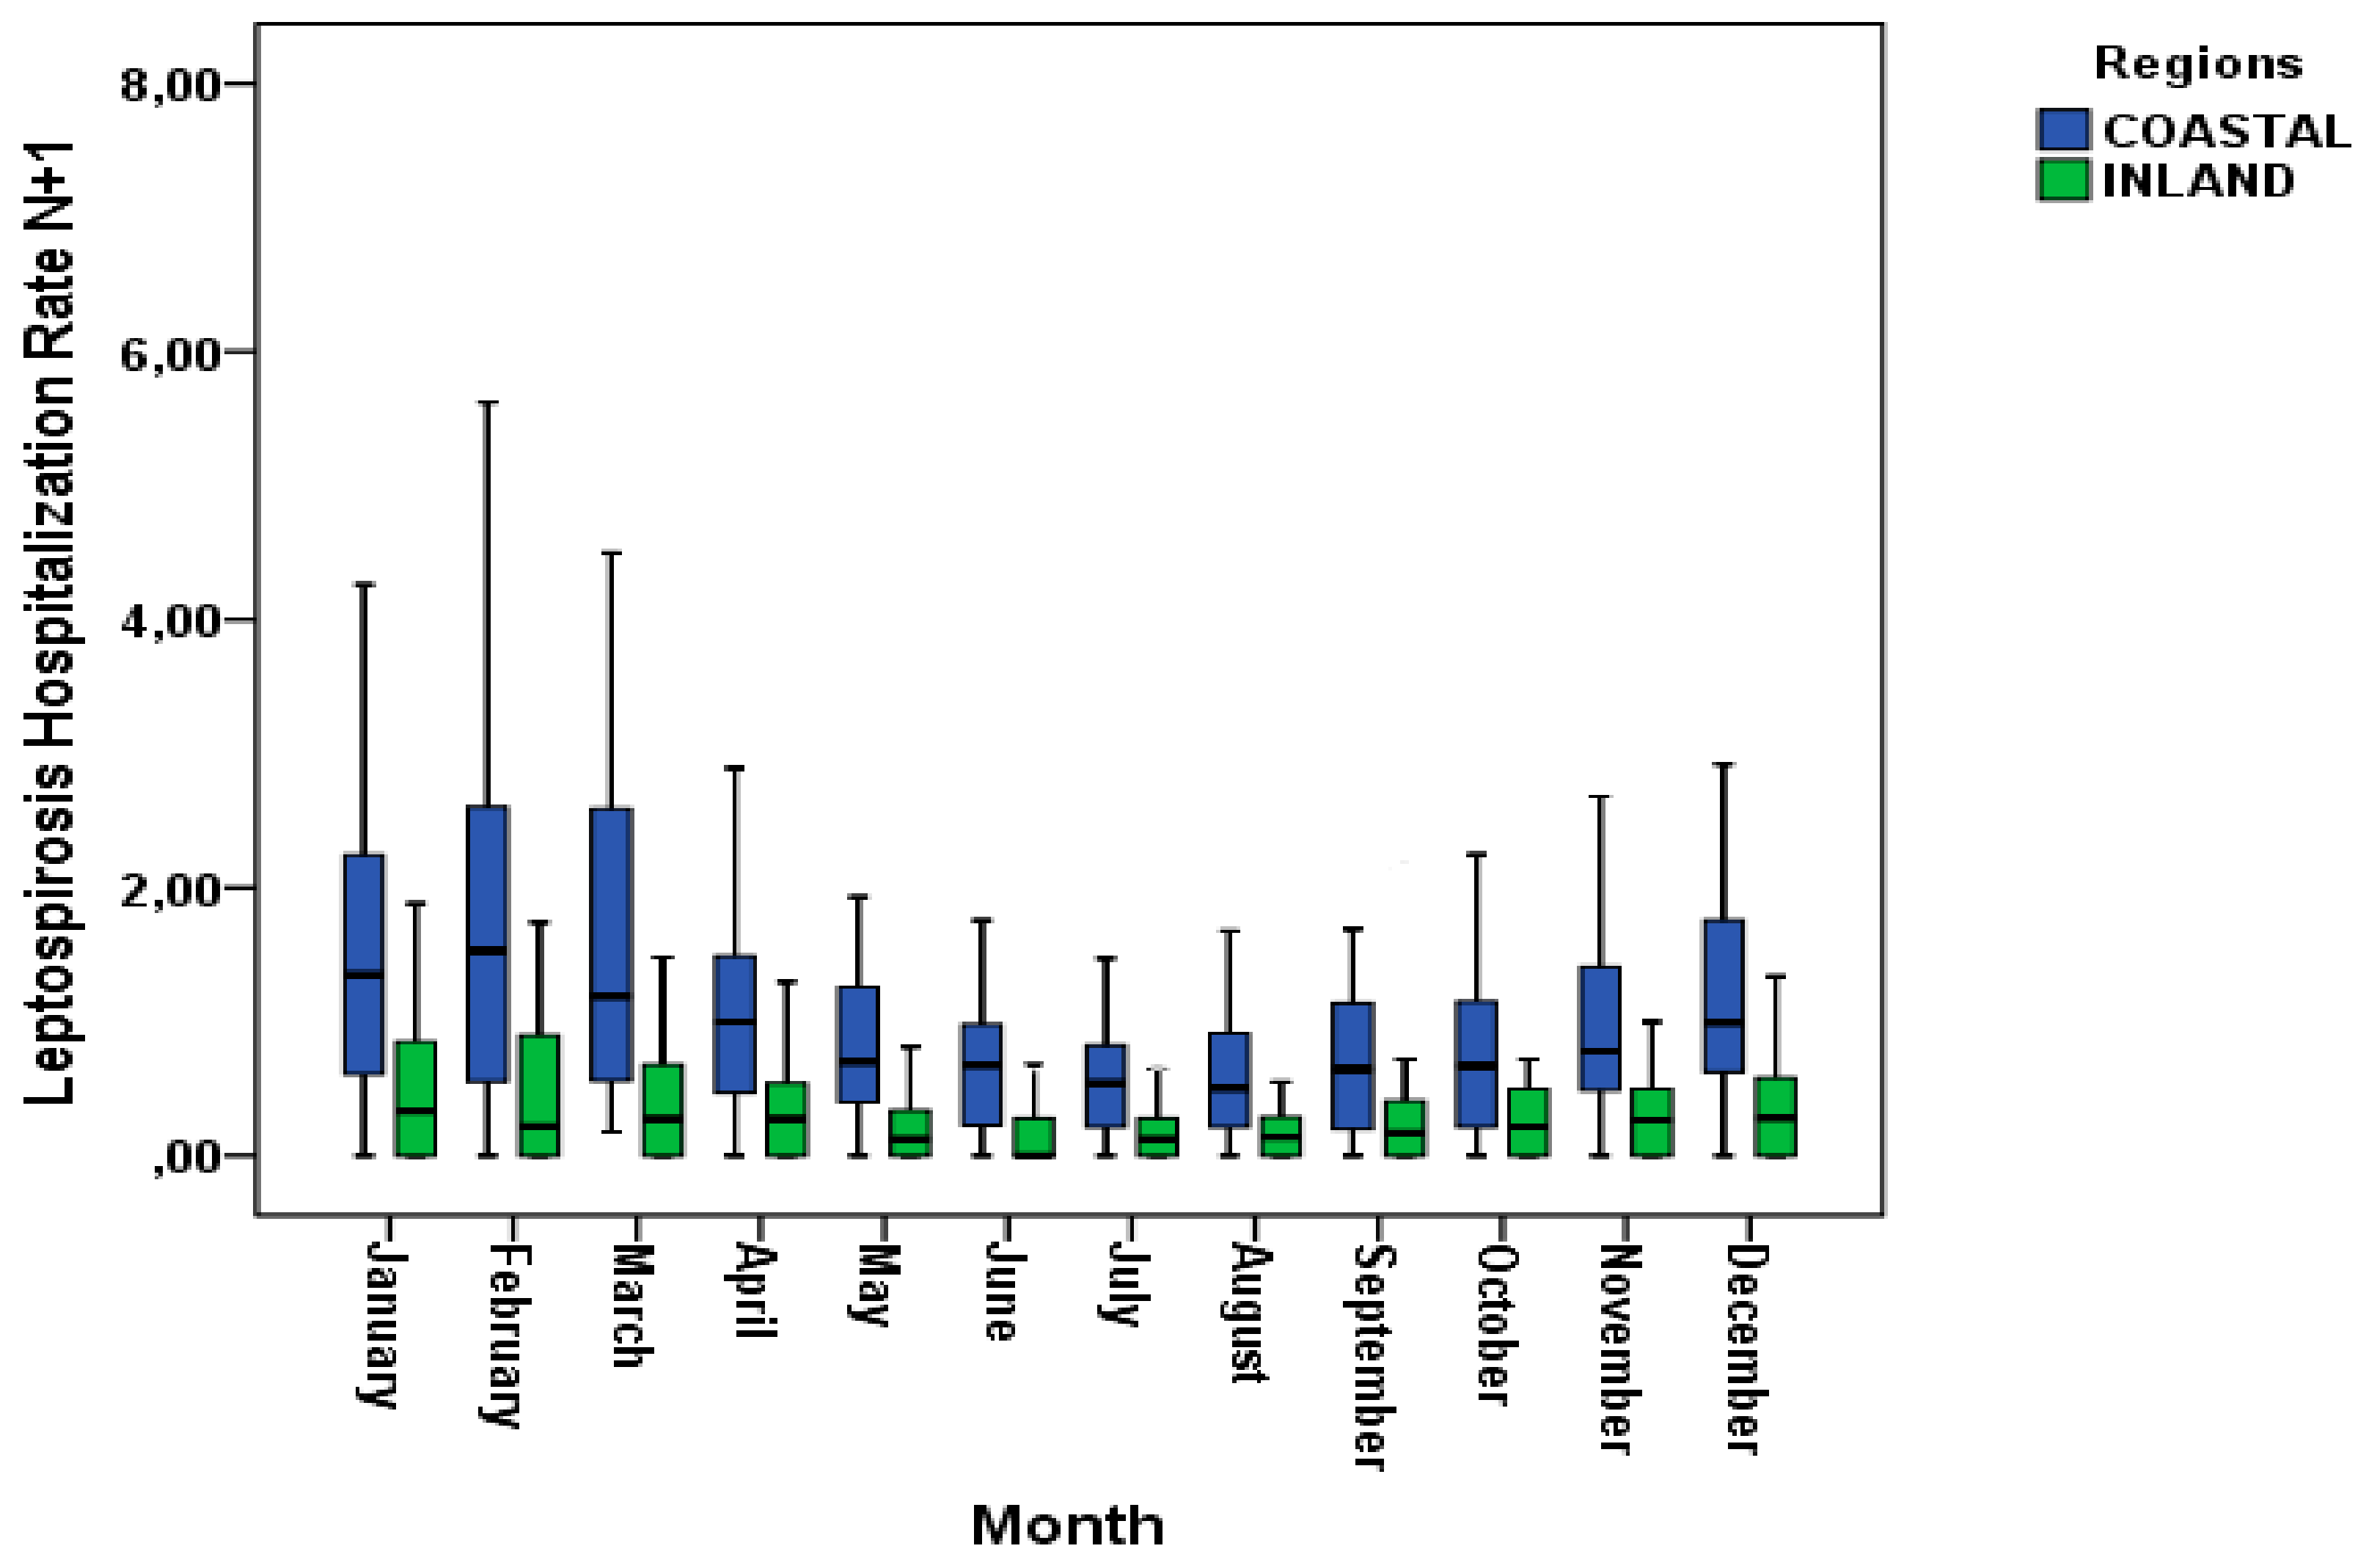
There is a particularly high number of hospital admissions by Leptospirosis cases within the period 2007–2008. On the other hand, when analyzing the distribution of cases per month, a seasonal pattern of Leptospirosis is observed, with a higher summer concentration (December, January and February) (Figure 4).
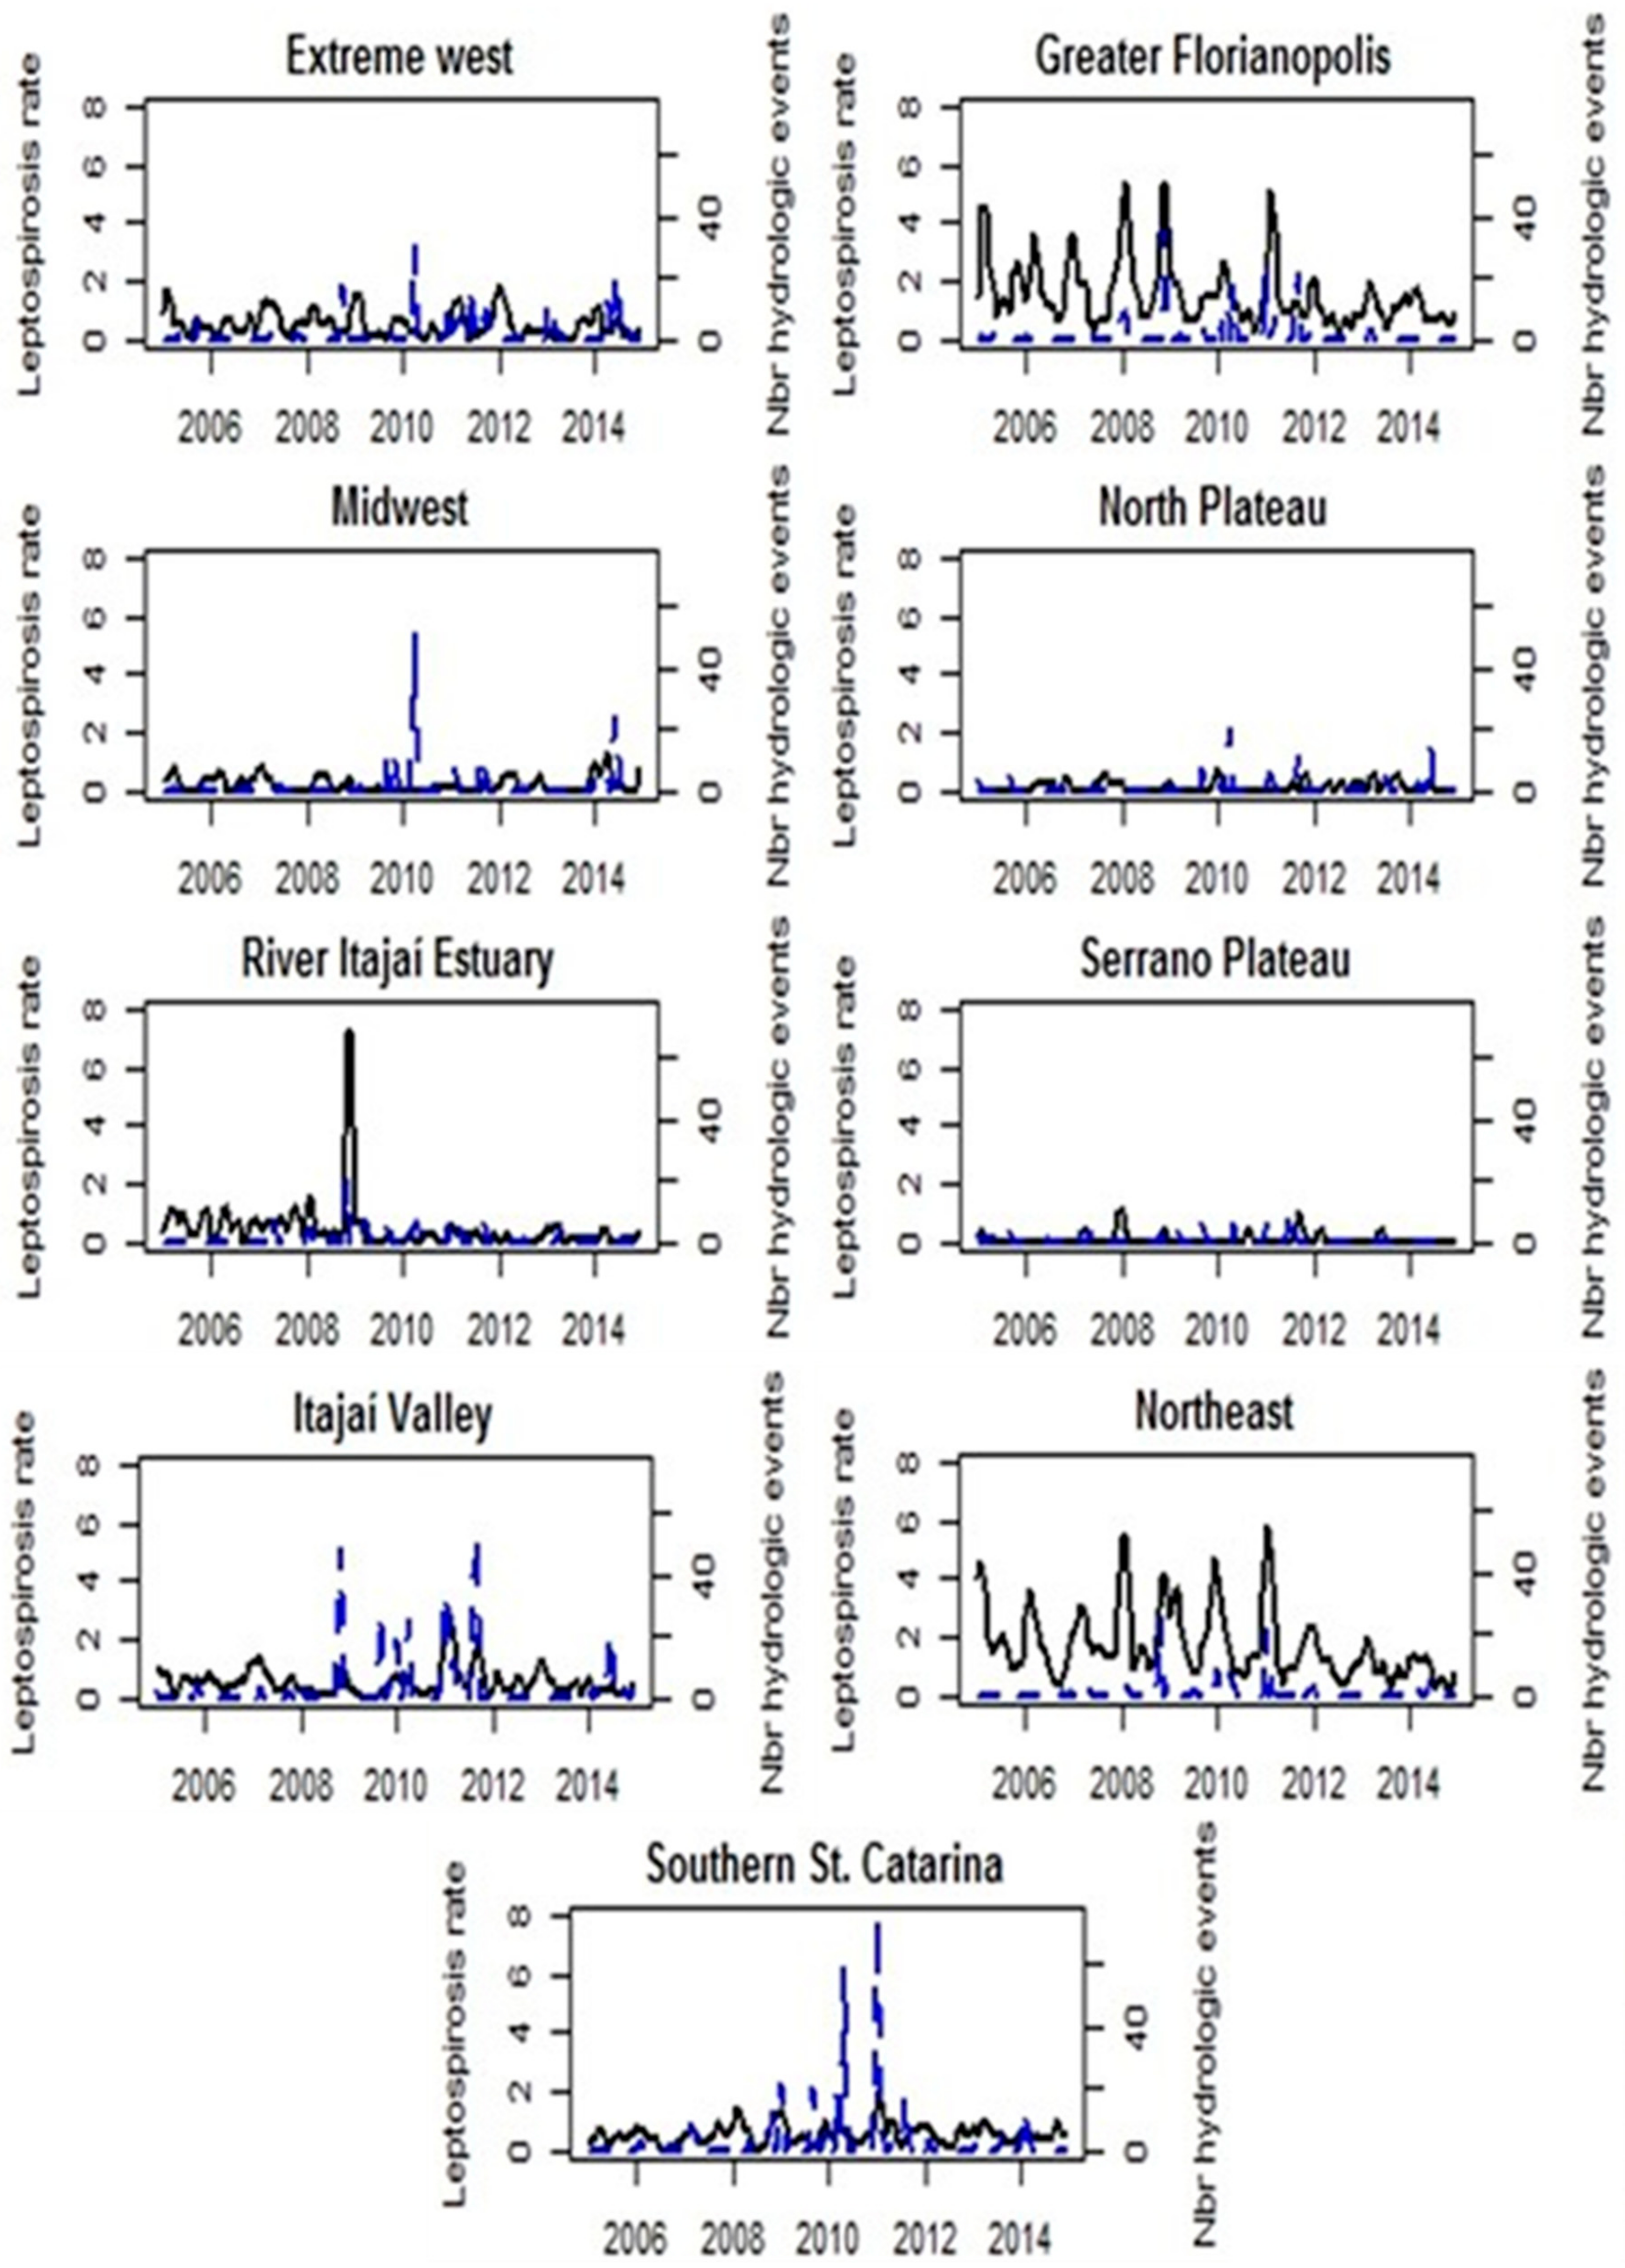
When the analysis is refined to the macro-region, the hospitalization rates for Leptospirosis for the Northeast macro-region should be highlighted, as it presents the highest average hospitalizations rate for the study period (0.90/100,000 inhabitants). It was also the macro-region of the Itajaí River Estuary that presented the most significant monthly rate with 6.97/100.000 inhabitants, showing a considerable variation relatively to the average (0.23/100.000 inhabitants) of the region and the maximum number registered for the period.
On the other hand, River Itajaí Estuary presented the lowest averages, followed by the Midwest, Serrano Plateau and Northern Plateau. The main difference between them is that River Itajaí Estuary presented maximum monthly values of admissions of 6.97/100,000 inhabitants, being the highest rate recorded for the period under investigation.
3.1.3. Correlation Analysis
The macro-regions of Itajaí Valley and Greater Florianópolis are the ones with the highest number of annual positive correlations for the period under analysis. Namely, the Itajaí Valley presents positive and significant correlation for the years 2008 (0.722); 2009 (0.658); 2010 (0.701); 2011 (0.613); and 2014 (0.655); and Greater Florianópolis also presents significant correlations for the years 2008 (0.612); 2011 (0.635) and the year 2013 (0.656). The Northeast macro-region was the one with the highest positive correlation among all the macro-regions (0.740) for the year 2008 (Table 2, Figure 3).
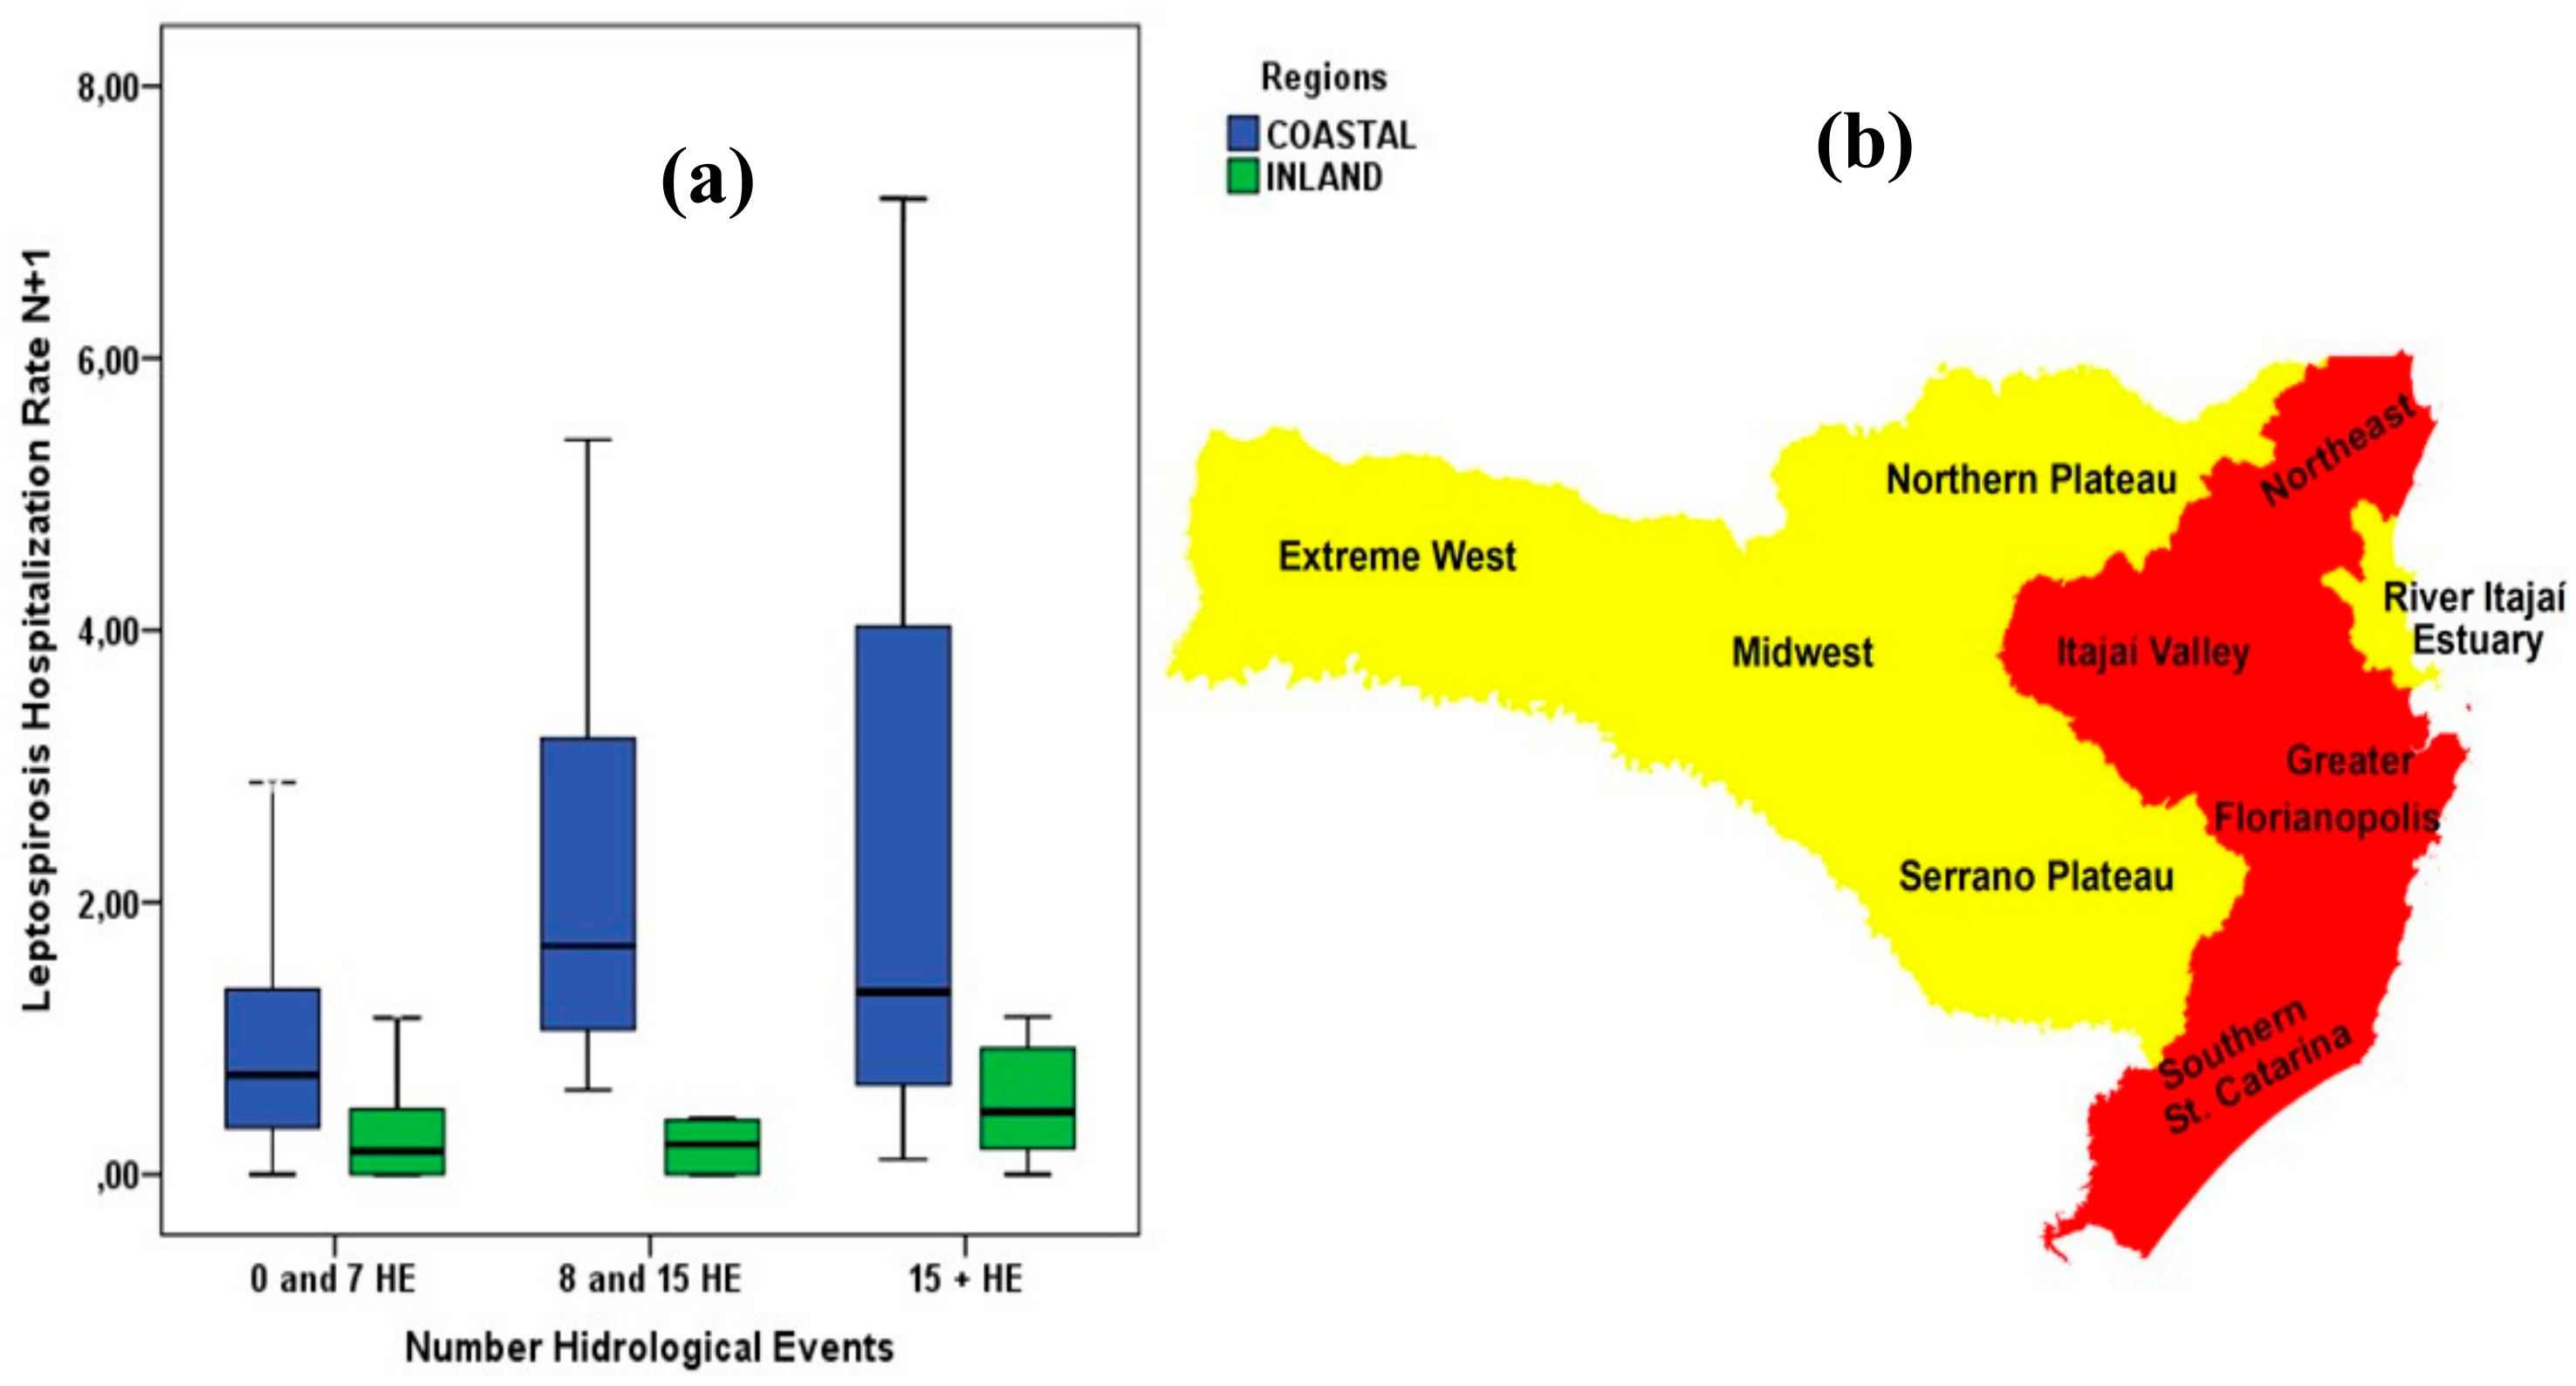
It was observed in this investigation that there is a difference in the pattern of the disease when comparing the coastal and inland regions. It is known that coastal regions have a higher frequency of occurrence of HE [27], due to their demographic and relief characteristics. The findings show that the number of HE is associated with the rates and hospitalization in both regions; however, we observed that in the periods where more than 15 HE occurred in a single month, a significant increase was observed with greater repercussions in macro health regions with greater proximity to the coast (Figure 5). This is in accordance with other studies for Brazil, South America and other countries [12,22,23].
4. Discussion
In this study, the existence of correlations between Leptospirosis hospitalizations and hydro-meteorological events were analyzed. The results showed that four macro-regions (Greater Florianópolis, Northeast, Southern SC and Itajaí Valley) presented positive correlations ranging from 0.608 to 0.740, for the years 2008, 2009, 2010, 2011, 2013 and 2014. These four macro-regions also had significant and positive correlations for the complete period under analysis (2005 to 2014).
The state of SC has presented in recent years an increase in the number of hydrological events, which brings the State to the top of affected States in the national scenario [35]. It is also known that coastal regions, such as the State of SC, are more likely to have a greater number of HE, which influences the total number of events for their large macro-regions [27,36], since these regions are more prone to the occurrence of sudden storms, and with high volumes of precipitation in a short time. The high number of flash floods may be a factor responsible for the increase in cases of Leptospirosis [23], when associated with factors such as low sanitation coverage.
In order to analyze the results, the HE events were separated into floods, flash floods and flooding events, being that flash floods accounted for 92.61% of HE occurrences in Santa Catarina from 2005 to 2014 [37]. These results are in accordance with results found in other studies [35], highlighting the importance of flash floods as the most frequent types of HE in the state of SC, which can greatly contribute to the increase of rivers’ flow causing rapid floods [35] and thus allowing for the rapid propagation of the disease-causing agent Leptospirosis.
It is also known that flash floods have impacts on public health and health services because of their characteristics and lack of predictability, which can affect the supply of services as well as the displacement of support and relief teams [38]. In addition, it is clear that people who are not prepared for this HE have the greatest possibility of contact with contaminated water, thus increasing the risk of Leptospirosis [39]. This shows that we must continue to pursue for a better understanding and monitoring of these events in order to anticipate and mitigate their impacts on vulnerable populations [31].
The highest mean precipitation indexes for SC were observed in January (not shown) predominantly which favored occurrence of extreme events related to a large volume of precipitation in a short time, similarly to what happened in other Brazilian states [38]. It is known that there is a tendency of high rainfall in the state of Santa Catarina in the summer period, but climate change is influencing these values. Even with normal means, the emergence of extreme events in a short time begins to be more frequent, which implies a monitoring and preparation of populations to deal with these phenomena [40].
The maximum rates of hospitalization for Leptospirosis were identified in the months and/or subsequent month in which there were the highest number of current HE events, which is in fact related to Leptospirosis incubation period, which varies from 2 to 30 days, with an average of 7–10 days. [41] Moreover, the coastal macro-regions of health present the highest rates of hospitalization for this disease which is in agreement with the findings in other studies [36]. The regions that presented positive and significant correlations are mostly located in the coastal zone of the state of SC, which in recent years presented a significant number of hydrological events. An explanation for that is that it might be associated with the fact that there are more people living in the coastal areas and that the coastal areas have been affected by a higher number of hydrological events (than inland areas) because of its geographical constraints. The coastal areas are dominated by the estuaries of SC’s main rivers and located in an area of low elevation, while the inland is dominated by plateau areas. Thus, coastal areas are more prone to suffer more hydrological events than inland areas.
In reaction to the behavior of the events, it was observed that the number of events influences the rates, we see that the higher the occurrence of events (15+), the higher the hospitalization rates for both coastal and inland regions. It is also important to emphasize the importance of monitoring both the disease and the hydrologic events because, with the increase of climatic changes as a triggering factor, it tends to change the behavior and the emergence of outbreaks, which will most often affect the most vulnerable populations; in this way, the control becomes essential for the mitigation of the impacts [3,15,27].
This study aims to assist stakeholders to understand the dynamics between hydrometeorological events and hospitalizations for Leptospirosis. As a limitation, we must point out that this is a temporal ecological study, and this type of study has some limitations, mostly because of the use of secondary data, which does not allow the understanding of the phenomenon in its complete magnitude. In addition, there are other factors that may be associated with the temporal pattern of the disease, such as demographic density and socioeconomic factors, which were not addressed in this investigation, but that in future studies could be accounted to better understand these mechanisms and their influences on the disease under analysis.
In recent years, the state of Santa Catarina has presented an expressive number of hydrometeorological events, having as highlight flash flood events. When analyzing the different macro-regions of health, it was found that certain macro-regions are more susceptible to these occurrences, although it should be noted that Leptospirosis in Santa Catarina has seasonal characteristics and has endemics also observed in studies that relate leptospirosis to precipitation [42].
5. Conclusions
Hydro-meteorological events are in fact an important factor which contributes to the high number of hospitalizations for Leptospirosis. However, there are some other facts which were not addressed that are also vital when analyzing the incidence of Leptospirosis, namely demographic density, sanitation conditions, socioeconomic and cultural aspects, among others. These latter might also be included somehow in a more comprehensive investigation in order to better elucidate on the causes and the consequences on hospitalizations for this disease.
However, it is important to highlight that this study is a preliminary assessment of the health vulnerability for the state of Santa Catarina focusing on the hospitalizations due Leptospirosis. Nevertheless, specific actions in the public health sector and an improvement on the measures to identify and predict extreme climatic events should be considered in order to mitigate these impacts. The field of action should be broadened, from improved sanitation indicators to the monitoring of events and diseases, including the development of emergency disaster plans, in order to reduce the impacts on the most vulnerable populations. For this reason, this study provides some evidence that can, along with other findings, permeate the local planning in the search of greater specificity in the field of action, allowing greater effectiveness in the proposed actions.
Author Contributions
The contributions of each author to this work were the following: Conceptualization, W.E.P., A.R. and B.N.; methodology, W.E.P., A.R. and B.N; formal analysis, W.E.P., A.R. and B.N.; investigation, W.E.P., A.R. and B.N; writing—original draft preparation, W.E.P., and A.R.; writing—review and editing, W.E.P., A.R. and B.N.
Funding
This research was partially funded by Fundação para a Ciência e Tecnologia grant SFRH/BPD/99757/2014 (AR).
Acknowledgments
We are grateful for the contributions to this work regarding the availability of data regarding hydrological events by the State Secretariat of Civil Defense of Santa Catarina, as well as the University of Pernambuco/Brazil, which allowed the immersion of one of the researchers in the investigation.
Conflicts of Interest
The authors declare no conflict of interest.
References
- Climate Change and Human Health-Risks and Responses; World Health Organization: Geneva, Switzerland, 2003; Available online: http://www.who.int/globalchange/environment/en/ccSCREEN.pdf?ua=1 (accessed on 15 June 2018).
- Ummenhofer, C.C.; Meehl, G.A. Extreme weather and climate events with ecological relevance: A review. Philos. Trans. R. Soc. B Biol. Sci. 2017, 372, 20160135. [Google Scholar] [CrossRef]
- Wu, X.; Lu, Y.; Zhou, S.; Chen, L.; Xu, B. Impact of climate change on human infectious diseases: Empirical evidence and human adaptation. Environ. Int. 2016, 86, 14–23. [Google Scholar] [CrossRef] [PubMed] [Green Version]
- Lavell, A.; Oppenheimer, M.; Diop, C.; Hess, J.; Lempert, R.; Li, J.; Muir-Wood, R.; Myeong, S.; Moser, S.; Takeuchi, K.; et al. Climate Change: New Dimensions in Disaster Risk, Exposure, Vulnerability, and Resilience; Cambridge University Press: Cambridge, UK, 2012. [Google Scholar]
- Hashim, J.H.; Hashim, Z. Climate Change, Extreme Weather Events, and Human Health Implications in the Asia Pacific Region. Asia Pacific J. Public Heal. 2016, 28, 8S–14S. [Google Scholar] [CrossRef] [PubMed]
- Gopalakrishnan, C. Water and disasters: A review and analysis of policy aspects. Int. J. Water Resour. Dev. 2013, 29, 250–271. [Google Scholar] [CrossRef]
- WMO. Manual on Flood Forecasting and Warning; World Meteorological Organization: Geneva, Switzerland, 2011; Available online: http://www.wmo.int/pages/prog/hwrp/publications/flood_forecasting_warning/WMO 1072_en.pdf (accessed on 7 June 2018).
- Curriero, F.C.; Patz, J.A.; Rose, J.B.; Lele, S. The association between extreme precipitation and waterborne disease outbreaks in the United States, 1948–1994. Am. J. Public Health 2001, 91, 1194–1199. [Google Scholar] [CrossRef] [PubMed]
- Nel, J.L.; Le Maitre, D.C.; Nel, D.C.; Reyers, B.; Archibald, S.; van Wilgen, B.W.; Forsyth, G.G.; Theron, A.K.; O’Farrell, P.J.; Kahinda, J.-M.M.; et al. Natural hazards in a changing world: A case for ecosystem-based management. PLoS One 2014, 9, e95942. [Google Scholar] [CrossRef]
- De Londe, L.R.; Coutinho, M.P.; Di Gregório, L.T.; Santos, L.B.L.; Soriano, É. Desastres relacionados à água no Brasil: Perspectivas e recomendações. Ambient Soc. 2014, 17, 133–152. [Google Scholar] [CrossRef]
- Xavier, D.R.; Barcellos, C.; da Barros, H.S.; de Magalhães, M.A.F.M.; de Matos, V.P.; de Pedroso, M.M. Organização, disponibilização e possibilidades de análise de dados sobre desastres de origem climática e seus impactos sobre a saúde no Brasil. Cien. Saude Colet. 2014, 19, 3657–3668. [Google Scholar] [CrossRef] [Green Version]
- Pereira, C.; Barata, M.; Trigo, A.; Pereira, C.; Barata, M.; Trigo, A. Social Cost of Leptospirosis Cases Attributed to the 2011 Disaster Striking Nova Friburgo, Brazil. Int. J. Environ. Res. Public Health 2014, 11, 4140–4157. [Google Scholar] [CrossRef]
- Davies, G.I.; McIver, L.; Kim, Y.; Hashizume, M.; Iddings, S.; Chan, V. Water-borne diseases and extreme weather events in Cambodia: Review of impacts and implications of climate change. Int. J. Environ. Res. Public Health 2014, 12, 191–213. [Google Scholar] [CrossRef]
- Ahern, M.; Kovats, R.S.; Wilkinson, P.; Few, R.; Matthies, F. Global Health Impacts of Floods: Epidemiologic Evidence. Epidemiol. Rev. 2005, 27, 36–46. [Google Scholar] [CrossRef] [PubMed] [Green Version]
- Frumkin, H.; Hess, J.; Luber, G.; Malilay, J.; McGeehin, M. Climate change: The public health response. Am. J. Public Health 2008, 98, 435–445. [Google Scholar] [CrossRef]
- Alderman, K.; Turner, L.R.; Tong, S. Floods and human health: A systematic review. Environ. Int. 2012, 47, 37–47. [Google Scholar] [CrossRef] [Green Version]
- Johnson, M.A.S.; Smith, H.; Joseph, P.; Gilman, R.H.; Bautista, C.T.; Campo, K.J.; Cespedes, M.; Klatsky, P.; Vidal, C.; Terry, H.; et al. Environmental exposure and leptospirosis, Peru. Emerg. Infect. Dis. 2004, 10, 1016–1022. [Google Scholar] [CrossRef]
- Sejvar, J.; Bancroft, E.; Winthrop, K.; Bettinger, J.; Bajani, M.; Bragg, S.; Shutt, K.; Kaiser, R.; Marano, N.; Popovic, T.; et al. Leptospirosis in ‘Eco-Challenge’ athletes, Malaysian Borneo, 2000. Emerg. Infect. Dis 2003, 9, 702–707. [Google Scholar] [CrossRef]
- Barcellos, C.; Sabroza, P.C. The place behind the case: Leptospirosis risks and associated environmental conditions in a flood-related outbreak in Rio de Janeiro. Cad. Saude Publica 2001, 17, 59–67. [Google Scholar] [CrossRef] [PubMed]
- Correa, M.O. Human leptospirosis in Brazil. Int. J. Zoonoses 1975, 2, 1–9. [Google Scholar]
- Ko, A.I.; Galvão Reis, M.; Ribeiro Dourado, C.M.; Johnson, W.D.; Riley, L.W. Urban epidemic of severe leptospirosis in Brazil. Lancet 1999, 354, 820–825. [Google Scholar] [CrossRef]
- Schneider, M.C.; Leonel, D.G.; Hamrick, P.N.; Pacheco De Caldas, E.; Velásquez, R.T.; Mendigaña Paez, F.A.; Caridad, J.; Arrebato, G.; Gerger, A.; Pereira, M.M.; et al. Leptospirosis in Latin America: Exploring the first set of regional data Original research. Rev. Panam. Salud Pública 2017, 41, e81. [Google Scholar]
- De Londe, L.R.; da Conceição, R.S.; Bernardes, T.; de Dias, M.C.A. Flood-related leptospirosis outbreaks in Brazil: Perspectives for a joint monitoring by health services and disaster monitoring centers. Nat. Hazards 2016, 84, 1419–1435. [Google Scholar] [CrossRef]
- Pelissari, D.M.; Maia-Elkhoury, A.N.S.; Arsky, M.D. Revisão sistemática dos fatores associados à leptospirose no Brasil, 2000–2009/Systematic review of factors associated to leptospirosis in Brazil, 2000–2009. Epidemiol. Serv. Saúde 2011, 20, 565–574. [Google Scholar] [CrossRef]
- Vieira, M.L.; Gama-Simões, M.J.; Collares-Pereira, M. Human leptospirosis in Portugal: A retrospective study of eighteen years. Int. J. Infect. Dis. 2006, 10, 378–386. [Google Scholar] [CrossRef] [PubMed]
- Hagan, J.E.; Moraga, P.; Costa, F.; Capian, N.; Ribeiro, G.S.; Wunder, E.A.; Felzemburgh, R.D.M.; Reis, R.B.; Nery, N.; Santana, F.S.; et al. Spatiotemporal deter- minants of urban leptospirosis transmission: Four-year prospective cohort study of slum residents in Brazil. PLoS Negl. Trop. Dis. 2016, 10, e0004275. [Google Scholar] [CrossRef]
- Doocy, S.; Daniels, A.; Murray, S.; Kirsch, T.D. The human impact of floods: A historical review of events and systematic literature review. PLoS Curr. 2013. [CrossRef]
- Reis, S.; Morris, G.; Fleming, L.E.; Beck, S.; Taylor, T.; White, M.; Depledge, M.H.; Steinle, S.; Sabel, C.E.; Cowie, H.; et al. Integrating health and environmental impact analysis. Public Health 2015, 129, 1383–1389. [Google Scholar] [CrossRef] [PubMed] [Green Version]
- UN. Global Assessment Report on Disaster Risk Reduction: Risk and Poverty in a Changing Climate; United Nations: Washington, DC, USA, 2009; Available online: https://www.preventionweb.net/english/hyogo/gar/report/documents/GAR_Cover.pdf (accessed on 11 June 2018).
- Schmitt, L.H.M.; Graham, H.M.; White, P.C.L. Economic Evaluations of the Health Impacts of Weather-Related Extreme Events: A Scoping Review. Int. J. Environ. Res. Public Health 2016, 13, 1105. [Google Scholar] [CrossRef] [PubMed]
- O’Sullivan, J.J.; Bradford, R.A.; Bonaiuto, M.; De Dominicis, S.; Rotko, P.; Aaltonen, J.; Waylen, K.; Langan, S.J. Enhancing flood resilience through improved risk communications. Nat. Hazards Earth Syst. Sci. 2012, 12, 2271–2282. [Google Scholar] [Green Version]
- IBGE IB de G e E. Brasil em Síntese: Santa Catarina: Panorama: População; Instituto Brasileiro de Geografia e Estatística: Rio de Janeiro, Brasil, 2010. Available online: https://cidades.ibge.gov.br/brasil/sc/panorama (accessed on 12 June 2018).
- Paludo, J.R.; Borba, J. Abastecimento de água e esgotamento sanitário: Estudo comparado de modelos de gestão em Santa Catarina. Ambient Soc. 2013, 16, 59–78. [Google Scholar] [CrossRef]
- De Cardoso, C.S.; Bitencourt, D.P.; Mendonça, M. Comportamento do vento no setor leste de Santa Catarina sob influência de ciclones extratropicais. Rev. Bras. Meteorol. 2012, 27, 39–48. [Google Scholar] [CrossRef] [Green Version]
- Minervino, A.C.; Duarte, E.C. Loss and damage affecting the public health sector and society resulting from flooding and flash floods in Brazil between 2010 and 2014—based on data from national and global information systems. Cien. Saude Colet 2016, 21, 685–694. [Google Scholar] [CrossRef]
- Lane, K.; Charles-Guzman, K.; Wheeler, K.; Abid, Z.; Graber, N.; Matte, T. Health effects of coastal storms and flooding in urban areas: A review and vulnerability assessment. J. Environ. Public Health 2013, 913064. [Google Scholar] [CrossRef]
- Minervino, A.C.; Duarte, E.C. Danos materiais causados à Saúde Pública e à sociedade decorrentes de inundações e enxurradas no Brasil, 2010–2014: Dados originados dos sistemas de informação global e nacional. Cien. Saude Colet. 2016, 21, 685–694. [Google Scholar] [CrossRef]
- Guimarães, R.M.; Cruz, O.G.; Parreira, V.G.; Mazoto, M.L.; Vieira, J.D.; Asmus, C.I.R.F. Análise temporal da relação entre leptospirose e ocorrência de inundações por chuvas no município do Rio de Janeiro, Brasil, 2007–2012. Cien. Saude Colet. 2014, 19, 3683–3692. [Google Scholar] [CrossRef] [PubMed]
- Xiao, C.; Wu, P.; Zhang, L.; Song, L. Robust increase in extreme summer rainfall intensity during the past four decades observed in China. Sci. Rep. 2016, 6, 38506. [Google Scholar] [CrossRef] [PubMed] [Green Version]
- Kabir, R.; Khan, H.T.A.; Ball, E.; Caldwell, K. Climate change impact: The experience of the coastal areas of Bangladesh affected by cyclones Sidr and Aila. J. Environ. Public Health 2016, 1–9. [Google Scholar] [CrossRef]
- Waggoner, J.J.; Pinsky, B.A. Molecular diagnostics for human leptospirosis. Curr. Opin. Infect. Dis. 2016, 29, 440–445. [Google Scholar] [CrossRef] [PubMed]
- Filho, J.G.; Nazário, N.O.; Freitas, P.F.; de Pinto, G.A.; Schlindwein, A.D. Temporal analysis of the relationship between leptospirosis, rainfall levels and seasonality, Santa Catarina, Brazil, 2005–2015. Rev. Inst. Med. Trop. Sao Paulo 2018, 60. [Google Scholar] [CrossRef]
Figure 1.
Location of the State of Santa Catarina (top left panel); elevation (top right panel); map of Santa Catarina’s Health macro-regions (lower panel).
Figure 1.
Location of the State of Santa Catarina (top left panel); elevation (top right panel); map of Santa Catarina’s Health macro-regions (lower panel).

Figure 2.
Average accumulated monthly precipitation in the State of Santa Catarina between the years 2005 to 2014.
Figure 2.
Average accumulated monthly precipitation in the State of Santa Catarina between the years 2005 to 2014.

Figure 3.
Time series of the number of monthly Hydrological Events (in blue) and hospitalization rates for Leptospirosis (in black) by Health Macro-region between the years 2005 and 2014.
Figure 3.
Time series of the number of monthly Hydrological Events (in blue) and hospitalization rates for Leptospirosis (in black) by Health Macro-region between the years 2005 and 2014.

Figure 4.
Santa Catarina’s coastal and inland hospitalization rates for Leptospirosis between the years 2005 and 2014.
Figure 4.
Santa Catarina’s coastal and inland hospitalization rates for Leptospirosis between the years 2005 and 2014.

Figure 5.
(a) association between the number of monthly Hydrological Events and hospitalization rates for Leptospirosis in coastal and inland areas for three classes (class 1: < 7 HE, class 2: 8 < HE < 15, class 3: >15 HE events) between the years 2005 and 2014; (b) higher incidence of hospitalization rates for Leptospirosis for class 1 (HE < 7 events) in yellow and class 3 (HE > 15 events) in red.


Table 1.
Number of HE by Health Macro-regions in the State of Santa Catarina between the years 2005 and 2014.
Table 1.
Number of HE by Health Macro-regions in the State of Santa Catarina between the years 2005 and 2014.
| Macro-Regions | Number Of Flash Floods | Number Of Floods | Number Of Flooding | Total Number Of Events |
|---|---|---|---|---|
| Greater Florianopolis | 175 | 03 | 01 | 179 |
| Northeast | 113 | 01 | 01 | 115 |
| Northern Plateau | 62 | 22 | 07 | 91 |
| Serrano Plateau | 63 | 06 | 01 | 70 |
| River Itajaí Estuary | 103 | 05 | 02 | 110 |
| Southern ST. Catarina | 318 | 06 | 07 | 331 |
| Itajaí Valley | 349 | 20 | 03 | 372 |
| Midwest | 163 | 07 | 10 | 180 |
| Extreme West | 195 | 19 | 02 | 216 |
Source: Secretary of State for Civil Defense of Santa Catarina.
Table 2.
Spearman Correlation Coefficients Year by Health Macro-region, for Leptospirosis hospitalization rates versus hydrological events, years 2005 to 2014.
Table 2.
Spearman Correlation Coefficients Year by Health Macro-region, for Leptospirosis hospitalization rates versus hydrological events, years 2005 to 2014.
| Spearman Correlations | |||||||||||||
|---|---|---|---|---|---|---|---|---|---|---|---|---|---|
| Health Macro-Region | Leptospirosis Hospitalization Rate | ||||||||||||
| Year | |||||||||||||
| 2005 | 2006 | 2007 | 2008 | 2009 | 2010 | 2011 | 2012 | 2013 | 2014 | 2005/2014 | |||
| Hydrological Events | Greater Florianopolis | Coef. | 0.032 | −0.044 | 0.028 | 0.612 * | 0.352 | 0.441 | 0.635 * | (1) | 0.656 * | 0.088 | 0.378 ** |
| Sig. | 0.921 | 0.893 | 0.931 | 0.035 | 0.262 | 0.151 | 0,026 | 0.020 | 0.785 | 0.000 | |||
| Northeast | Coef. | −0.220 | −0.227 | 0.196 | 0.740 ** | −0.221 | 0.416 | 0.608 * | 0.485 | (1) | 0.155 | 0.279 ** | |
| Sig. | 0.492 | 0.478 | 0.542 | 0.006 | 0.490 | 0.178 | 0.036 | 0.110 | 0.631 | 0.002 | |||
| North Plateau | Coef. | (2) | 0.105 | (1) | −0.134 | −0.134 | 0.393 | −0.326 | (1) | −0.069 | 0.448 | −0.042 | |
| Sig. | 0.745 | 0.677 | 0.677 | 0.207 | 0.300 | 0.832 | 0.144 | 0.648 | |||||
| Serrano Plateau | Coef. | 0.109 | (2) | −0.094 | 0.335 | (2) | −0.255 | −0.260 | (1) | (1) | (1) (2) | −0.042 | |
| Sig. | 0.736 | 0.772 | 0.287 | 0.424 | 0.415 | 0.648 | |||||||
| River Itajaí Estuary | Coef. | (1) | (1) | −0.312 | 0.405 | −0.007 | −0.524 | 0.276 | −0.285 | 0.390 | −0.049 | −0.032 | |
| Sig. | 0.323 | 0.192 | 0.983 | 0.080 | 0.384 | 0.368 | 0.210 | 0.880 | 0.725 | ||||
| Southern St. Catarina | Coef. | −0.083 | 0.496 | −0.277 | 0.372 | 0.000 | 0.713** | 0.261 | 0.353 | 0.047 | 0.182 | 0.197 * | |
| Sig. | 0.798 | 0.101 | 0.383 | 0.234 | 1.000 | 0.009 | 0.412 | 0.260 | 0.886 | 0.572 | 0.031 | ||
| Itajaí Valley | Coef. | 0.221 | 0.459 | 0.330 | 0.722 ** | 0.658 * | 0.701 * | 0.613 * | 0.397 | (1) | 0.655 * | 0.338 ** | |
| Sig. | 0.491 | 0.133 | 0.295 | 0.008 | 0.020 | 0.011 | 0.034 | 0.201 | 0.021 | 0.000 | |||
| Midwest | Coef. | 0.139 | −0.143 | −0.139 | −0.144 | −0.255 | 0.000 | 0.432 | −0.046 | −0.134 | 0.388 | 0.011 | |
| Sig. | 0.667 | 0.657 | 0.667 | 0.656 | 0.424 | 1.000 | 0.161 | 0.886 | 0.677 | 0.213 | 0.906 | ||
| Extreme West | Coef | 0.111 | (1) | 0.191 | −0.496 | 0.044 | −0.256 | 0.070 | (1) | −0.395 | 0.077 | −0.055 | |
| Sig. | 0.730 | 0.551 | 0,101 | 0.892 | 0.421 | 0.829 | 0.203 | 0.812 | 0.551 | ||||
| N | 12 | 12 | 12 | 12 | 12 | 12 | 12 | 12 | 12 | 12 | 120 | ||
* The correlation is significant at the 0.05 level; ** The correlation is significant at the 0.01 level; (1) There is no registry this year of HE; (2) Rate of hospitalization = 0.
© 2019 by the authors. Licensee MDPI, Basel, Switzerland. This article is an open access article distributed under the terms and conditions of the Creative Commons Attribution (CC BY) license (http://creativecommons.org/licenses/by/4.0/).
Share and Cite
MDPI and ACS Style
Ercides Péres, W.; Russo, A.; Nunes, B. The Association between Hydro-Meteorological Events and Leptospirosis Hospitalizations in Santa Catarina, Brazil. Water 2019, 11, 1052. https://doi.org/10.3390/w11051052
AMA Style
Ercides Péres W, Russo A, Nunes B. The Association between Hydro-Meteorological Events and Leptospirosis Hospitalizations in Santa Catarina, Brazil. Water. 2019; 11(5):1052. https://doi.org/10.3390/w11051052
Chicago/Turabian StyleErcides Péres, Wolmir, Ana Russo, and Baltazar Nunes. 2019. "The Association between Hydro-Meteorological Events and Leptospirosis Hospitalizations in Santa Catarina, Brazil" Water 11, no. 5: 1052. https://doi.org/10.3390/w11051052
Note that from the first issue of 2016, this journal uses article numbers instead of page numbers. See further details here.