Article

A Pilot Study of an Electromagnetic Field for Control of Reverse Osmosis Membrane Fouling and Scaling During Brackish Groundwater Desalination

1
Department of Civil Engineering, New Mexico State University, Las Cruces, NM 88003, USA
2
Brackish Groundwater National Desalination Research Facility, Alamogordo, NM 88310, USA
*
Author to whom correspondence should be addressed.
Water 2019, 11(5), 1015; https://doi.org/10.3390/w11051015
Submission received: 4 May 2019 / Revised: 10 May 2019 / Accepted: 10 May 2019 / Published: 15 May 2019
(This article belongs to the Section Wastewater Treatment and Reuse)

Abstract

:
This study investigated the effects of an electromagnetic field (EMF) on control of membrane fouling and scaling during desalination of brackish groundwater using a pilot reverse osmosis (RO) skid. The groundwater was primarily CaSO4 type with a total dissolved solids concentration of 5850 mg/L and hardness of 2500 mg/L as CaCO3. Two EMF devices were installed in the pipeline before a cartridge filter and in the RO feed inlet to induce an electric signal of ±150 kHz to the groundwater. The effects of EMF on membrane scaling were evaluated under accelerated conditions, i.e., without pH adjustment and addition of antiscalant. Two-phase experiments were conducted: Phase 1 (376 h) with the EMF devices turned on after 150 h baseline operation; and Phase 2 (753 h) with the EMF devices turned on from the beginning of testing. The EMF significantly reduced membrane scaling and improved RO performance by 38.3% and 14.3% in terms of normalized water permeability decline rate after 150 h and 370 h operation, respectively. Membrane autopsy results indicated that the fouling layer formed under the influence of EMF was loose with a low density and was easily removed by hydraulic flushing.

1. Introduction

Use of alternative water sources has become a viable solution to augment freshwater supplies. Reverse osmosis (RO) is a prevalent desalination process to treat seawater, reclaimed water, and brackish water [1,2]. One of the limitations of the RO process is membrane fouling and scaling caused by accumulation and precipitation of the rejected constituents. Membrane autopsy using scanning electron microscopy, energy dispersive X-ray microanalysis, X-ray diffraction, and other advanced analytical methods indicated membrane fouling and scaling are primarily caused by precipitation of colloidal particles, organic matter, sparingly soluble salts such as silica, calcium sulfate, calcium carbonate, barium sulfate, calcium phosphate, and calcium fluoride after water is filtered through the membrane under high hydraulic pressure [3,4,5,6]. Membrane fouling and scaling reduce membrane performance and increase operating and maintenance costs. Several methods have been developed to control membrane fouling and scaling, such as pretreatment of feedwater, membrane monitoring and cleaning, development of new anti-fouling membranes, and optimization of operating conditions [7,8,9,10]. Common pretreatment for feedwater includes coagulation, addition of acid/antiscalant, media filtration, disinfection, etc. [11]. With these conventional pretreatment methods, RO typically operates at 75–85% water recovery limited by membrane fouling and scaling during desalination of brackish water and reclaimed water [4,6,12,13]. Periodic chemical cleaning (e.g., every 3–4 months) is needed to restore membrane performance. Higher water recovery (>90%) can be achieved when extensive pretreatment is applied, such as softening with lime and ion-exchange resins [14,15]. A combination of brackish RO with electrodialysis [16] or brine evaporator [17] can achieve a water recovery of 90–98%. A semi-batch process such as closed-circuit reverse osmosis (CCRO) can also reach a water recovery higher than 90% with lower energy consumption as compared to standard continuous once-through RO process [18].
Electromagnetic field (EMF) is a non-chemical water treatment process where water passes through an electric, a magnetic, or an electromagnetic field to reduce potential fouling and scaling on the membrane surface [19,20]. The application of EMF for water treatment dates back to the 19th century [21,22,23]. EMF treatment includes employing fixed permanent magnets or fixed electromagnets to induce a magnetic field; employing alternative current through solenoid coils that wrap around or are positioned near an existing pipe to induce an EMF; or employing an electric field by directly putting discharge electrodes in contact with water [20]. A commercially available EMF device typically includes a signal generator and a treatment module [20].
The effectiveness of EMF in the control of membrane fouling and scaling has been controversial; there are successful and failed cases that EMF was effective for scaling control. For example, GrahamTek employed EMF in brackish water reverse osmosis (BWRO) and reported a much slower rate of membrane fouling and scaling (<5% after 41 days) [24]. The testing was promising, but there was a lack of further investigation of the EMF mechanisms for the observed results [24]. Al-Qahtani applied EMF to a RO process and observed higher salt rejection when a constant magnetic field was applied as pretreatment for seawater desalination [25]. Zhang et al. revealed that the critical flux of the RO module decreased by 25–50% and fouling was mitigated in an alternating current (AC) field, which is similar to the GrahamTek EMF device [26]. With a solenoid coil wound around an RO membrane module, Ruina et al. observed an enhanced salt rejection and permeate flow rate as well as a powdery form of CaCO3 precipitates with lower density [19].
Different mechanisms for scaling prevention by EMF have been proposed based on their specific experimental results. Some studies suggested that EMF treatment was able to activate colloidal silica in water that leads to adsorption of metal ions (such as Ca2+), and then precipitation in bulk solution through particle coagulation processes. These particles tend to remain in the bulk solution rather than precipitate onto the RO membrane surface [27,28,29]. Some studies discovered that EMF treatment favored homogenous precipitation (in the bulk solution) rather than heterogenous precipitation (on the membrane surface). The precipitates in the bulk solution can be washed away easily by the concentrate flow, resulting in less scaling [19,30]. It has also been reported in other studies that with EMF treatment, CaCO3 formed on the membrane surface as clusters of small and powdery calcite, rather than dense and sticky aragonite [19,31].
Yet, EMF treatment has been sometimes proven to be ineffective in retarding scale formation [32]. For example, Corbett observed EMF was ineffective in the RO process and a significant amount of CaSO4 scaled on the membrane spacer [33]. The reported controversial results are likely related to the use of different types of magnetic or electromagnetic devices, with different frequency and intensity; non-standardized methods; variations in water composition; or differences in the course of the treatment [34]. The efficiency of magnetic water treatment could also depend on the nature of the pipe materials through which the magnetic field is applied [35]. Moreover, some research found EMF could not adequately control scaling under harsh conditions [24,36]. Therefore, further research is required to better understand the EMF mechanisms and demonstrate the effectiveness of EMF for scale control in different water matrices.
In this study, the effectiveness of EMF in RO membrane fouling and scaling was evaluated under well-controlled comparative conditions using a pilot RO skid to desalinate “hard-to-treat” CaSO4 type brackish groundwater with a total dissolved solids (TDS) concentration of 5850 mg/L. The EMF units manufactured by HydroFLOW (Redmond, WA, USA), were residential water conditioning devices, powered by Hydropath technology. These EMF devices induce an electric signal of ±150 kHz in the liquid inside a metal pipe on which they are installed. A specialized transducer connected to a ring of ferrites performs the electric induction.
The objectives of the study were fourfold: (1) to demonstrate if EMF treatment could reduce membrane fouling and scaling during desalination of a challenging groundwater through the testing with and without the installation of the EMF devices; (2) to investigate the effectiveness of EMF devices for cleaning of fouled or scaled membranes; (3) to examine the impact of EMF on solute transport through RO membranes; and (4) to elucidate the mechanisms of EMF treatment in the control of membrane fouling and scaling by analysis of membrane operational performance coupled with membrane autopsy results.

2. Materials and Methods

2.1. Groundwater Quality

The Brackish Groundwater National Desalination Research Facility (BGNDRF) in Alamogordo, New Mexico, has four brackish groundwater wells that provide different source waters to the test bay area throughout the facility. The pilot-scale experiments were conducted at BGNDRF using Well 2 groundwater as feedwater because it has the highest concentrations of TDS (5670 ± 346 mg/L), total hardness (2488 ± 42 mg/L as CaCO3), sulfate (2953 ± 235 mg/L), and dissolved silica (22.5 ± 1.6 mg/L). The groundwater from Well 1 was selected to perform hydraulic flushing to restore membrane performance during the experiment. Table 1 summarizes the water quality of the groundwater from Well 1 and Well 2. More detailed water quality analysis is also available and can be accessed at the BGNDRF website [37].

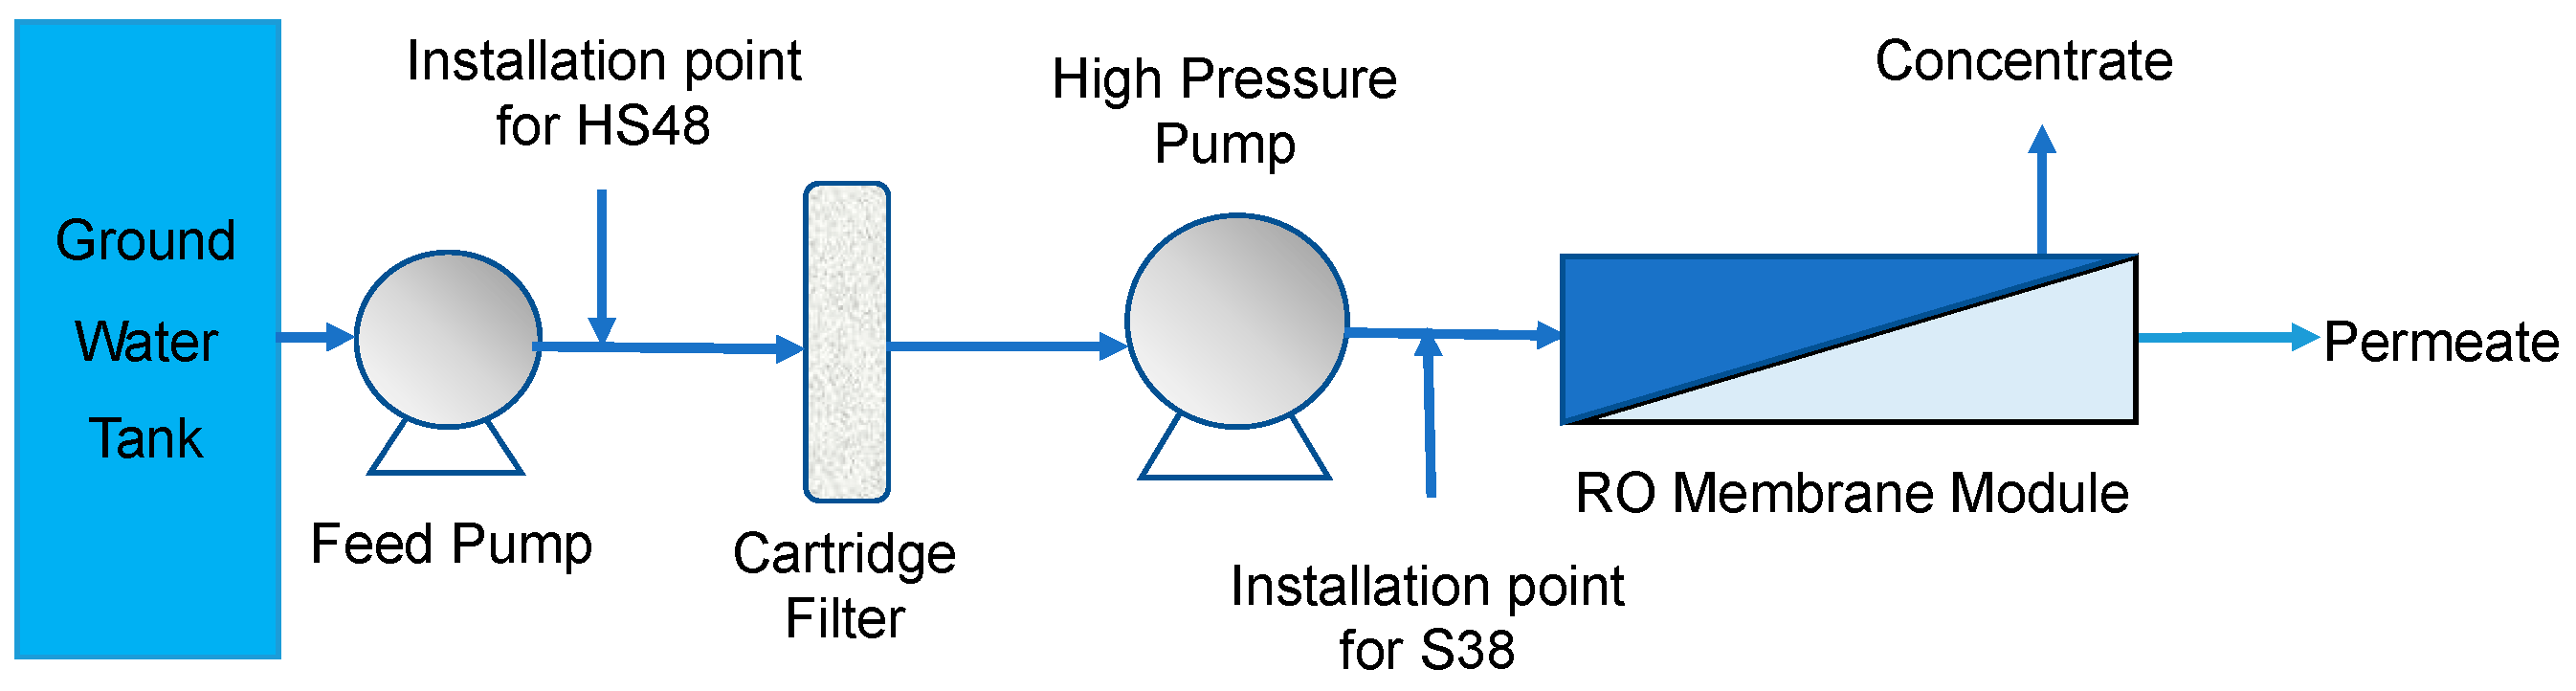
2.2. Pilot-Scale RO System

Figure 1 shows the pilot-scale RO skid at BGNDRF. It includes three RO membrane elements in series within a pressure vessel to treat the Well 2 groundwater. Brackish water RO membranes BW30-4040 manufactured by DOW FILMTECTM (DOW, Midland, MI, USA) were used in this study.
RO system performance was simulated by Reverse Osmosis System Analysis software (ROSA, version 9.1, DOW, Midland MI, USA) to estimate the hydrodynamic conditions, salt rejection, and scaling indices. ROSA is a commercially available software for the design of desalination processes to meet required water treatment specifications using the RO membranes manufactured by the DOW FILMTECTM. Scaling calculation in this study was simulated using the ROSA model, and the results are summarized in Table 2. The feedwater flow rate was set to 22.7 L/min (6 gpm) and the system recovery was set to 50% in the simulation. Based on the ROSA modeling, the major scalants are expected to be calcium-based, in particular calcium sulfate. Barium sulfate and strontium sulfate may also precipitate on the membrane surface.
Pilot-scale experiments were conducted in two phases independently; new membranes were used in each phase to ensure a defensible comparison between the tests. In both phases, water recovery increased gradually from 20% (6 h) to 30% (24 h) to 45% (47 h), then remained at 50% throughout the testing. The operating pressure for the RO skid during the study was kept at 1241 ± 69 kPa (180 ± 10 psi). The initial feedwater flow rate was 22.7 L/min, but gradually decreased due to membrane fouling and clogging of feed flow channels. In Phase 1 (P1, the control phase), HydroFLOW devices were installed and turned on when the permeate flux declined by 35% after 150 h of operation, aiming to investigate the RO membrane fouling and scaling without the EMF and the effectiveness of the EMF in cleaning of fouled and scaled membranes. In Phase 2 (P2), the HydroFLOW devices were installed and turned on from the beginning of testing with installation of new membranes. The total operating elapsed time was 381 h for P1 and 844 h for P2. The RO system was turned off and flushed using Well 1 water to recover the membrane performance when the normalized water permeability (NWP) declined by more than 60% during the P1 experiment and 80% during the P2 experiment. Also, no chemicals (e.g., acid or antiscalant) were added to the RO feedwater in order to accelerate and challenge membrane fouling and scaling.
The cartridge filters used in this study were GE LD 05-20, with a length of 50.8 cm (20″) and 5 μm nominal pore size.

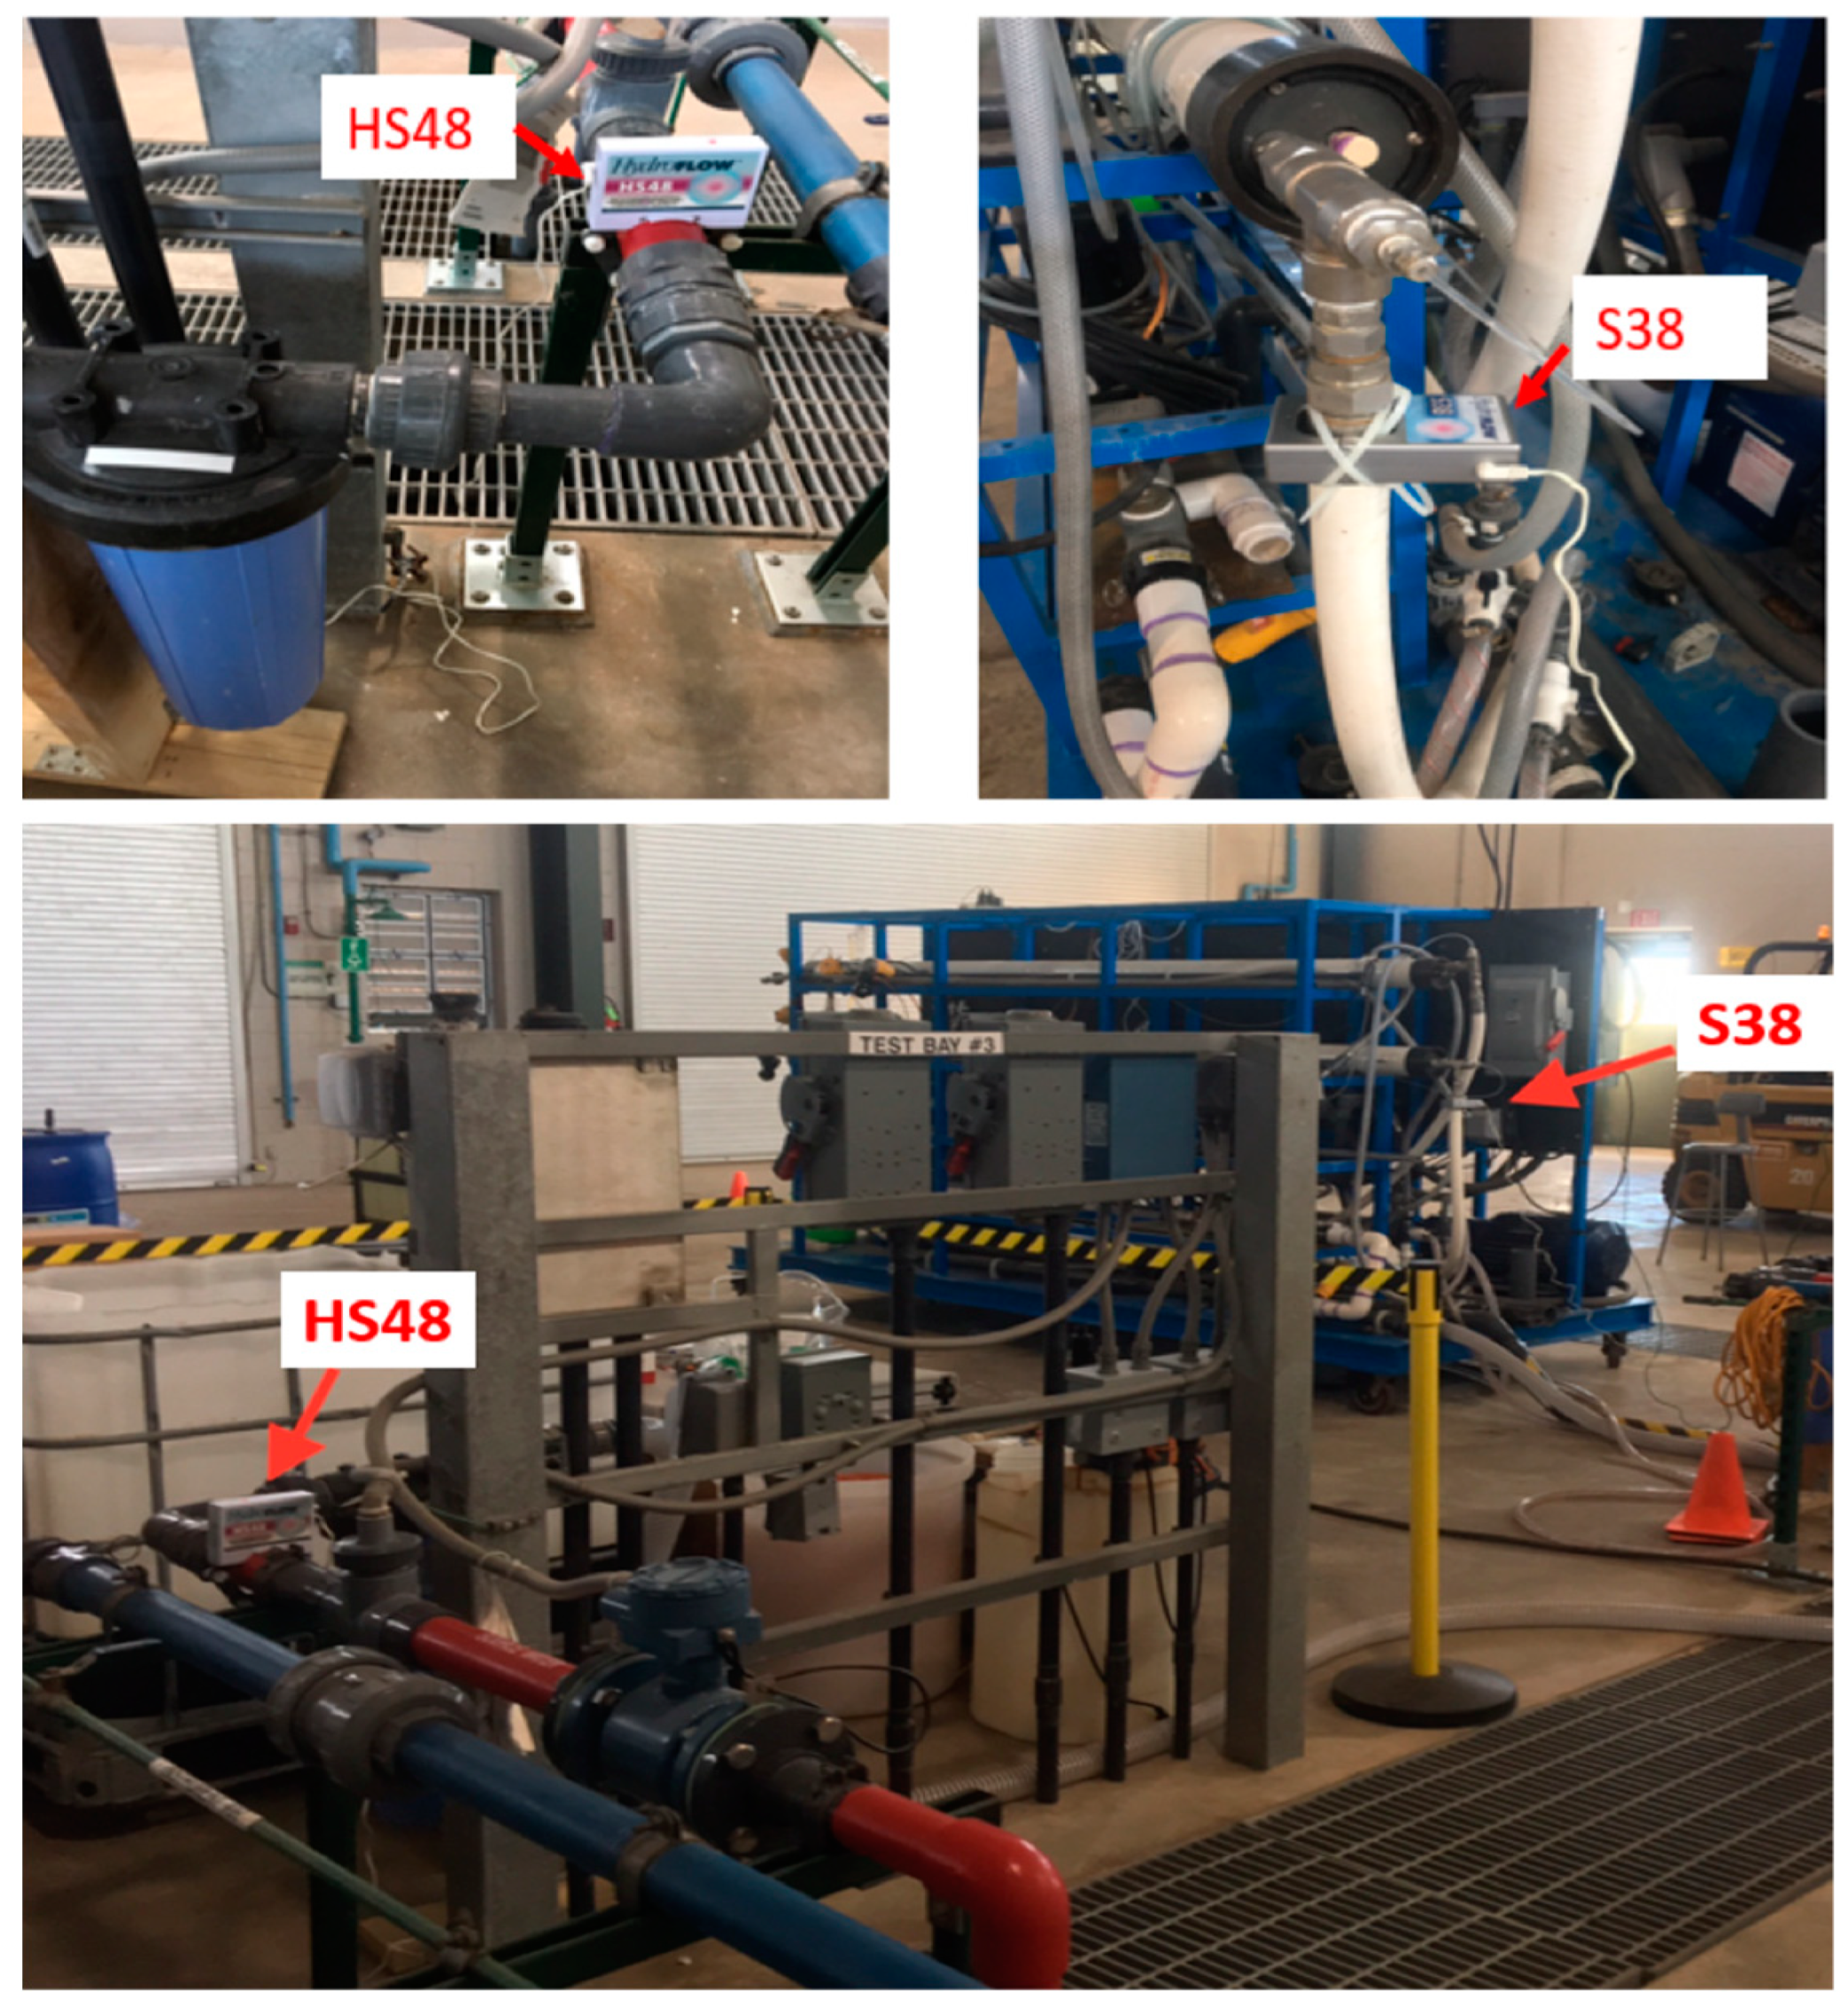
2.3. HydroFLOW Devices

The HydroFLOW Models S38 and HS48 are residential water conditioning devices with a specialized transducer connected to a ring of ferrites that performs the electric induction and induces an electric signal of ±150 kHz in feedwater. The S38 and the HS48 fit pipes up to 38 mm (1½) and 63 mm (2½) outer diameter, respectively. The max. power for both devices is 1.2 W. Both devices were calibrated using an Owon HDS handheld digital storage oscilloscope and digital multimeter (Model HDS1021M-N, Canada) before installation. The voltage of the Hydropath sine wave signal was measured to be 17.2 volts. The HS48 was installed before the 5 µm cartridge filter to prevent the clogging of the fiber filter by sediments while the S38 was installed in the inlet of the RO vessel to control membrane fouling and scaling. Their installation points are shown in Figure 1 and Figure 2.

2.4. Analytical Methods

Water flow rate and quality of the feed, permeate, and concentrate streams were monitored throughout the experiments. Water flow rate was monitored through online sensors. Conductivity, pH and temperature were measured using a hand-held conductivity and pH meter (Model 431-61, Cole-Parmer, Vernon Hills, IL, USA). Common cations and anions including sodium, calcium, magnesium, potassium, chloride, and sulfate were measured using an ion chromatograph (IC, ICS-2100, Dionex, Sunnyvale, CA, USA). The groundwater quality and water temperature remained relatively stable during the experiments.
After testing in each phase, membrane elements were removed from the RO skid for autopsy. The RO membrane samples from the lead and tail-end elements were characterized by a scanning electron microscope (SEM, S-3400N II, Hitachi High-Technologies Corp, Pleasanton, CA, USA) and energy dispersive X-ray microanalysis (EDX, Noran System Six 300, Thermo Electron Corp., Waltham, MA, USA). The crystalline structure of the deposits on the membrane surface was analyzed by X-ray diffraction (XRD, Empyrean Powder Diffractometer, PANalytical, Netherlands), carried out in a Rigaku Miniflex-II with Cu Kα (λ = 1.5406 Å) radiation, 40 kV/40 mA current and kβ-filter. The spectra were obtained at the photoelectron takeoff angles of 5° to 85° in 2θ. The evaluation of the XRD spectra was performed using Jade software (Version 6.5.26, Materials Data, Inc., Livermore, CA, USA).

2.5. Calculations

The membrane performance was evaluated in terms of salt rejection, water recovery, normalized water permeability at 25 °C (NWP, also known as normalized specific water flux), NWP decreasing rate (k), and conductivity of the RO permeate. The experimental parameters calculated in this study were based on the feed concentration of RO influent, averages of permeate concentration, and pressures of the feed inlet and concentrate outlet of the pilot RO skid. The impact of feed spacer geometry on the hydrodynamic conditions and concentration polarization along the RO vessel was not investigated in this study [38]. Salt rejection, pressure drop, and membrane permeability were not studied individually for each RO element, but for the whole RO vessel.
Salt removal in terms of conductivity reduction or ion rejection is defined as
R e j e c t i o n   ( % ) = ( 1 C p C f ) × 100
where Cp and Cf are electrical conductivities (mS/cm) in the permeate and the feedwater, respectively.
The water recovery is the percentage of permeate water flow over feedwater flow given by
R e c o v e r y   ( % ) = Q p Q f × 100
where Qp and Qf are flow rates (L/min, liter per minute) of the permeate and the feedwater, respectively.
The normalized water permeability (NWP, liter per m2 per h per kPa, Lmh/kPa) corrected to 25 °C is calculated based on Equation (3) [39].
N W P = 60 × Q p A × N D F × T C F
where Qp is the permeate flow rate (L/min), A is the membrane active surface area (m2), and NDF is the net driving pressure (kPa). The temperature-corrected factor (TCF) is calculated by
T C F = e x
where the variable ‘x’ in Equation (4) is calculated by
x = U × ( 1 T a + 273 1 T s + 273 )
where Ta is the actual water temperature, Ts is the standard temperature of 25 °C, and U is the temperature-corrected flux coefficient that is membrane specific (2300 for most thin film polyamide membranes).
The decreasing rate k (Lmh/kPa-h) of the NWP is calculated using the absolute slope value of the NWP decline curve as a function of operation time:
k = Δ N W P Δ T
where Δ T is the operation time (h) for the changed NWP.

3. Results and Discussion

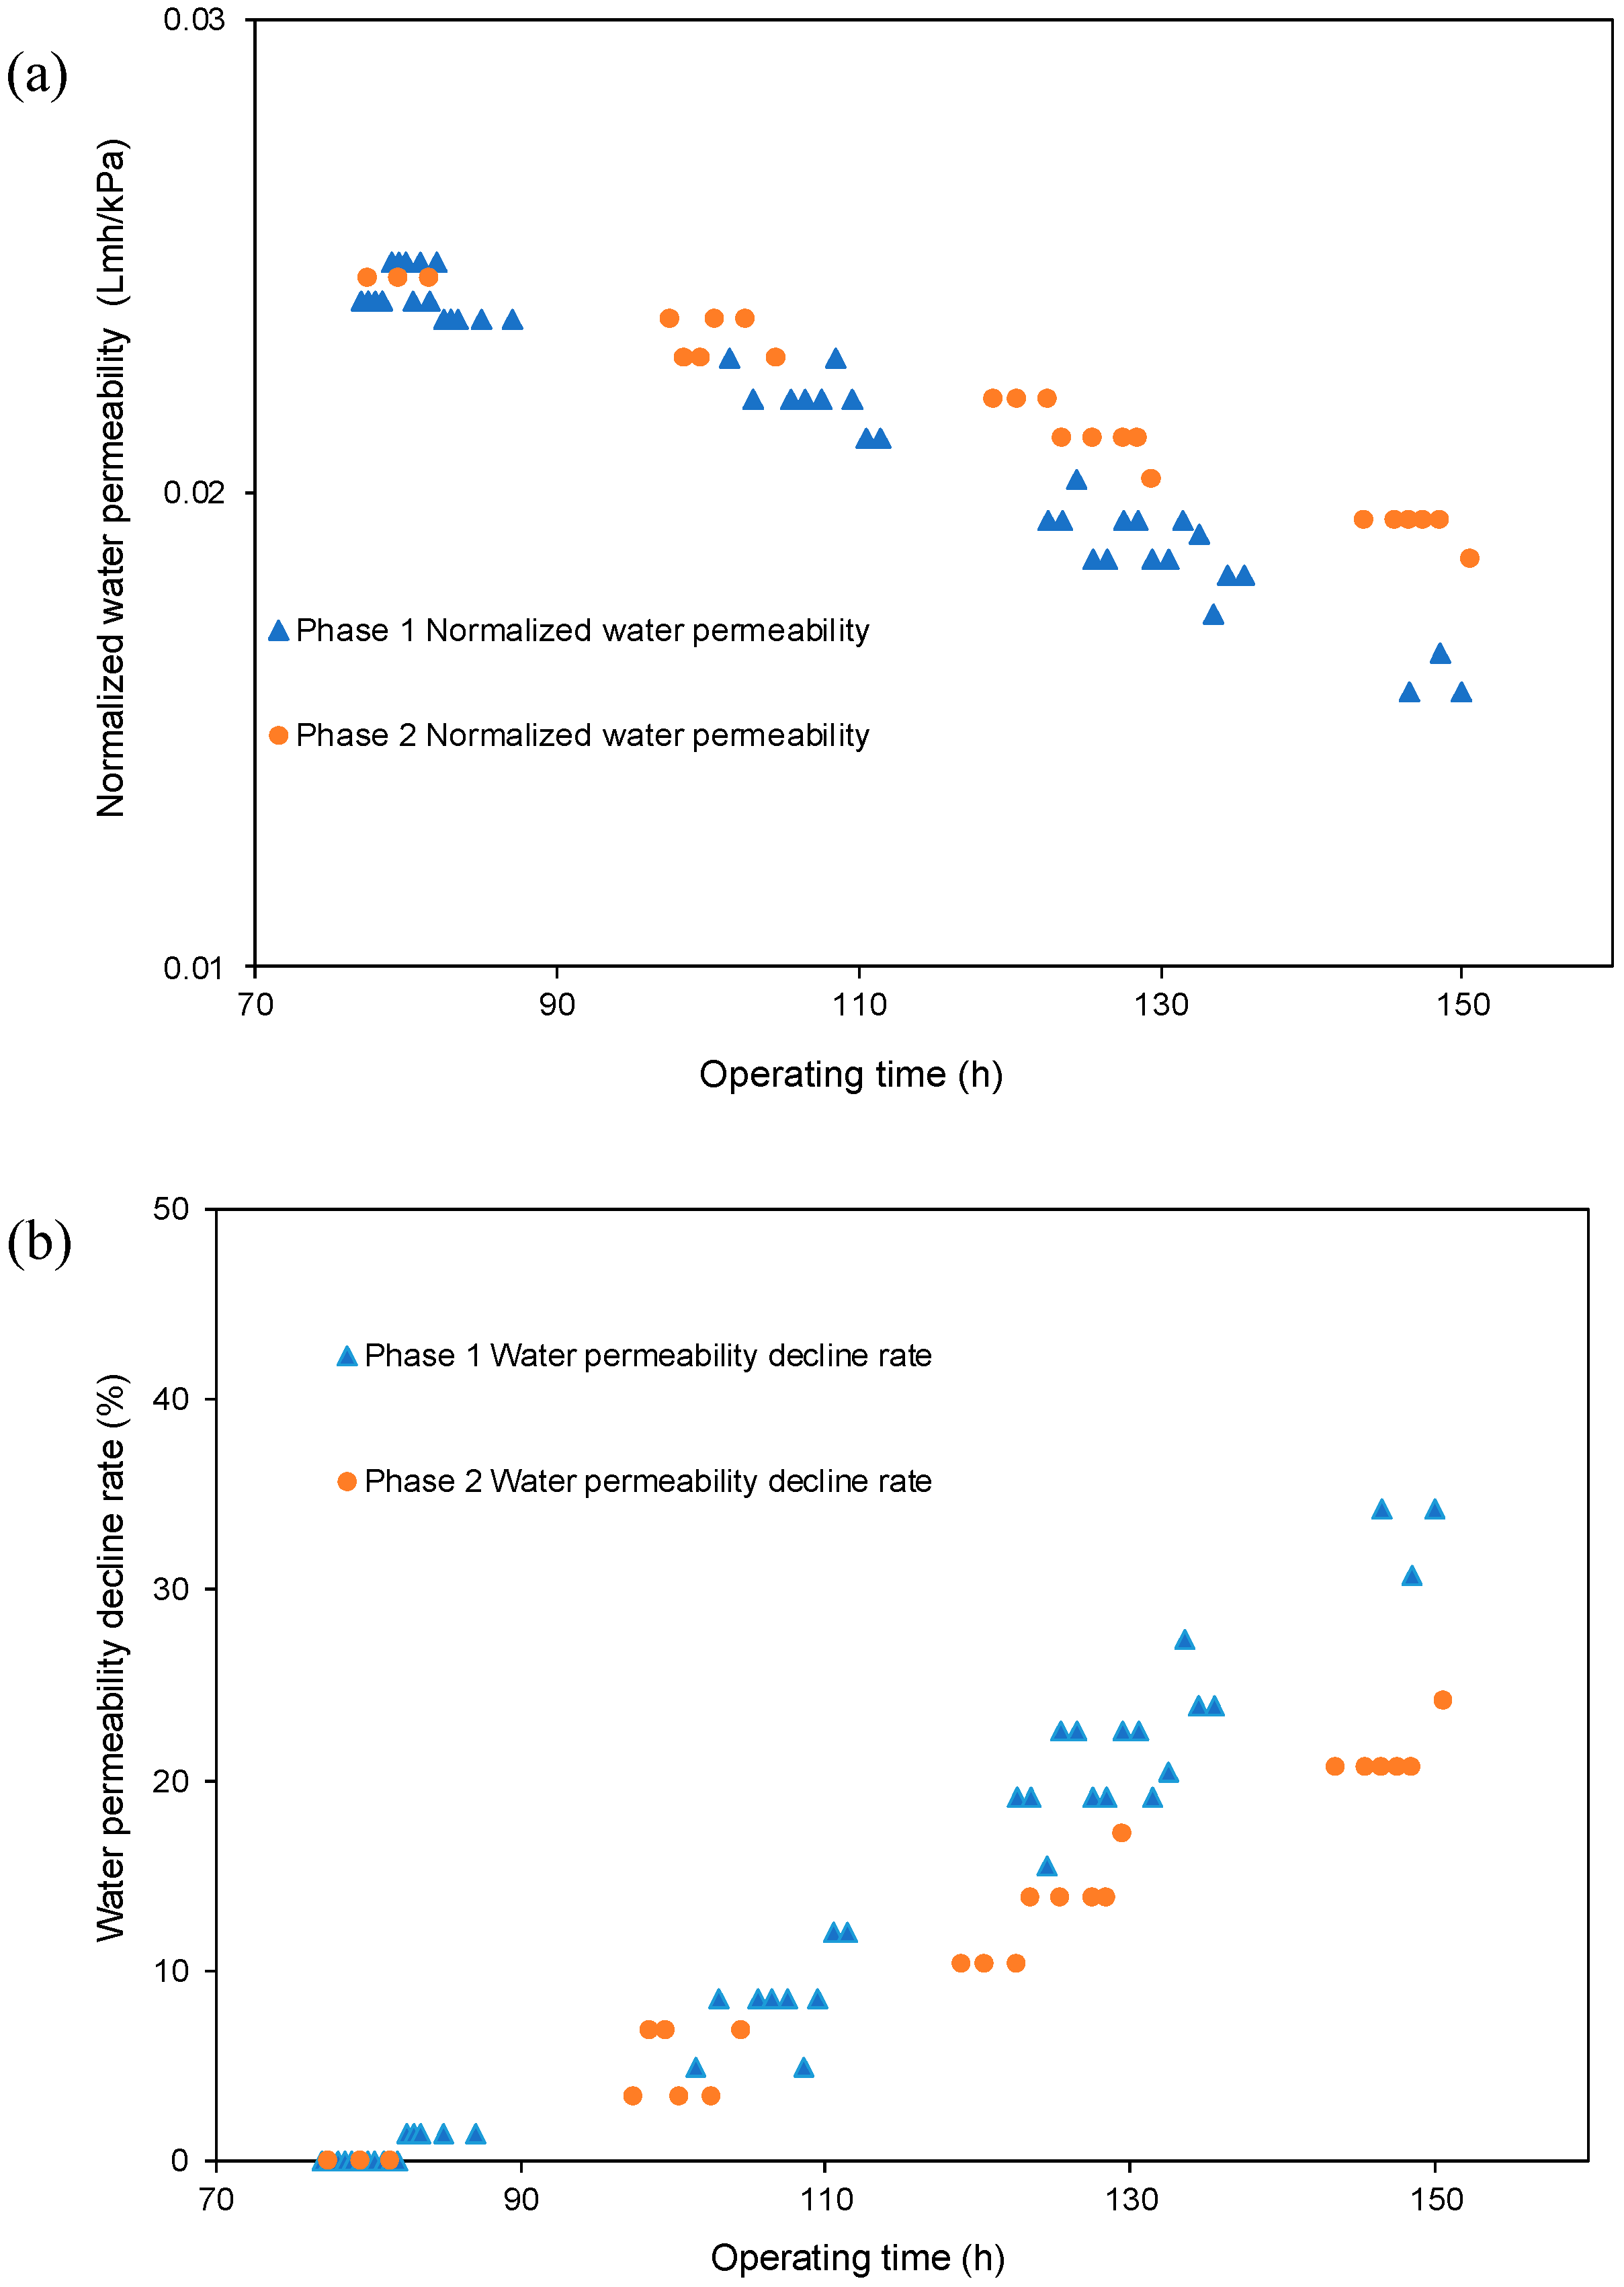
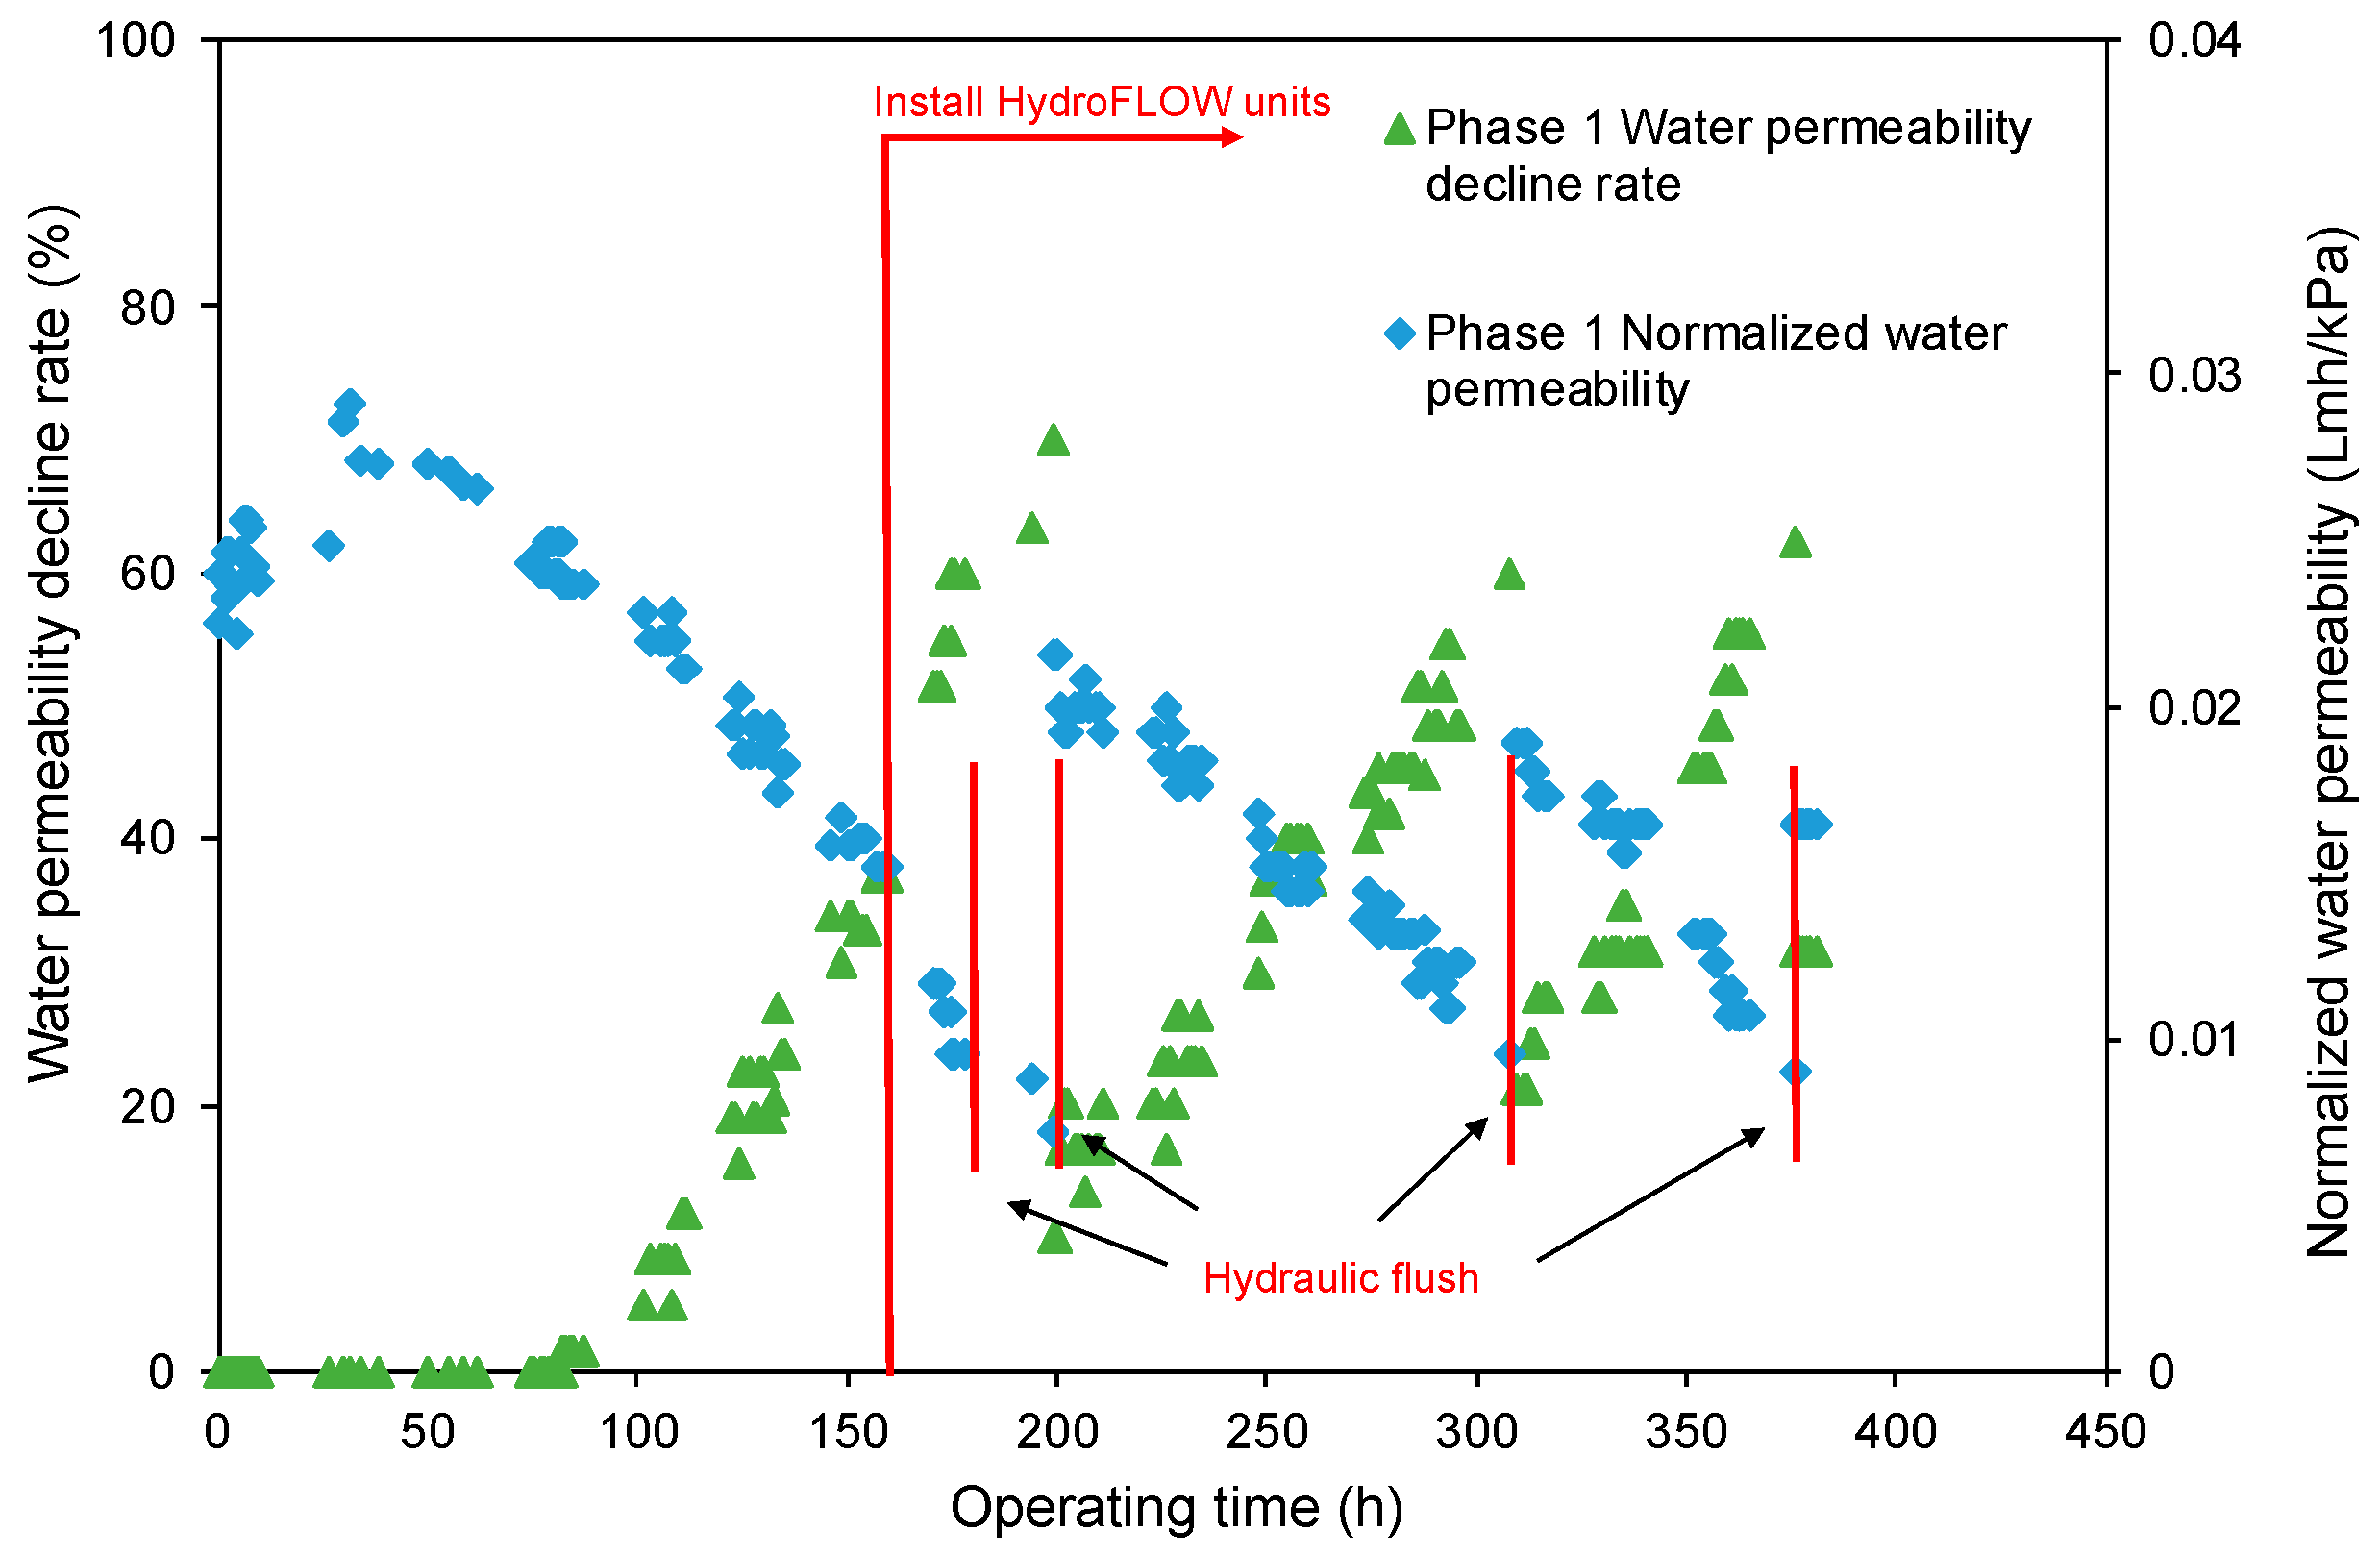
3.1. Water Flux of the RO System

Water recovery reached 50% after 77 h operation for both phases. HydroFLOW devices were turned on after 150 h operation for Phase 1 (P1) and from the beginning for Phase 2 (P2). The NWP and NWP decline of the RO system are illustrated in Figure 3a,b, respectively, to compare the 77 h to 150 h operation treating Well 2 water without (Phase 1) and with (Phase 2) the EMF devices. In P1, the NWP decreased by 34% from 0.024 to 0.016 Lmh/kPa. In P2, NWP decreased by 23% from 0.024 to 0.019 Lmh/kPa. The decreasing rate of the water permeability is slower in P2 than in P1 and the difference increases with the operation time, indicating that the EMF devices retarded the fouling and scaling on the RO membrane surface. The NWP of the two phases are illustrated in Figure 4 and Figure 5. The NWP decreased continuously despite the installation of EMF devices, revealing the EMF can only retard, not completely eliminate, fouling and scaling on the membrane surface at 50% water recovery in this study. ROSA simulation indicated severe calcium-based scaling at 50% water recovery.
When the EMF devices were turned on after 150 h operation in P1, the feedwater flow experienced an abrupt decline due to the clogging of the feedwater flow channels (spacers) inside the RO elements; water recovery increased from 47.5% to 70.6% as a result of reduced feedwater flow. The EMF induced a high frequency electric signal, which can loosen colloidal particles, fouling and scaling layer on cartridge filter, membranes, and pipelines, and the shed fine solids accumulated and clogged the spacers in the RO feed flow channel. Under oscillating electric field, charged particles start to vibrate and take off from filters and pipeline surface. It has been reported that the applied EMF would potentially lift charged particles from membrane surface and release them into the bulk fluid, which could be used as a cleaning method to restore the already fouled membranes [20]. Also, RO membrane autopsy in Section 3.2 indicated some scale existed in the water pipeline was broken down and accumulated in the membrane surface by the EMF devices. Hence, the presence of the EMF generated by the HydroFLOW devices released particles, obstructed the RO water flow channels, and caused the abrupt decrease of feedwater and concentrate flow. Hydraulic flushing using Well 1 groundwater was performed for 2 h to rinse the system and to decrease the water recovery to 50% at 175 h point. However, the NWP was not completely restored, which indicated this flush only removed the clogged materials in the flow channel. Another 5 h hydraulic flushing occurred after 24 h to reinstate the membrane performance, and increased NWP from 0.0072 to 0.022 Lmh/kPa. In both phases thereafter, a 5 h hydraulic flush was performed when the NWP decreased to less than 0.01 Lmh/kPa, shown as the red vertical lines in Figure 4 and Figure 5. After the hydraulic flush, the NWP recovered partially for both phases, indicating that the outer fouling layer could be detached but the inner scaling layer was difficult to remove.
To better evaluate the NWP, the absolute slope value of the NWP as a function of operating time was used to describe the NWP decreasing rate of the RO membranes, referred to as the k value (Lmh/kPa-h). A large k means a fast decrease in NWP and indicates a high scaling rate and low desalination performance. Table 3 summarizes the calculated k values for different operating conditions in this study. Between 77 h to 150 h operation, k for P2, (0.74 ± 0.17) × 10−4 Lmh/kPa-h, decreased by 38.3% compared to the k, (1.2 ± 0.32) × 10−4 Lmh/kPa-h, for the same operation period in P1, which implies the HydroFLOW devices reduced membrane scaling and improved RO membrane performance. After 370 h operation, even though P1 had three hydraulic flushes compared to one for P2, k for P2, (1.2 ± 0.11) × 10−4 Lmh/kPa-h, was still 14.3% lower than the k for P1, (1.4 ± 0.51) × 10−4 Lmh/kPa-h. It is worth noting that after over 700 h operation and four hydraulic flushes, the k value for P2 remained almost the same as the first 150 h period. This observation suggests that hydraulic flushing can partially remove the scaling layer; however, is not sufficient to remove the fouling layer formed in P1, due to a denser and more compact fouling layer formed on the RO membrane surface than that in P2, which is also verified by the membrane autopsy in Section 3.2.

3.2. Characterization of RO Membrane Fouling and Scaling

To characterize the impact of EMF on RO membrane fouling and scaling, RO membrane specimens were cut from the membrane elements for autopsy. The RO membranes from the Phase 1 first element (lead-element) are referred as P1E1 and the third element (tail-element) as P1E3. Deionized water was used to gently remove the loose foulants and salt residues from the membranes surface; those samples are referred as P1E1-DI and P1E3-DI. Corresponding names are given to the membranes from Phase 2 as P2E1 and P2E3 for the lead and tail elements, and P2E1-DI and P2E3-DI after deionized water rinse.
In this study, SEM (Figure 6) and EDX (Figure 7) were used to observe the morphology of the membrane surface and to identify the elements in the foulants and scalants. XRD (Figure 8) was used to characterize the crystalline structure of the scales on the deionized water-rinsed membranes.
For the lead element, it is obvious that the deionized water rinse removed most of the loose foulants and salt residues from the membrane surface when comparing the SEM images. For example, Figure 6b (P1E1, with DI rinse) shows a rough and “3D” structure compared to Figure 6a (P1E1, without DI rinse). Furthermore, the P1E1-DI membrane (Figure 6b) shows more compact and denser fouling on the membrane surface, as compared to the fouling layer formed on P2E1-DI (Figure 6d) that is powdery with a lower density, despite that P1 was installed in the HydrowFLOW devices after 150 h operation and P2 (844 h operation) had a longer operation time than P1(381 h operation). This result indicates that the EMF treatment prevented adhesive fouling layer forming on the lead element membrane surface at the beginning of the RO process. The EDX results show the relative ratio of Si in P2E1-DI (Figure 7c) is much lower than in P1E1-DI (Figure 7a), indicating that the EMF had a positive effect in controlling silica-related colloidal fouling in the first element. This finding agrees with other studies that the EMF treatment worked effectively in colloidal silica related fouling [19,33]. An important finding from the EDX results is the Fe peak in both P1E1-DI and P2E1-DI. Based on BGNDRF water quality report (available on its website [37]), the total amount of iron in both Well-1 and Well-2 groundwater was either extremely low (below 0.1 mg/L) or not detected during the last 7 years (03/2011–12/2017). The Fe peak from membrane surface suggests HydroFLOW devices descaled some rust inside the pipelines in BGNDRF facility. This hypothesis was supported by our following research (data not reported in this paper) that a more powerful EMF device was tested in BGNDRF; a large amount of rust was descaled from the pipeline and accumulated in the cartridge filter. The descaling effect of HydroFLOW devices supported the clogging of feedwater flow channel discussed in Section 3.1. The XRD results (Figure 8) show the colloidal clay fouling in the lead elements was amorphous and there was no crystal formed on the membrane surface in both phases.
For the tail-end element (E3), the DI water rinse did not significantly change the morphology of the membrane based on the SEM images (Figure 6e vs. Figure 6f and Figure 6g vs. Figure 6h). The scales found in the XRD results for both phases (Figure 8) are crystallites. The major crystals are identified as SiO2, MgO, and CaSO4, consistent with EDX results. The dissolved silica concentration in the groundwater is 21 mg/L, which was not expected to precipitate on RO membrane surface at the operating water recovery of 50% as predicted by the ROSA model. However, silica scales were detected in both the EDX and XRD analyses, which may be caused by the aggravated concentration polarization due to membrane fouling and scaling.
Mass transfer is the movement of material from one location to another in solution, as a result of differences in chemical or electrical potential at the two locations, or from motion of the solution. It contains three modes: (1) diffusion, the movement of a species under the influence of a gradient of chemical potential; (2) migration, the movement of a charged body under the influence of an electric field; and (3) convection, the movement of a material under stirring or hydrodynamic transport [40]. During the RO filtration process, the minerals left in the feedwater side accumulate on the membrane surface and concentration polarization occurs after water passes through the RO membrane. The concentrated materials can diffuse to the bulk solution under chemical potential; however, when the diffusion process is slow, and the concentration of salts becomes saturated, precipitates start to deposit on the membrane surface, resulting in scaling. Once a nascent scaling layer develops on the membrane surface, it could exacerbate concentration polarization at the membrane surface by reducing fluid convective forces close to the membrane surface [8]. Concentration polarization plays a vital role in scale formation in RO membrane systems; it is determined by the operating conditions such as water recovery, temperature, membrane properties, and solution chemistry [7,41]. Enhanced convection by increasing the feed flow rate for the RO system can help to remove the highly concentrated ions away from the membrane surface and to alleviate the concentration polarization and decelerate the scaling process. However, the RO system usually has an upper limit for feedwater flow rate.
Another approach to improve the mass transfer in the flow channel would be to increase the migration of charged particles. In this study, the electromagnetic field induced by the HydroFLOW devices in the RO system increased the migration of charged bodies in the solution, which improved the mass transfer on the RO membrane surface, resulting in weaker concentration polarization. Weaker concentration polarization slows down the precipitation process in the vicinity of the membrane and makes the formed crystals much softer and less sticky on the membrane surface. Rouina et al. reported the presence of EMF reduced the concentration polarization on the membrane surface, but further explanation was not discussed [19]. In this study, less scale observed in P2 than in P1, a smaller k value, and fewer hydraulic flushes needed in the P2 testing suggested the concentration polarization was weakened by the HydroFLOW devices. In addition, other researchers claimed the EMF increased the nucleation of crystals in the bulk solution and then large quantities of particles could be carried away from the membranes by the concentrated flow [7,30].

3.3. Solute Transport

The impact of EMF on the RO membrane performance was also evaluated in terms of the solute transport between the feed and permeate streams. The permeate conductivity in P1 is presented in Figure 9. The permeate conductivity was approximately 0.10 mS/cm after the membranes reached equilibrium and before installation of the HydroFLOW units. After the installation of HydroFLOW units, there was an abrupt increase in permeate conductivity because of the descaling of the colloidal particles, fouling and scaling layer in the system and the high-water recovery caused by the clogging of the feedwater flow channels in the RO elements, as discussed in Section 3.1 and Section 3.2. After two hydraulic flushes to recover the RO membrane performance, permeate conductivity decreased to approximately 0.07 mS/cm. Figure 9 shows the permeate conductivity remained relatively stable for about 80 h, then started to increase after the NWP decreased to a certain level (0.016 Lmh/kPa and 0.014 Lmh/kPa without and with HydroFLOW units, respectively), indicating the declined RO membrane performance.
Figure 10 illustrates the permeate conductivity in P2 testing, which was higher than that in P1. During the 50 to 150 h operation period, average permeate conductivity of P2 with the EMF was 150 ± 4.4 μS/cm, 26.1% higher than in P1 without the EMF (110 ± 90 μS/cm). The salt rejection difference was 0.59%, 98.2% for P1 and 97.5% for P2 when the feedwater salinity was considered. The increased permeate conductivity for P2 was attributed to feedwater conductivity variation in a natural groundwater and also due to the increased concentration of dissolved ions near the membrane surface because the electric field prevented the ions from precipitating on the membrane surface (smaller k value in P2) [42]. Free dissolved ions with higher concentration resulted in more ions transported through the RO membrane, which increased the permeate conductivity. After the first hydraulic flush in P2 testing, the permeate conductivity decreased to 0.07 mS/cm, similar to P1, indicating the EMF slightly increased the permeate conductivity in this study.
During both phases, the permeate conductivity changed in reverse to the specific water flux, implying a reduced RO membrane performance associated with lower quality permeate. The permeate conductivity decreased after hydraulic flushing, indicated partially regained membrane performance. On the contrary, another study found the EMF reduced the amount of salt transported through the membrane, thus decreasing the permeate conductivity. However, their experiment was conducted in a lab-scale system with a different configuration of EMF device for a shorter operation time [19]. Thus, more research under different operating conditions is needed to identify the key factors that affect EMF treatment in terms of RO permeate quality.

3.4. Preliminary Cost Estimate

The max. power for both devices is 1.2 W; the estimated cost would be 0.34 U.S. cents/day (Electricity rate in Alamogordo is 5.87 cents/kWh). The cost for water production would be 0.021 cents/m3 when the permeate flow rate is 11.4 L/min (3 gpm). The cost of EMF treatment is much lower than chemical cost of antiscalants estimated for this study, 2.9 cents/m3.

4. Conclusions

This study investigated the effect of electromagnetic field (EMF) on the control of membrane colloidal fouling and scaling during brackish groundwater desalination. The results demonstrated that installation of HydroFLOW water conditioning devices on the pilot RO skid enhanced the performance of the RO membrane.
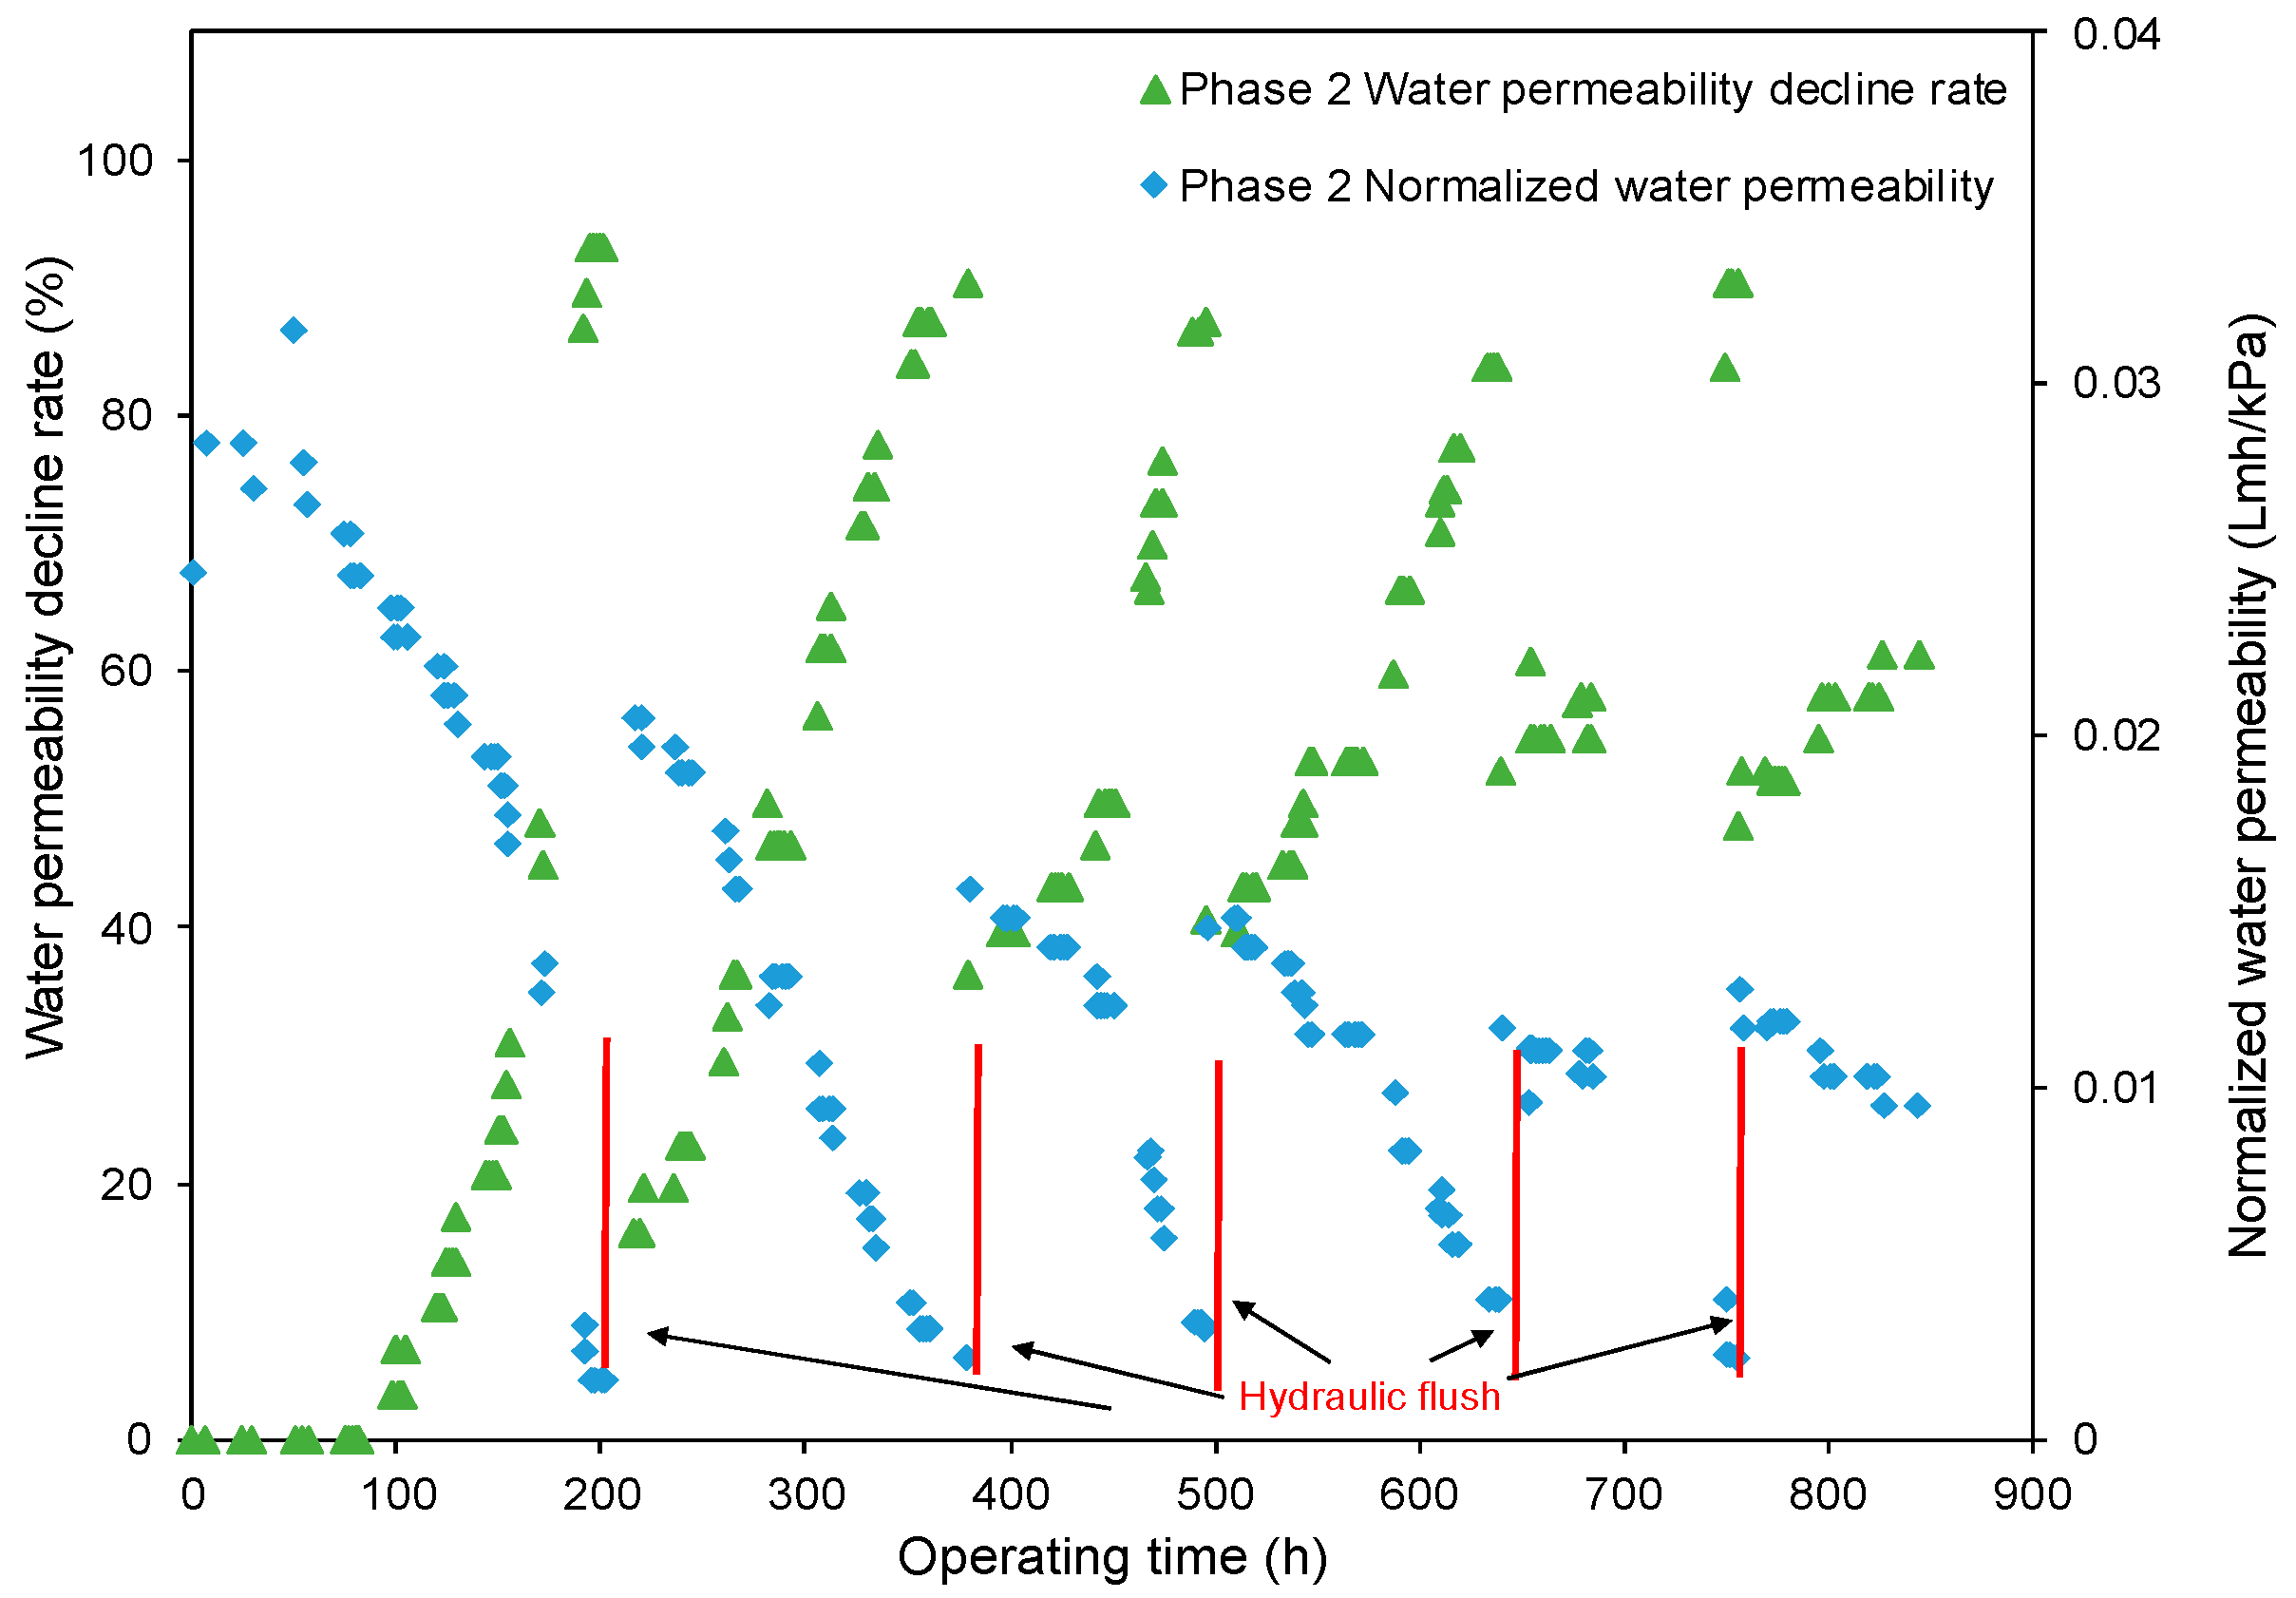
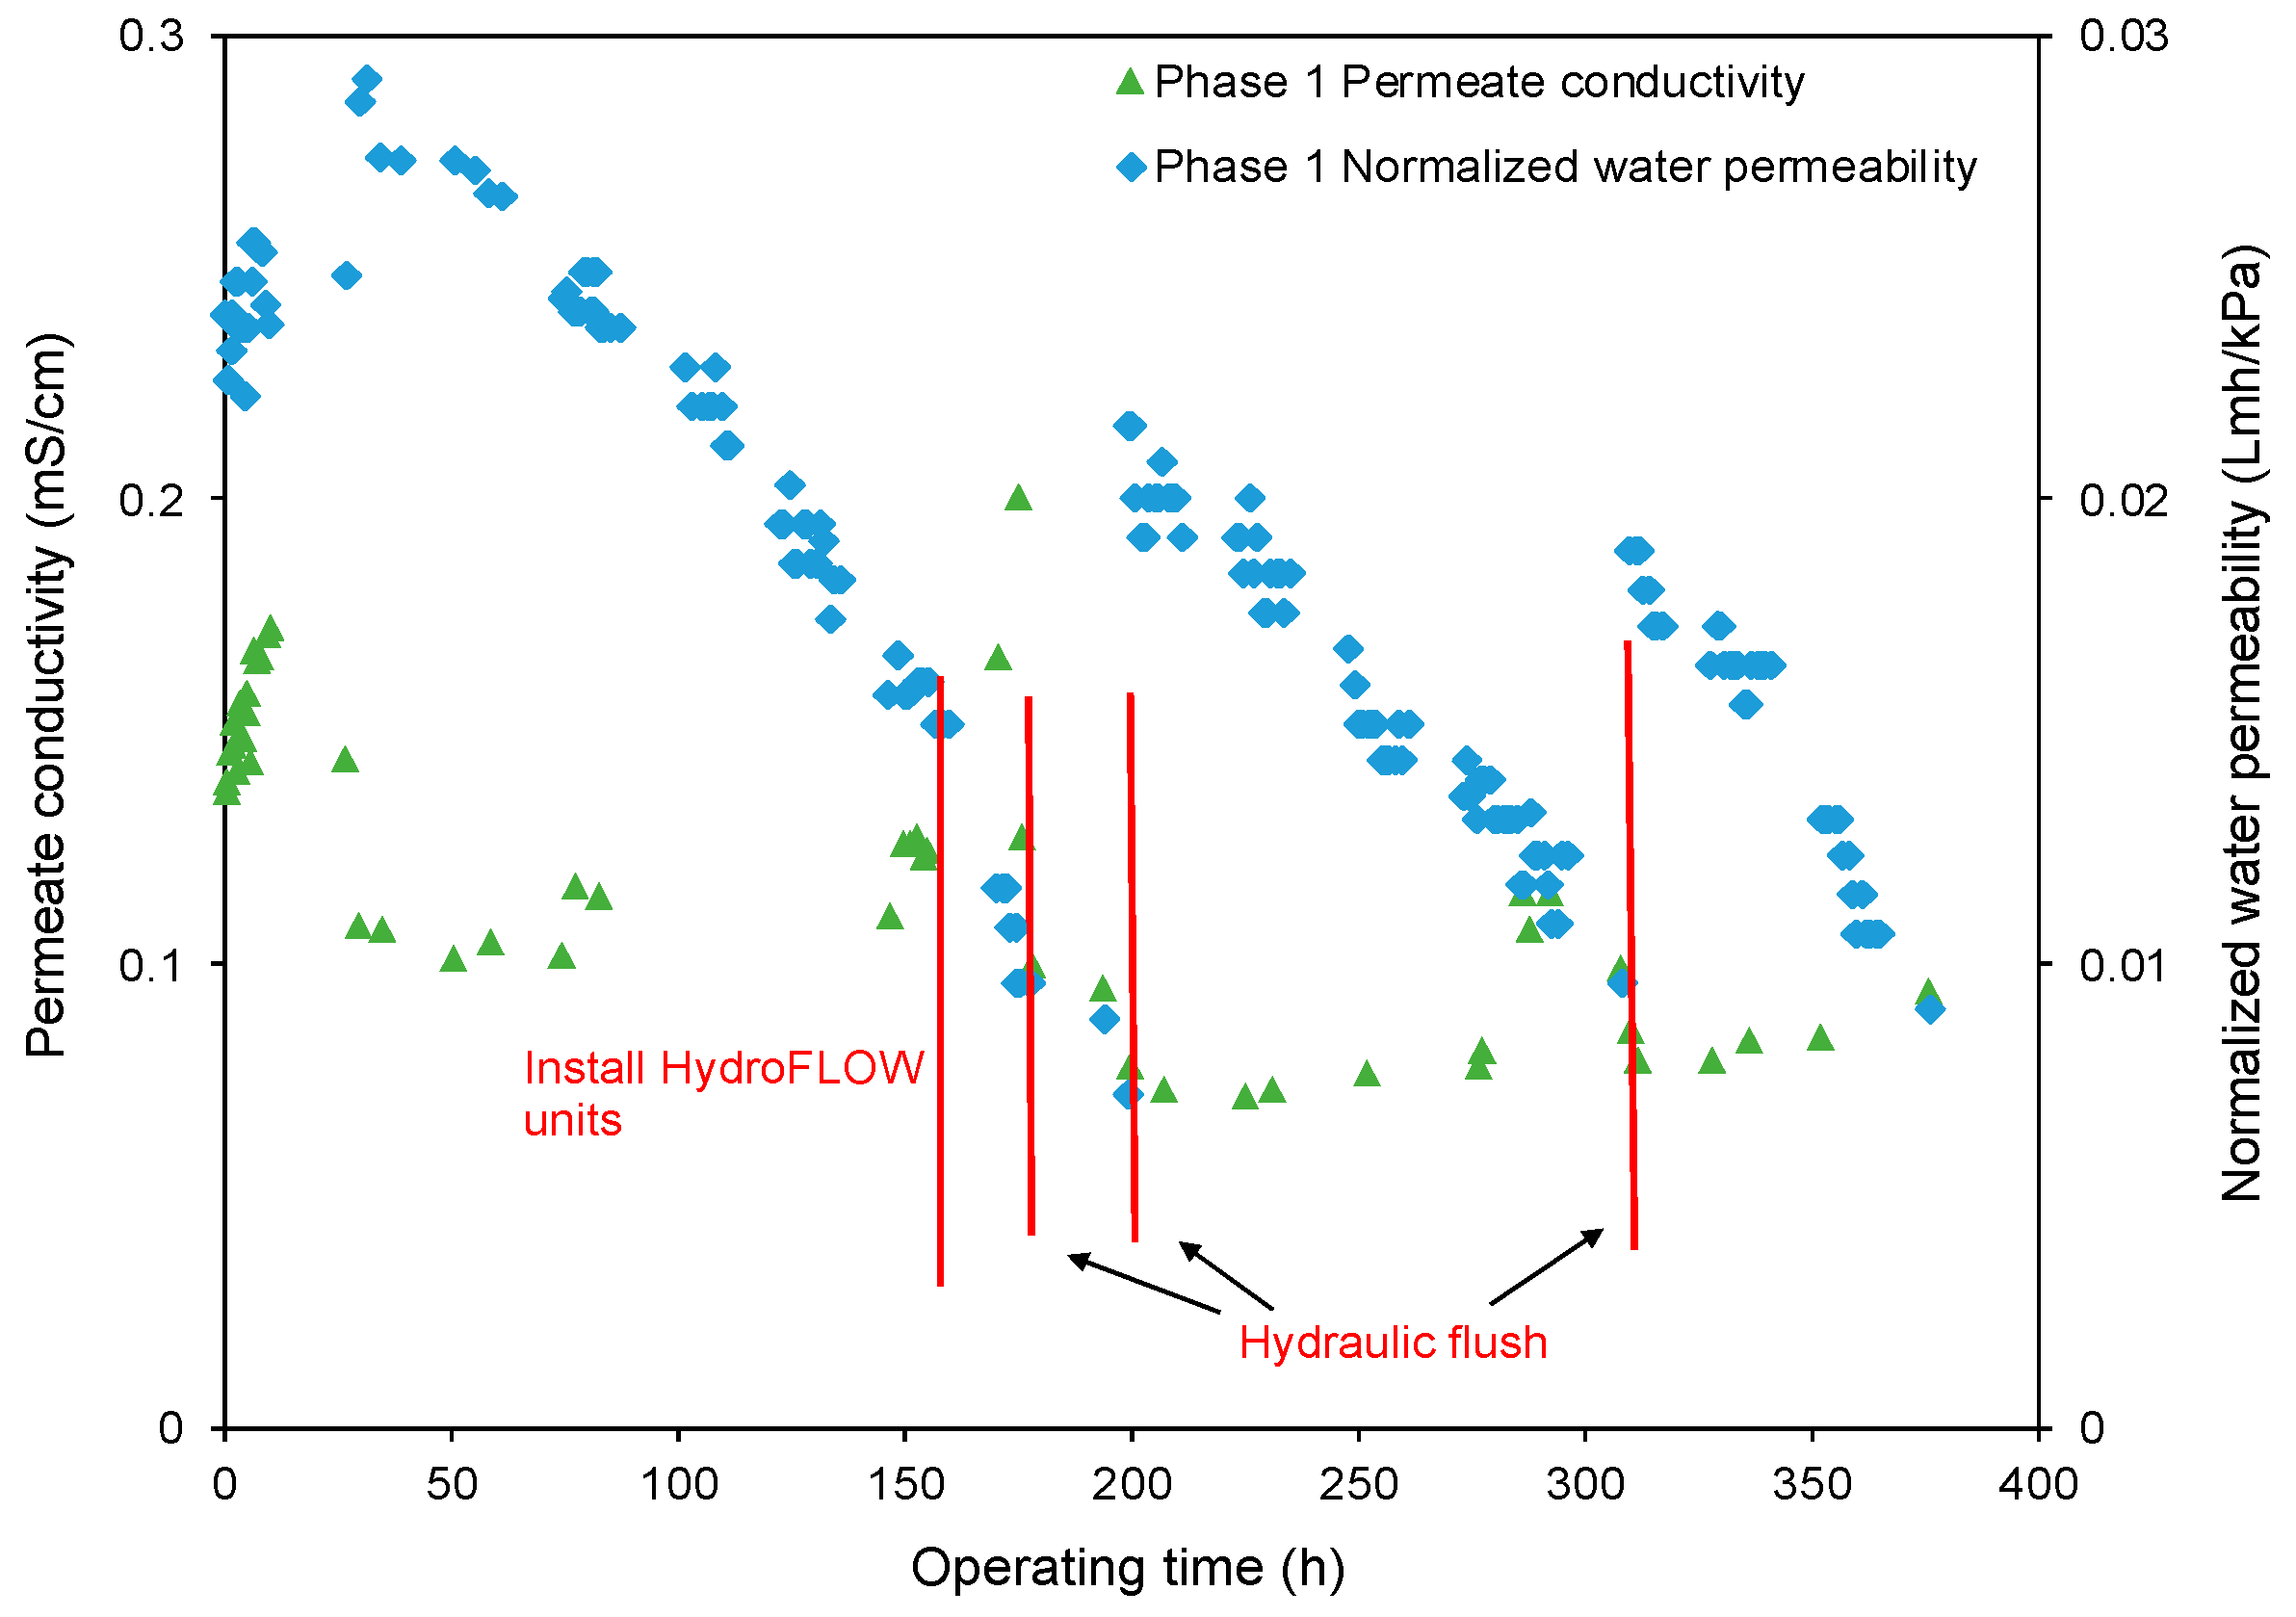
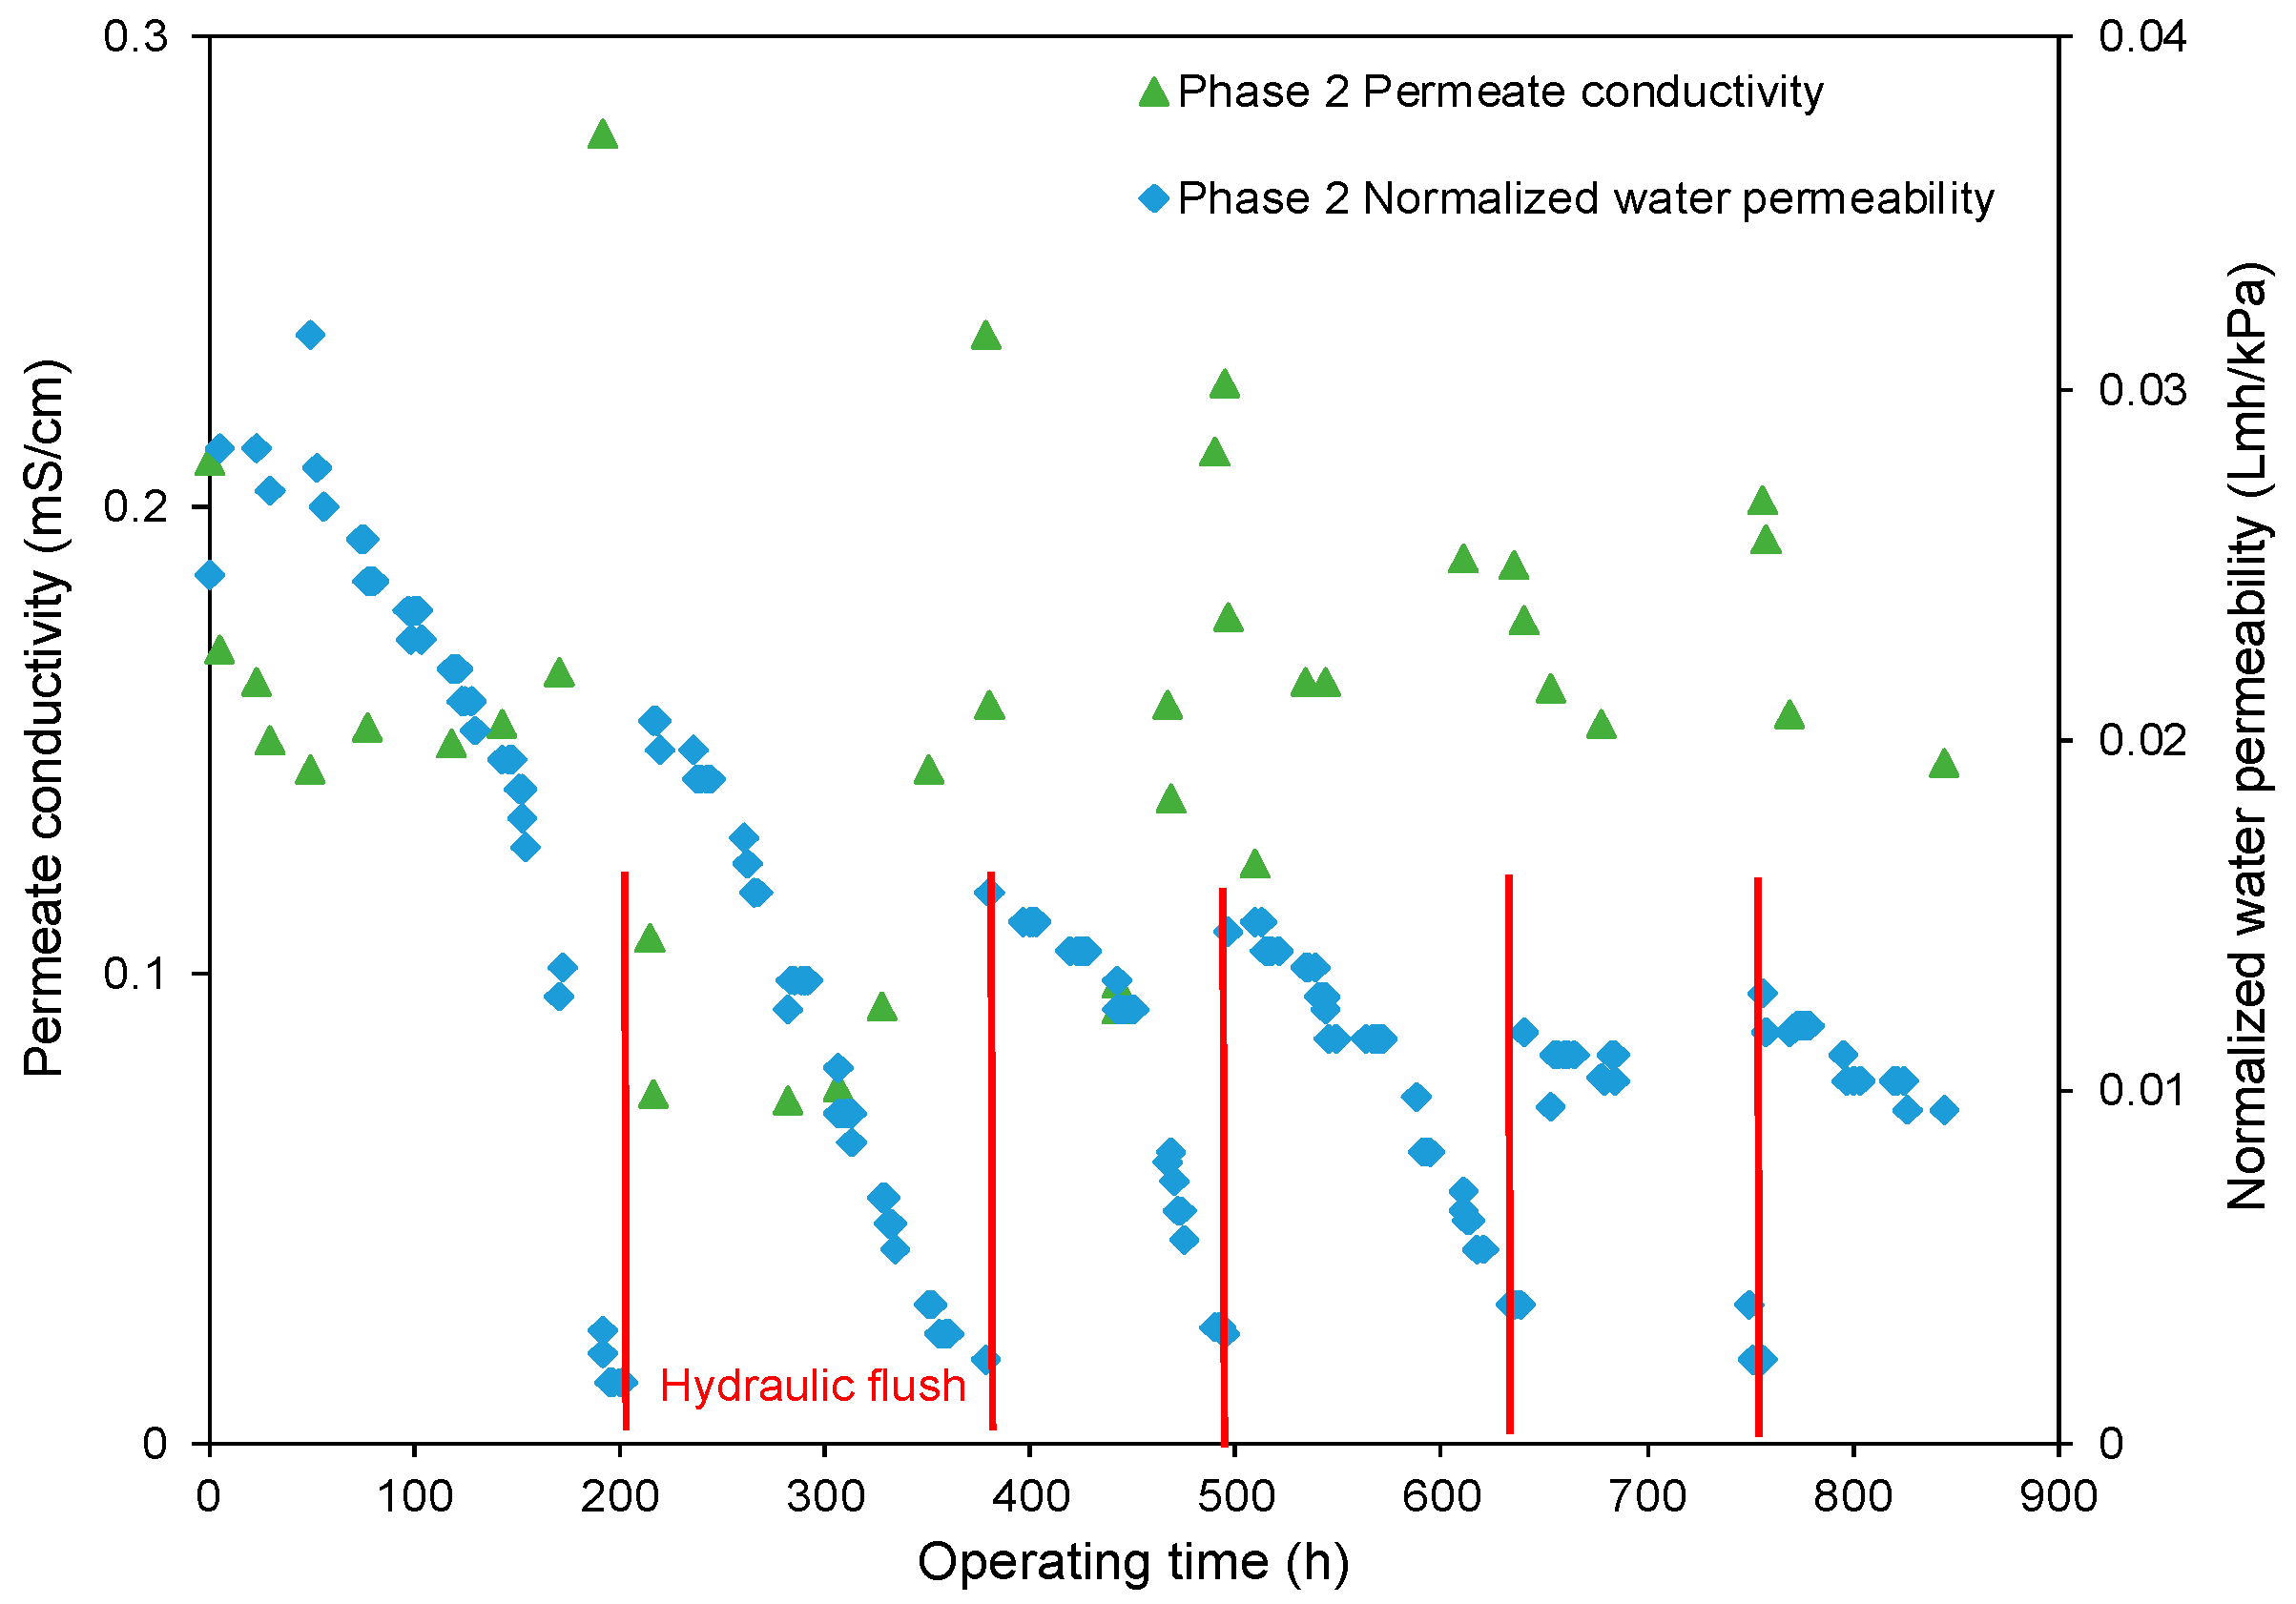
  • The decreasing rate of the normalized water permeability (k value) with the HydroFLOW units during Phase 2 (P2) testing improved by 38.3% and 14.3% as compared to the permeate flux in Phase 1 (P1) testing in the 150 h (without HydroFLOW) and 370 h operation, respectively. After 700 h operation and 4 hydraulic flushes, the k value of P2 remained the same as the first 150 h operation, indicating less fouling and that the membrane performance had been improved in P2 by the installation of the EMF devices. The k value also shows less hydraulic flush was required with the EMF devices, which reduces the cleaning downtime. However, the NWP declined continuously despite the installation of HydroFLOW units. This infers the EMF could alleviate the fouling to a certain level but was not able to completely prevent it in the accelerated fouling process.
  • In P1 after the installation of HydroFLOW units, the applied EMF loosened and shed the existing fouling layer from the water pipeline and RO membrane surface, resulting in clogging of the feedwater flow channels in the RO elements. Hydraulic flush facilitated the removal of the clogging particles from RO feed flow channels, and partially restored membrane performance.
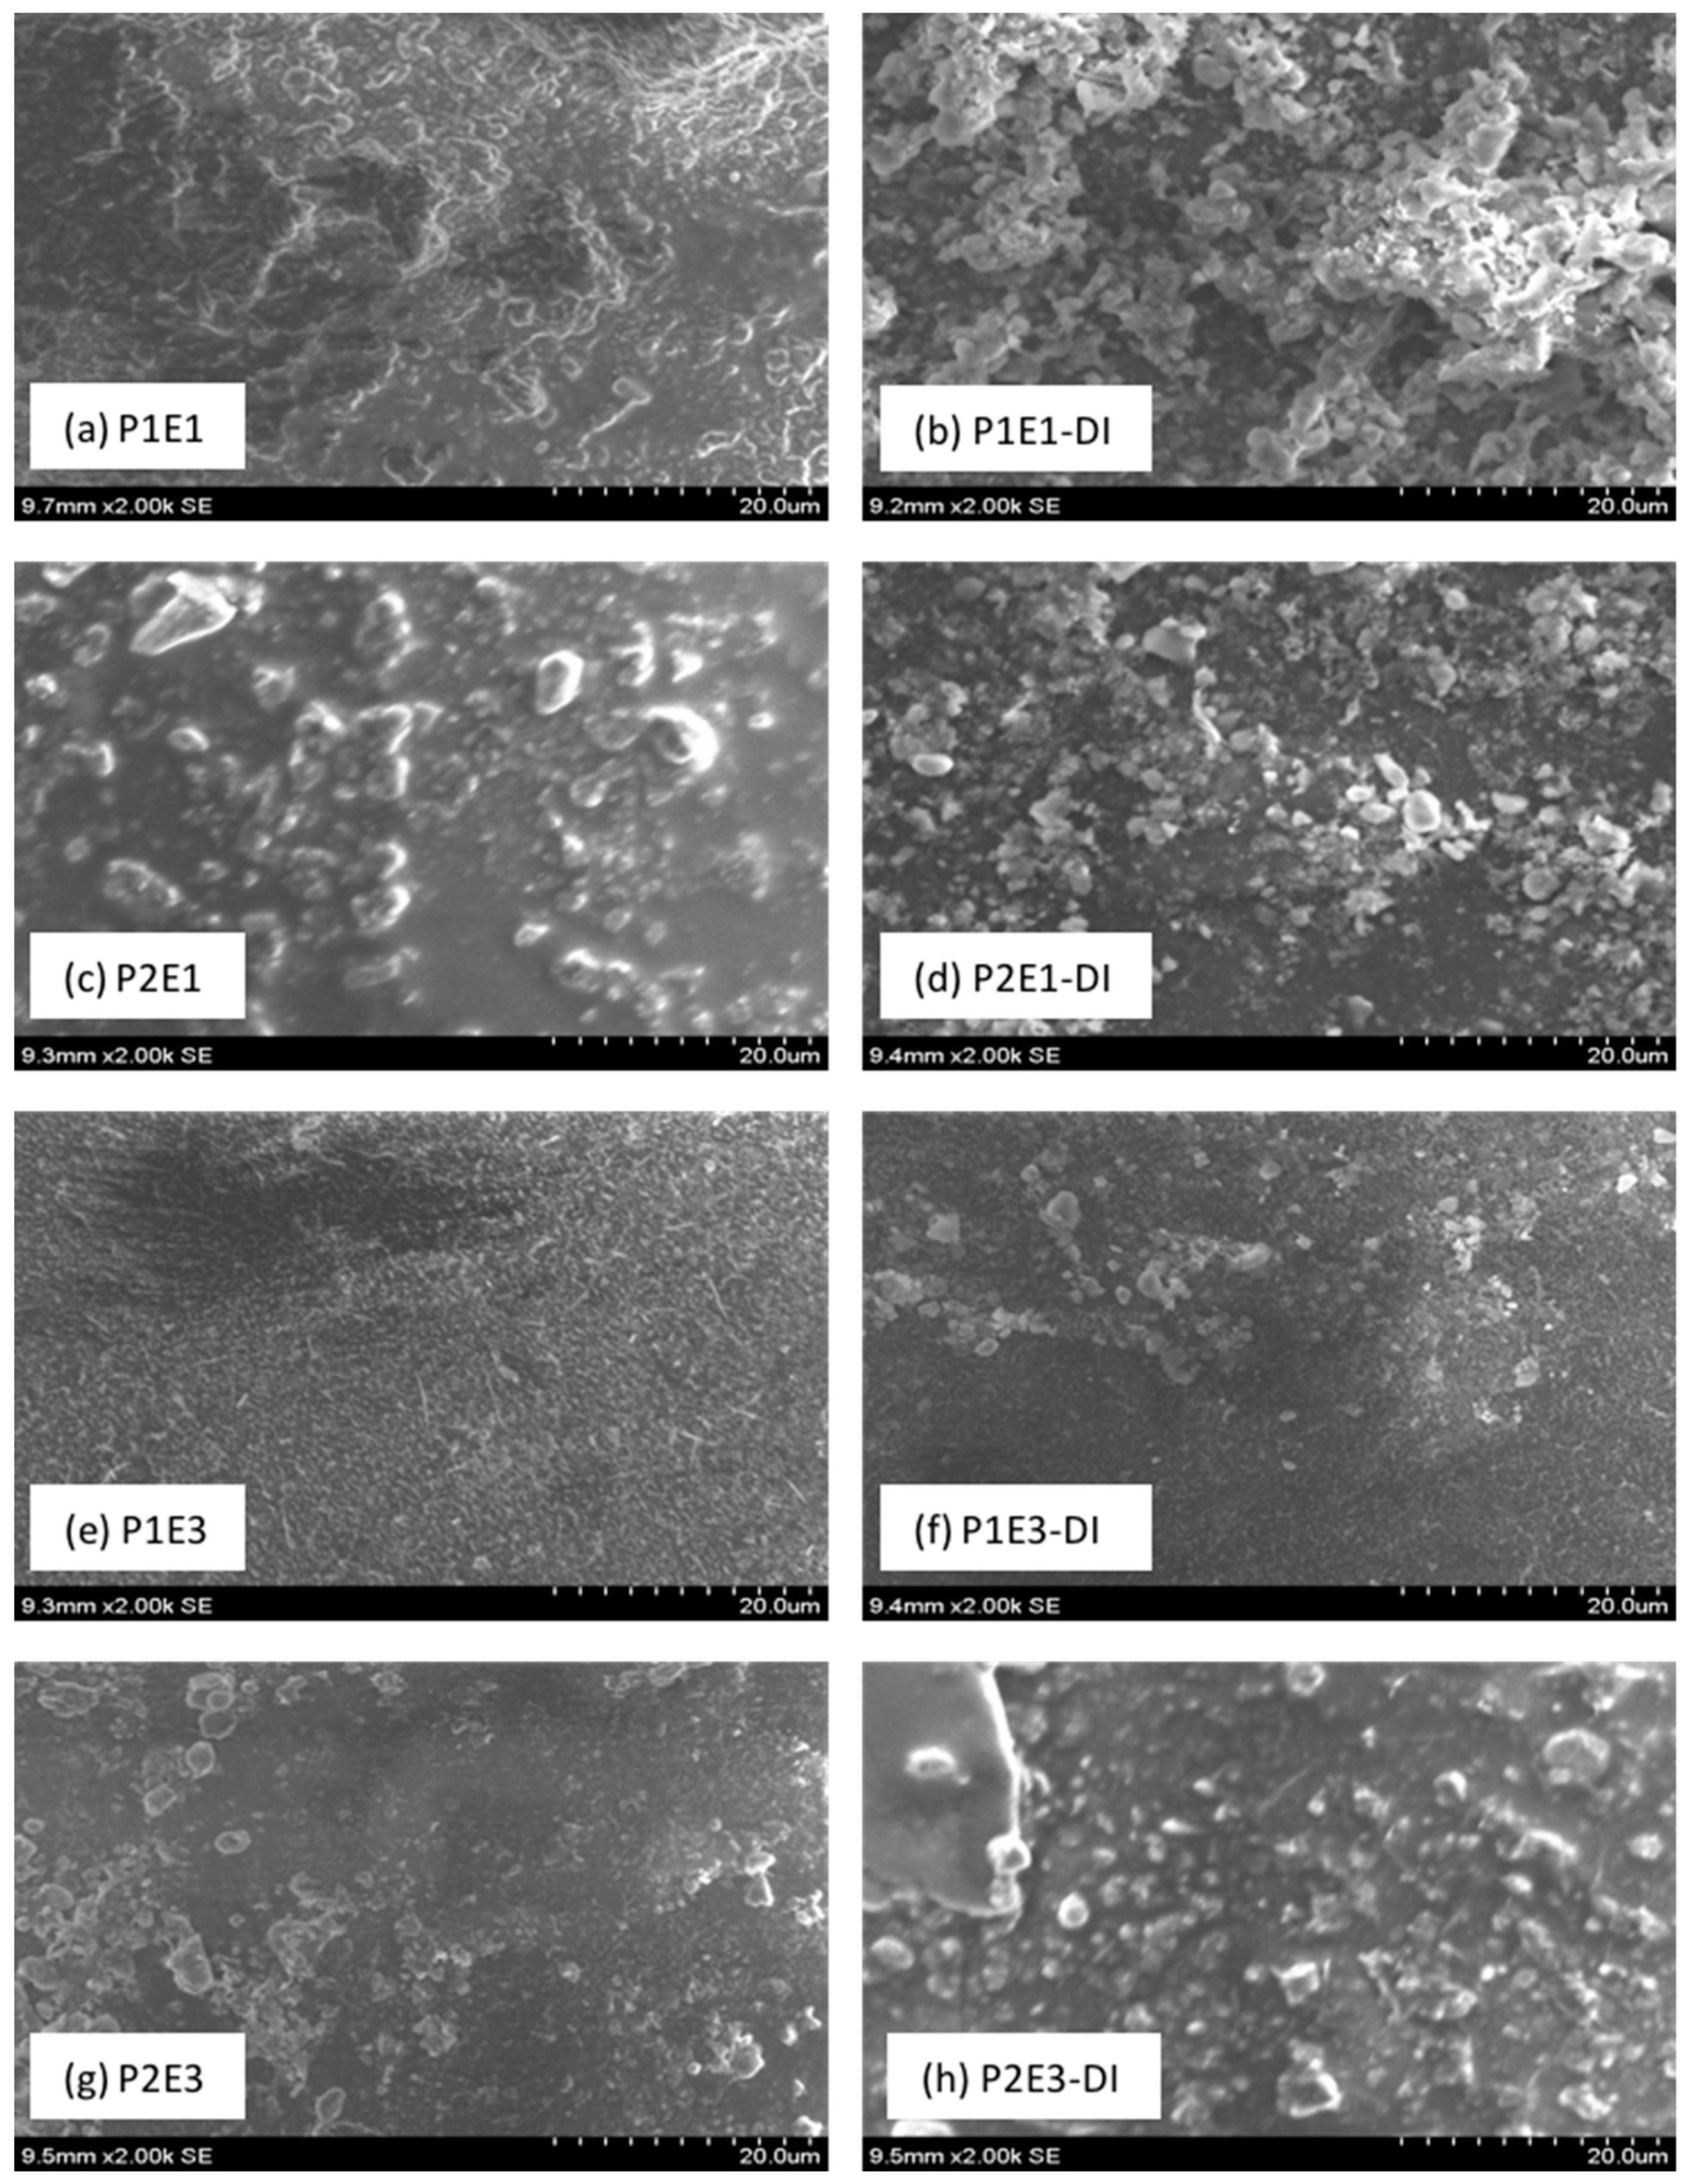
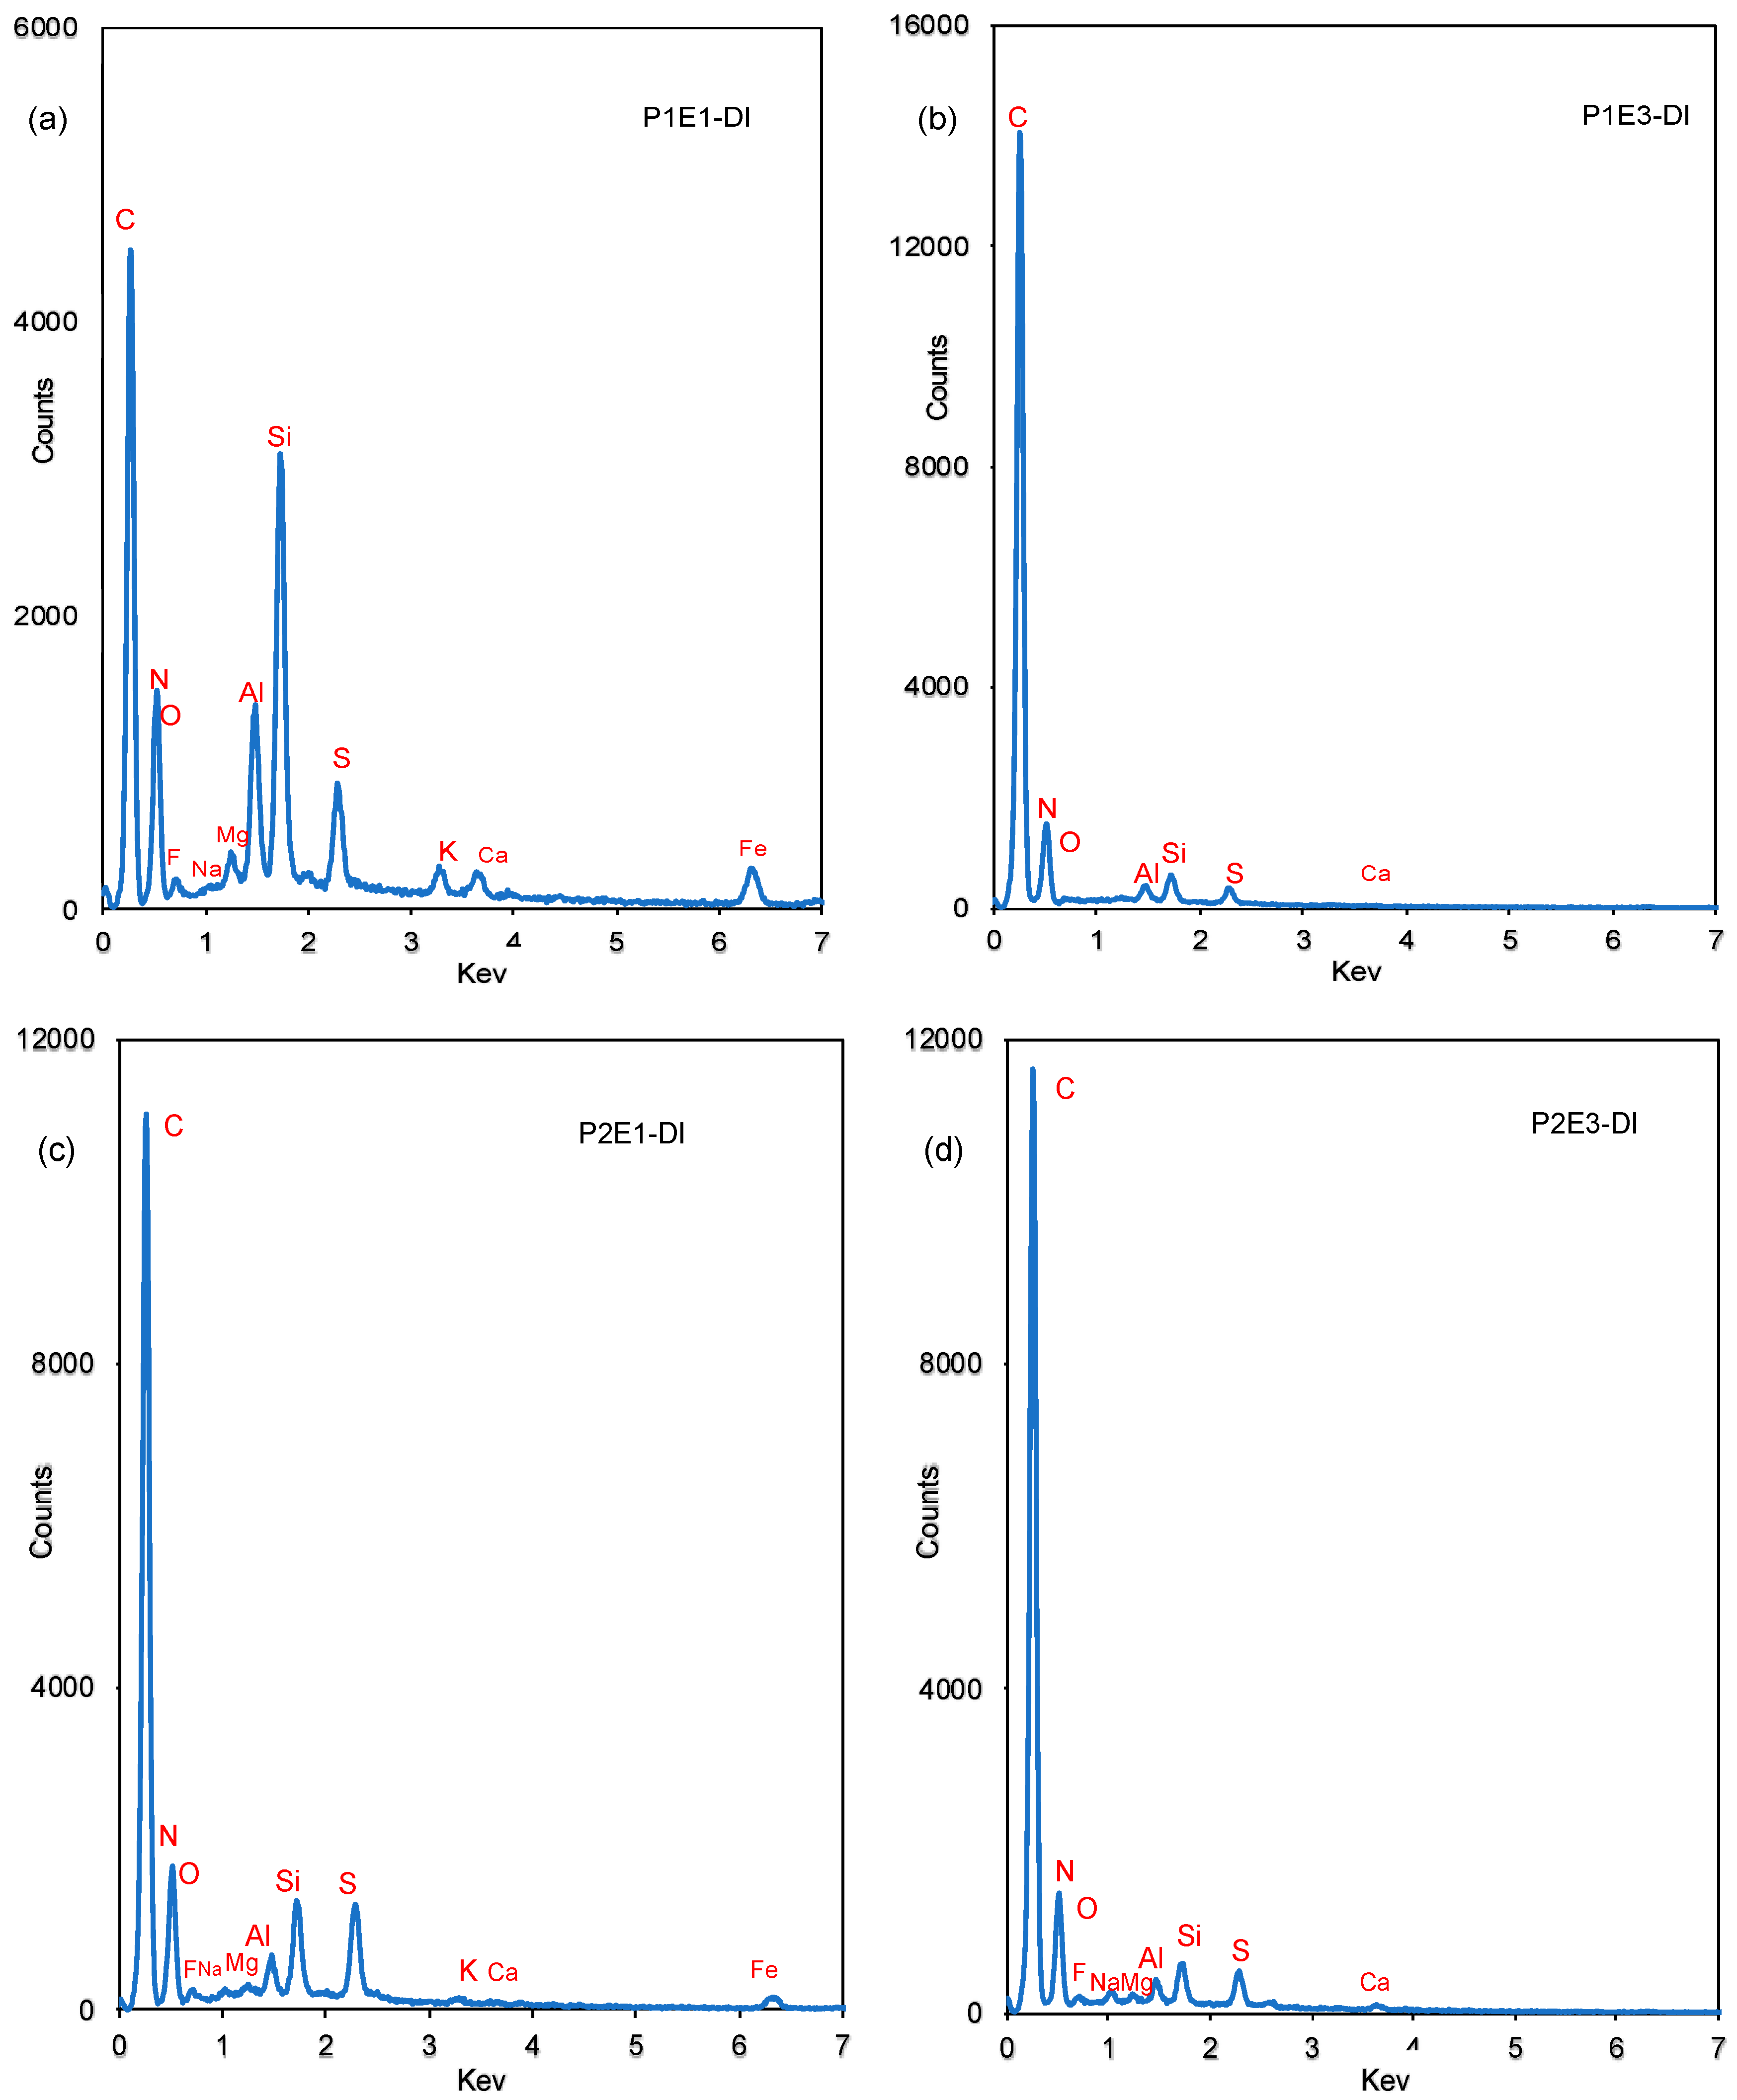
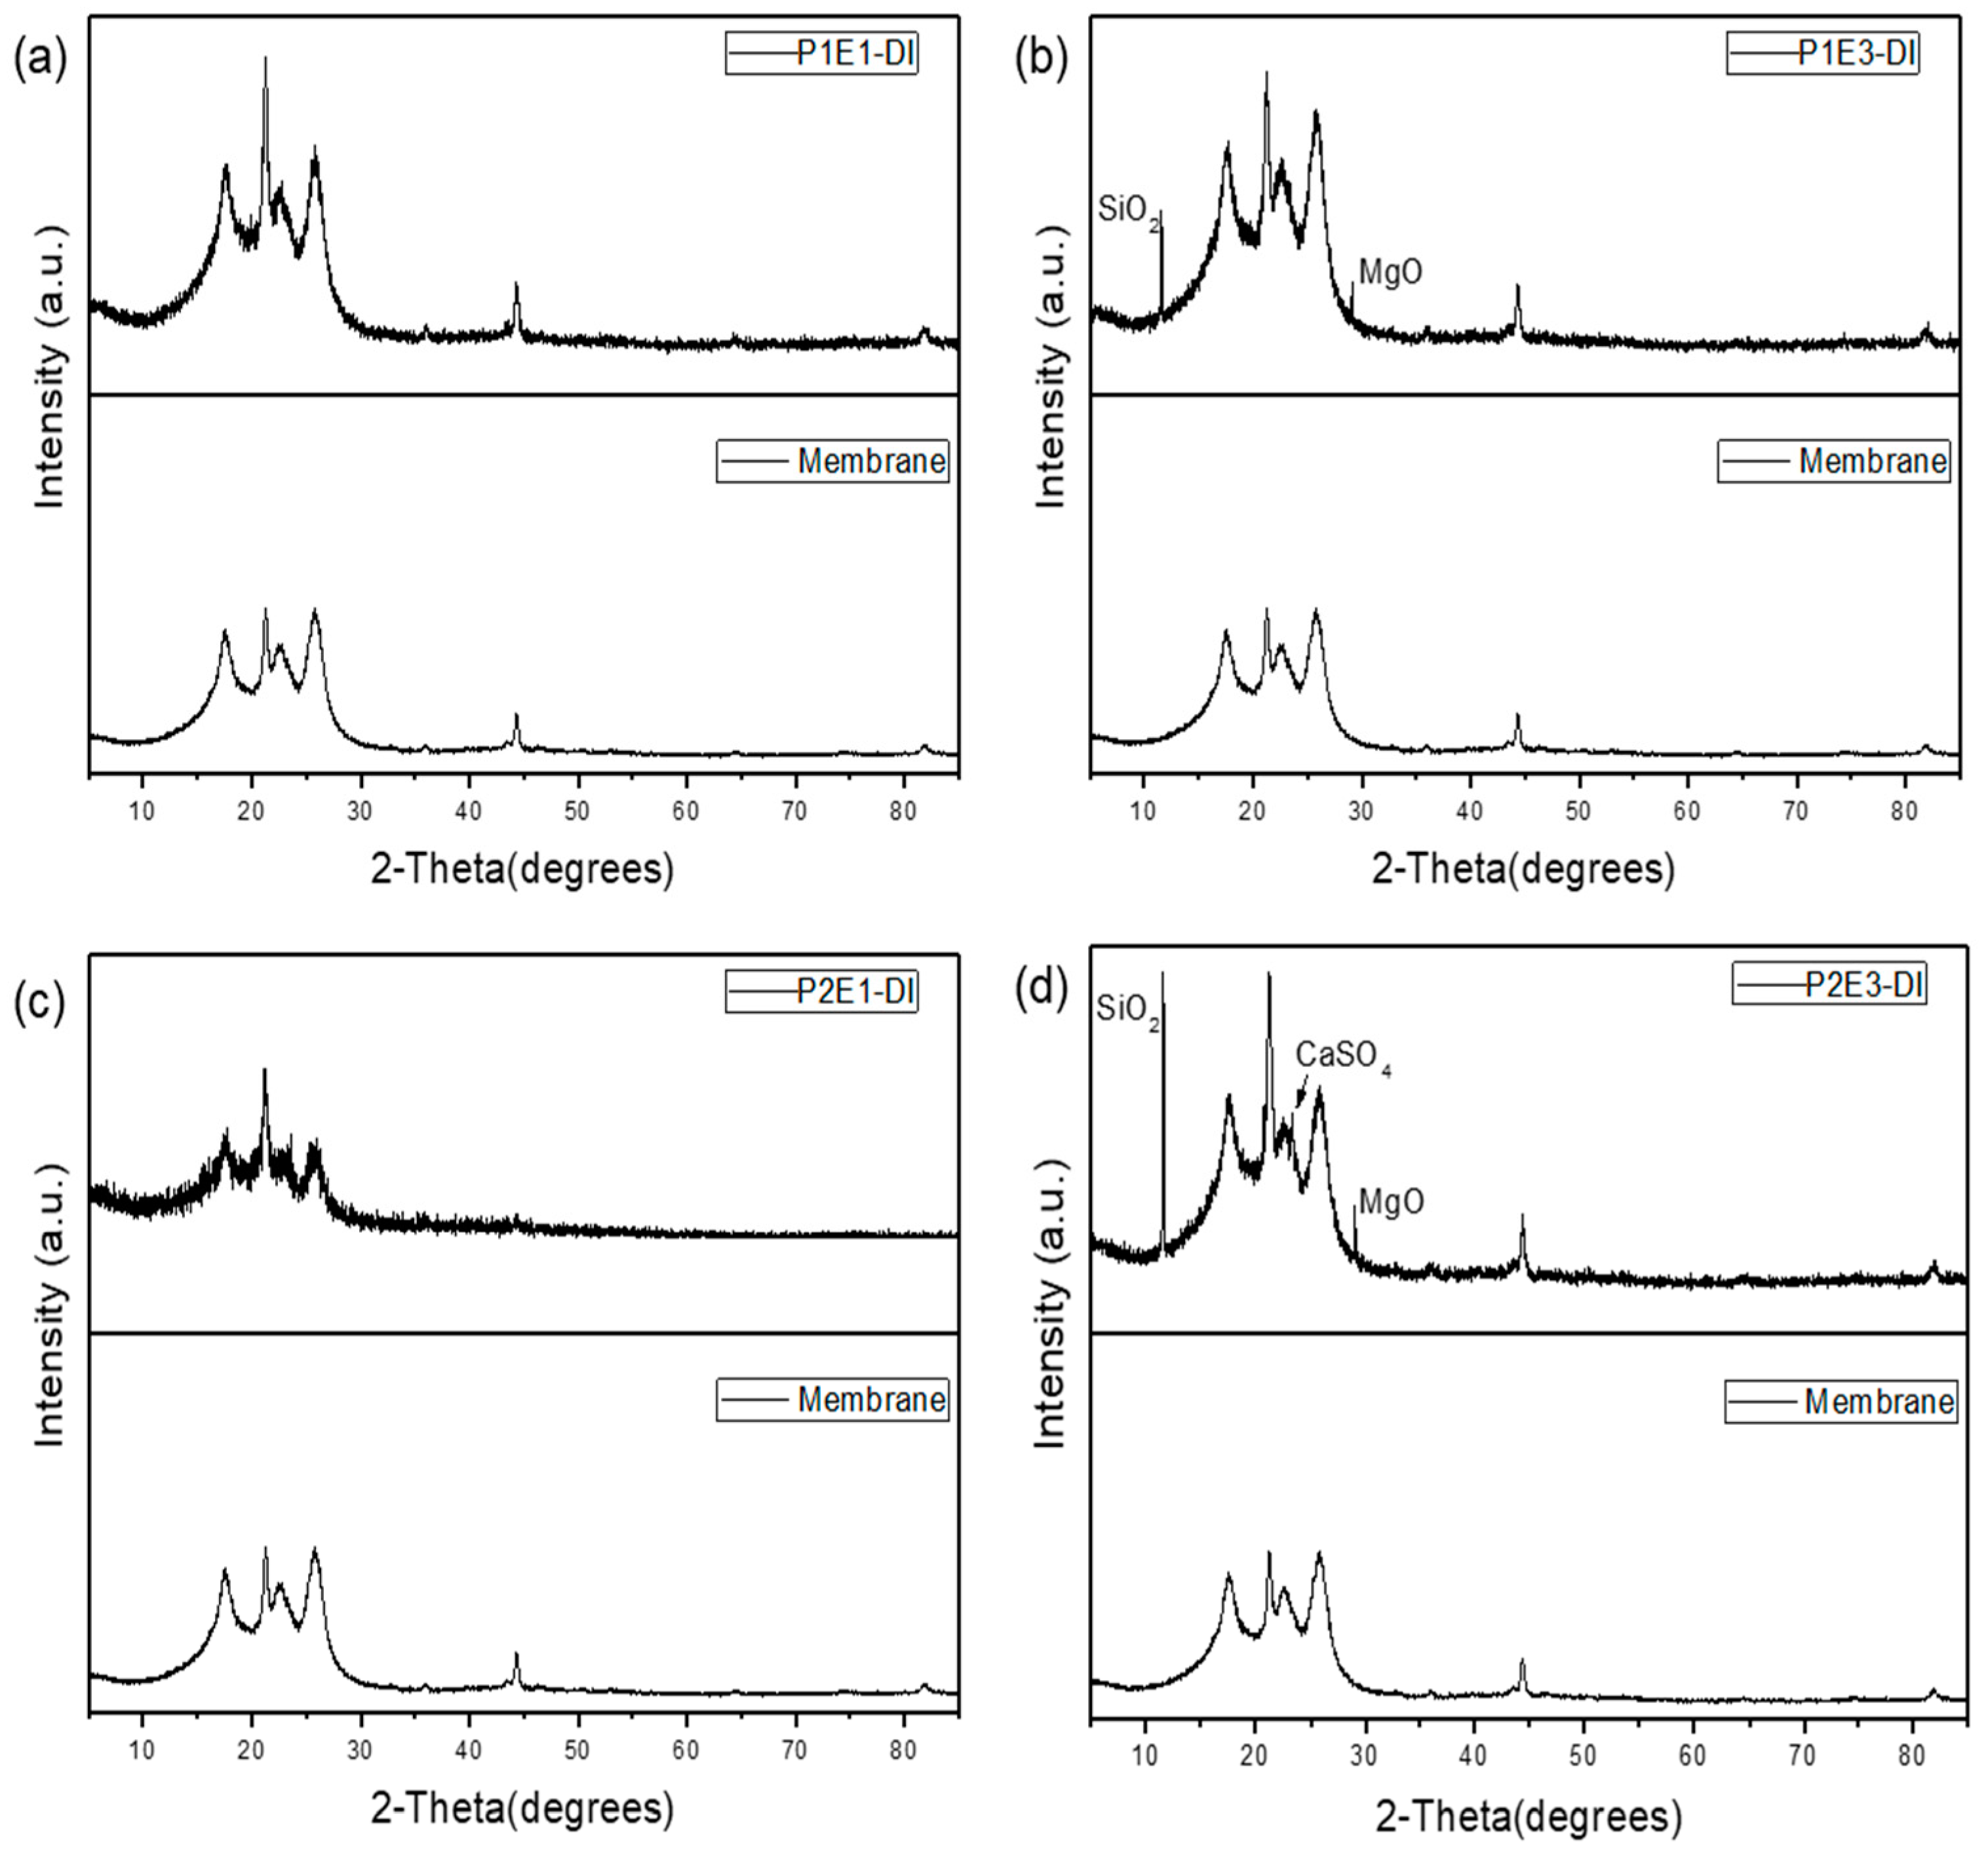
  • Membrane autopsy results by SEM, EDX and XRD revealed that in the presence of the EMF, the fouling and scaling layer formed on the RO membrane surface was looser and could be more easily removed by hydraulic flushing. The oscillating electric field induced by the HydroFLOW units improved ion migration which weakened the concentration polarization on the membrane surface and increased nucleation in the bulk solution. The comparison between the lead elements between P1 and P2 showed the HydroFLOW had a positive effect in controlling silica related colloidal fouling. The XRD results show amorphous colloidal clay fouling in the lead elements and there was no crystal formed on the membrane surface in both phases. The SiO2, MgO, and CaSO4 crystals were detected only in tail-end RO elements of both P1 and P2 phases.
  • The EMF slightly increased the permeate conductivity during groundwater desalination. The existence of the EMF prevented ions from scaling on the membrane surface and increased the free dissolved ions near the membrane surface, thus resulting in more ions being transported through the membrane. However, further studies are needed to investigate the effect of the EMF on salt transport under different operating conditions.
  • For commercial applications, this study suggested that the EMF is more effective in pretreatment rather than cleaning of fouled or scaled membranes. EMF could remove the scales and precipitates in cartridge filters and pipelines, but caused clogging of the membrane feedwater flow channel. Also, HydroFLOW devices with higher intensity than the ones used in this study (model S38 and HS48) would achieve more prominent results.
  • The HydroFLOW devices could provide a chemical-free alternative to control membrane fouling and scaling by alleviating the formation of a compact scaling layer on the membrane surface. Further experiments are needed to evaluate the EMF devices in treating various impaired water resources under different operating conditions, e.g., at different water recoveries, with/without addition of acids and scale inhibitors, and with different strengths and durations of hydraulic flushing.

Author Contributions

W.J., X.X., L.L., H.W., R.S., D.L. and P.X. conducted the pilot-scale experiments; W.J., X.X., and P.X. wrote the paper.

Funding

This research was funded by the National Science Foundation Engineering Research Center ReNUWIt, grant number EEC-1028968.

Acknowledgments

The authors thank HydroFLOW USA for providing the testing devices, YuJung Chang at AECOM for technical support, and Steven Holland and Roberto Granados with the U.S. Bureau of Reclamation for technical assistance during the experiments.

Conflicts of Interest

The authors declare no conflict of interest. The funders had no role in the design of the study; in the collection, analyses, or interpretation of data; in the writing of the manuscript, or in the decision to publish the results.

References

  1. Malaeb, L.; Ayoub, G.M. Reverse osmosis technology for water treatment: State of the art review. Desalination 2011, 267, 1–8. [Google Scholar] [CrossRef]
  2. Xu, P.; Capito, M.; Cath, T.Y. Selective removal of arsenic and monovalent ions from brackish water reverse osmosis concentrate. J. Hazard. Mater. 2013, 260, 885–891. [Google Scholar] [CrossRef] [PubMed]
  3. Wenten, I. Reverse osmosis applications: Prospect and challenges. Desalination 2016, 391, 112–125. [Google Scholar] [CrossRef]
  4. Xu, P.; Bellona, C.; Drewes, J.E. Fouling of nanofiltration and reverse osmosis membranes during municipal wastewater reclamation: Membrane autopsy results from pilot-scale investigations. J. Membr. Sci. 2010, 353, 111–121. [Google Scholar] [CrossRef]
  5. Melián-Martel, N.; Sadhwani, J.; Malamis, S.; Ochsenkühn-Petropoulou, M. Structural and chemical characterization of long-term reverse osmosis membrane fouling in a full scale desalination plant. Desalination 2012, 305, 44–53. [Google Scholar] [CrossRef]
  6. Ruiz-García, A.; Melián-Martel, N.; Mena, V. Fouling characterization of RO membranes after 11 years of operation in a brackish water desalination plant. Desalination 2018, 430, 180–185. [Google Scholar] [CrossRef]
  7. Antony, A.; Low, J.H.; Gray, S.; Childress, A.E.; Le-Clech, P.; Leslie, G. Scale formation and control in high pressure membrane water treatment systems: A review. J. Membr. Sci. 2011, 383, 1–16. [Google Scholar] [CrossRef]
  8. Kang, G.-d.; Cao, Y.-m. Development of antifouling reverse osmosis membranes for water treatment: A review. Water Res. 2012, 46, 584–600. [Google Scholar] [CrossRef]
  9. Goh, P.; Lau, W.; Othman, M.; Ismail, A. Membrane fouling in desalination and its mitigation strategies. Desalination 2018, 425, 130–155. [Google Scholar] [CrossRef]
  10. Jiang, S.; Li, Y.; Ladewig, B.P. A review of reverse osmosis membrane fouling and control strategies. Sci. Total Environ. 2017, 595, 567–583. [Google Scholar] [CrossRef] [Green Version]
  11. Anis, S.F.; Hashaikeh, R.; Hilal, N. Reverse osmosis pretreatment technologies and future trends: A comprehensive review. Desalination 2019, 452, 159–195. [Google Scholar] [CrossRef]
  12. Xu, P.; Cath, T.Y.; Robertson, A.P.; Reinhard, M.; Leckie, J.O.; Drewes, J.E. Critical Review of Desalination Concentrate Management, Treatment and Beneficial Use. Environ. Eng. Sci. 2013, 30, 502–514. [Google Scholar] [CrossRef]
  13. Tang, F.; Hu, H.-Y.; Sun, L.-J.; Sun, Y.-X.; Shi, N.; Crittenden, J.C. Fouling characteristics of reverse osmosis membranes at different positions of a full-scale plant for municipal wastewater reclamation. Water Res. 2016, 90, 329–336. [Google Scholar] [CrossRef]
  14. Mukhopadhyay, D. Method and Apparatus for High Efficiency Reverse Osmosis Operation. U.S. Patent 6537456B2, 25 March 2003. [Google Scholar]
  15. Tong, T.; Elimelech, M. The global rise of zero liquid discharge for wastewater management: Drivers, technologies, and future directions. Environ. Sci. Technol. 2016, 50, 6846–6855. [Google Scholar] [CrossRef] [PubMed]
  16. Oren, Y.; Korngold, E.; Daltrophe, N.; Messalem, R.; Volkman, Y.; Aronov, L.; Weismann, M.; Bouriakov, N.; Glueckstern, P.; Gilron, J. Pilot studies on high recovery BWRO-EDR for near zero liquid discharge approach. Desalination 2010, 261, 321–330. [Google Scholar] [CrossRef]
  17. Juby, G.; Zacheis, A.; Shih, W.; Ravishanker, P.; Mortazavi, B.; Nusser, M.D. Eastern Municipal Water District and Carollo Engineers. Evaluation and Selection of Available Processes for a Zero-Liquid Discharge System for the Perris, California, Ground Water Basin; DWPR No. 149; U.S. Department of the Interior, Bureau of Reclamation: Denver, CO, USA, 2008.
  18. Warsinger, D.M.; Tow, E.W.; Nayar, K.G.; Maswadeh, L.A. Energy efficiency of batch and semi-batch (CCRO) reverse osmosis desalination. Water Res. 2016, 106, 272–282. [Google Scholar] [CrossRef] [PubMed] [Green Version]
  19. Rouina, M.; Kariminia, H.-R.; Mousavi, S.A.; Shahryari, E. Effect of electromagnetic field on membrane fouling in reverse osmosis process. Desalination 2016, 395, 41–45. [Google Scholar] [CrossRef]
  20. Piyadasa, C.; Ridgway, H.F.; Yeager, T.R.; Stewart, M.B.; Pelekani, C.; Gray, S.R.; Orbell, J.D. The application of electromagnetic fields to the control of the scaling and biofouling of reverse osmosis membranes-A review. Desalination 2017, 418, 19–34. [Google Scholar] [CrossRef]
  21. Brower, J. Magnetic water treatment. Pollut. Eng. 2005, 37, 26–28. [Google Scholar]
  22. Ambashta, R.D.; Sillanpää, M. Water purification using magnetic assistance: A review. J. Hazard. Mater. 2010, 180, 38–49. [Google Scholar] [CrossRef]
  23. Alabi, A.; Chiesa, M.; Garlisi, C.; Palmisano, G. Advances in anti-scale magnetic water treatment. Environ. Sci. Water Res. Technol. 2015, 1, 408–425. [Google Scholar] [CrossRef]
  24. Pelekani, C.; Ostarcevic, E.; Drikas, M.; Patrick, C.; Cook, D. Reverse Osmosis Desalination: Assessment of a Novel Electromagnetic Field for Scale Control. In Proceedings of the International Desalination Association World Congress on Desalination and Water Reuse, Singapore, 11–16 September 2005. [Google Scholar]
  25. Al-Qahtani, H. Effect of magnetic treatment on Gulf seawater. Desalination 1996, 107, 75–81. [Google Scholar] [CrossRef]
  26. Zhang, Y.; Chong, T.; Fane, A.; Law, A.; Coster, H.; Winters, H. Implications of enhancing critical flux of particulates by AC fields in RO desalination and reclamation. Desalination 2008, 220, 371–379. [Google Scholar] [CrossRef]
  27. Gorey, C.; Escobar, I.C.; Gruden, C.L.; Cai, G. Development of microbial sensing membranes. Desalination 2009, 248, 99–105. [Google Scholar] [CrossRef]
  28. Zeppenfeld, K. Prevention of CaCO3 scale formation by trace amounts of copper (II) in comparison to zinc (II). Desalination 2010, 252, 60–65. [Google Scholar] [CrossRef]
  29. Sehn, P. Fluoride removal with extra low energy reverse osmosis membranes: Three years of large scale field experience in Finland. Desalination 2008, 223, 73–84. [Google Scholar] [CrossRef]
  30. Alimi, F.; Tlili, M.; Amor, M.B.; Gabrielli, C.; Maurin, G. Influence of magnetic field on calcium carbonate precipitation. Desalination 2007, 206, 163–168. [Google Scholar] [CrossRef]
  31. Xiaokai, X.; Chongfang, M.; Yongchang, C. Investigation on the Electromagnetic Anti-Fouling Technology for Scale Prevention. Chem. Eng. Technol. Ind. Chem. Plant Equip. Process Eng. Biotechnol. 2005, 28, 1540–1545. [Google Scholar] [CrossRef]
  32. Vedavyasan, C. Pontential use of magnetic fields—A perspective. Desalination 2001, 134, 105–108. [Google Scholar] [CrossRef]
  33. Corbett, B.E. Evaluation of Reverse Osmosis Scaling Prevention Devices at High Recovery; US Department of the Interior: Washington, DC, USA, 2003; pp. 1–35.
  34. Szkatula, A.; Balanda, M.; Kopeć, M. Magnetic treatment of industrial water. Silica activation. Eur. Phys. J. AP 2002, 18, 41–49. [Google Scholar] [CrossRef]
  35. Gabrielli, C.; Jaouhari, R.; Maurin, G.; Keddam, M. Magnetic water treatment for scale prevention. Water Res. 2001, 35, 3249–3259. [Google Scholar] [CrossRef]
  36. Palmer, N.T.; Le, H.; Harrington, P.; Furukawa, D. An EMF Antiscaling System for Desalination of Queensland Nickel’s Wastewater. In Proceedings of the International Desalination Association World Congress, Singapore, 11–16 September 2005. [Google Scholar]
  37. BGNDRF. Water Quality Analysis at the Brackish Groundwater National Desalination Research Facility. Available online: https://www.usbr.gov/research/bgndrf/water.html (accessed on 5 May 2019).
  38. Wang, Y.; He, W.; Müller, J.-D. Sensitivity analysis and gradient-based optimisation of feed spacer shape in reverse osmosis membrane processes using discrete adjoint approach. Desalination 2019, 449, 26–40. [Google Scholar] [CrossRef]
  39. Lutz, H. Ultrafiltration for Bioprocessing; Elsevier: Amsterdam, The Netherlands, 2015. [Google Scholar]
  40. Bard, A.J.; Faulkner, L.R.; Leddy, J.; Zoski, C.G. Electrochemical Methods: Fundamentals and Applications; Wiley: New York, NY, USA, 1980; Volume 2. [Google Scholar]
  41. Lee, S.; Lee, C.-H. Effect of operating conditions on CaSO4 scale formation mechanism in nanofiltration for water softening. Water Res. 2000, 34, 3854–3866. [Google Scholar] [CrossRef]
  42. Cho, Y.I.; Lane, J.; Kim, W. Pulsed-power treatment for physical water treatment. Int. Commun. Heat Mass Transf. 2005, 32, 861–871. [Google Scholar] [CrossRef]
Figure 1. Schematic diagram of the groundwater desalination RO system in BGNDRF.
Water 11 01015 g001
Figure 2. Installation points of the HydroFLOW devices. HS48 was installed in the metal pipeline before the cartridge filter. S38 was installed in the inlet of the RO vessel.
Water 11 01015 g002
Figure 3. (a) Comparison of normalized water permeability, (b) Comparison of water permeability decline rate from 77 h (water recovery reached 50%) to 150 h of desalination, with (Phase 2) and without (Phase 1) HydroFLOW devices.
Water 11 01015 g003
Figure 4. Normalized water permeability and decline rate during Phase 1 testing.
Water 11 01015 g004
Figure 5. Normalized water permeability and decline rate during Phase 2 testing with EMF.
Water 11 01015 g005
Figure 6. Scanning electron micrographs (SEM) of RO membranes. (a), Phase 1 Element 1 (P1E1); (b), Phase 1 Element 1, DI water rinsed (P1E1-DI); (c), Phase 2 Element 1 (P2E1); (d), Phase 2 Element 1, DI water rinsed (P2E1-DI); (e), Phase 1 Element 1 (P1E3); (f), Phase 1 Element 3, DI water rinsed (P1E3-DI); (g), Phase 2 Element 3 (P2E3); (h), Phase 2 Element 3, DI water rinsed (P2E3-DI).
Water 11 01015 g006
Figure 7. Energy dispersive X-ray microanalysis (EDX) of deionized water rinsed RO membranes. (a), Phase 1 Element 1, DI water rinsed (P1E1-DI); (b), Phase 1 Element 3, DI water rinsed (P1E3-DI); (c), Phase 2 Element 1, DI water rinsed (P2E1-DI); (d), Phase 2 Element 3, DI water rinsed (P2E3-DI).
Water 11 01015 g007
Figure 8. X-ray diffraction (XRD) of deionized water rinsed RO membranes. (a), Phase 1 Element 1, DI water rinsed (P1E1-DI); (b), Phase 1 Element 3, DI water rinsed (P1E3-DI); (c), Phase 2 Element 1, DI water rinsed (P2E1-DI); (d), Phase 2 Element 3, DI water rinsed (P2E3-DI).
Water 11 01015 g008
Figure 9. Permeate conductivity and Normalized water permeability during the Phase 1 experiment.
Water 11 01015 g009
Figure 10. Permeate conductivity and Normalized water permeability during the Phase 2 experiment.
Water 11 01015 g010
Table 1. Groundwater quality for RO testing at BGNDRF.
Water Quality ParameterUnitWell 1Well 2
Temperature°C37.2 ± 5.124.1 ± 2.5
pHpH unit7.6 ± 0.27.3 ± 0.1
Electrical conductivityµS/cm17,123 ± 3046300 ± 353
Total dissolved solidsmg/L1179 ± 2675670 ± 346
Langelier Saturation IndexSI0.17 ± 0.210.45 ± 0.18
Total alkalinity (as CaCO3)mg/L151 ± 14222 ± 20
Chloridemg/L36.6 ± 1.3538.5 ± 24.1
Sulfatemg/L641.2 ± 191.12952.5 ± 234.6
Total hardness (as CaCO3)mg/L209 ± 732488 ± 42
Calciummg/L60 ± 21486 ± 15
Magnesiummg/L14.4 ± 4.8309.0 ± 9.2
Potassiummg/L4.7 ± 0.42.3 ± 0.2
Silicon dioxidemg/L25.4 ± 2.722.5 ± 1.6
Sodiummg/L305 ± 30691 ± 74
Strontiummg/L1.9 ± 0.48.2 ± 0.2
Table 2. RO system scaling simulated by ROSA modeling for desalination of Well 2 groundwater.
ParameterFeedwaterConcentrate
Langelier Saturation Index1.071.80
Stiff & Davis Stability Index0.691.16
Ionic Strength (Molar)0.140.29
CaSO4 (%Saturation)105238
BaSO4 (%Saturation)174352
SrSO4 (%Saturation)71150
Table 3. k values of different operation periods (P1: Phase 1, P2: Phase 2).
Operation PeriodOperating Time (h)Total Elapsed Operating Time (h)k (Lmh/kPa-h)
P1 at water recovery 50% and 150 h operation77150(1.2 ± 0.32) × 10−4
P1 between 2nd and 3rd flush110308(0.89 ± 0.14) × 10−4
P1 between 3rd and 4th flush66376(1.4 ± 0.51) × 10−4
P2 at water recovery 50% and 150 h operation77150(0.74 ± 0.17) × 10−4
P2 between 1st and 2nd flush163379(1.2 ± 0.11) × 10−4
P2 between 2nd and 3rd flush115495(1.2 ± 0.76 × 10⁻⁴
P2 between 3rd and 4th flush143638(0.86 ± 0.32) × 10−4
P2 between 4th and 5th flush116753(0.77 ± 0.48) × 10−4

