Assessing the Agricultural Drainage Water with Water Quality Indices in the El-Salam Canal Mega Project, Egypt


1
Environmental Engineering Department, Egypt-Japan University of Science and Technology, (E-JUST), P.O. Box 179, New Borg Al-Arab City, 21934 Alexandria, Egypt
2
Irrigation and Hydraulics Engineering Department, Faculty of Engineering, Tanta University, 31511 El-Gharbia, Egypt
3
Dean of School of Energy Resources, Environment and Chemical & Petrochemical Engineering, Egypt-Japan University of Science and Technology, 21934 Alexandria, Egypt
4
Environmental Health Department, High Institute of Public Health, Alexandria University, 21526 Alexandria, Egypt
5
Civil Engineering Department, Faculty of Engineering, Assiut University, 71515 Assiut, Egypt
6
Civil Engineering Department, Faculty of Engineering, Taif University, Taif 26571, Saudi Arabia
7
Department of Civil and Environmental Engineering, School of Environment and Society, Tokyo Institute of Technology, Tokyo 152-8552, Japan
*
Author to whom correspondence should be addressed.
Water 2019, 11(5), 1013; https://doi.org/10.3390/w11051013
Submission received: 18 March 2019
/
Revised: 10 May 2019
/
Accepted: 13 May 2019
/
Published: 15 May 2019
(This article belongs to the Section Water Resources Management, Policy and Governance)
Abstract
:The water quality index (WQI) is considered one of the most promising methods for the classification of water quality (WQ), which also contributes to water resource management. This study adopted the irrigation WQ index (IWQI) and an analogous index based on a fuzzy logic approach, namely, the fuzzy logic water reuse index (FWRI) to assess the water quality in the El-Salam canal project in Egypt where agriculture drainage water (ADW) is expected to be reused for irrigation. Simulated WQ data using a one-dimensional hydrodynamic model indicated that the WQ deteriorated towards the downstream of the canal due to the polluted water discharged from canal feeders (e.g., the El-Serw and Bahr Hadous drains). The comparison of the FWRI and IWQI indices showed that the FWRI was more sensitive to variations in the WQ parameters compared to the IWQI. In contrast, the Z-test indicated that the indices have different statistical properties. Moreover, a chi-square test (X2) illustrated that the FWRI and IWQI values can both reasonably explain the current situation. However, the FWRI was more relevant to the official classification than the IWQI. Overall, the FWRI proved its capability and accuracy for the assessment of water quality in the El-Salam canal.
1. Introduction
Water scarcity is a serious global issue, including Egypt and other African countries [1]. Annually, 17 billion cubic metres (BCM) of agricultural drainage water (ADW) is produced in Egypt, and this represents a potential backbone for non-conventional water resources in this country [2]. While approximately 55% of ADW is officially reused for irrigation purposes, most of the drainage canals are likely polluted by discharges of untreated domestic and industrial wastewater [3]. The fluctuation in ADW quality due to pollution is considered to be the main issue in the appropriate reuse of ADW. The most common challenge involved in decisions regarding ADW reuse is how to determine whether the quality of the drainage water is suitable for reuse [4].
According to the Food and Agriculture Organization (FAO), there are a number of different water quality guidelines related to irrigated agriculture [5]. Each has been useful, though none has been entirely satisfactory because of the wide variability in environmental conditions. The FAO is mainly concerned about the effect of water quality upon soil and crops, therefore, five categories are applied to water quality-related problems in irrigated agriculture: (a) salinity hazards (electrical conductivity (EC) and total dissolved solids (TDS)), (b) infiltration and permeability hazards (EC and sodium absorption ratio), (c) specific ion toxicity (sodium adsorption ratio (SAR), boron, and chloride), (d) trace element toxicity, and (e) miscellaneous impacts on sensitive crops (pH, nitrate, and bicarbonates). In the Egyptian standards (Law 48/1982), chemical water quality parameters (e.g., pH, TDS, dissolved oxygen (DO), biochemical oxygen demand (BOD5) nitrates (NO3-N), phosphate, and heavy meatal) are selected to classify the suitability of ADW for reuse in irrigation. In addition, the expected water quality level may be different depending on the specific types of irrigation [6]. Consequently, there is a need for the development of a comprehensive approach to spatiotemporally assess the water quality in drainage canals in countries with potential water scarcity.
Several approaches to water quality (WQ) assessment have been applied to provide an accurate or reasonable evaluation [7,8]. Among them, the WQ index (WQI) is considered one of the most promising methods for WQ classification and a set of WQ parameters is employed depending on the purposes [4]. Basically, the WQI includes a mathematical approach to convert the WQ parameters at a certain site and time into a number ranging from 0 to 100, with the number indicating the real WQ status against the standards [9]. The first WQI was proposed by Horton [10], and numerous WQIs have been further developed, including WQ indices developed by the National Sanitation Foundation (NSFWQI) [11], Florida Stream (FSWQI) ((SAFE) 1995) [12], Canada (CWQI) [13], British Columbia (BCWQI) and Oregon (OWQI) [14]. Most of these indices were established on the basis of the WQ index for the National Sanitation Foundation, i.e., NSFWQI [9,15,16]. However, these indices generally provide a rough estimation, and in some cases, result in imprecise outcomes [17], therefore, it is unlikely that the existing indices are capable of handling environmental and experimental uncertainties in an appropriate manner [18].
WQ assessment approaches utilizing artificial intelligence (AI) computational methods have been developed in the last two decades to integrate the distinct parameters involved [19,20]. The advanced AI techniques in WQ/HD include the knowledge-based system (KBSs), genetic algorithm (GA), artificial neural network (ANN), and fuzzy inference system (FIS) [21]. Among them, the fuzzy logic was initially proposed by Zadeh [22] in 1965, and it is useful for modelling complex and imprecise systems. Also, many aquatic systems have a paucity of WQ data due to cost constraints [23]. Moreover, the fuzzy logic method was recently tested with real environmental problems to diminish the uncertainty and imprecision of the criteria which were utilized in decision-making procedures [24,25]. Furthermore, the fuzzy inference system (FIS) has provided an alternative tool to deal with information that is not well identified, or not precise [20,26].
Since these approaches describe the WQ status at a specific time and location according to the monitoring location distribution and schedule, WQ simulation is an ideal approach in the holistic evaluation of temporal and spatial water quantity and quality conditions [4]. To date, several WQ models have been developed for the simulation of water quality in any aquatic system, such as the Environmental Fluid Dynamics Code (EFDC), Delft 3D, SOBEK software, MIKE software and the Water Quality Analysis Simulation Program (WASP) [27]. Among them, MIKE 11 represents the most widely used hydrodynamic (HD) and WQ simulation software. The MIKE 11 has proved its computational stability, high accuracy and reliability, and consequently it can be used for the comprehensive design of all types of channel systems [28,29].
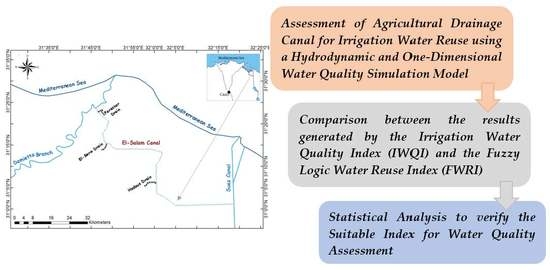
Therefore, this study aimed to assess the WQ in agricultural canals. As an agricultural canal, the El-Salam Canal was selected because it is the largest, currently on-going ADW reuse project in Egypt. The HD and one-dimensional WQ simulation model were employed to obtain a spatiotemporal data set for WQ parameters. The WQ assessment was then performed to investigate the suitability of the WQ index for water reuse via a comparison between the results generated by the irrigation WQ index (IWQI) and the fuzzy logic water reuse index (FWRI). Moreover, statistical assessment of both indices (FWRI and IWQI) was performed to verify these indices in the WQ assessment.
2. Materials and Methods
2.1. Study Area
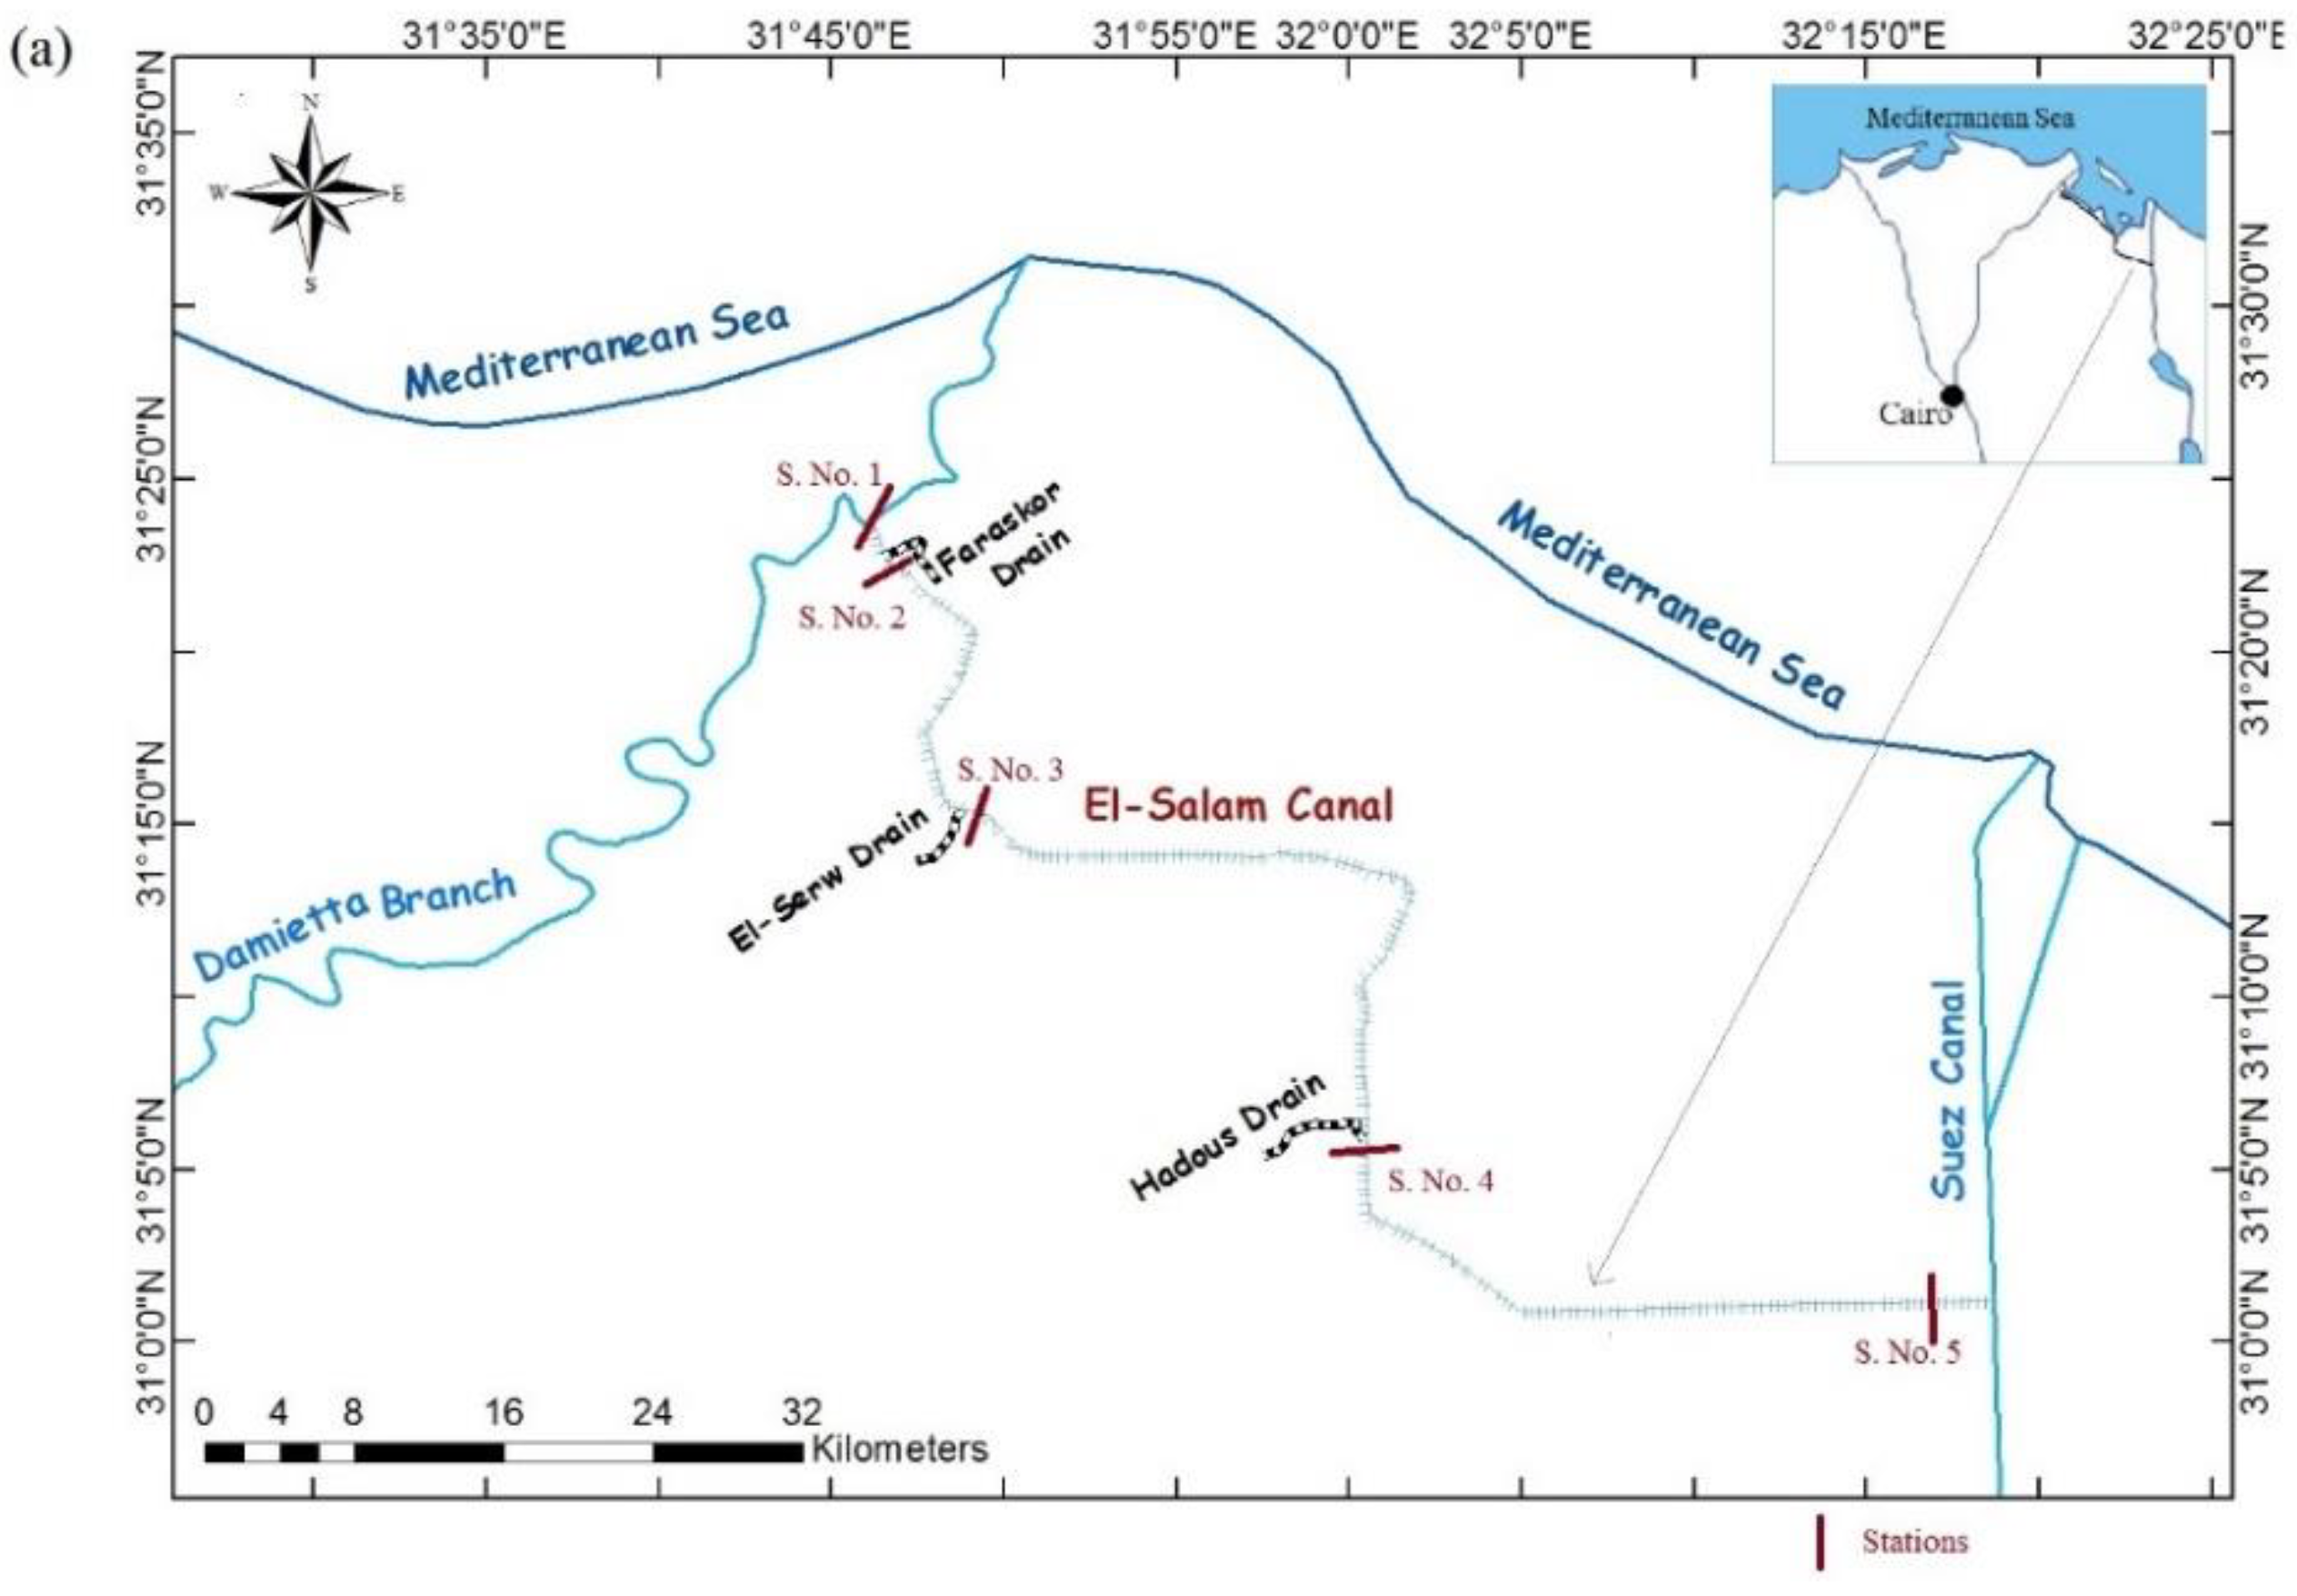
The El-Salam Canal is one of the largest on-going projects for ADW reuse in Egypt, in which 0.872 BCM/year of the Nile River is mixed with 0.255 BCM, 0.980 BCM and 1.235 BCM of ADW from the Faraskor, El-Serw and Bahr Hadous drains, respectively. The mixed water in the El-Salam Canal is mainly used for the reclamation of 620,000 hectares of land located along the Mediterranean coast of Egypt (220,000 hectares extending west of the Suez Canal and approximately 400,000 hectares extending east of the Suez Canal) [2]. The canal is in the northeast region of the Nile Delta with a total length of approximately 88 km (Figure 1a). The flow rates of these drains are controlled using pumping station units to keep the total dissolved solids (TDS) of the mixed water in the El-Salam Canal at a level of 1200 mg/L to satisfy the Egyptian standards of reuse for irrigation purposes [30].
Figure 1b shows the ADW supply sites from the Faraskor, El-Serw, and Bahr Hadous drains at distances of 1.80 km, 17.85 km, and 54 km from the intake, respectively. Pump Stations No. 1 and No. 2 have been constructed along the main stream of the canal to maintain a suitable head for gravity flow (Figure 1b). These pump stations divide the canal into three reaches (Figure 1c). The first reach extends from 0.0 km to 22 km along the canal, with a bed width of 38 m and a berm width of 2.8 m. The second reach spans from 22 km to 53 km along the canal, with bed and berm widths of 44 m and 6.4 m, respectively. The third reach is 35 km long, spanning from 53 km to 88 km along the canal with a bed width ranging from 46 m to 54 m and a berm width of 6.5 m. The side slope for all cross-sections along the El-Salam Canal is 2:1 (horizontal:vertical).
In this study, the average monthly records of water discharges along the canal were obtained from the Ministry of Water Resources and Irrigation (MWRI) from September 2012 to August 2014 for seven locations: the intake of the canal (0.0 km), the Faraskor drain (1.80 km), the El-Serw drain (17.85 km), Pump Station No. 1 (22 km), Pump Station No. 2 (53 km), the Bahr Hadous drain (54 km) and the Suez canal (88 km). The average monthly WQ data were collected by the Drainage Research Institute (DRI) from September 2013 to August 2014 at five locations along the canal at 0.0 km, 1.80 km, 17.85 km, 54 km and 88 km. Table 1 summarizes the average discharges from September 2012 to August 2014 and WQ from September 2013 to August 2014 for the locations along the El-Salam Canal, as well as Egyptian standards for the reuse of drainage water in irrigation according to Law 48/1982.
2.2. Water Quality Modelling
The software ‘MIKE 11’ was used to simulate the water quantity and WQ along the El-Salam Canal. MIKE 11 was initially developed by the Danish Hydraulic Institute (DHI) to simulate water flows, WQ and sediment transport in rivers, estuaries and irrigation systems [31]. The HD module is a one-dimensional, non-steady, non-uniform flow simulation model that describes the water motion using Saint-Venant equations. The WQ module (ECO-Lab) was coupled to the advection-dispersion (AD) module [32]. The ECO-Lab module deals with the biochemical transformation processes along the canal and the AD module is used to simulate the simultaneous transport processes. The WQ template of the ECO-Lab module is divided into six levels starting from the simplest relationship between biochemical oxygen demand (BOD5) and chemical oxygen demand (COD), and leading to complex processes, such as nitrification, denitrification, sediment precipitation, resuspension, and oxygenation. A complete description of the model theory is found elsewhere [31].
The 88 km long El-Salam Canal (west of the Suez Canal) was modelled, including a number of structures, namely the head regulator, two siphons and two pump stations as shown in Figure 1. The boundary editor of MIKE 11 was used to define the water levels and inflow hydrographs. The initial upstream water level of the El-Salam Canal was set to 1.6 m to facilitate the inflow to the canal from the Damietta Branch Dam, which was built to raise the water level to 1.7 m above the mean sea level (MSL) at the El-Salam Canal intake. The simulation time step was set to five seconds to ensure the stability of the numerical calculations and to keep the Courant number in the desired model’s range. A WQ template was developed to simulate the particular WQ parameters such as total dissolved solids (TDS), dissolved oxygen (DO), BOD5 and nitrates (NO3-N). The WQ data for the canal over one year from September 2013 to August 2014 were extensively used for the simulation process. Moreover, the integration solution was conducted using the Euler integration method [31].
The calibration process of the HD model was performed by modifying Manning’s roughness coefficient (M) values to minimize the difference between the simulated and observed discharge data. The HD data over one year from September 2012 to August 2013 were used in the El-Salam Canal model calibration process. The model was continuously run to obtain the least difference between the simulated and observed discharges at two locations (Pump Station No. 1 and Pump Station No. 2 at 22.0 km and 53.0 km along the canal, respectively). For validation, the calibrated model was run using a completely different year data set (from September 2013 to August 2014) to assess the ability of the calibrated model to predict the water quantity and WQ under different conditions. The calibration and validation accuracy were tested based on calculation of the root mean square error (RMSE) and normalized objective function (NOF) as follows:
where Omean is the mean of the observed data. Model simulations are acceptable for NOF values ranging from 0.0 to 1.0, where the ideal value for the coefficient is 0.0 [4].
2.3. Fuzzy Inference System (FIS)
Membership functions, fuzzy set operations and inference rules are the principles that are used by the FIS to develop a WQ reuse index based on fuzzy logic. A membership function can be varied in form, such as trapezoidal, triangular, etc., and defines each point in the input space plotted to a membership value between 0 and 1. The universe of discourse is the domain of the input set, while the output-axis represents the membership value (µ). A fuzzy set A is derived from Equation (3) where the universe of discourse is X and its elements are denoted by x.
The degree of membership of element x is (μA(x)) value in fuzzy set A. The relationships among the fuzzy subsets are union (OR), intersection (AND) and additive complement (Negation) (NOT). These basic operators express the core of fuzzy logic. Two fuzzy sets A and B are defined on the universe X, for a given element x belonging to X. Equations (4)–(6) express the operations of the fuzzy set.
The relationships among the subsets of the inputs and outputs are defined as the inference rule. To generate a new output subset, the if-then rule is implemented with each rule consisting of two parts. The first part for the ‘if’ is called the antecedent, while the ‘then’ part is termed the consequent, with the rule form:
- IF A is a THEN C is c.
- IF B is b THEN C is c.
where a, b, and c are the linguistic values for the subsets defined for fuzzy sets in the universes of discourse A, B, and C, respectively.
2.4. Water Quality Indices
2.4.1. Water Reuse Index Based on Fuzzy Logic
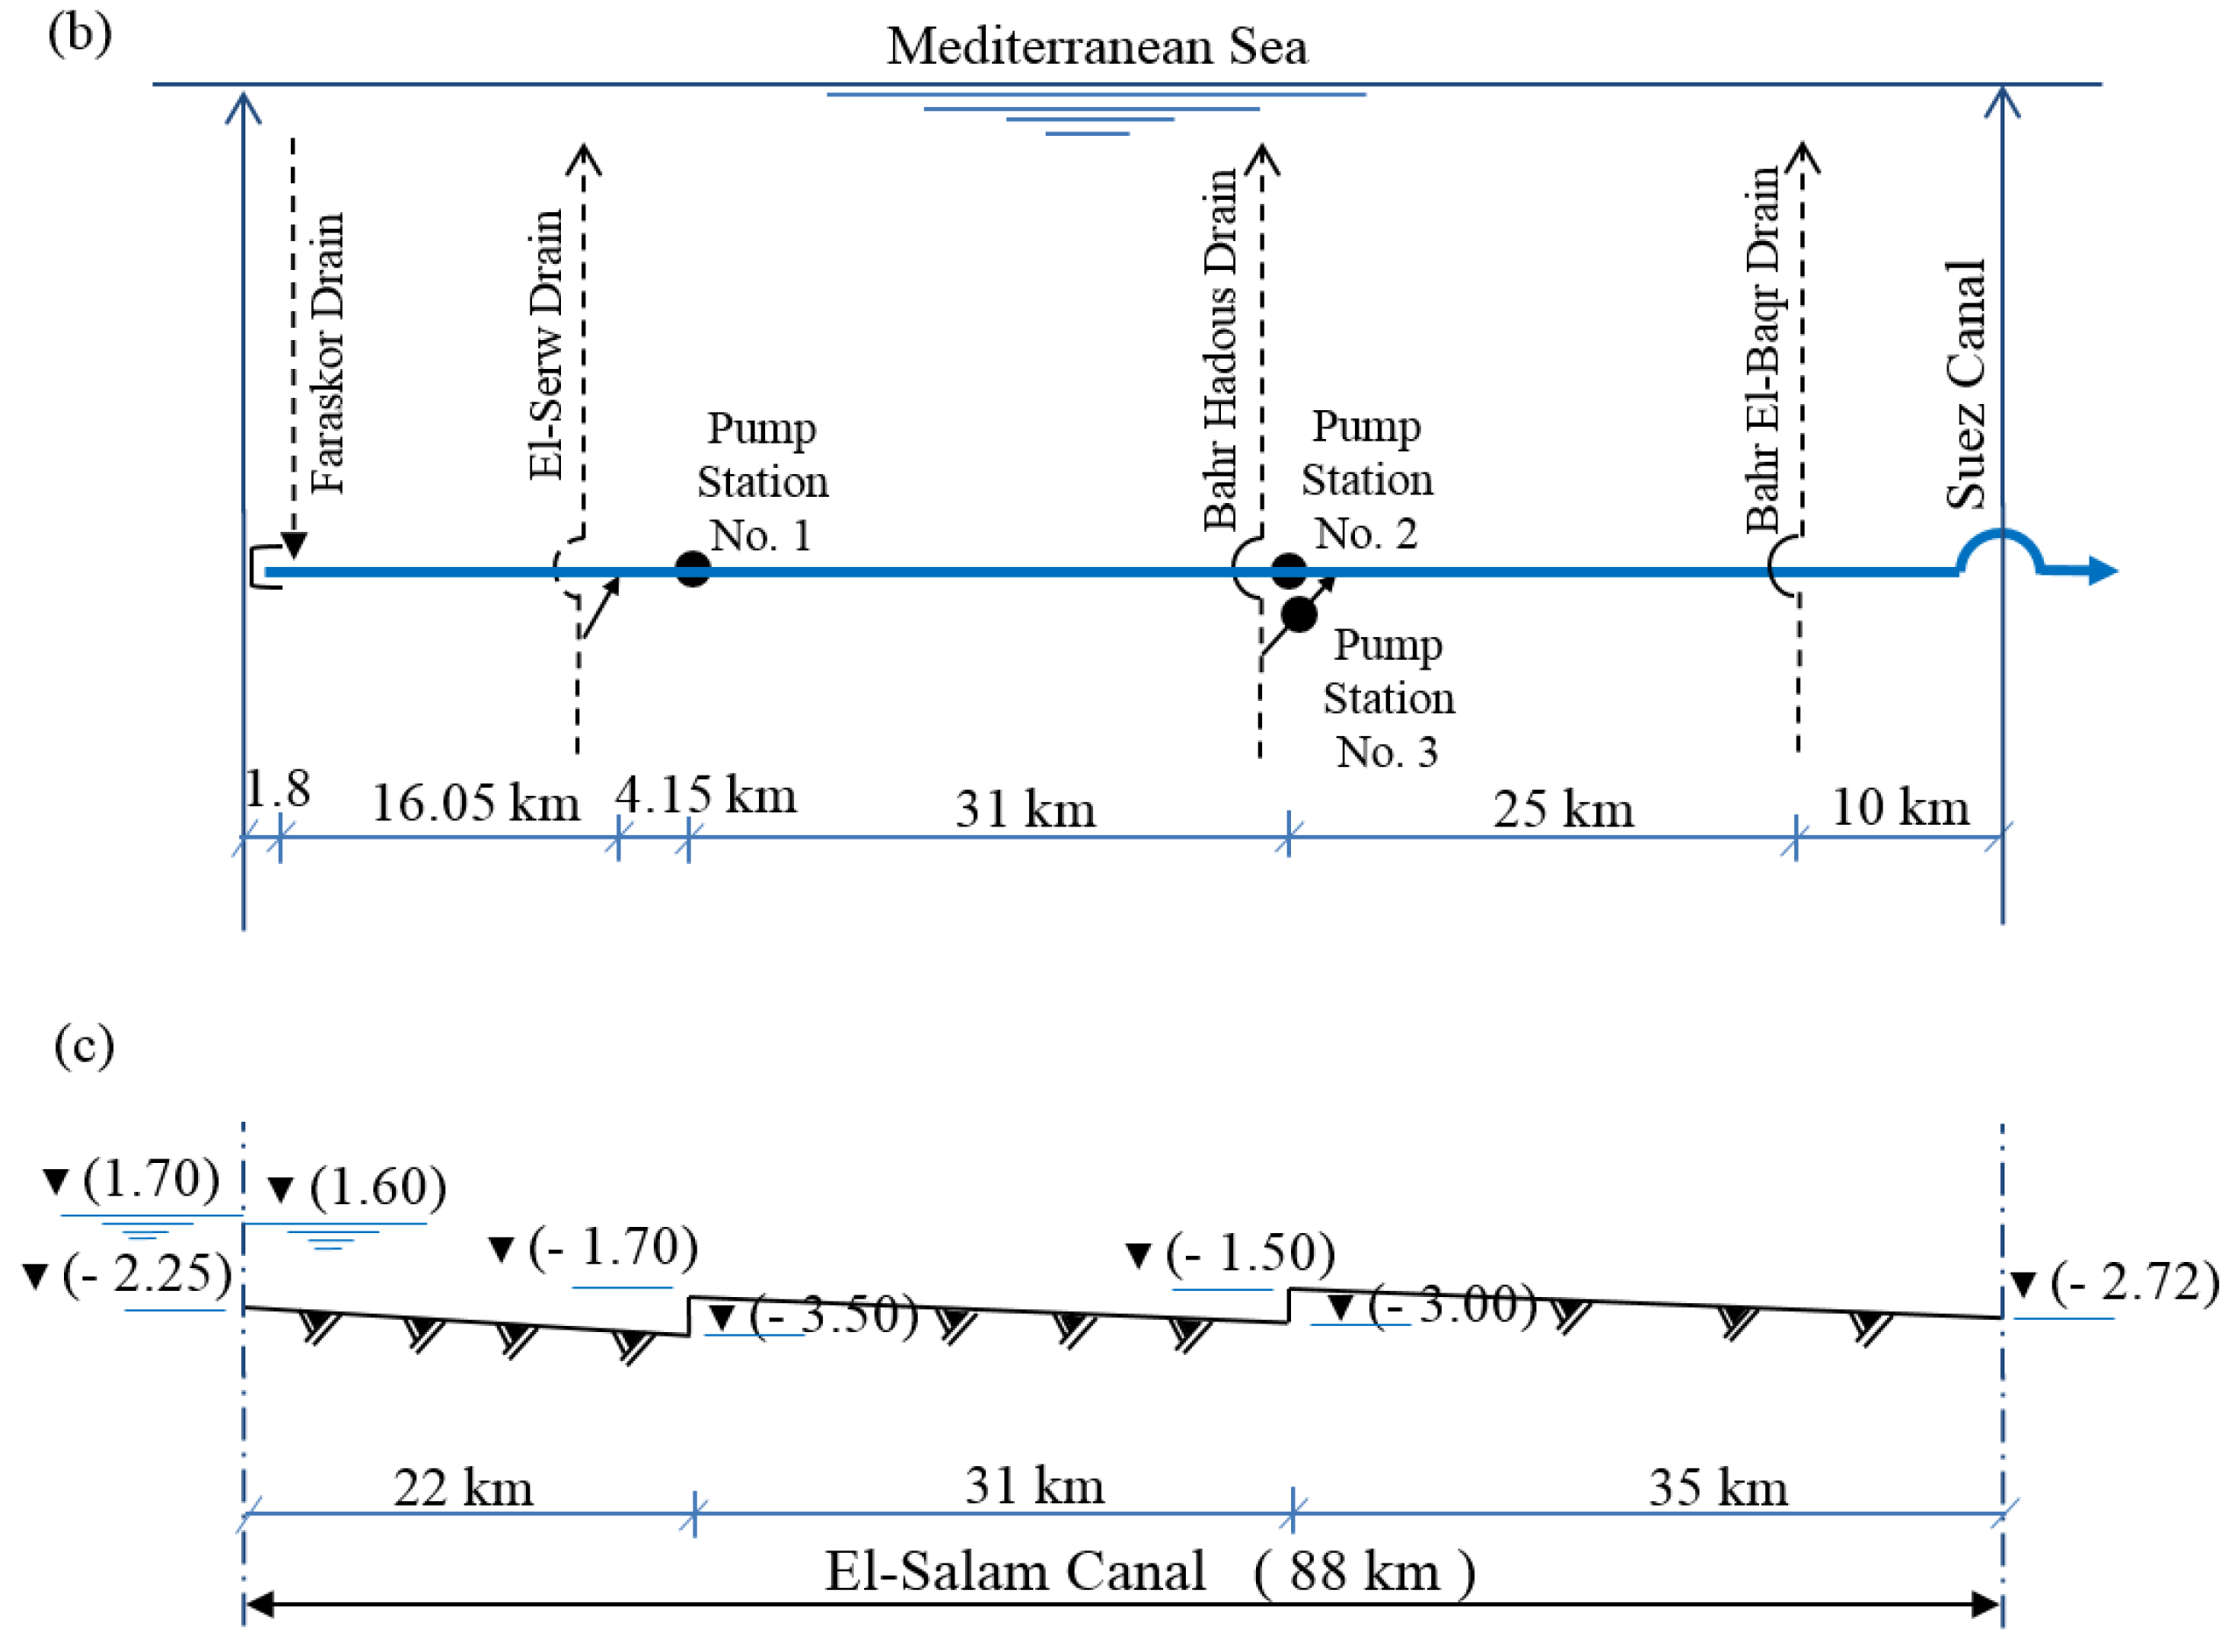
For the evaluation of the ADW quality for reuse in irrigation, a fuzzy model (i.e., FWRI) was built for four major WQ parameters (TDS, DO, BOD5 and NO3-N) according to the Egyptian standards (see Table 1). The prediction of the fuzzy model depends on the number of fuzzy sets used in the mapping process, since it facilitates giving more continuity to the universe of discourse [33].
A triangular membership function was utilized through the FIS for the fuzzy sets of parameters in terms of TDS, DO, BOD5 and NO3-N, as shown in Figure 2. The fuzzy sets in this index were defined by the linguistic variables ‘very low’ (VL), ‘low’ (L), ‘medium’ (M), ‘high’ (H), and ‘very high’ (VH). According to the developed fuzzy sets and linguistic terms for the fuzzy-based index (Table 2), the fuzzy sets were utilized according to Equation (7) as follows:
The FIS normalized the specified WQ parameters to a value between 0 and 100—values near 100 show that the water is more suitable for reuse for agricultural purposes, as shown in Table 2. The rules in the FIS were set based on the Mamdani systems to achieve the maximum possible number of WQ conditions creating the inference rules (75 rules). The generated inference rules are given as follows, e.g.: if (DO is VL) and (BOD5 is H) then (FWRI is VB), if (TDS is VH) and (DO is VL) then (FWRI is VB) and if (DO is H) and (NO3 is M) then (FWRI is VG).
The process of defuzzification for the outputs was implemented by the centre of gravity (centroid) method, which is considered the most prevalent and applicable technique. It is based on the derivation of the following algebraic expression [34], where z* is the defuzzified value.
All computations were implemented using the “fuzzy logic toolbox” in MATLAB2015.
2.4.2. Irrigation Water Quality Index
The irrigation WQ index (i.e., IWQI) was developed by Meireles et al. [35], (see Equations (9) and (10)). This index was selected to be used for the assessment of ADW for reuse in irrigation. The IWQI was calculated according to the WQ parameters for the classification in terms of: TDS, DO, BOD5 and NO3-N. Table 3 shows the proposed water reuse suitability classes, where the index values ranged from 0 to 100, providing a qualitative description of the index output; a higher value indicates better WQ:
where qi is the sub-index of the parameter calculated on the basis of the tolerance boundaries as shown in Table 3. In Equation (10), qmax is the maximum value for qi to each class; xij is the observed value for each parameter; xinf is the associated value for the lower limit of the class where the parameter belongs; qimap is the class amplitude; xamp is the class amplitude where the parameter belongs. In order to estimate the xamp of the last class for each parameter, the higher limit is counted to be the maximum value for the water parameter. A specific weighting factor (wi) for the parameters was proposed based on the basic calculation procedures by Abbasi [36], as shown in Table 4.
3. Results and Discussion
3.1. Water Quality Simulation
The one-dimensional HD and WQ model were applied to simulate water quantity and WQ along the El-Salam Canal. In the calibration process (September 2012–August 2013), the M value which achieved the lowest error in discharge was 40 m1/3/s. The RMSE and NOF values between the observed and simulated discharge were 1.66 m3/s and 0.02 for Pump Station No. 1 and 1.10 m3/s and 0.02 for Pump Station No. 2, respectively. Moreover, for the validation period (September 2013–August 2014), the RMSE values were 2.94 m3/s and 1.39 m3/s, with NOF values of 0.04 and 0.02 for the discharges of Pump Stations No. 1 and No. 2, respectively. The model calibration and validation for the discharges of the pump stations (with the low NOF values) evidenced the ability of the model to correctly simulate the processes in the canal and therefore, it seemed reasonable to employ the simulated discharge to investigate the impact of various management scenarios. The TDS, DO, BOD5 and NO3-N results from the calibration model (September 2013–August 2014) were calculated at two different locations: (1) after mixing with the Faraskor drain at 1.9 km; and (2) before the downstream of the canal at 86 km from the intake (Table 5).Overall, the model provided reasonable agreement with observed WQ data along the El-Salam Canal, though TDS at 1.9 km and DO at 86 km showed relatively high NOF values.
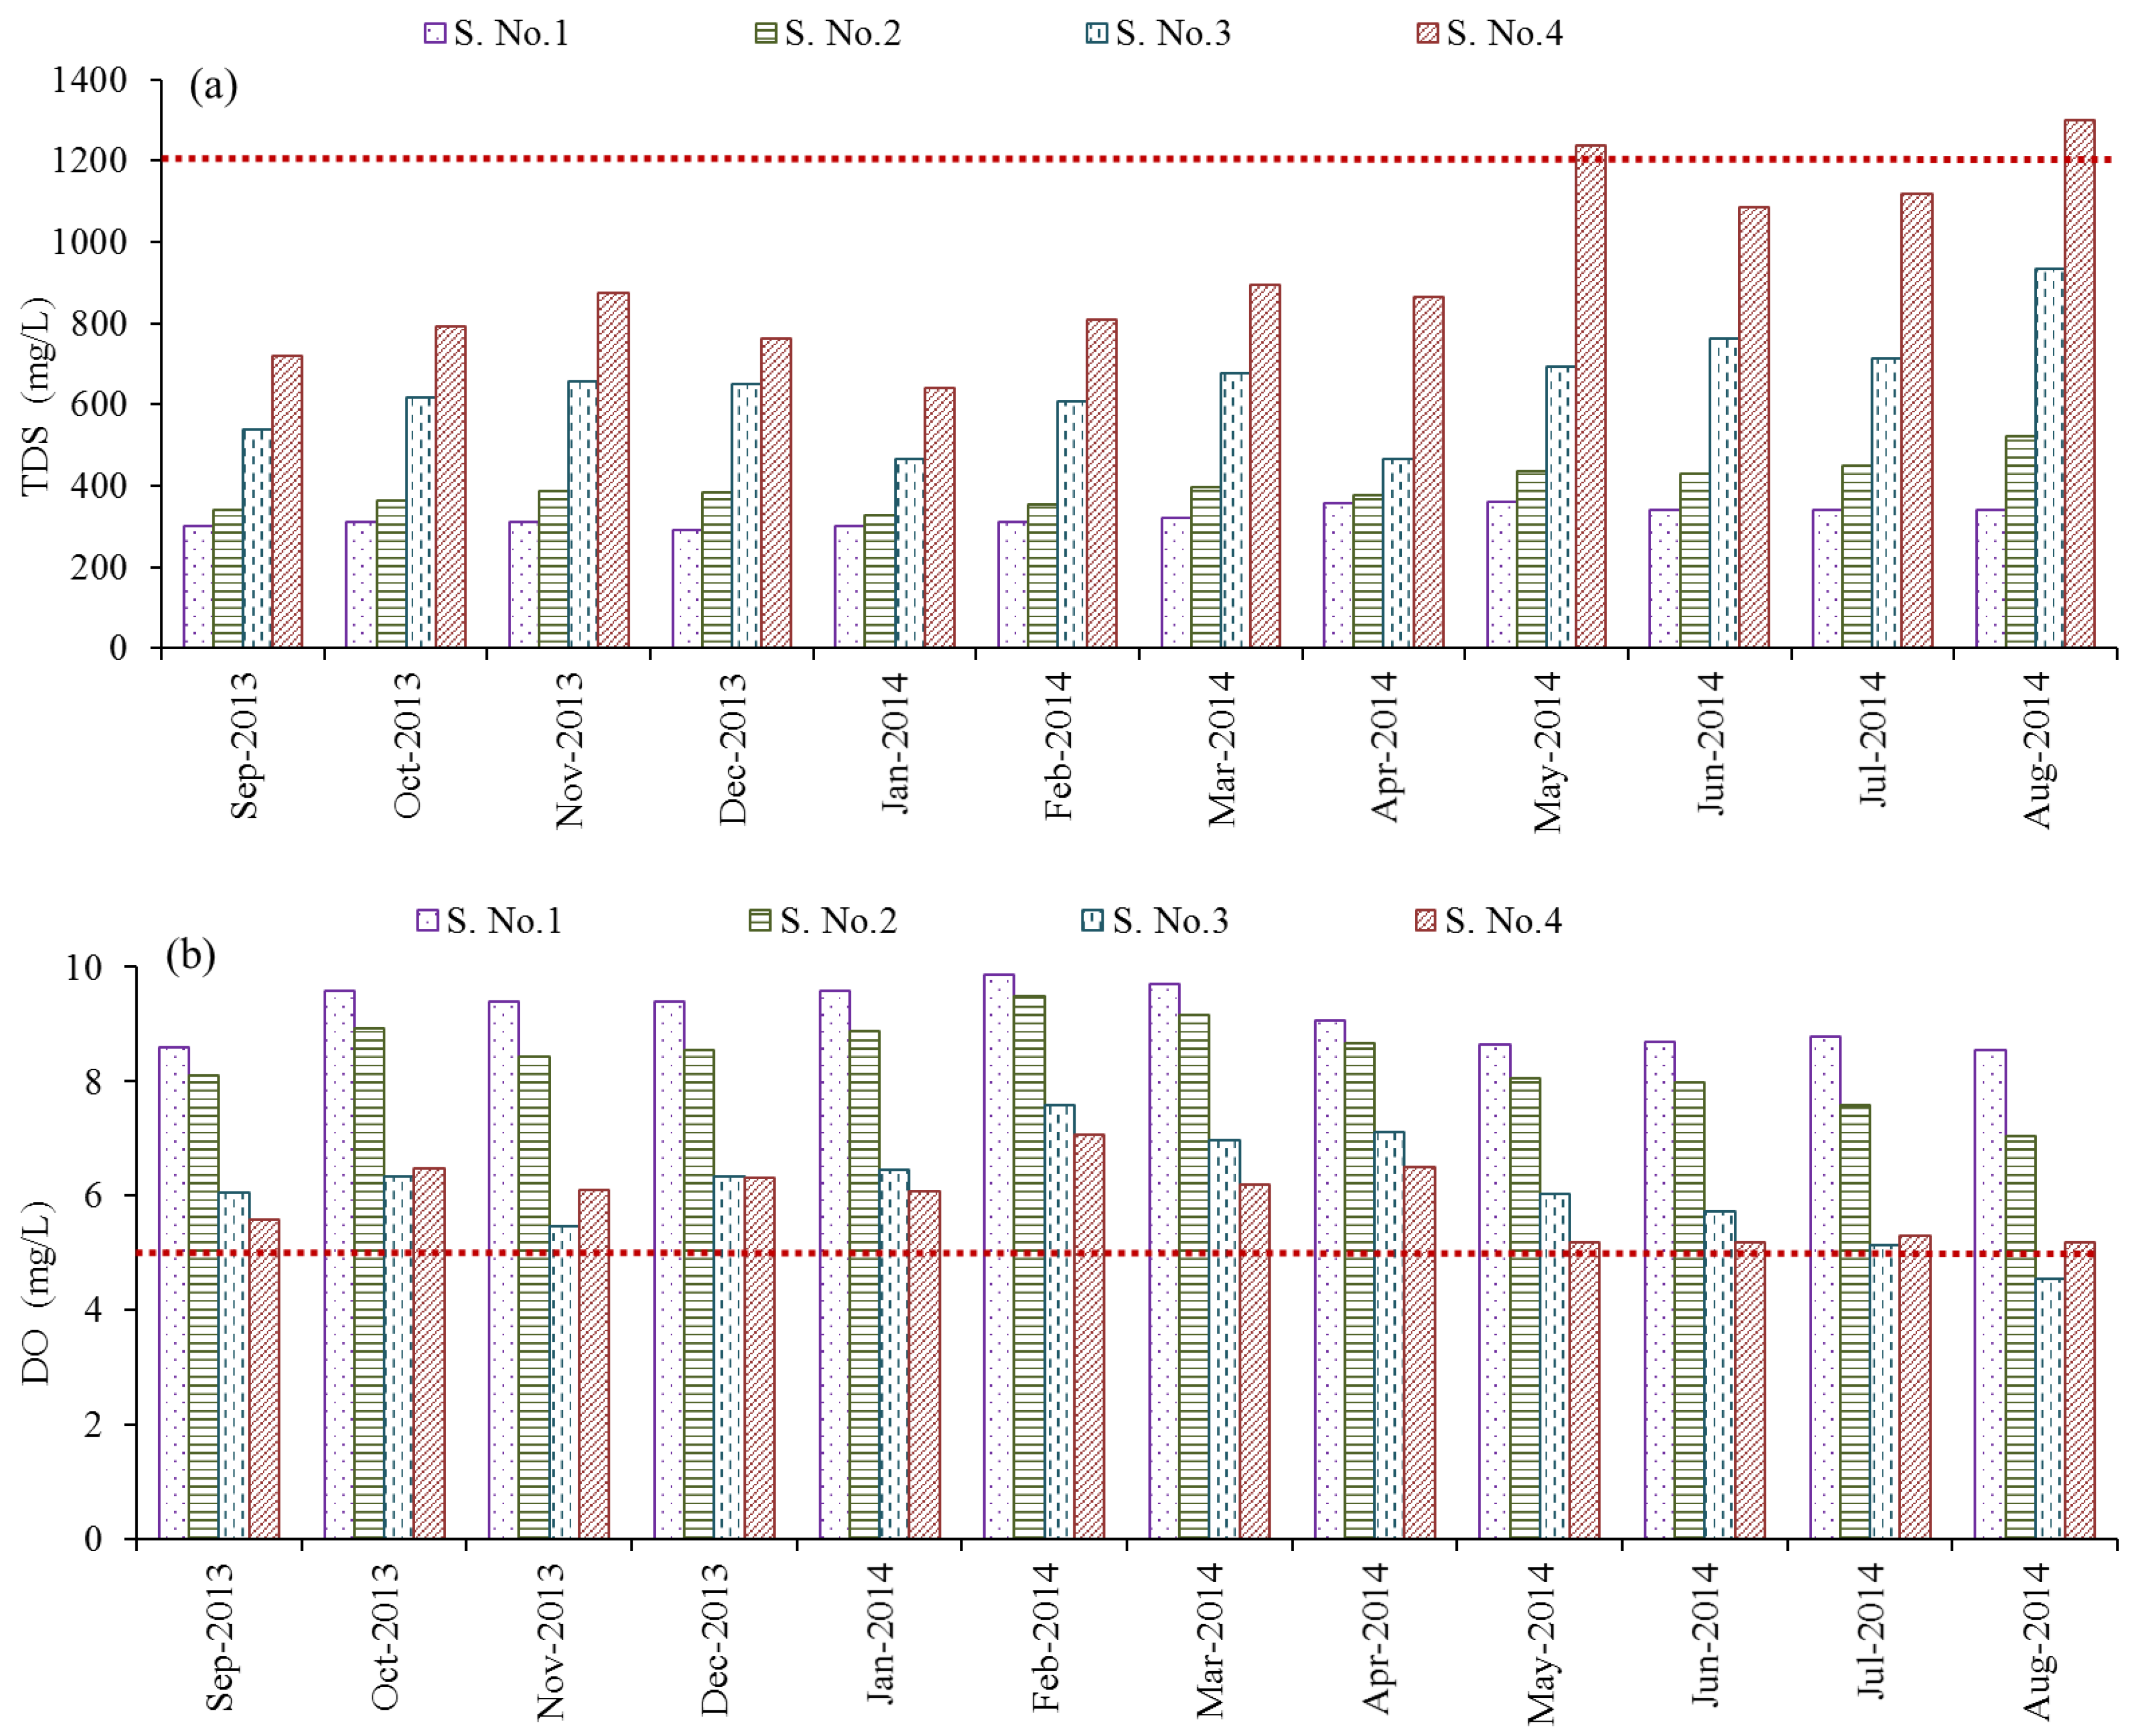
The simulated WQ parameters for the period from September 2013 to August 2014 along the El-Salam Canal at four selected stations (S.) from the intake and after mixing with the agricultural drains, were compared with the Egyptian standards for water reuse in irrigation as shown in Figure 3a–d. Stations S. No. 1, S. No. 2, S. No. 3, and S. No. 4 were located at 0.0 km, 1.85 km, 18.5 km and 55.0 km, respectively. The TDS values along the El-Salam Canal varied from 292 mg/L to 1300 mg/L, from September 2013 to August 2014 (Figure 3a). The TDS concentration violated the Egyptian standards (TDS < 1200 mg/L) for direct reuse of water for irrigation after the connection with the Bahr Hadous drain (S. No. 4). The highest TDS values from 1085 mg/L to 1300 mg/L were registered at S. No. 4 in the summer season, particularly from May to August, due possibly to highly polluted water discharged from the Bahr Hadous drain, where the TDS values of ADW were at a maximum of 2420 mg/L. Seepage of salt water from the surrounding region is likely another source that increase TDS in the El-Salam Canal. Seasonal variation in water quantity as well as the fluctuation in mixing ratios of Nile River water with ADW may also have an adverse impact on the level of TDS in the water of the canal. These notions are indeed in agreement with those reported by El Gammal [37]. Moreover, Hafez et al. [38] detected high TDS fluctuation and variation in the canal after mixing with the Bahr Hadous drain (34–85%) and the El-Serw drain (31–57%). El-Sheekh et al. [39] found that electrical conductivity (EC), TDS, salinity, and chloride were maximized at levels of 5616 μs/cm, 10,636 mg/L, 10.9%, and 5.1 g/L, respectively, at the Bahr Hadous drain, and decreased to minimum values of 1933 μs/cm for EC, 2104 mg/L for TDS, 2.6% for salinity, and 1.2 g/L for chlorides at the intake point (i.e., the Nile River). The authors claimed that variations in TDS might have been due to the effect of the ADW being rich in salts at the Bahr Hadous drain.
The simulated DO values varied from 4.5 mg/L to 9.9 mg/L during the period from September 2013 to August 2014 (Figure 3b). The DO concentration along the El-Salam Canal complied with the Egyptian standards (DO > 5 mg/L) for direct reuse in irrigation except at the El-Serw drain (S. No. 3) in August. Nevertheless, a significant decrease in the DO levels was observed at the El-Serw (S. No. 3) and Bahr Hadous drains (S. No. 4), as shown in Figure 3b. The DO concentration amounted to 4.5 mg/L in the El-Salam Canal at the connection with the El-Serw drain and 5.1 mg/L at the connection with the Bahr Hadous drain in August. This result is consistent with the results of Hafez et al. [38], who indicated that the DO levels of Nile River water decreased sharply after the mixing point with the El-Serw and Bahr Hadous drains. One of the plausible reasons for low DO is due to the discharge of domestic wastewater into these drainage canals causing a depletion of oxygen. Indeed, El Gammal [37] reported that the El-Serw and Bahr Hadous drains receives a significant amount of untreated wastewater that causes severe pollution of the ADW, which subsequently adversely affects the WQ of the El-Salam Canal. Othman et al. [40] also found that the DO concentration decreased at the connection sites of the drains with the canal. Furthermore, El-Sheekh et al. [39] found that the maximum annual mean concentration of DO was 6.0 mg/L at the Nile River site, whereas DO was 2.2 mg/L at the Bahr Hadous drain site connection with the canal. However, the relatively higher DO at the Bahr Hadous in this study (5.1 mg/L in 2014) compared to reported value by El-Sheekh et al. [39] (2.2 mg/L in 2010) is most likely associated with construction of wastewater treatment plants along the drainage systems, which mitigate the effect from pollution source.
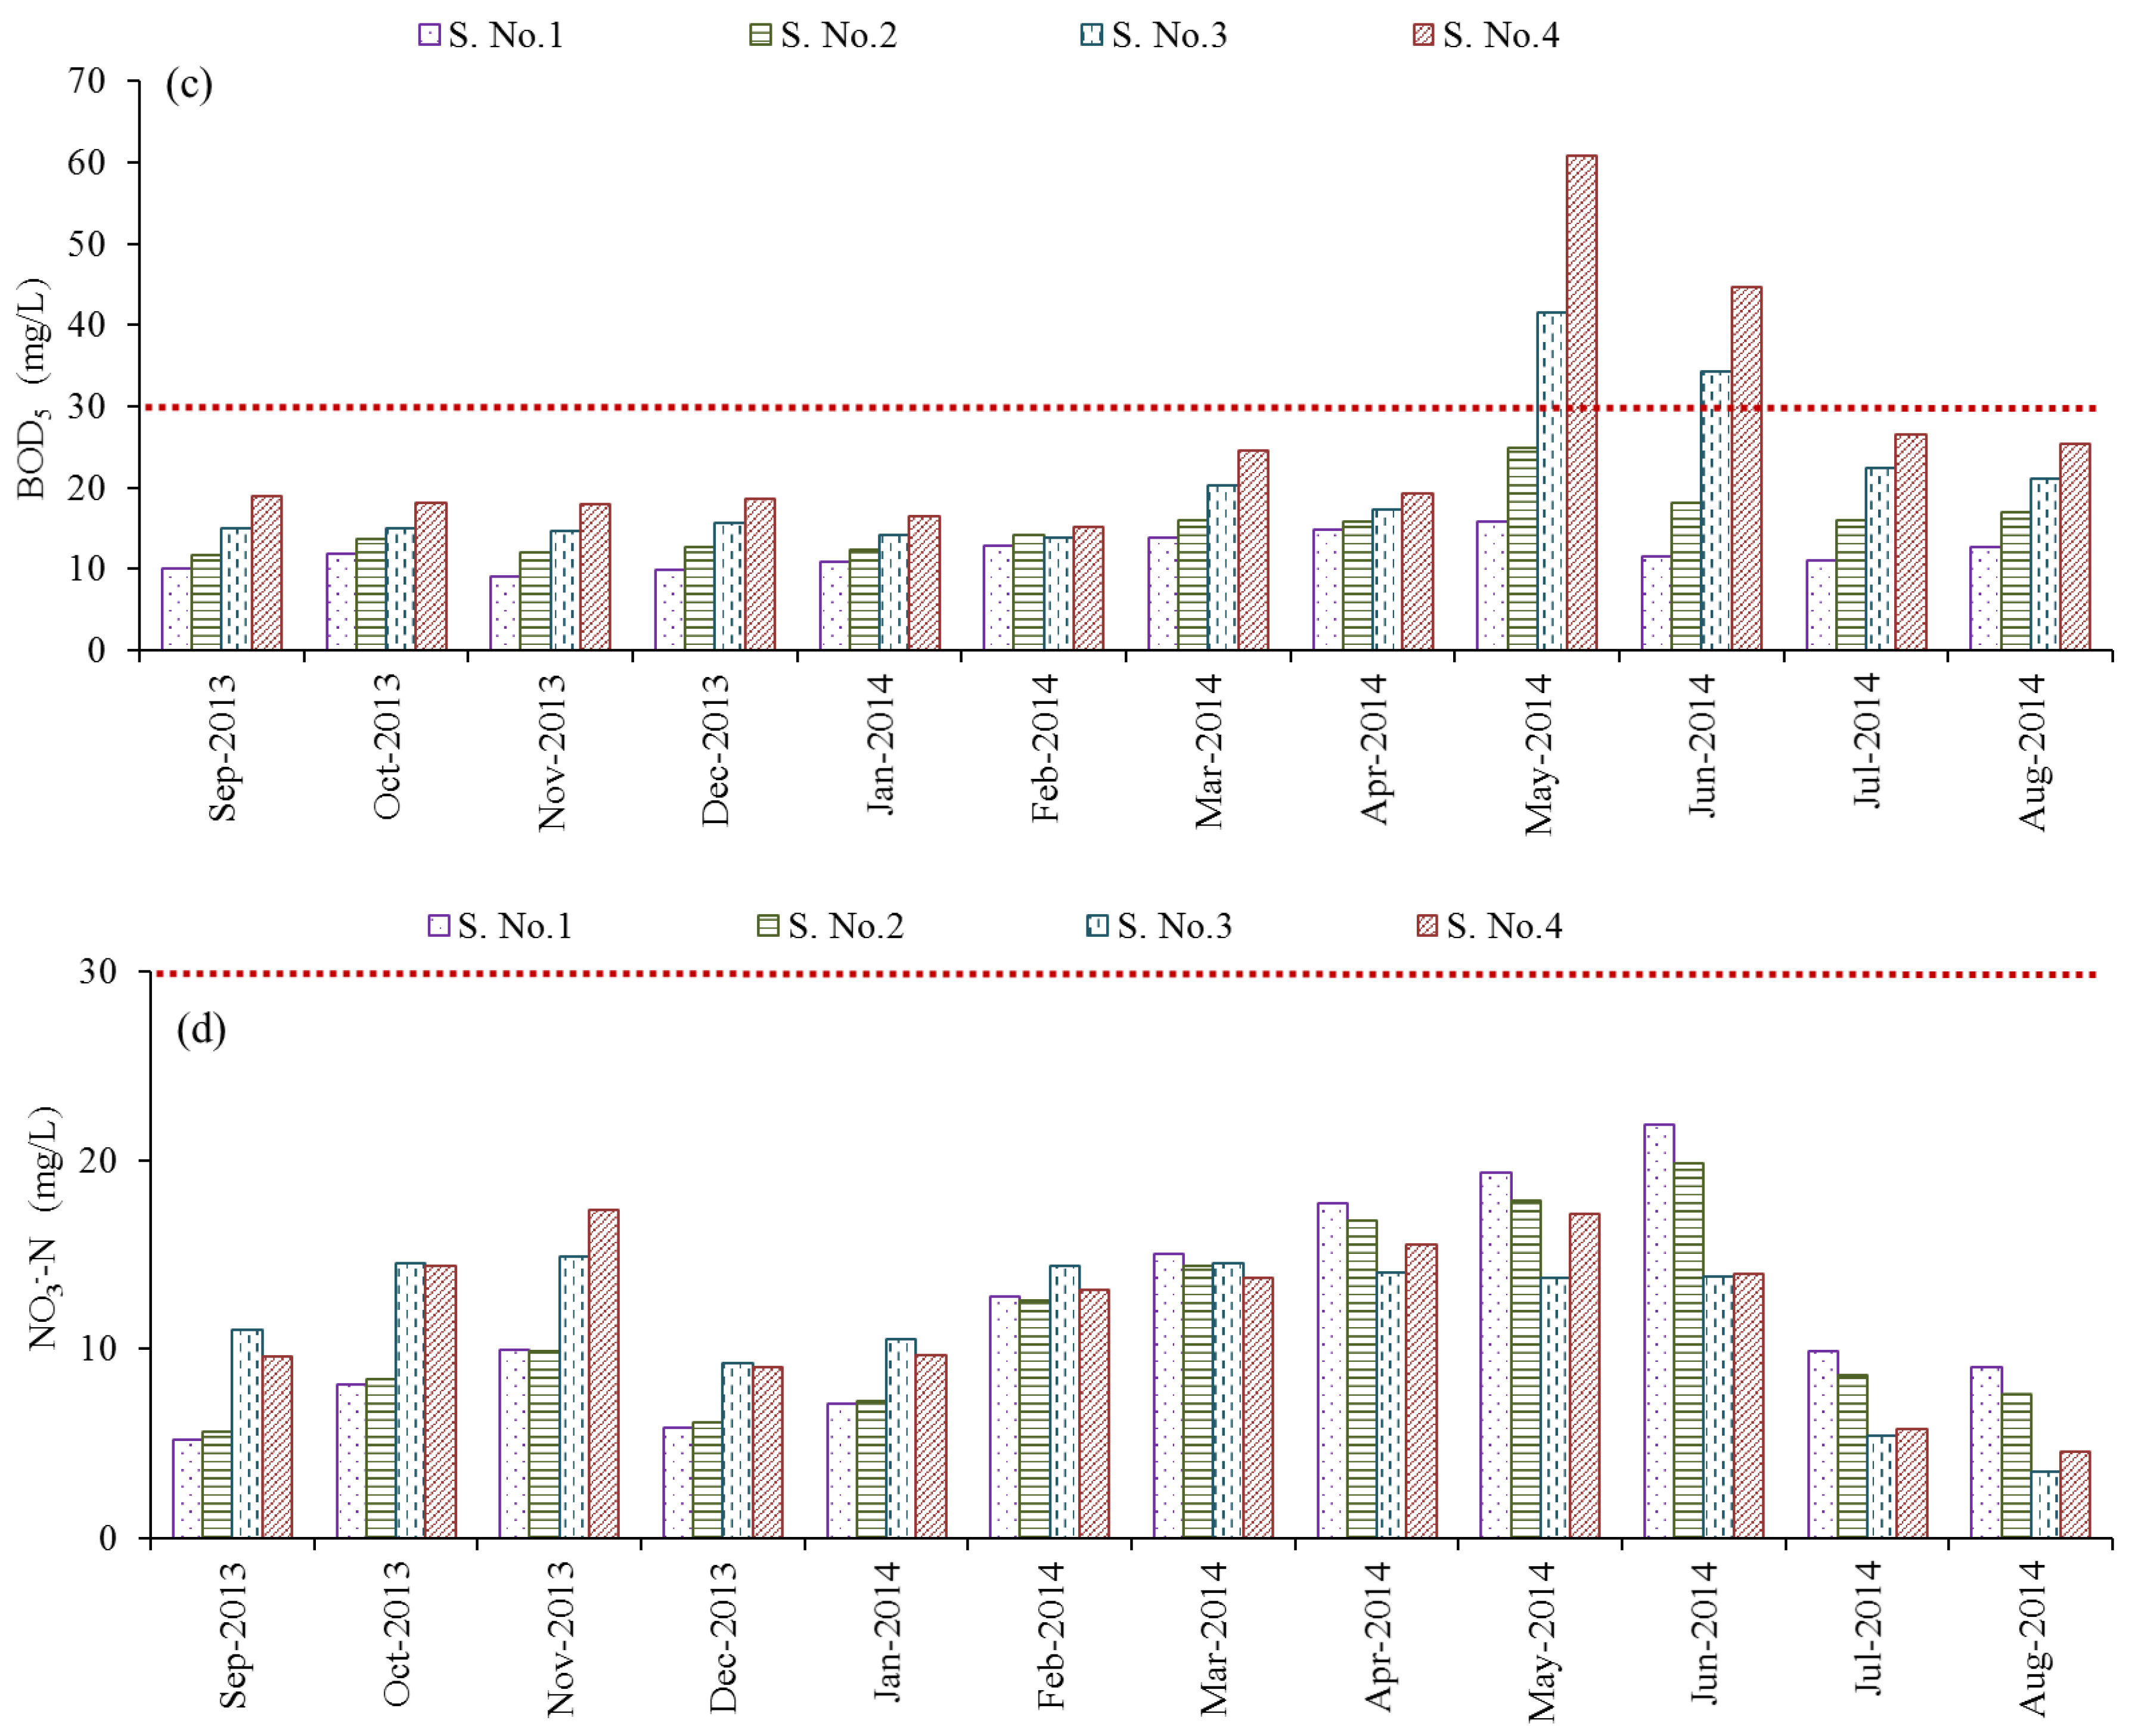
As shown in Figure 3c, the simulated data for BOD5 gradually increased from the intake point to the connection sites with the drainage canals. For example, the simulated BOD5 along the El-Salam Canal exceeded the limit of 30 mg/L for direct reuse of the water in irrigation in May and June 2014; the BOD5 values further increased downstream at the El-Serw and Bahr Hadous drains. The BOD5 values were 42 mg/L in May and 34 mg/L in June after mixing with El-Serw drain water (S. No. 3). Moreover, the highest value of BOD5 was 61 mg/L in May and 45 mg/L in June after mixing with Bahr Hadous drain water (S. No. 4). BOD5 of the El-Serw drain (21–51 mg/L) and Bahr Hadous drain (30–136 mg/L) were generally higher than that for the main channel of the Nile River (6–34 mg/L). Hafez et al. [38] noticed that the BOD5 levels in the canal were high due to the supply of ADW to the canal with the BOD5 values being recorded as 75 mg/L in June 2004 and 33 mg/L in November 2004 after mixing with El-Serw drain water. The highest value of BOD5 was 112 mg/L in June 2004 (Bahr Hadous drain), and the lowest value was 43 mg/L in December 2004 after mixing with El-Serw drain water. Therefore, the BOD5 values of the canal can be affected by the quantity and quality of discharges, as well as seasonal and spatial effects.
In contrast to BOD5, the results for NO3-N indicated relatively lower values, which varied from 3.6 to 22 mg/L and complied with the WQ standards for reuse as shown in Figure 3d. The highest values were observed from April to June 2014 and were most likely due to elevation of the temperature up to 33 °C, which positively affected the nitrification process. These results demonstrate that the canal environment deteriorated after mixing with water from the El-Serw and Bahr Hadous drains. Othman et al. [40] reported that the NO3-N values in the El-Salam Canal ranged from 0.01–5.47 mg/L and from 0.07–1.49 mg/L, respectively.
All statistical analyses were performed by Minitab software with a significance level of p < 0.05. The Durbin–Watson test was used to test the WQ data for serial autocorrelation. For the majority of parameters, autocorrelation was insignificant (i.e., D > Du). The results indicated that the WQ parameters were independent over time, but depended on the agriculture seasons. As a consequence of the minimum degree of serial autocorrelation, its effects were neglected in the following statistical analyses.
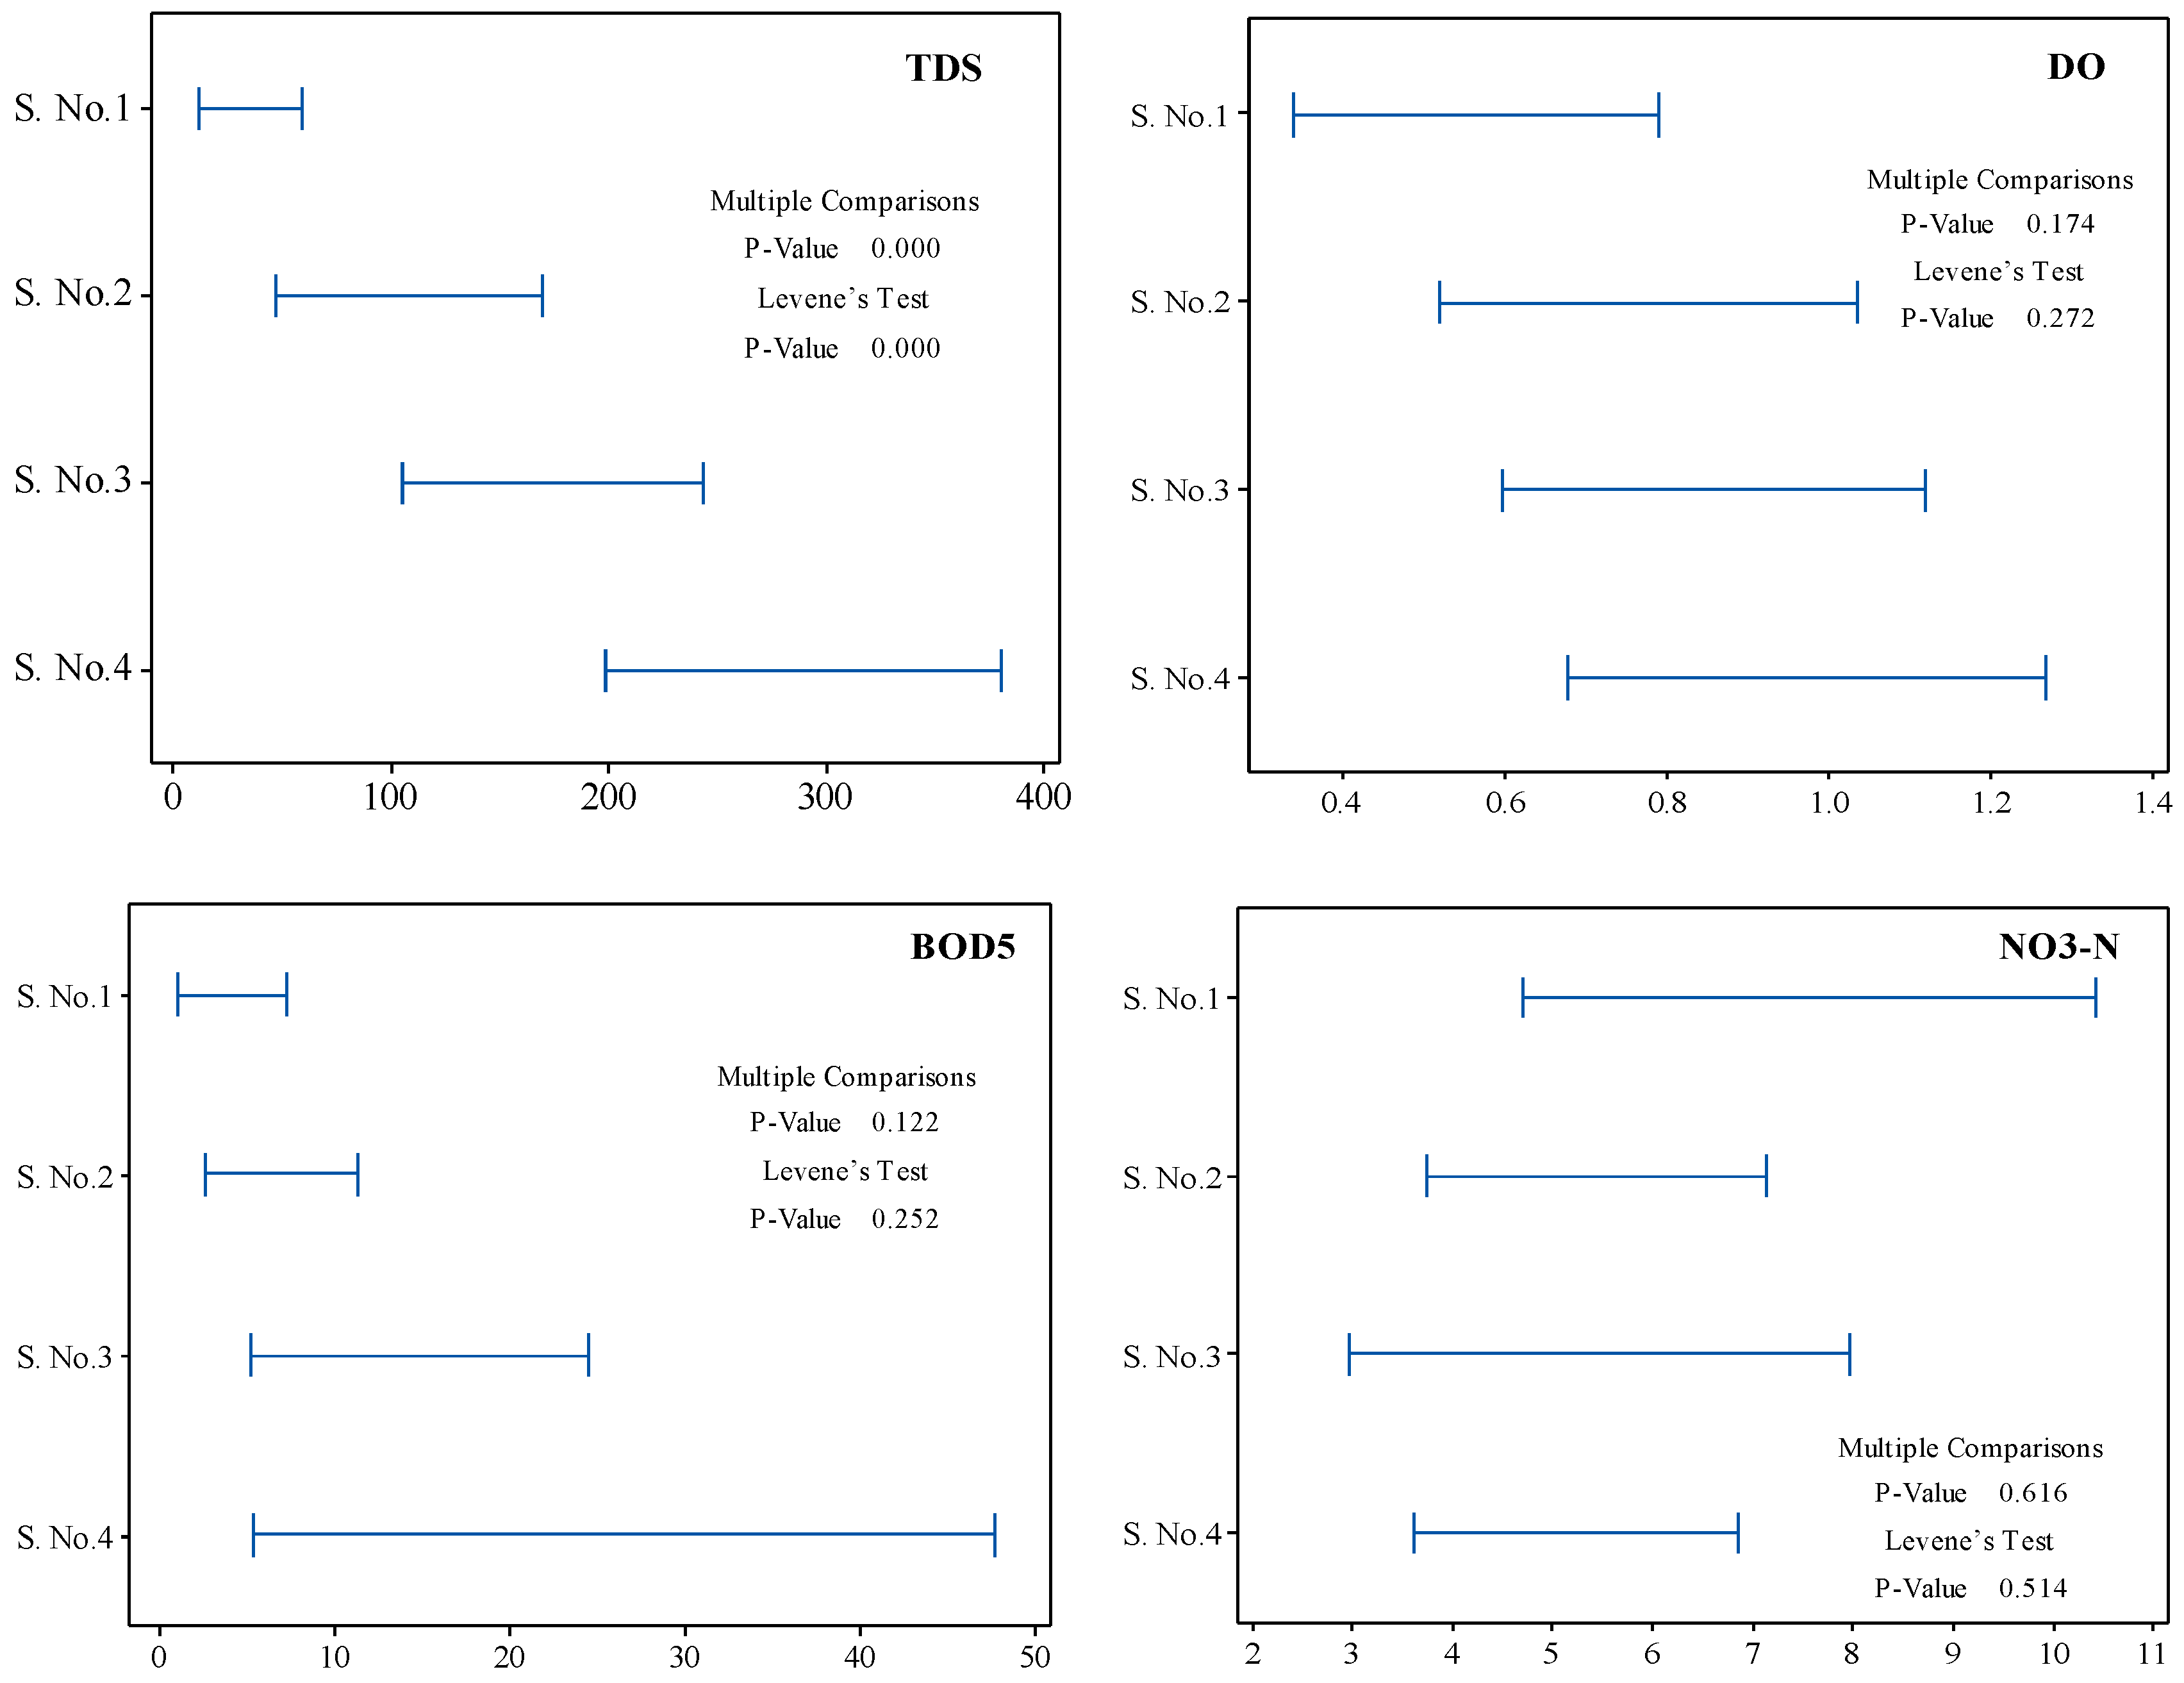
The WQ data was divided into two groups (winter and summer seasons) according to the irrigation periods, for assessing the seasonal differences of variability for the four stations. Table 6 displays the results of the homogeneity of variance test, which clearly demonstrated that the ratio of standard deviations or variances is not statistically significant (p > 0.05), except for BOD5 at S. Nos. 2–4 (p < 0.05). These results were confirmed with the simulated outputs in Figure 3, which illustrated the simulated BOD5 along the El-Salam Canal exceeded the limit of 30 mg/L for direct reuse of the water in irrigation, with a significant difference especially in May and June 2014.
However, the TDS parameter was the only one that had a significant difference of variances from one station to another (p < 0.05), as shown in Figure 4. The result indicated that the TDS values was the most effective parameter for the water quality along the canal, confirming the officials’ concern that the El-Salam Canal be constructed where agricultural drain water can be diluted with fresh water to maintain a TDS less than 1200 mg/L. Moreover, an ANOVA test was applied to illustrate the differences among the four stations for each parameter. Table 7 shows the results of the ANOVA test that clearly illustrated the significant differences (p < 0.05) for all parameters in the four stations except for nitrate levels (p > 0.05). The results indicated that most parameters varied in their spatial variation along the canal after the connection with the drains.
3.2. Water Quality Indices Performance
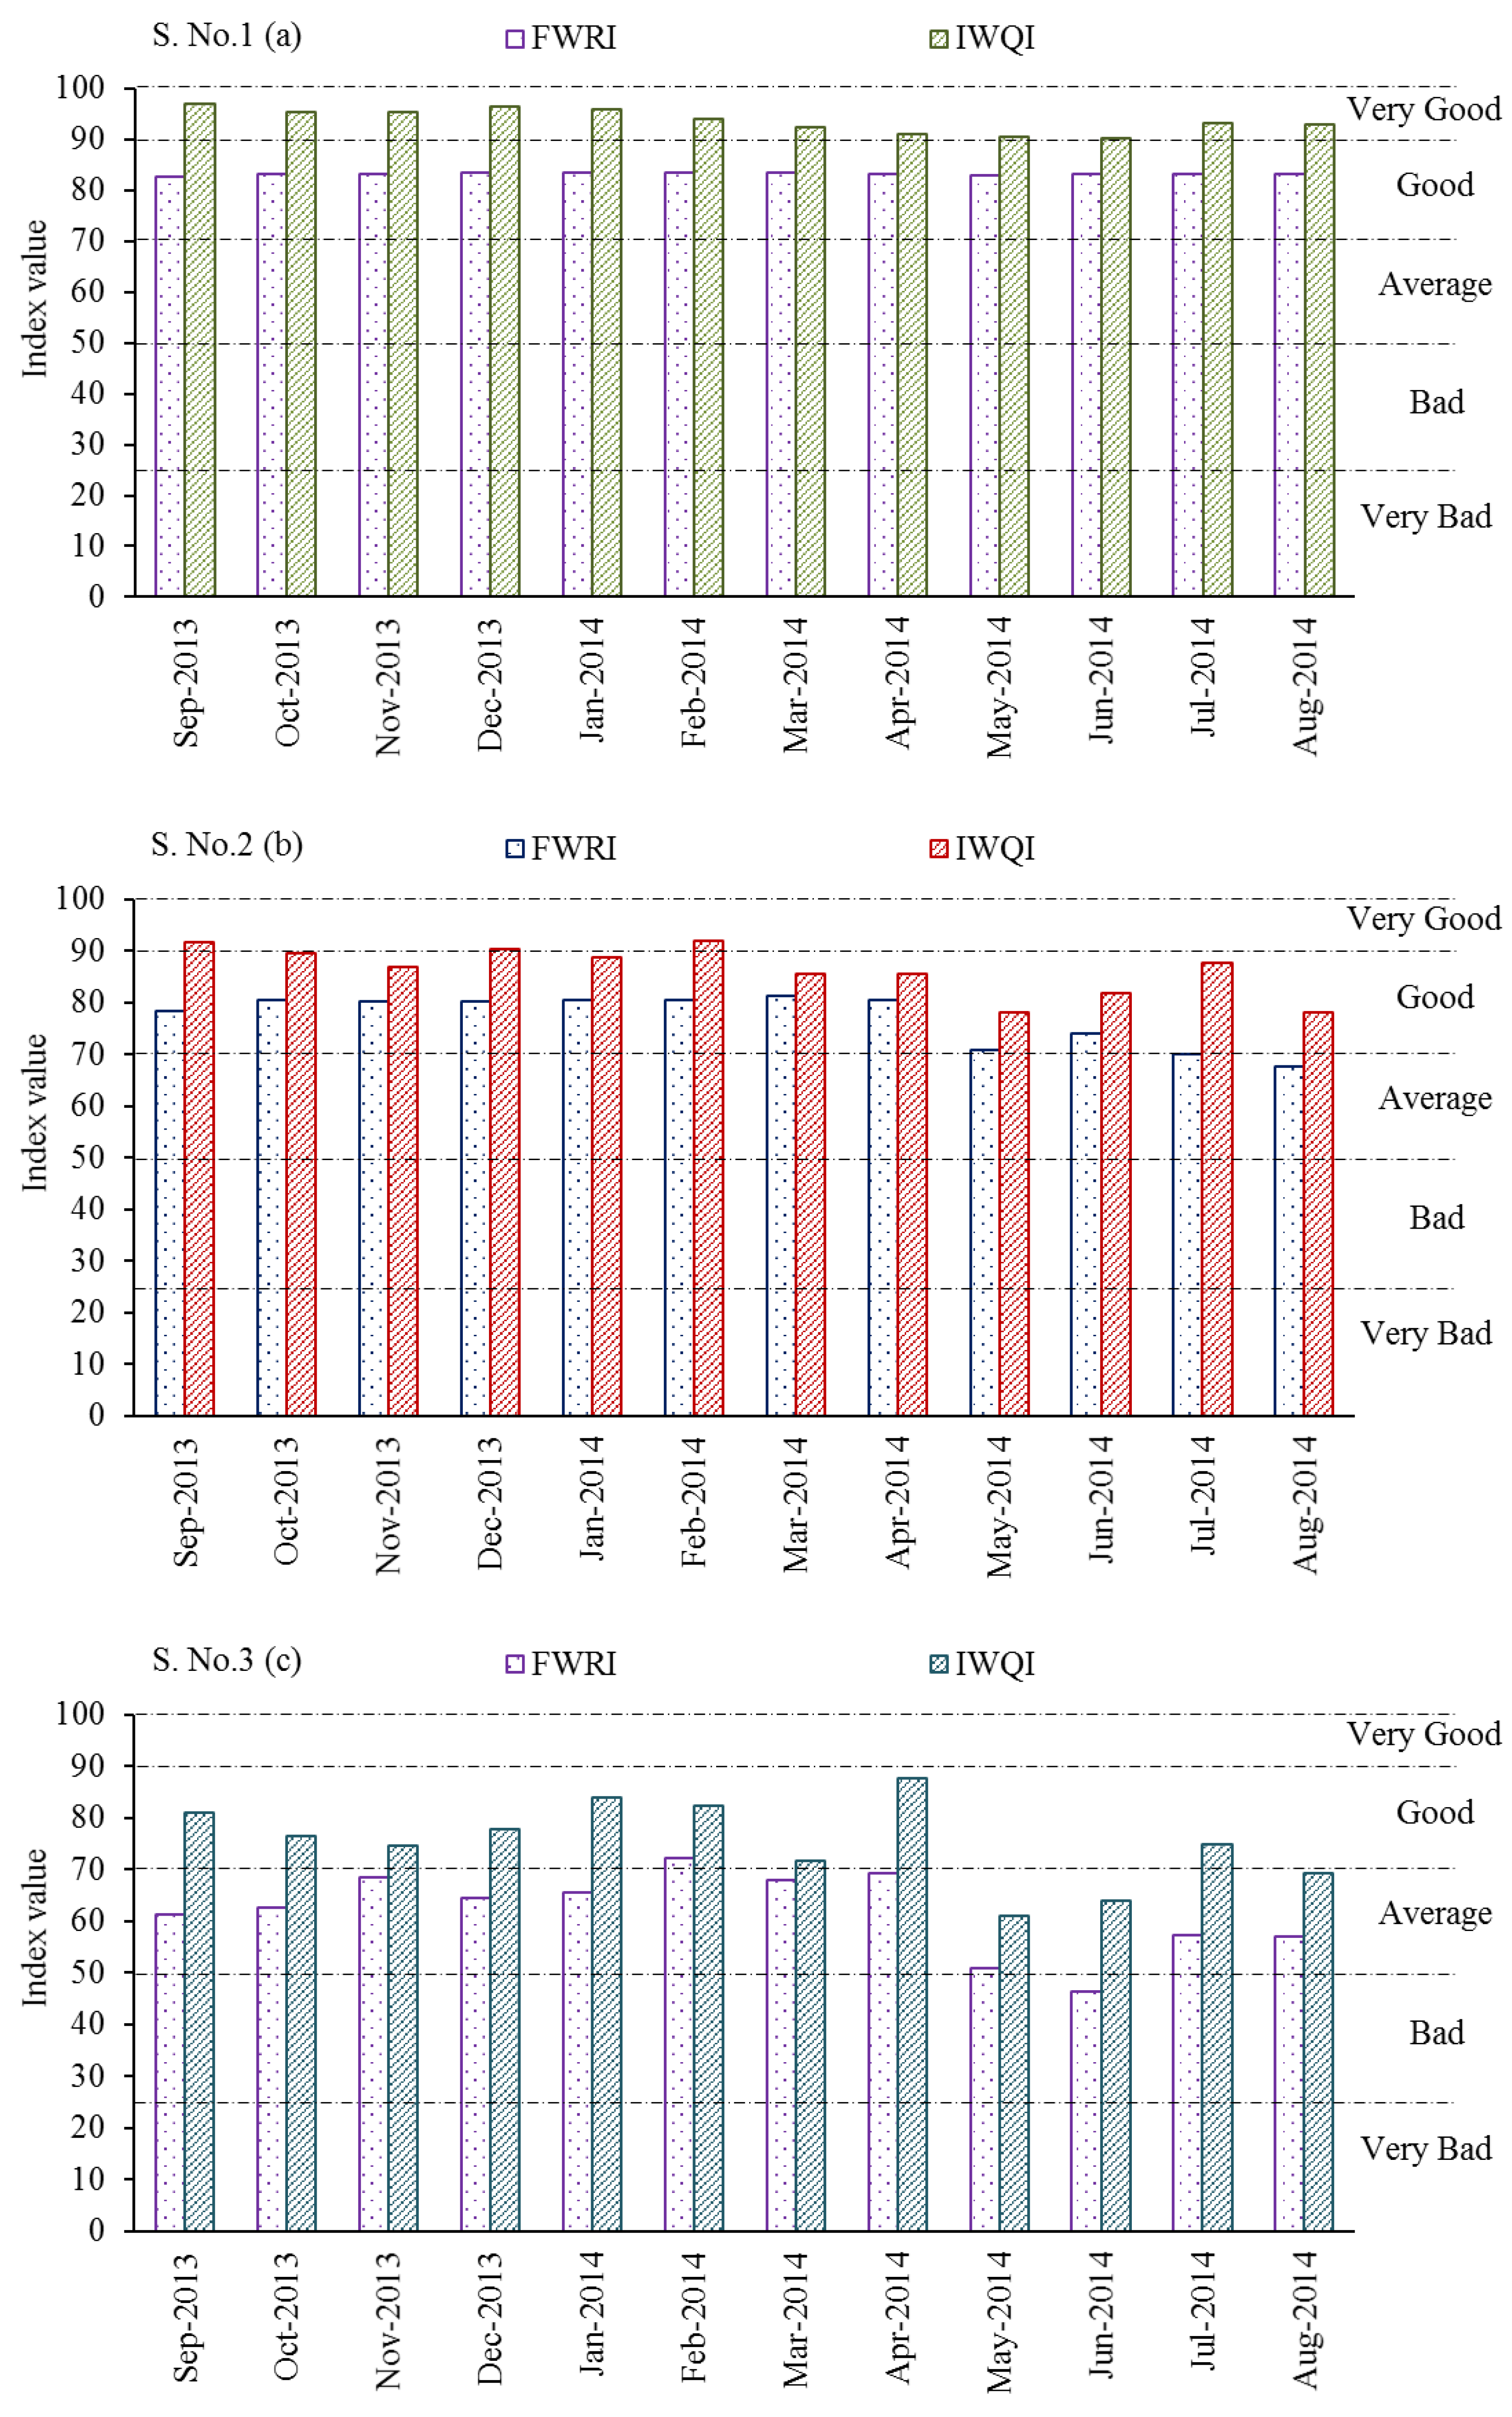
The WQ indices (FWRI and IWQI) were applied along the El-Salam Canal at the selected four stations over the period from September 2013 to August 2014. Figure 5a–d shows a comparison of the FWRI with the IWQI at the four stations during the period from September 2013 to August 2014. As shown for S. No. 1 (Figure 5a), the FWRI and IWQI values had similar trends and the WQ was likely acceptable for irrigation purposes, although the output classes were different. The FWRI values varied from 83.4 to 82.8, indicating that the WQ is in the ‘G’ category. In contrast, the WQ was classified into the ‘VG’ category for the IWQI values, which varied from 96.55 to 90.17.
Moreover, after the connection with the Faraskor drain (S. No. 2), the WQ reduced slightly and ranged between the ‘G’ to ‘A’ categories for the FWRI and the ‘VG’ to ‘G’ categories for the IWQI (Figure 5b). The FWRI values varied from 81.2 to 67.7 and the IWQI values varied from 91.87 to 78.0. The WQ complied with standards for its safe reuse in agriculture. The results also showed that the annual discharge of drainage water from the Faraskor (8 m3/s) had little adverse effect on the WQ of the El-Salam Canal. However, the FWRI and IWQI values after the connection with the El-Serw drain (S. No. 3) dropped significantly, probably due to the discharge of 31.1 m3/s from the El-Serw drain as shown in Figure 5c. The FWRI values ranged from ‘A’ to ‘B’ and varied from 72.1 to 46.3. The IWQI values decreased slightly; however, they ranged between ‘G’ and ‘A’ and varied from 87.7 to 61.1.
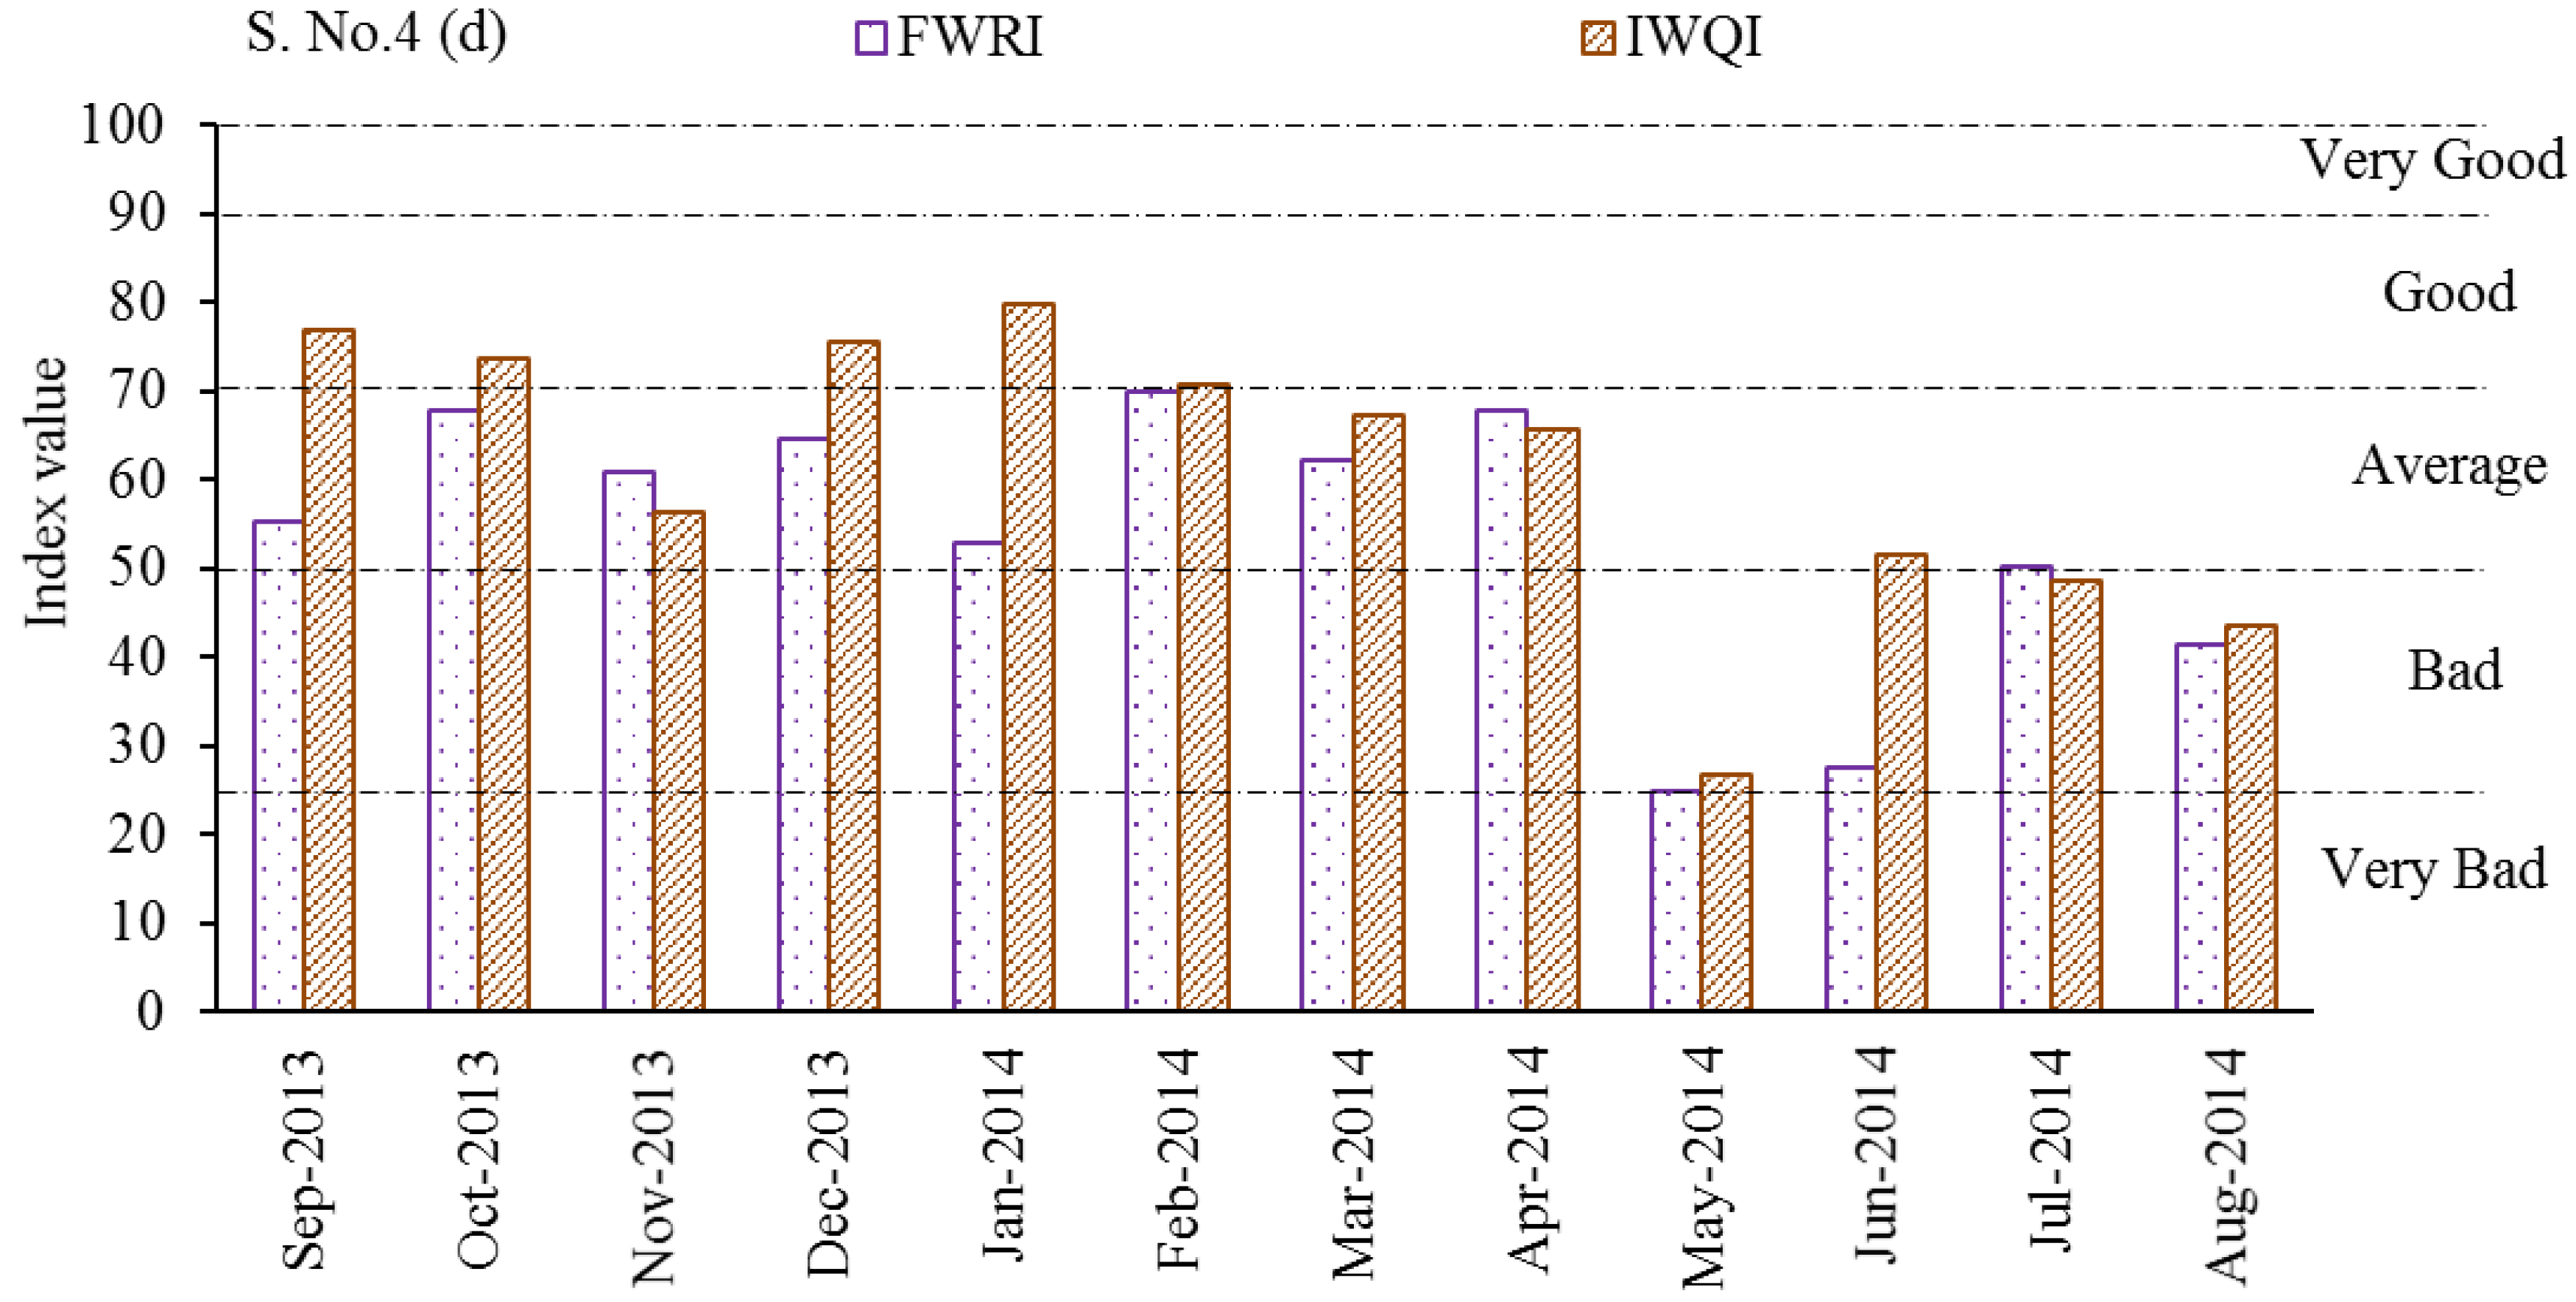
The results in Figure 5d show the FWRI versus the IWQI values after mixing with the Bahr Hadous drain (39 m3/s) (S. No. 4); the WQ deteriorated and resulted in a ‘VB’ classification. The FWRI values varied from 70.0 to 24.8 and were classified as ranging between ‘A’ and ‘VB’. In contrast, the IWQI values ranged from ‘G’ to ‘B’ and varied from 79.7 to 26.7. Collectively, as illustrated in Figure 5, the outputs of the FWRI were sensitive to variations in the WQ parameters compared with the IWQI.
Furthermore, the Z-test of the means was applied to detect whether the differences between the mean FWRI and IWQI outputs for the four stations were significant. Table 8 displays the statistical properties of the FWRI and IWQI values for the four stations, where the calculated Z (Zcal) values were associated with the means and between Z-critical values (±1.96 for a 5% significance level). The Zcal values showed that the mean values between the FWRI and IWQI were significantly different in the three stations with the exception of S. No. 4 (Zcal > 1.96). As a consequence, the aforementioned analyses consistently indicated that the FWRI and IWQI outputs have different statistical properties and the FWRI values do not preserve the basic statistical properties of the IWQI values.
In order to validate which of the two indices provide the best fit for the real situation of the WQ along the canal, a chi-square test (X2) was applied comparing the FWRI and IWQI with the official DRI WQ data, which is illustrated in Table 9. The X2 test investigates which index is best fitted to the observed WQ data. Table 10 shows the results of the X2 test between the FWRI and IWQI outputs with the official classification for the four stations, where all the X2 values are lower than the critical chi-square value (19.675) with DF = 11. Based on the results, the FWRI and IWQI values can both reasonably explain the current situation. However, the X2 values for the FWRI were always larger than the IWQI one, which indicated that the FWRI was more relevant to the official classification than the IWQI.
This could be attributed to the method of index calculation, e.g., how each parameter is compared with the standard value in the calculations [41]. Moreover, the inference rules used for the FWRI calculation not only deal with numerical data, but also apply the expert’s knowledge and experience [18]. Based on the findings in this study, the FWRI proved its capability and accuracy in the assessment of the ADW for reuse in irrigation compared with those obtained from a simulation model of the canal, and thus it can be applied as a comprehensive approach for the assessment of WQ reuse for irrigation purposes. These results confirm those of Ocampo-Duque et al. [24], Lermontov et al. [41] and Gharibi et al. [18], who studied the development of water quality indices based on fuzzy logic. They reported that this index seems to produce accurate and reliable outcomes, and can therefore be used as an alternative tool for effective water quality assessment.
4. Conclusions
This study used the IWQI and a WQ index based on a fuzzy logic approach (FWRI) to assess the ADW quality according to the results of a hydrodynamic and one-dimensional WQ simulation model. The indices were applied to classify the ADW quality along the largest project in Egypt (El-Salam Canal) from September 2013 to August 2014. The HD module of the El-Salam Canal using two years of data was calibrated from September 2012 to August 2013 and verified from September 2013 to August 2014. This was followed by calibration of the WQ module using data from September 2013 to August 2014. The results provide evidence of the reliability of the model in simulating the water quantity and WQ along the canal with the lowest RMSE values among the observed and simulated data. The results illustrated that the WQ deteriorated towards the downstream of the canal due to the polluted water discharged from the El-Serw and Bahr Hadous drains. An ANOVA test was applied to indicate the differences for each WQ parameter at the selected stations along the canal. The test results provided evidence that the WQ differed in their temporal variation along the canal after connection with the drains (p < 0.05). The comparisons between the WQ indices outputs (FWRI and IWQI) were performed at the selected four stations over the simulation period. The results demonstrated that the outputs were sensitive to variations in the WQ parameters. Additionally, the results of the Z-test illustrated that the FWRI values do not preserve the basic statistical properties of the IWQI values. For the validation of the indices, a chi-square test (X2) was applied comparing the FWRI and IWQI with the official DRI WQ data. The results indicated that the FWRI and IWQI values can both reasonably explain the current situation. However, the X2 values for FWRI were always larger than the IWQI values, which demonstrated that the FWRI was more relevant to the official classification than the IWQI. Accordingly, the FWRI proved its capability and accuracy in the assessment of ADW quality and pollution compared with those obtained from the simulation model of the canal, potentially enabling it to be applied as a comprehensive approach for the assessment of WQ for reuse in irrigation.
Author Contributions
W.A. analyzed the data and drafted the manuscript. W.M. and M.F. revised the statistical results. M.G.I., W.M., and M.F. contributed to editing and organizing the manuscript. All authors reviewed the article.
Funding
This study was financially supported by JSPS KAKENHI 17H04588 and 18F18061.
Acknowledgments
The first author would like to thank the Egyptian Ministry of Higher Education (MoHE) for providing her the financial support (Ph.D. Scholarship) for this research as well as the Egypt–Japan University of Science and Technology (E-JUST) for offering the facility and the tools needed to conduct this work.
Conflicts of Interest
The authors declare no conflict of interest.
Abbreviations
| A | Average |
| AD | Advection-dispersion module |
| ADW | Agricultural drainage water |
| B | Bad |
| BCM | Billion cubic metres |
| BOD5 | Biochemical oxygen demand |
| DHI | Danish Hydraulic Institute |
| DO | Dissolved oxygen |
| DRI | Drainage Research Institute |
| EC | Electrical conductivity |
| ECO-Lab | Water quality module |
| FAO | Food and Agriculture Organization |
| FIS | Fuzzy inference system |
| FWRI | Fuzzy logic water reuse index |
| G | Good |
| HD | Hydrodynamic module |
| IWQI | Irrigation water quality index |
| M | Manning’s roughness coefficient |
| MWRI | Ministry of Water Resources and Irrigation |
| NO3-N | Nitrates |
| NOF | Normalized objective function |
| RMSE | Root mean square error |
| S. | Stations |
| SAR | Sodium adsorption ratio |
| TDS | Total dissolved solids |
| VB | Very Bad |
| VG | Very Good |
| WQ | Water quality |
| WQI | Water quality index |
References
- Elshemy, M. Review of Technologies and Practices for Improving Agricultural Drainage Water Quality in Egypt. In Unconventional Water Resources and Agriculture in Egypt; Springer: Berlin/Heidelberg, Germany, 2017. [Google Scholar]
- Assar, W.; Allam, A.; Tawfik, A. Assessment and data assimilation of agricultural drainage water for reuse in irrigation purposes. In Proceedings of the 2018 Advances in Science and Engineering Technology International Conferences (ASET), Abu Dhabi, United Arab Emirates, 6 Febuary–5 April 2018; pp. 1–5. [Google Scholar]
- Hafez, A. Investigation of El-Salam Canal Project in Northern Sinai, Egypt. In Proceedings of the The 9th International Water Technology Conference, IWTC9, Northern Sinai, Egypt, 1 Janaury 2005; pp. 953–970. [Google Scholar]
- Allam, A.; Fleifle, A.; Tawfik, A.; Yoshimura, C.; El-Saadi, A. A simulation-based suitability index of the quality and quantity of agricultural drainage water for reuse in irrigation. Sci. Total Environ. 2015, 536, 79–90. [Google Scholar] [CrossRef] [PubMed]
- Ayers, R.S.; Westcot, D.W. Water Quality for Agriculture; Food and Agriculture Organization of the United Nations Rome: Roma, Italy, 1985; Volume 29. [Google Scholar]
- Bouwer, H.; Idelovitch, E. Quality requirements for irrigation with sewage water. J. Irrig. Drain. Eng. 1987, 113, 516–535. [Google Scholar] [CrossRef]
- Şener, Ş.; Şener, E.; Davraz, A. Evaluation of water quality using water quality index (WQI) method and GIS in Aksu River (SW-Turkey). Sci. Total Environ. 2017, 584, 131–144. [Google Scholar] [CrossRef]
- Zahedi, S. Modification of expected conflicts between drinking water quality index and irrigation water quality index in water quality ranking of shared extraction wells using multi criteria decision making techniques. Ecol. Indic. 2017, 83, 368–379. [Google Scholar] [CrossRef]
- Misaghi, F.; Delgosha, F.; Razzaghmanesh, M.; Myers, B. Introducing a water quality index for assessing water for irrigation purposes: A case study of the Ghezel Ozan River. Sci. Total Environ. 2017, 589, 107–116. [Google Scholar] [CrossRef]
- Horton, R. An index number system for rating water quality. J. Water Pollut. Control Fed. 1965, 37, 300–306. [Google Scholar]
- Brown, R.; McClelland, N.; Deininger, R.; Tozer, R. A water quality index—Do we dare. Water Sew. Work. 1970, 117, 339–343. [Google Scholar]
- [SAFE] Strategic Assessment of Florida’s Environment Florida Stream Water Quality Index, Statewide Summary 1995, Statewide Summary, 1995. Available online: http://www.pepps.fsu.edu/safe/environ/swq1.html (accessed on October 2005).
- Khan, F.; Husain, T.; Lumb, A. Water quality evaluation and trend analysis in selected watersheds of the Atlantic region of Canada. Environ. Monit. Assess. 2003, 88, 221–248. [Google Scholar] [CrossRef] [PubMed]
- Cude, C.G. Oregon Water Quality Index a Tool for Evaluating Water Quality Management Effectiveness 1. JAWRA J. Am. Water Resour. Assoc. 2001, 37, 125–137. [Google Scholar] [CrossRef]
- Debels, P.; Figueroa, R.; Urrutia, R.; Barra, R.; Niell, X. Evaluation of water quality in the Chillán River (Central Chile) using physicochemical parameters and a modified water quality index. Environ. Monit. Assess. 2005, 110, 301–322. [Google Scholar] [CrossRef]
- Kannel, P.R.; Lee, S.; Lee, Y.-S.; Kanel, S.R.; Khan, S.P. Application of water quality indices and dissolved oxygen as indicators for river water classification and urban impact assessment. Environ. Monit. Assess. 2007, 132, 93–110. [Google Scholar] [CrossRef] [PubMed]
- Bai, V.; Bouwmeester, R.; Mohan, S. Fuzzy Logic Water Quality Index and Importance of Water Quality Parameters. Air Soil Water Res. 2009. [Google Scholar] [CrossRef]
- Gharibi, H.; Mahvi, A.H.; Nabizadeh, R.; Arabalibeik, H.; Yunesian, M.; Sowlat, M.H. A novel approach in water quality assessment based on fuzzy logic. J. Environ. Manag. 2012, 112, 87–95. [Google Scholar] [CrossRef]
- Yardimci, A.; Muhammetoglu, A.; Oguz, H. A fuzzy logic application to environment management system: A case study for Goksu streams water quality assesment. In Computational Intelligence, Theory and Applications; Springer: Berlin/Heidelberg, Germany, 2005; pp. 327–338. [Google Scholar]
- Chang, N.-B.; Chen, H.-W.; Ning, S.-K. Identification of river water quality using the fuzzy synthetic evaluation approach. J. Environ. Manag. 2001, 63, 293–305. [Google Scholar] [CrossRef]
- Chau, K. A review on integration of artificial intelligence into water quality modelling. Mar. Pollut. Bull. 2006, 52, 726–733. [Google Scholar] [CrossRef] [Green Version]
- Zadeh, L.A. Fuzzy sets. Inf. Control 1965, 8, 338–353. [Google Scholar] [CrossRef] [Green Version]
- Brauer, N.; O’Geen, A.T.; Dahlgren, R.A. Temporal variability in water quality of agricultural tailwaters: Implications for water quality monitoring. Agric. Water Manag. 2009, 96, 1001–1009. [Google Scholar] [CrossRef]
- Ocampo-Duque, W.; Ferre-Huguet, N.; Domingo, J.L.; Schuhmacher, M. Assessing water quality in rivers with fuzzy inference systems: A case study. Environ. Int. 2006, 32, 733–742. [Google Scholar] [CrossRef]
- Vadiati, M.; Asghari-Moghaddam, A.; Nakhaei, M.; Adamowski, J.; Akbarzadeh, A.H. A fuzzy-logic based decision-making approach for identification of groundwater quality based on groundwater quality indices. J. Environ. Manag. 2016, 184, 255–270. [Google Scholar] [CrossRef]
- Liou, S.-M.; Lo, S.-L.; Hu, C.-Y. Application of two-stage fuzzy set theory to river quality evaluation in Taiwan. Water Res. 2003, 37, 1406–1416. [Google Scholar] [CrossRef]
- Noutsopoulos, C.; Kyprianou, I. A simple water quality model as a tool for the evaluation of alternative river basin management plans. Global Nest J. 2014, 16, 1–8. [Google Scholar]
- Doulgeris, C.; Georgiou, P.; Papadimos, D.; Papamichail, D. Ecosystem approach to water resources management using the MIKE 11 modeling system in the Strymonas River and Lake Kerkini. J. Environ. Manag. 2012, 94, 132–143. [Google Scholar] [CrossRef]
- Liang, J.; Yang, Q.; Sun, T.; Martin, J.D.; Sun, H.; Li, L. MIKE 11 model-based water quality model as a tool for the evaluation of water quality management plans. J. Water Supply Res. Technol. 2015, 64, 708–718. [Google Scholar] [CrossRef]
- National Water Research Center (NWRC). Drainage Water Status in the Nile Delta, Year Book 2005/2006; Technical Report No. 76; National Water Research Center (NWRC): Cairo, Egypt.
- DHI MIKE 11: A modeling system for rivers and channels. Reference manual 2012; Danish Hydraulic Institute: Hørsholm, Denmark, 2012.
- Girbaciu, A.; Girbaciu, C.; Rosu, S. Water Quality Modeling of Bega River Using Mike 11. Mater. Plast. 2016, 53, 533–536. [Google Scholar]
- McKone, T.E.; Deshpande, A.W. Can fuzzy logic bring complex environmental problems into focus? Environ. Sci. Technol. 2005, 39, 42A–47A. [Google Scholar] [CrossRef]
- Ross, T.J. Fuzzy Logic with Engineering Applications; John Wiley & Sons: Hoboken, NJ, USA, 2005; ISBN 0470860766. [Google Scholar]
- Meireles, A.C.M.; de Andrade, E.M.; Chaves, L.C.G.; Frischkorn, H.; Crisostomo, L.A. A new proposal of the classification of irrigation water. Rev. Ciência Agronômica 2010, 41, 349–357. [Google Scholar] [CrossRef] [Green Version]
- Abbasi, S.A. Water quality indices, state of the art report. Sci. Contrib. No. INCOH/SAR 2002, 25, 73. [Google Scholar]
- El Gammal, H.A.A. Water quality interventions case study: El-Salam Canal area. Adv. Environ. Biol. 2016, 10, 35–45. [Google Scholar]
- Hafez, A.; Khedr, M.; El-Katib, K.; Alla, H.G.; Elmanharawy, S. El-Salaam Canal project, Sinai II. Chemical water quality investigations. Desalination 2008, 227, 274–285. [Google Scholar] [CrossRef]
- El-Sheekh, M.M.; Deyab, M.A.I.; Desouki, S.S.; Eladl, M. Phytoplankton compositions as a response of water quality in El Salam canal, Hadous drain and Damietta branch of River Nile, Egypt. Pak. J. Bot. 2010, 42, 2621–2633. [Google Scholar]
- Othman, A.A.; Rabeh, S.A.; Fayez, M.; Monib, M.; Hegazi, N.A. El-Salam canal is a potential project reusing the Nile Delta drainage water for Sinai desert agriculture: Microbial and chemical water quality. J. Adv. Res. 2012, 3, 99–108. [Google Scholar] [CrossRef] [Green Version]
- Lermontov, A.; Yokoyama, L.; Lermontov, M.; Machado, M.A.S. River quality analysis using fuzzy water quality index: Ribeira do Iguape river watershed, Brazil. Ecol. Indic. 2009, 9, 1188–1197. [Google Scholar] [CrossRef]
Figure 1.
(a) The El-Salam Canal project; (b) schematic diagram; (c) longitudinal cross-section, of the El-Salam Canal connected with the Nile River and agricultural drains.
Figure 1.
(a) The El-Salam Canal project; (b) schematic diagram; (c) longitudinal cross-section, of the El-Salam Canal connected with the Nile River and agricultural drains.


Figure 2.
The fuzzy set membership functions of the input variables: (a) TDS; (b) DO; (c) BOD5 and (d) NO3-N.
Figure 2.
The fuzzy set membership functions of the input variables: (a) TDS; (b) DO; (c) BOD5 and (d) NO3-N.

Figure 3.
Simulated water quality parameters at four stations (S. No.1 to S. No.4) for the period from September 2013 to August 2014 in terms of: (a) TDS, (b) DO, (c) BOD5, (d) NO3-N.
Figure 3.
Simulated water quality parameters at four stations (S. No.1 to S. No.4) for the period from September 2013 to August 2014 in terms of: (a) TDS, (b) DO, (c) BOD5, (d) NO3-N.


Figure 4.
The variability of water quality parameters in terms of: TDS, DO, BOD5, and NO3-N at the four stations (S. No.1 to S. No.4) for the period from September 2013 to August 2014.
Figure 4.
The variability of water quality parameters in terms of: TDS, DO, BOD5, and NO3-N at the four stations (S. No.1 to S. No.4) for the period from September 2013 to August 2014.

Figure 5.
The FWRI versus IWQI at the selected stations over the period from September 2013 to August 2014, (a) S. No. 1, (b) S. No. 2, (c) S. No. 3, (d) S. No. 4.
Figure 5.
The FWRI versus IWQI at the selected stations over the period from September 2013 to August 2014, (a) S. No. 1, (b) S. No. 2, (c) S. No. 3, (d) S. No. 4.


Table 1.
The average discharges from September 2012 to August 2014 and WQ parameters from September 2013 to August 2014 for the locations along the El-Salam Canal.
Table 1.
The average discharges from September 2012 to August 2014 and WQ parameters from September 2013 to August 2014 for the locations along the El-Salam Canal.
| Location (km) | September 2012 to August 2013 | September 2013 to August 2014 | ||||
|---|---|---|---|---|---|---|
| Q (m3/s) | Q (m3/s) | TDS (mg/L) | DO (mg/L) | BOD5 (mg/L) | NO3-N (mg/L) | |
| Intake of the canal (0.0) | 27.6 | 12.8 | 323.3 | 9.2 | 12.1 | 11.8 |
| Faraskor drain (1.80) | 7.9 | 7.7 | 934.7 | 3.5 | 40.9 | 7.2 |
| El-Serw drain (17.85) | 30.5 | 31.0 | 1034.7 | 2.9 | 28.2 | 12.6 |
| pump station No.1 (22) | 65.1 | 74.1 | - | - | - | - |
| pump station No.2 (53) | 58.4 | 59.2 | - | - | - | - |
| Bahr Hadous drain (54) | 38.4 | 27.3 | 1443.7 | 2.7 | 36.9 | 12.5 |
| Suez Canal (88) | 53.3 | 27.9 | 919.1 | 3.9 | 19.7 | 14.0 |
| Egyptian standards for drainage water reuse in irrigation | <1200 | >5 | <30 | <30 | ||
Table 2.
Fuzzy sets and linguistic terms for the fuzzy-based index.
| Classification | TDS (mg/L) | DO (mg/L) | BOD5 (mg/L) | NO3-N (mg/L) | Classification | Fuzzy-Based Index | |
|---|---|---|---|---|---|---|---|
| Very low | a = b | 0 | 0 | 0 | 0 | Very Bad (VB) | 0 |
| c | 200 | 2 | 10 | 10 | 12.5 | ||
| d | 700 | 4 | 17.5 | 17.5 | 37.5 | ||
| Low | a | 400 | 2 | 10 | 10 | Bad (B) | 12.5 |
| b | 700 | 4 | 17.5 | 17.5 | 37.5 | ||
| c | 900 | 6 | 25 | 25 | 60 | ||
| Medium | a | 700 | 4 | 17.5 | 17.5 | Average (A) | 37.5 |
| b | 900 | 6 | 25 | 25 | 60 | ||
| c | 1100 | 8 | 32.5 | 32.5 | 80 | ||
| High | a | 900 | 6 | 25 | 25 | Good (G) | 60 |
| b | 1100 | 8 | 32.5 | 32.5 | 80 | ||
| c | 1400 | 10 | 40 | 40 | 100 | ||
| Very high | a | 1100 | 8 | 32.5 | 32.5 | Very Good (VG) | 80 |
| b | 1400 | 10 | 40 | 40 | 100 | ||
| c = d | 1600 | 12 | 50 | 50 | 100 | ||
| Range | 0–1600 | 0–12 | 0–50 | 0–50 | Range | 0–100 | |
Table 3.
Parameter limiting values utilized in the IWQI.
| qi | TDS (mg/L) | DO (mg/L) | BOD5 (mg/L) | NO3-N (mg/L) |
|---|---|---|---|---|
| 90–100 | TDS ≤ 500 | 9 ≤ DO | BOD5 ≤ 13.75 | NO3-N ≤ 13.75 |
| 70–90 | 500 ≤ TDS ≤ 800 | 7 ≤ DO ≤ 9 | 13.75 ≤ BOD5 ≤ 21.2 | 13.75 ≤ NO3-N ≤ 21.2 |
| 50–70 | 800 ≤ TDS ≤ 1000 | 5 ≤ DO ≤ 7 | 21.2 ≤ BOD5 ≤ 28.8 | 21.2 ≤ NO3-N ≤ 28.8 |
| 25–50 | 1000 ≤ TDS < 1200 | 3 ≤ DO ≤ 5 | 28.8 ≤ BOD5 < 30 | 28.8 ≤ NO3-N < 30 |
| 0–25 | 1200 ≤ TDS | DO < 3 | 30 ≤ BOD5 | 30 ≤ NO3-N |
Table 4.
The developed weight factor for each water quality parameter in the IWQI.
| Parameter | Rate (1–5) | Temporary Weight (0–1) | Final Weights |
|---|---|---|---|
| TDS (mg/L) | 2 | 1.0 | 0.353 |
| BOD5 (mg/L) | 3 | 0.7 | 0.235 |
| NO3-N (mg/L) | 3 | 0.7 | 0.235 |
| DO (mg/L) | 4 | 0.5 | 0.177 |
| Total (∑wi) | 2.8 | 1.00 |
Table 5.
The RMSE (mg/L) and NOF for water quality parameters of the El-Salam Canal.
| WQ Parameter | At 1.9 km | At 86 km | ||
|---|---|---|---|---|
| RMSE | NOF | RMSE | NOF | |
| Temperature | 0.02 | 0.001 | 0.09 | 0.004 |
| TDS | 79.8 | 0.16 | 31.7 | 0.03 |
| DO | 0.56 | 0.07 | 1.77 | 0.39 |
| BOD5 | 3.00 | 0.16 | 3.90 | 0.14 |
| NO3-N | 0.88 | 0.09 | 0.76 | 0.06 |
Table 6.
Seasonal variances of the WQ parameters for the four stations.
| Method | WQ Parameter | S. No.1 | S. No.2 | S. No.3 | S. No.4 |
|---|---|---|---|---|---|
| TDS | |||||
| Bonett’s Test | P-Value | 0.716 | 0.417 | 0.456 | 0.656 |
| Levene’s Test | P-Value | 0.624 | 0.391 | 0.752 | 0.240 |
| DO | |||||
| Bonett’s Test | P-Value | 0.884 | 0.229 | 0.369 | 0.337 |
| Levene’s Test | P- Value | 0.240 | 0.312 | 0.323 | 0.287 |
| BOD5 | |||||
| Bonett’s Test | P-Value | 0.579 | 0.019 | 0.009 | 0.020 |
| Levene’s Test | P-Value | 0.598 | 0.103 | 0.075 | 0.125 |
| NO3-N | |||||
| Bonett’s Test | P-Value | 0.194 | 0.243 | 0.373 | 0.425 |
| Levene’s Test | P-Value | 0.140 | 0.195 | 0.507 | 0.461 |
Table 7.
ANOVA results for the four stations.
| Source | DF | SS | MS | F-Value | P-Level |
|---|---|---|---|---|---|
| TDS | |||||
| Factor | 3 | 3,357,471 | 1,119,157 | 52.10 | <0.05 |
| Error | 44 | 945,155 | 21,481 | ||
| Total | 47 | 4,302,627 | |||
| DO | |||||
| Factor | 3 | 151.47 | 50.4899 | 110.27 | <0.05 |
| Error | 44 | 20.15 | 0.4579 | ||
| Total | 47 | 171.62 | |||
| BOD5 | |||||
| Factor | 3 | 2469 | 822.84 | 9.73 | <0.05 |
| Error | 44 | 3720 | 84.54 | ||
| Total | 47 | 6188 | |||
| NO3-N | |||||
| Factor | 3 | 15.77 | 5.257 | 0.22 | 0.885 |
| Error | 44 | 1071.18 | 24.345 | ||
| Total | 47 | 1086.95 |
Table 8.
Statistical properties of FWRI and IWQI values at the four stations.
| Stations | S. No.1 | S. No.2 | S. No.3 | S. No.4 | ||||
|---|---|---|---|---|---|---|---|---|
| Index | FWRI | IWQI | FWRI | IWQI | FWRI | IWQI | FWRI | IWQI |
| Count | 12 | 12 | 12 | 12 | 12 | 12 | 12 | 12 |
| Mean | 83.21 | 93.62 | 77.07 | 86.36 | 61.92 | 75.38 | 53.82 | 61.39 |
| Median | 83.25 | 93.65 | 80.1 | 87.36 | 63.45 | 75.69 | 58.2 | 66.58 |
| Minimum | 82.8 | 89.17 | 67.7 | 78 | 46.3 | 61.06 | 24.8 | 26.65 |
| Maximum | 83.4 | 96.99 | 81.2 | 91.87 | 72.1 | 87.65 | 70 | 79.7 |
| Range | 0.6 | 7.82 | 13.5 | 13.87 | 25.8 | 26.59 | 45.2 | 53.05 |
| Standard deviation | 0.19 | 2.51 | 4.96 | 4.78 | 7.79 | 7.97 | 15.34 | 16.17 |
| Coeff. of variation | 0.23 | 2.69 | 6.44 | 5.54 | 12.58 | 10.58 | 28.51 | 26.33 |
| Variance | 0.037 | 6.32 | 24.64 | 22.88 | 60.69 | 63.59 | 235.43 | 261.36 |
| Skewness | −0.78 | −0.38 | −1.01 | −0.71 | −0.78 | −0.37 | −0.98 | −0.9 |
| kurtosis | 0.03 | −0.91 | −0.78 | −0.45 | −0.08 | −0.44 | −0.14 | 0.2 |
| Correlation Coeff. | −0.037 | 0.711 | 0.787 | 0.765 | ||||
| |Zcal| < 1.96 | −14.3 | −4.67 | −4.18 | −1.18 | ||||
Table 9.
Comparison of the official current situation and the indices’ values at the four stations over the period from September 2013 to August 2014.
Table 9.
Comparison of the official current situation and the indices’ values at the four stations over the period from September 2013 to August 2014.
| Stations | Sep-2013 | Oct-2013 | Nov-2013 | Dec-2013 | Jan-2014 | Feb-2014 | Mar-2014 | Apr-2014 | May-2014 | Jun-2014 | Jul-2014 | Aug-2014 | |
|---|---|---|---|---|---|---|---|---|---|---|---|---|---|
| S. No.1 | Current situation | VG | VG | VG | VG | VG | VG | G | G | G | G | G | G |
| FWRI | G | G | G | G | G | G | G | G | G | G | G | G | |
| IWQI | VG | VG | VG | VG | VG | VG | VG | VG | VG | VG | VG | VG | |
| S. No.2 | Current situation | G | G | G | G | G | G | G | G | G | G | G | G |
| FWRI | G | G | G | G | G | G | G | G | G | G | G | A | |
| IWQI | VG | G | G | VG | G | VG | G | G | G | G | G | G | |
| S. No.3 | Current situation | A | A | A | A | A | A | B | A | B | B | A | A |
| FWRI | A | A | A | A | A | G | A | A | A | B | A | A | |
| IWQI | G | G | G | G | G | G | G | G | A | A | G | A | |
| S. No.4 | Current situation | A | A | A | A | A | A | B | B | VB | B | B | B |
| FWRI | A | A | A | A | A | G | A | A | VB | B | A | B | |
| IWQI | G | G | A | G | G | G | A | A | B | A | B | B | |
Table 10.
The X2-test comparing the FWRI and IWQI values with the official classification at the four stations over the period from September 2013 to August 2014.
Table 10.
The X2-test comparing the FWRI and IWQI values with the official classification at the four stations over the period from September 2013 to August 2014.
| Stations | S. No.1 | S. No.2 | S. No.3 | S. No.4 | ||||
|---|---|---|---|---|---|---|---|---|
| Index | FWRI | IWQI | FWRI | IWQI | FWRI | IWQI | FWRI | IWQI |
| X2 | 3.764 | 2.278 | 1.855 | 1.470 | 8.597 | 6.238 | 17.98 | 10.305 |
© 2019 by the authors. Licensee MDPI, Basel, Switzerland. This article is an open access article distributed under the terms and conditions of the Creative Commons Attribution (CC BY) license (http://creativecommons.org/licenses/by/4.0/).
Share and Cite
MDPI and ACS Style
Assar, W.; Ibrahim, M.G.; Mahmod, W.; Fujii, M. Assessing the Agricultural Drainage Water with Water Quality Indices in the El-Salam Canal Mega Project, Egypt. Water 2019, 11, 1013. https://doi.org/10.3390/w11051013
AMA Style
Assar W, Ibrahim MG, Mahmod W, Fujii M. Assessing the Agricultural Drainage Water with Water Quality Indices in the El-Salam Canal Mega Project, Egypt. Water. 2019; 11(5):1013. https://doi.org/10.3390/w11051013
Chicago/Turabian StyleAssar, Walaa, Mona G. Ibrahim, Wael Mahmod, and Manabu Fujii. 2019. "Assessing the Agricultural Drainage Water with Water Quality Indices in the El-Salam Canal Mega Project, Egypt" Water 11, no. 5: 1013. https://doi.org/10.3390/w11051013
Note that from the first issue of 2016, this journal uses article numbers instead of page numbers. See further details here.