The Effect of Flooding on Evaporation and the Groundwater Table for a Salt-Crusted Soil

State Key Laboratory of Desert and Oasis Ecology, Xinjiang Institute of Ecology and Geography, Chinese Academy of Sciences, Urumqi 830011, Xinjiang, China
*
Author to whom correspondence should be addressed.
Water 2019, 11(5), 1003; https://doi.org/10.3390/w11051003
Submission received: 11 April 2019
/
Revised: 5 May 2019
/
Accepted: 12 May 2019
/
Published: 13 May 2019
(This article belongs to the Special Issue Soil and Water Quality: Transport through Soil)
Abstract
:Soil salt crusts have been shown to have a strong influence on evaporation and water movement in soils, and this has attracted considerable attention. However, there is little information available on these processes during flooding. The objective of this study was to investigate the evaporation rate, variation in the groundwater table, and soil water content of salt-crusted soil flooded by five floodwater depths: 2 mm (Treatment A), 6 mm (Treatment B), 10 mm (Treatment C) 14 mm (Treatment D), and 18 mm (Treatment E). The experiments were carried out using repacked homogeneous silt loam soil columns in the laboratory. The experimental results showed that salt crust formation led to a low evaporation rate. The salt crust tended to form a dome, and some breakage occurred when the salt crust was dry. The broken crust increased the evaporation rate, indicating that the evaporation occurred below the crust. The soil moisture did not significantly change in the soil profile from 20 to 70 cm during the experimental period, which indicated that the existence of the evaporation front located in a layer very close to the surface. The evaporation rate rapidly increased when floodwater was added to the soils and returned to its previous low value after the salt crust reformed. However, before the salt crust reformed, there was a total water loss of 2.1, 4.3, 6.6, 10.1, and 13.8 mm for treatments A, B, C, D, and E, respectively, indicating that only a portion of the floodwater evaporated; another portion of the floodwater was discharged into the groundwater, causing the groundwater table to rise, although only by a small amount (6 mm). Therefore, the groundwater recharge caused by flooding should be considered. Otherwise, groundwater consumption may be overestimated.
1. Introduction
Salinity problems are caused by the presence of saline groundwater at shallow depths as a result of strong evaporation, and this scenario can ultimately lead to land degradation [1,2], especially in arid and semiarid regions [3]. Salt-crusted soils have a high salt concentration [4] and exhibit significant salinization [5]. Salt efflorescence, which is the formation of the salt crust on soils, is a well-known phenomenon in arid and semiarid regions where the annual evapotranspiration significantly exceeds the precipitation [6]. Salt crust formation influences dust emission [7,8], evaporation [3,9,10,11,12], water infiltration [13], and plant growth [14,15]; these effects have caused great concern in arid regions. Salt precipitation can completely cover the soil surface or form patches [16] on the soil surface due to soil heterogeneity [11,17], different particle sizes [16], and different temperatures [18]. Salt not only precipitates on the soil surface but also tends to precipitate as subflorescence [18]. Nachshon [5] reviewed the characteristics of salt precipitation in recent studies.
The proportion of the crust in the entire soil profile is quite small; despite this, crusts play an important role in ecosystems [19] because they affect the vertical and horizontal flux of nutrients, water, gases, and heat into and out of the soil [13,20,21,22]. The salt crust diminishes the evaporation rate significantly, as previously reported by many studies [3,10,23,24] employing different methodologies, including micro-lysimeter measurements [23,24], the Bowen ratio [25], eddy correlation [9,10,26], and a static chamber [27], with studies carried out in both the field and the lab using repacked soil columns [1,3,28]. The main reason for the above effects on transport is that salt crusts also impede water vapor transport into the atmosphere by blocking the gas flow, much like a cover of straw or gravel mulch [12,29]. The salt crust also tends to form a dome [30], which causes a disconnection between the salt crust and the soil matrix, further limiting the evaporation [29]. Although there is some dispute regarding certain points, such as whether evaporation occurs from the salt crust surface [31] or below the salt crust [17], many studies, including those mentioned above, do agree that evaporation is inhibited by salt crust formation.
There have been many studies on the effect of salt crusts on evaporation, but few of them have focused on the salt crust following flooding. Floods or rain occur even in hyper-arid areas [32]. In the event of floods or rain, the inflow partially dissolves the existing saline crust surface [33]. This may cause an increase in porosity due to dissolution [34]. The seasonal inflow of water or direct precipitation has been observed to reduce salt concentrations, which causes the crusts to dissolve and the exposure of open areas of brine [9]. Goodall et al. [35] found that when water collects in ephemeral ponds, it fully or partially dissolves any pre-existing crusts. However, the high evaporative demand causes the crusts to quickly reform [36]. Some studies [9,34,35] have found that a salt crust which is dissolved by freshwater (from precipitation or flooding) reforms due to evaporation.
Chen [23] reported that when a salt crust was flooded by distilled water, the evaporation rate increased nearly 20-fold for a short time and then returned to its previous low value due to salt crust reformation. Groeneveld et al. [27] also reported that the evaporation rate increased, causing the rapid removal of water, after the salt crust was dissolved by direct rainfall; however, it eventually returned to extremely low rates. It is still not clear whether all of the added water evaporates completely before the salt crust reforms because much more evaporation occurs when the salt crust dissolves. If only a portion of the floodwater evaporates before the salt crust reforms completely, then the groundwater is being recharged by the flood or rain, meaning that groundwater consumption may be overestimated in studies, particularly when using micrometeorology methods [10,37]. Chen [23] deduced that rainwater recharged the groundwater because just a portion of the rainwater evaporated before the salt crust reformed. However, the study of Chen [23] only involved two treatments due to limited experimental conditions, 12.7 and 22.3 g of distilled water were added to the surface of a cell with a diameter of 6.5 cm. In reality, the individual rainfall amount varied widely; therefore, it would not necessarily be the case that only a portion of rainwater evaporated before the salt crust reformed if more treatments were considered, in particular, a small amount of rainfall. In addition, the study by Chen [23] did not examine the variation in the groundwater table, it simply deduced the distilled water recharge of the groundwater based on the water balance. Groeneveld et al. [27] presented a concept model to reflect the variation in the evaporation rate following a flood, but they did not measure the groundwater variation. Therefore, there is still a limited amount of information on the groundwater table variation caused by salt crust dissolution and reformation due to flood effects. In addition, the soil water content is another great concern for salt-crusted soils [1,3,28]. Therefore, the objective of this study was to investigate the effect of five different depths of floodwater from 2 to 14 mm on the evaporation rate, soil water content, and variation in the groundwater table level for salt-crusted soils.
2. Materials and Method
2.1. Study Area
In this study, we used a silt loam collected from the floodplain of the Tarim River in China, which is an example of a floodplain in a hyper-arid region. The Tarim River is the largest inland river in China, which has an area of 1.22 million km2. The annual precipitation in this region varies within a range of 20–50 mm, whereas the annual potential evaporation is as high as 2500–3000 mm. Salt crusts are widely distributed in this area due to the evaporation of high-salt groundwater [38]. In the Tarim River floodplain, silt loam is the main soil texture, followed by sandy loam [39], and the main soil type is aeolian soil. The main vegetation is desert shrubs and semi-shrubs, and large herbaceous plants and arbors grow on the floodplains and low terraces along both sides of the river.
2.2. Experiment Design
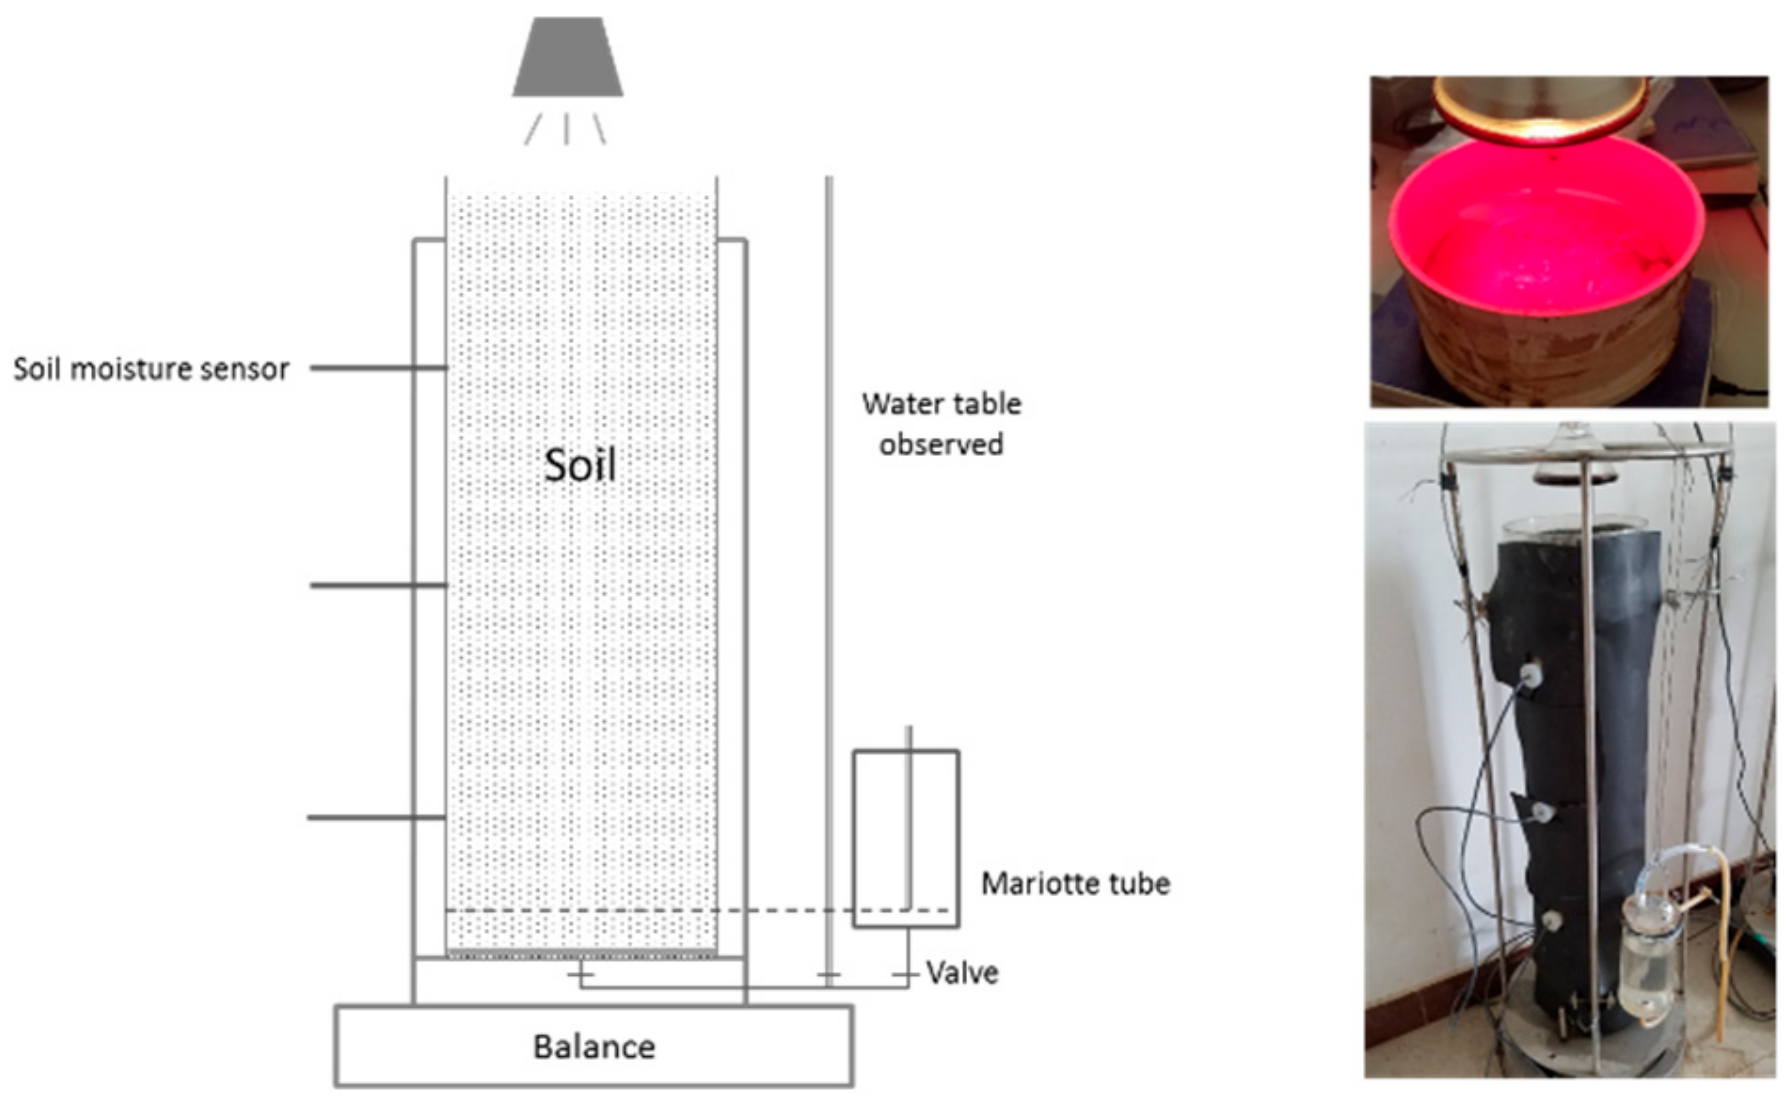
The disturbed soil was repacked in an acrylic column that was 1.0 m long with an internal diameter of 0.2 m (Figure 1). The collected soil sample was transported to the laboratory, dried, and sieved using a 2 mm sieve. We replicated the in situ soil density of 1.49 g cm−3 as homogeneously as possible. A porous plate (5 cm thick) was used at the bottom of the experimental setup. The acrylic column was wrapped in a thermal insulator (2 cm thick). The soil surface was uncovered to allow evaporation under nearly constant meteorological conditions. Evaporation was driven using an infrared lamp that was located 30 cm above the soil surface, and the lamp was controlled by an automatic switch every 15 min. The open water evaporation was measured with pans that were 20 cm in diameter and 10 cm deep, and the radiation was consistent among all soil columns (Figure 1). In this case, the open water evaporation rate was 14 mm day−1 (SE (standard error) of 0.38 mm day−1), which is similar to the evaporation rate in the summer at the Tarim River. The air temperature was controlled at about 25 °C using air conditioning.
The columns were connected at the bottom to a Mariotte tube to supply a constant water table level with a depth of 90 cm before flooding. An acrylic pipe (with a 2 mm inner diameter) was used to observe the groundwater table variation after flooding. Before the experiment, we introduced distilled water into the soil to saturate the soils, avoid trapping air, and allow evaporation from the surface. After saturating the soil, we then connected the Mariotte tube to maintain a constant level of the water table (90 cm). The saline water used for the experiment was a 10 g/L NaCl solution. Five treatments with three replications (for a total of 15 soil columns) were used for the experiment. As soon as evaporation started, the salt started to accumulate in the topsoil and caused the salt crust to form. When the salt crust had completely formed, floodwater depths of 2, 6, 10, 14, and 18 mm (freshwater) were poured from the top into the soil columns. After the salt crust reformed, the experiment was ended; the experiment lasted 52 days in total. All soil columns were subjected to the same conditions before the floodwater was added (freshwater). The column and Mariotte bottle weight were monitored every 10 min to measure any weight loss due to evaporation (Figure 1). The soil water content was monitored with time-domain reflectometry (TDR) sensors (Hydro probeⅡ, Stevens, US), and three sensors were equipped in each soil column at depths of 20, 45, and 70 cm. Data were recorded every 10 min using a data logger (CR100, Campbell Scientific, Logan, UT, USA).
2.3. Soil Properties
The sample sites (40.6764° N, 80.74489° E) were located in the upper reach of the Tarim River. The soil type in the sample sites was saline meadow soil, which was partially covered by shrub (Tamarix spp.). The soil was taken in Spring in 2017, the groundwater depth was 1.0 m at that time and the salt concentration was 9.86 g/L. We sampled the soil from 0–40 cm using a shovel and then placed the soil into plastic bags. In our research, only the homogeneous and disturbed soil (silt loam) was considered. The silt loam soil consisted of 41.5% sand and 53.6% silt. The saturated soil water content was 46%, the saturated hydraulic conductivity (Ks) was 61.68 cm·day−1, and the soil organic matter was 4.094 g kg−1. The particle size distribution was determined using a Malvern Mastersizer S laser diffractometer (Malvern Instrument, Malvern, UK) that measures the volume percentage of particles in 100 size classes from 0.02 to 2000 mm. The soil texture described in this paper denotes the percentage of clay (<2 μm), silt (2–50 μm), and sand (50–2000 μm) following the taxonomy of the U.S. Soil organic matter content was determined using the potassium dichromate method; the saturated hydraulic conductivities were measured in the laboratory under consistent hydraulic gradients [40].
3. Results
3.1. Evaporation
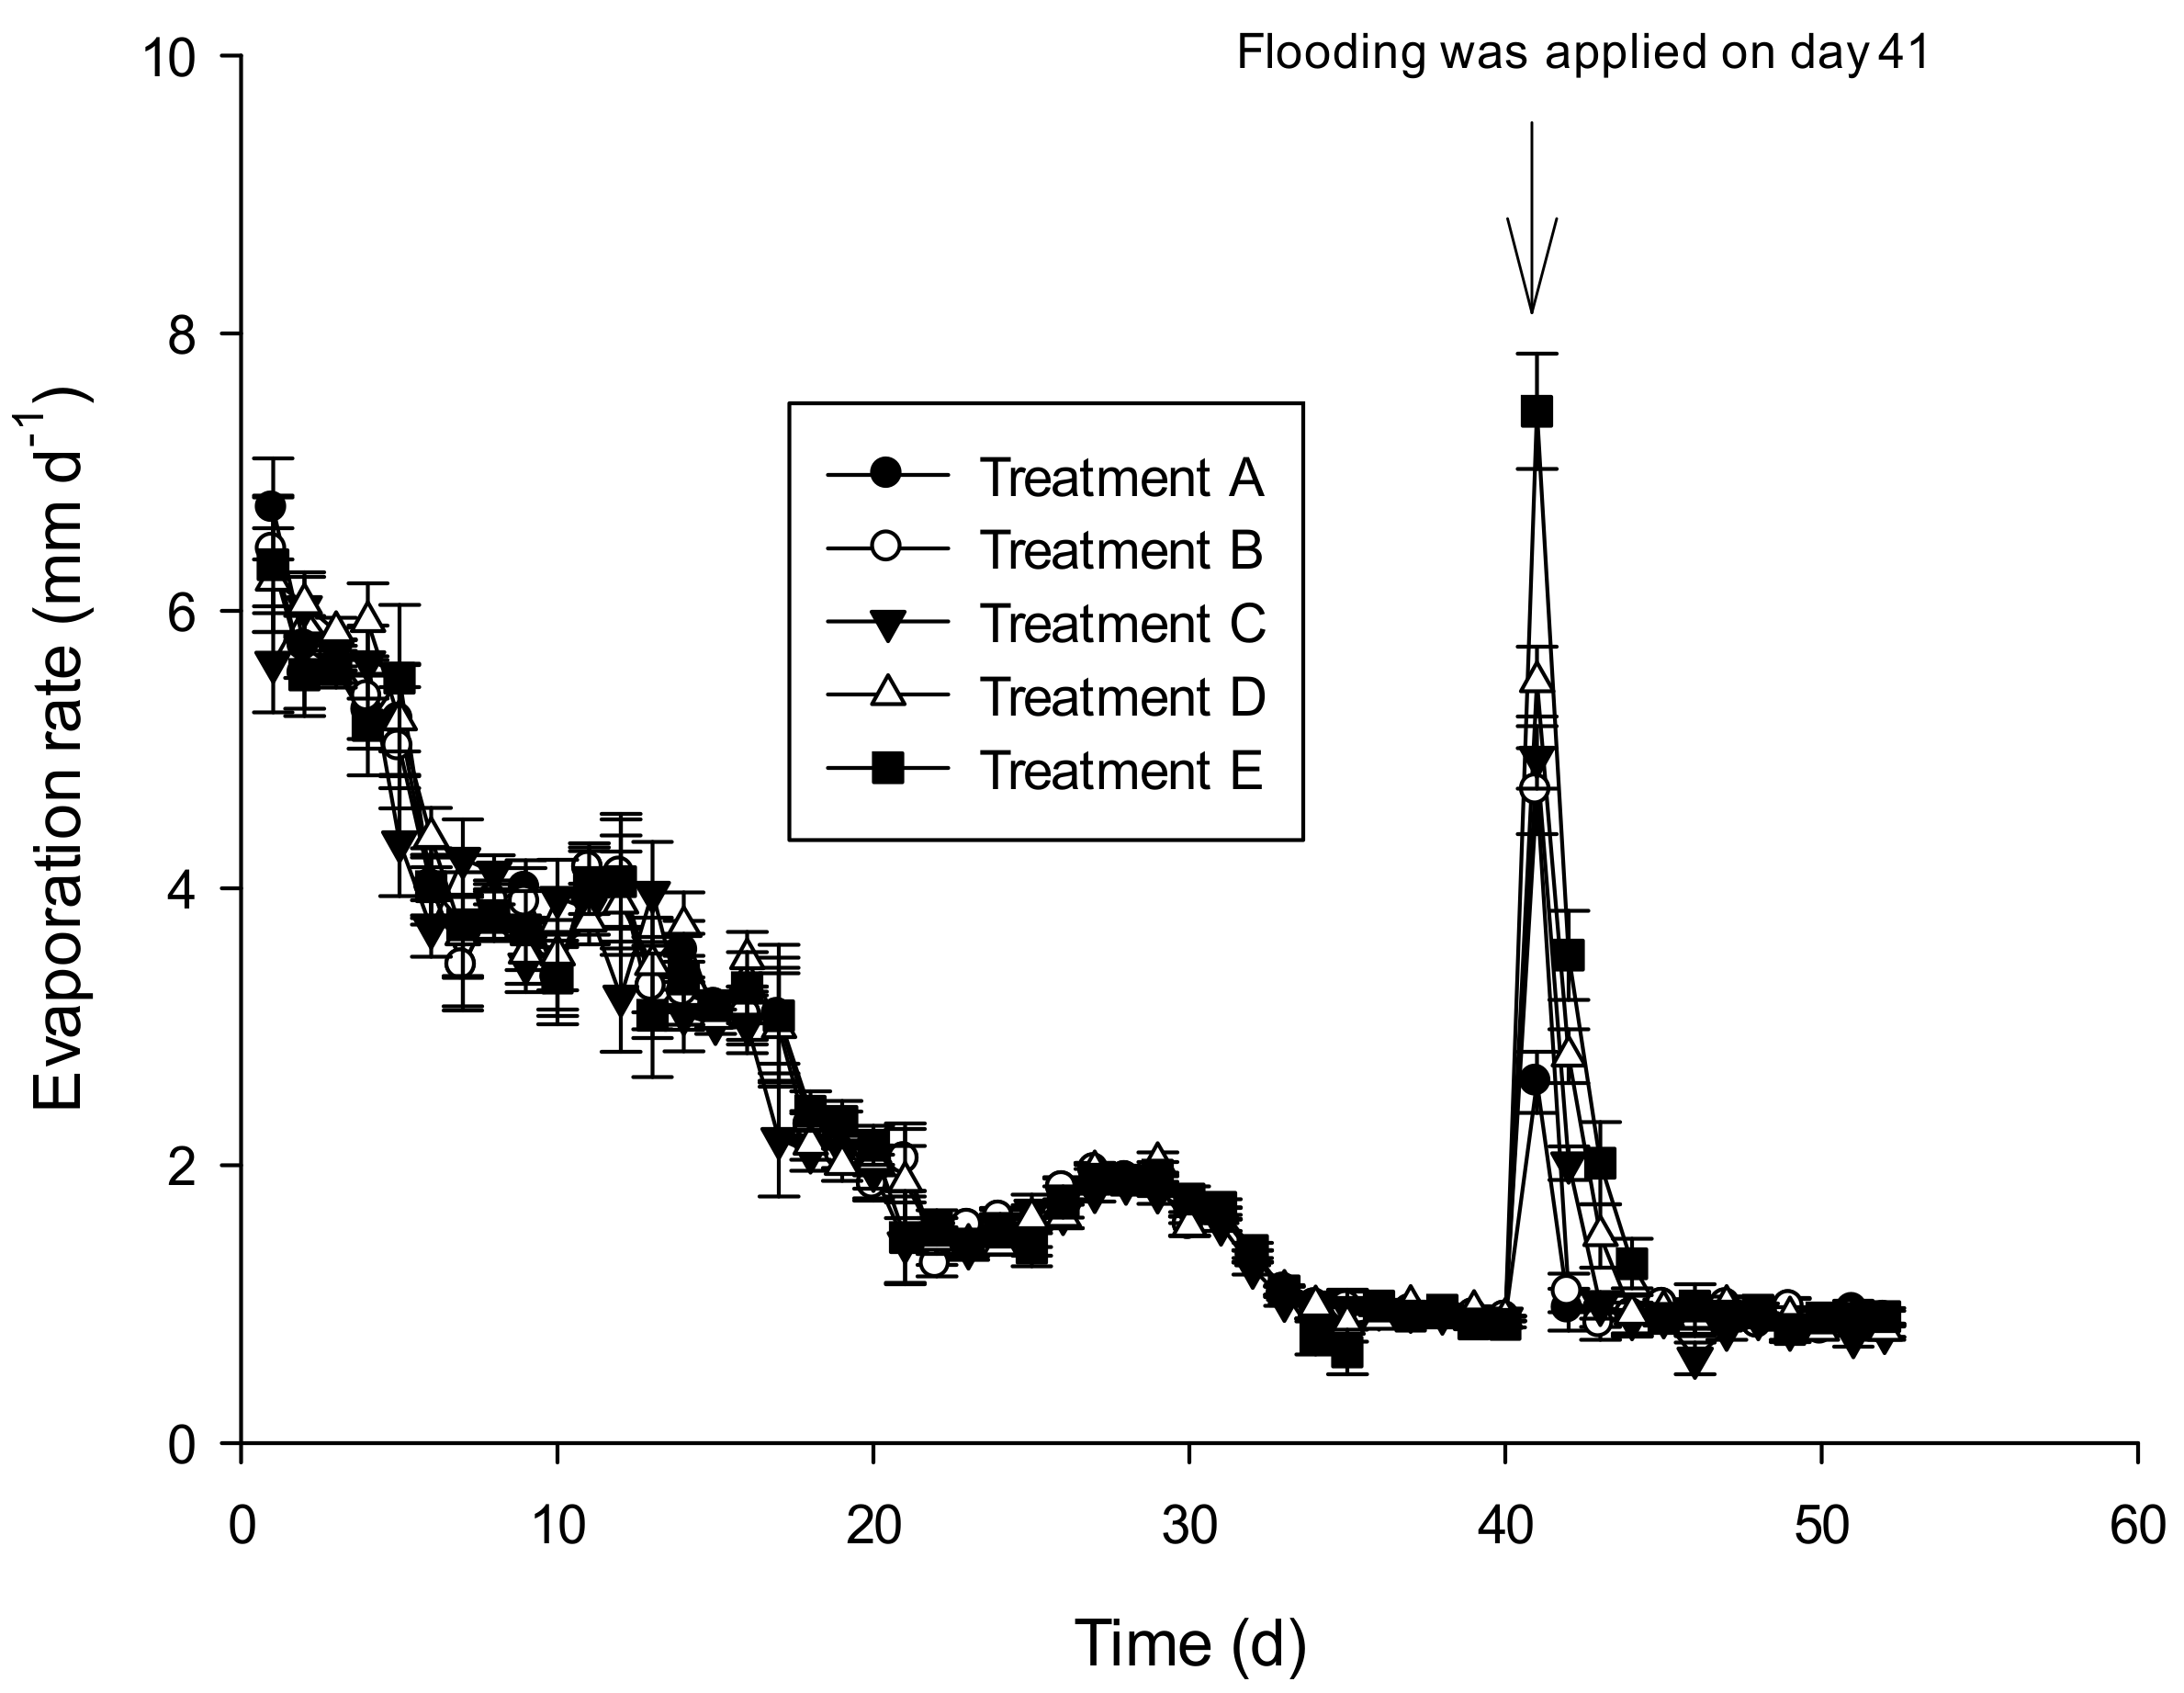
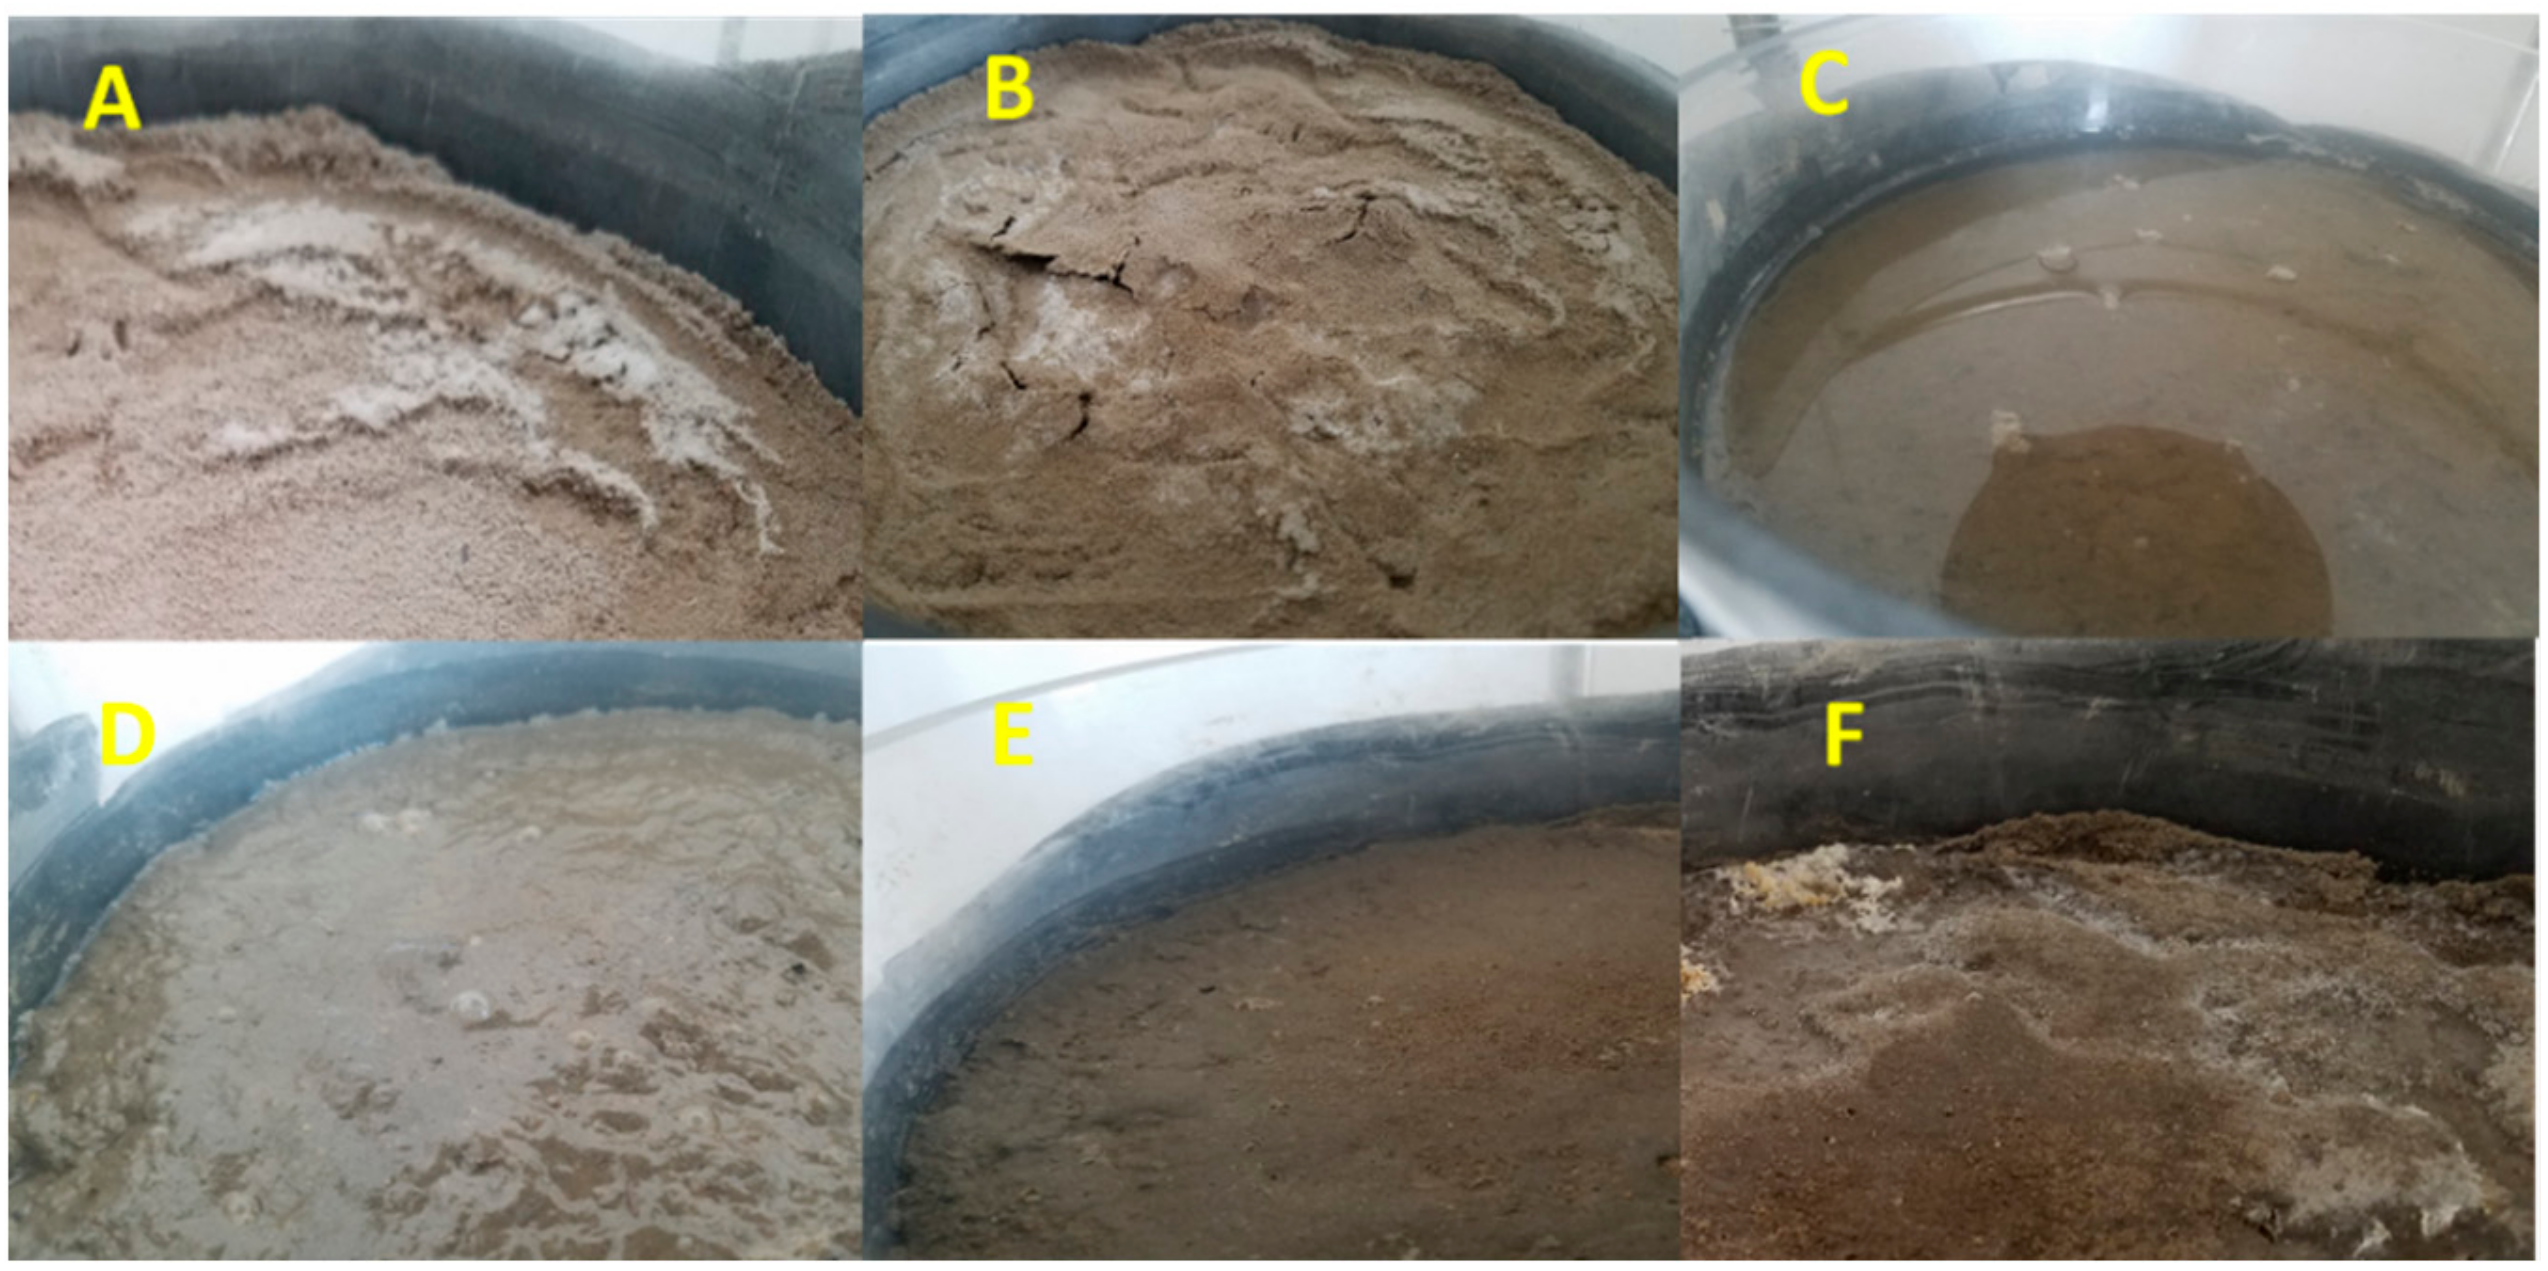
The evaporation varied dynamically with salt precipitation [31] and reflected the salt crust formation process [29]. All treatments were performed under the same conditions before the flood (from day 1 to day 40); therefore, we analyzed the evaporation rate using the mean values of all treatments (a total of 15 columns). The initial evaporation rate was high and had a mean value of 6.26 mm·day−1 (SE of 0.36 mm day−1) (Figure 2). The mean evaporation rate was 2.2 mm·day−1 (SE of 0.10 mm) on day 19; at this time, evident salt precipitation was observed (Figure 3A). The evaporation rate fell to 1.4 mm (SE of 0.08 mm) on day 22, when the area of salt precipitation was larger and the salt crust was noticeably elevated. The salt crust had some breakage (Figure 3B), and the mean evaporation rate showed a small increase that reached 1.90 mm (SE of 0.08 mm) on day 27. The evaporation rate was relatively stable with a mean value of 0.9 mm (SE of 0.03 mm) after day 36.
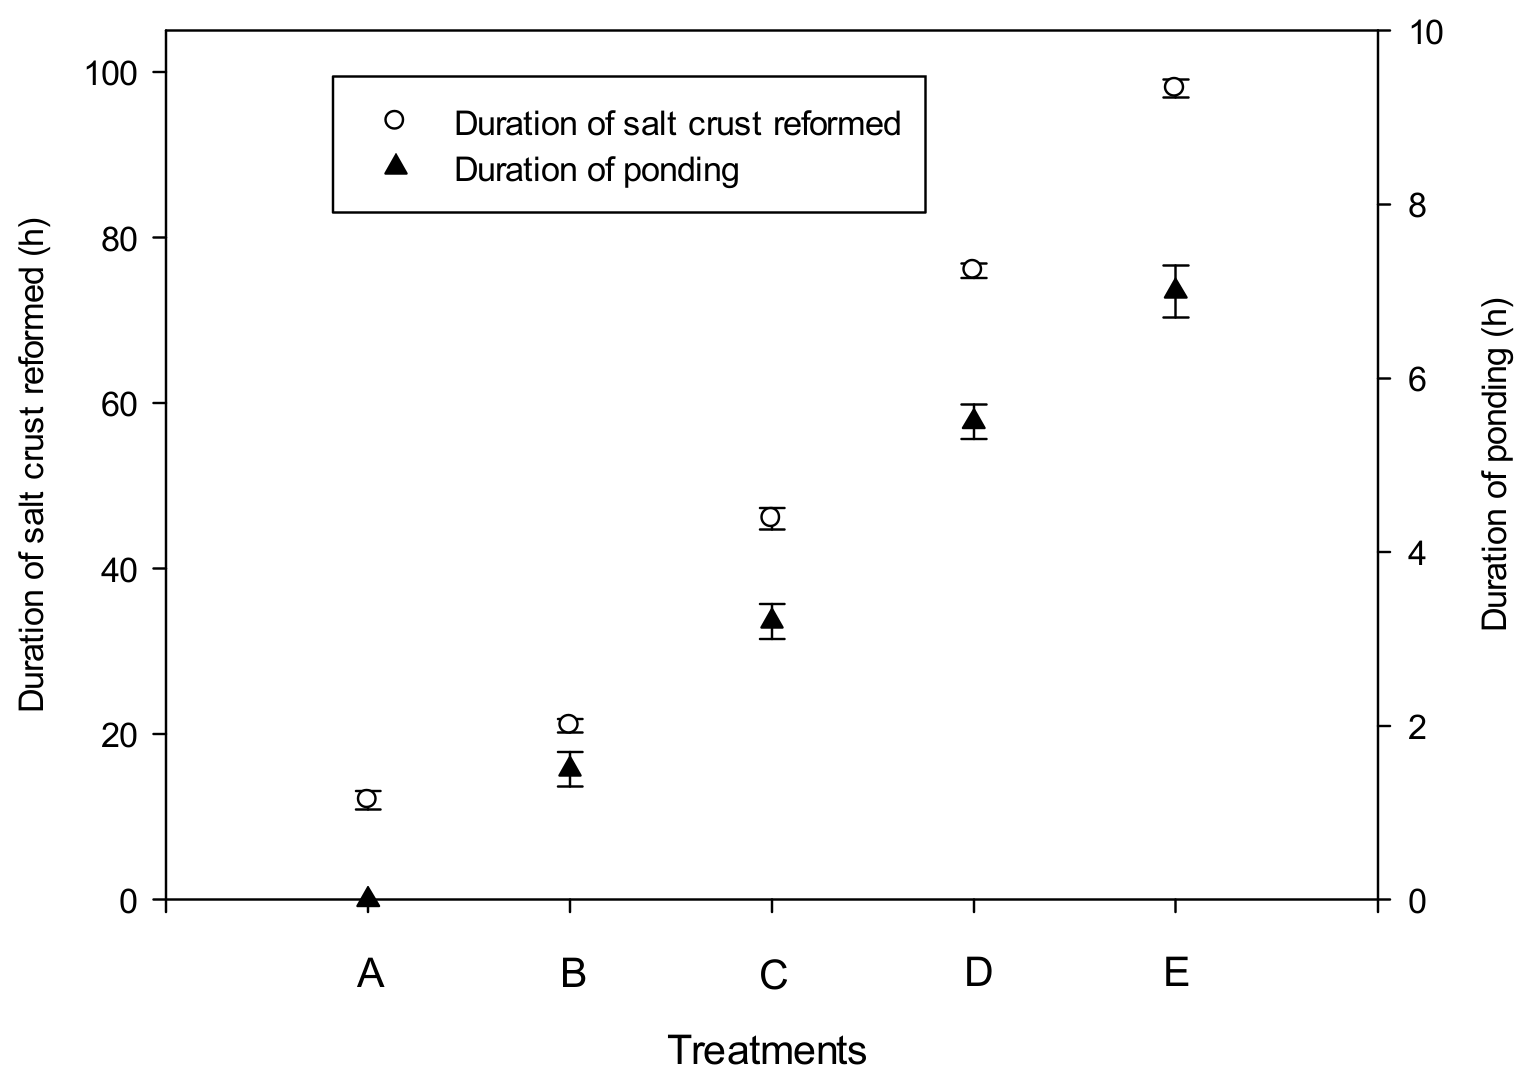
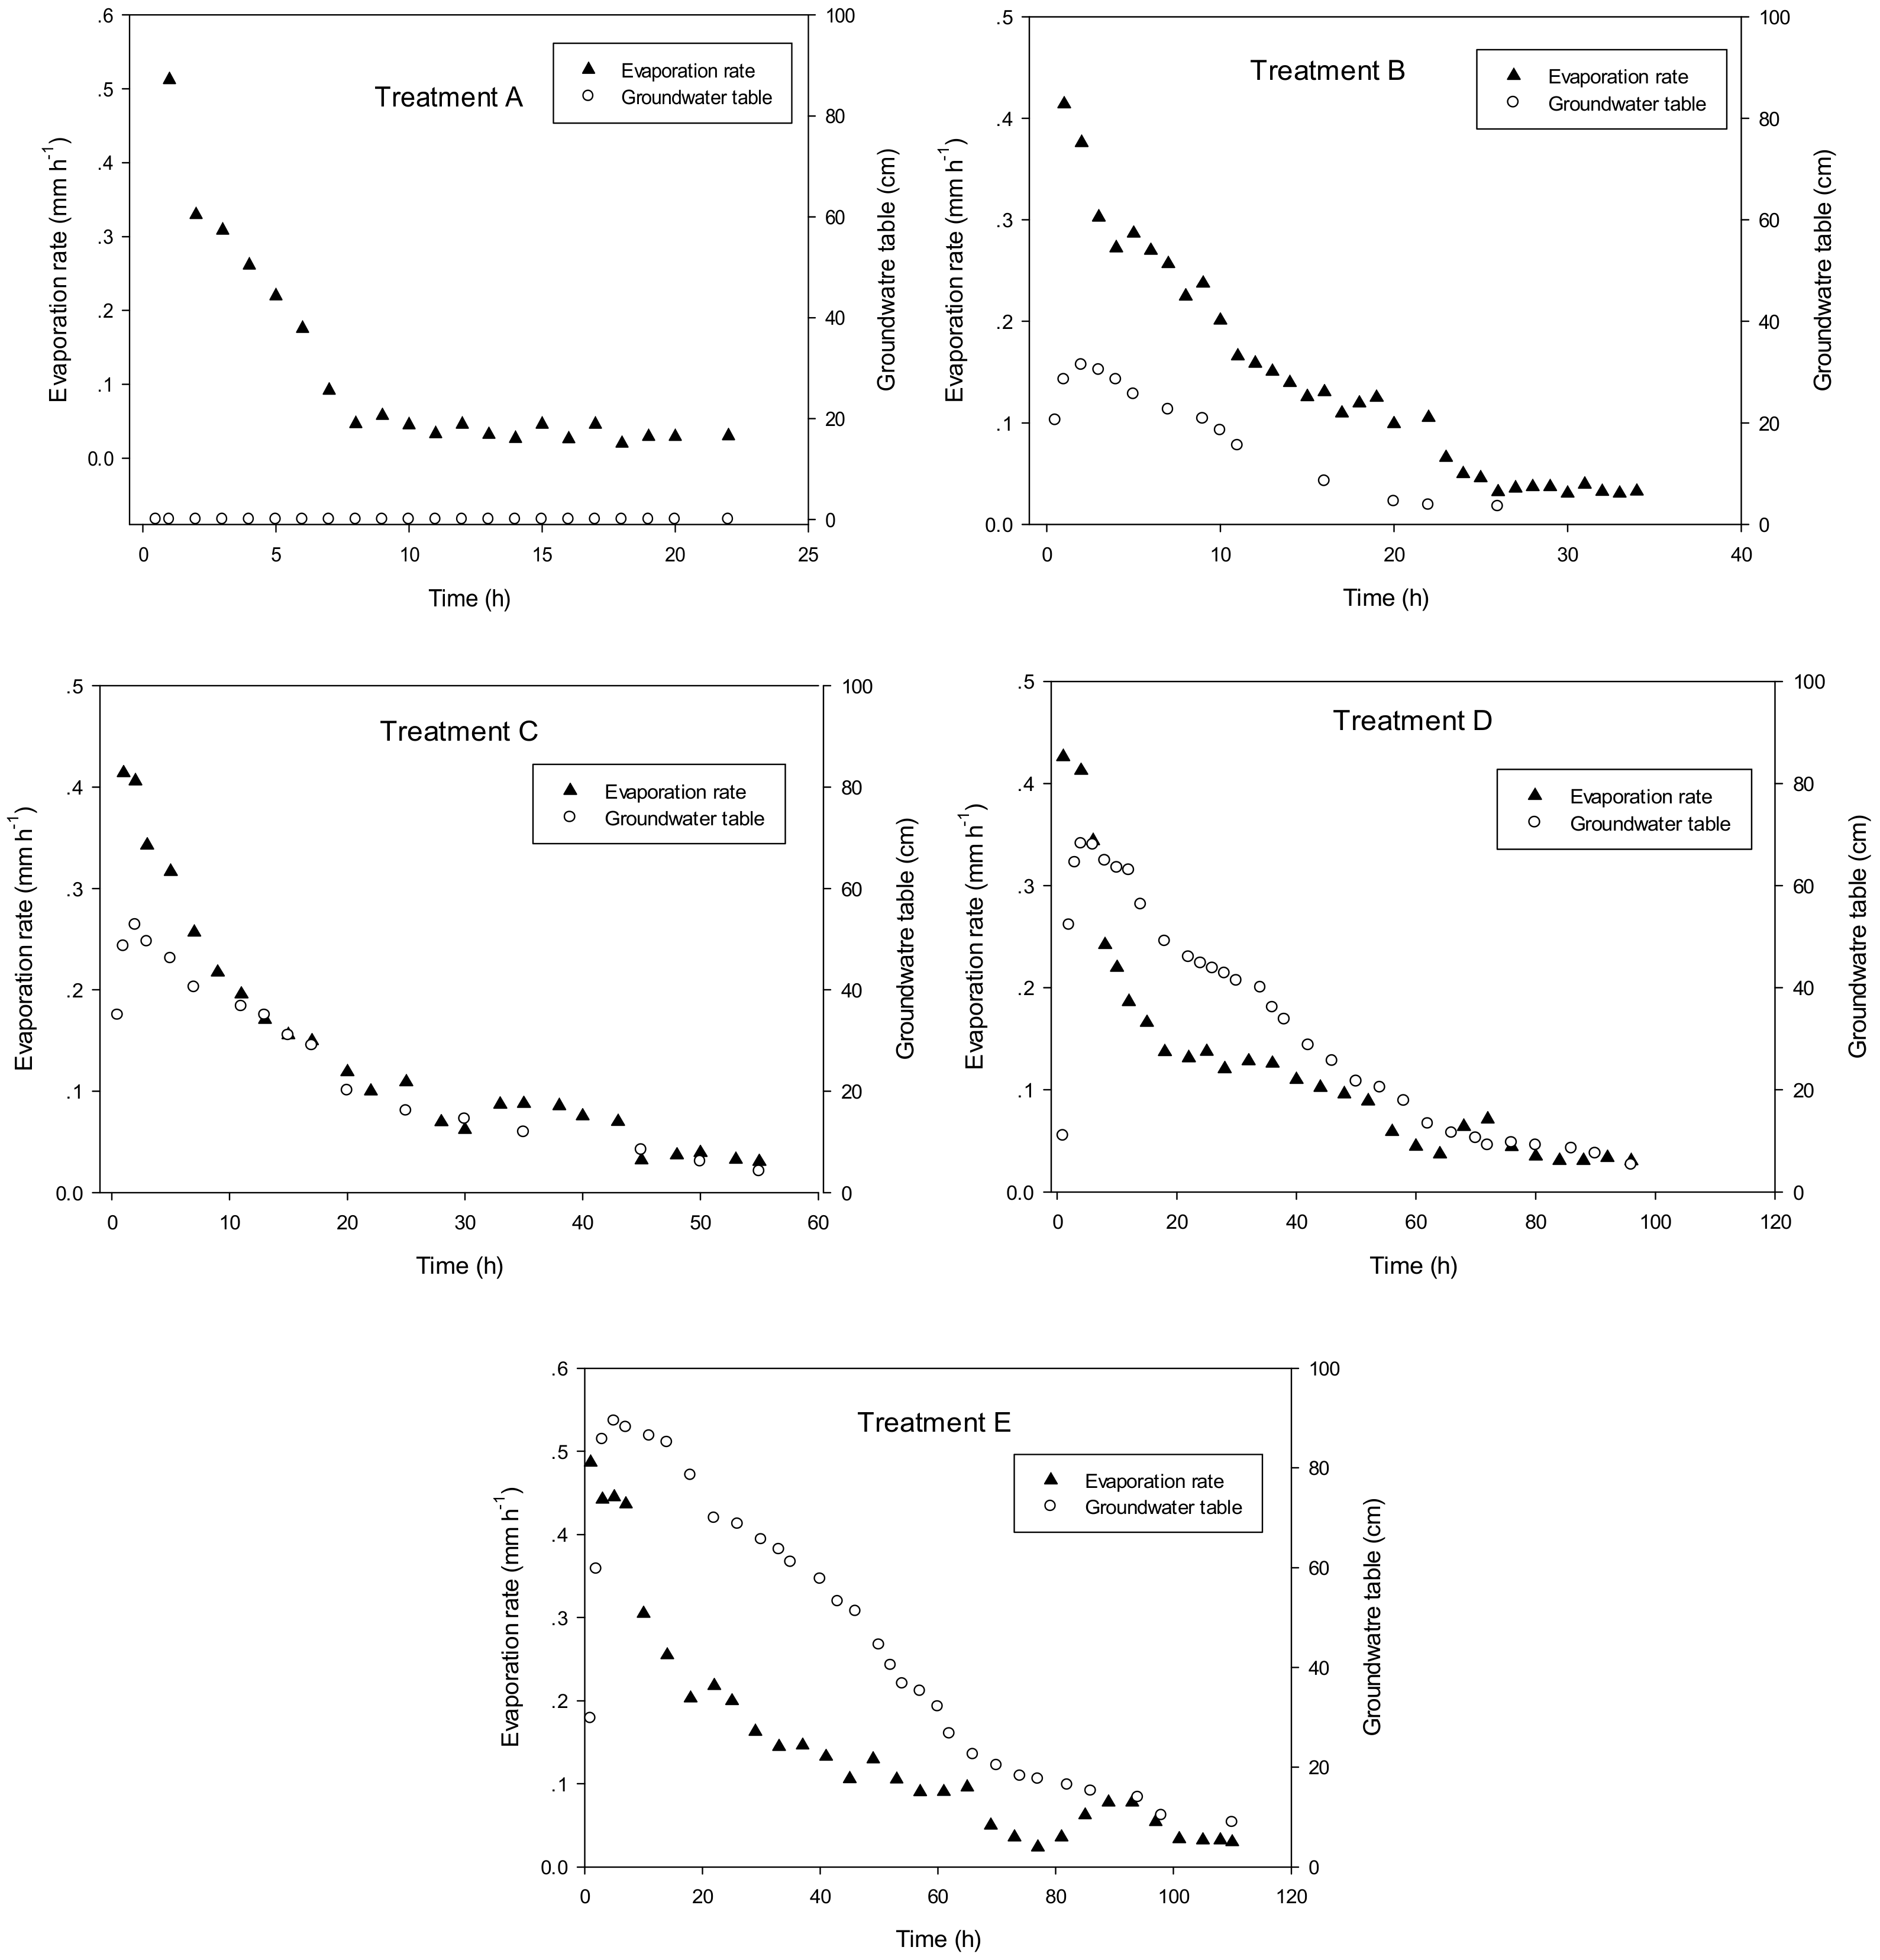
The different depths of floodwater (2, 6, 10, 14, and 18 mm for treatments A, B, C, D and E, respectively) were added to the soil on day 41. Water ponding (Figure 3C,D) lasted about 0, 1.5 (SE of 0.2), 3.2 (SE of 0.2), 5.5 (SE of 0.2), and 7.0 (SE of 0.3) h for treatments A, B, C, D and E, respectively (Figure 4). As expected, the evaporation rate increased rapidly when floodwater was added to the soil; however, the evaporation rate varied for the different floodwater depths. The evaporation rates on day 41 for treatments A, B, C, D and E were 2.6 (SE of 0.11 mm day−1), 4.7 (SE of 0.11 mm day−1), 4.9 (SE of 0.15 mm day−1), 5.5 (SE of 0.16 mm day−1), and 7.4 mm day−1 (SE of 0.20 mm day−1), and they were 1.0 (SE of 0.1 mm day−1), 1.1(SE of 0.1 mm day−1, 2.0 (SE of 0.11 mm day−1), 2.8 (SE of 0.15 mm day−1), and 3.5 mm day−1 (SE of 0.13 mm day−1) the next day, respectively. For all treatments, the evaporation rate decreased to values similar to the low values previously observed when the salt crust had completely formed (days 36–40). This second decrease in the evaporation rate indicates salt crust reformation, which occurred within 12 (SE of 0.25 h), 21 (SE of 0.35 h), 46 (SE of 1.3 h), 76 (SE of 0.9 h), and 98 h (SE of 1.1 h) after flooding (Figure 5). These results indicate that the floodwater temporarily dissolved the salt crust, causing the evaporation to increase significantly. However, the salt crust reformed quickly, and the previous low evaporation rate was restored.
However, before the salt crust reformed and the low evaporation rate returned, the total water loss for treatments A, B, C, D, and E was about 2.1 mm (SE of 0.09 mm), 4.3 mm (SE of 0.12 mm), 6.6 mm (SE of 0.11 mm), 10.1 mm (SE of 0.14 mm), and 13.8 mm (SE of 0.13 mm), respectively. That is to say, except for in treatment A, the additional floodwater of the other treatments had not completely evaporated by the time the salt crust reformed.
3.2. Groundwater Table and Soil Water Content
Investigations of floodwater infiltration and groundwater recharge are important for water resource management worldwide, particularly in arid regions [32]. The variation in the groundwater table is an important indicator of flood recharge [41]. In our research, except for in treatment A, the groundwater table rose in the other treatments after flooding. Figure 5 demonstrates that the groundwater table rose rapidly after the flooding was implemented on day 41, and it also shows the time it took the groundwater tables to reach their maximum height: for treatment B, it took 1.7 h (SE of 0.1 h) to reach a maximum height of 29.4 cm; for treatment C, it took 2.6 h (SE of 0.1) to reach a maximum height of 53.4 cm; for treatment D, it took 4.7 h (SE of 0.1) to reach a maximum height of 67.1 cm; for treatment E, it took 5.4 h (SE of 0.1) to reach a maximum height of 88.6 cm. The groundwater started to fall once it had reached its maximum height. The groundwater table in treatment B fell to 3.8 cm (SE of 0.3 cm) in 22.5 h (SE of 1.1 h), C fell to 8.4 cm (SE of 0.3 cm) in 45.8 h (SE of 1.8 h), treatment D fell to 9.6 cm (SE of 0.2 cm) in 76.4 h (SE of 2.1 h), and treatment E fell to 10.3 cm (SE of 0.3 cm) in 98 h (SE of 2.2 h); at these times, the salt crust had reformed completely and caused a low evaporation rate. The findings indicate that the floodwater caused a significant rise in the groundwater table before the salt crust reformed.
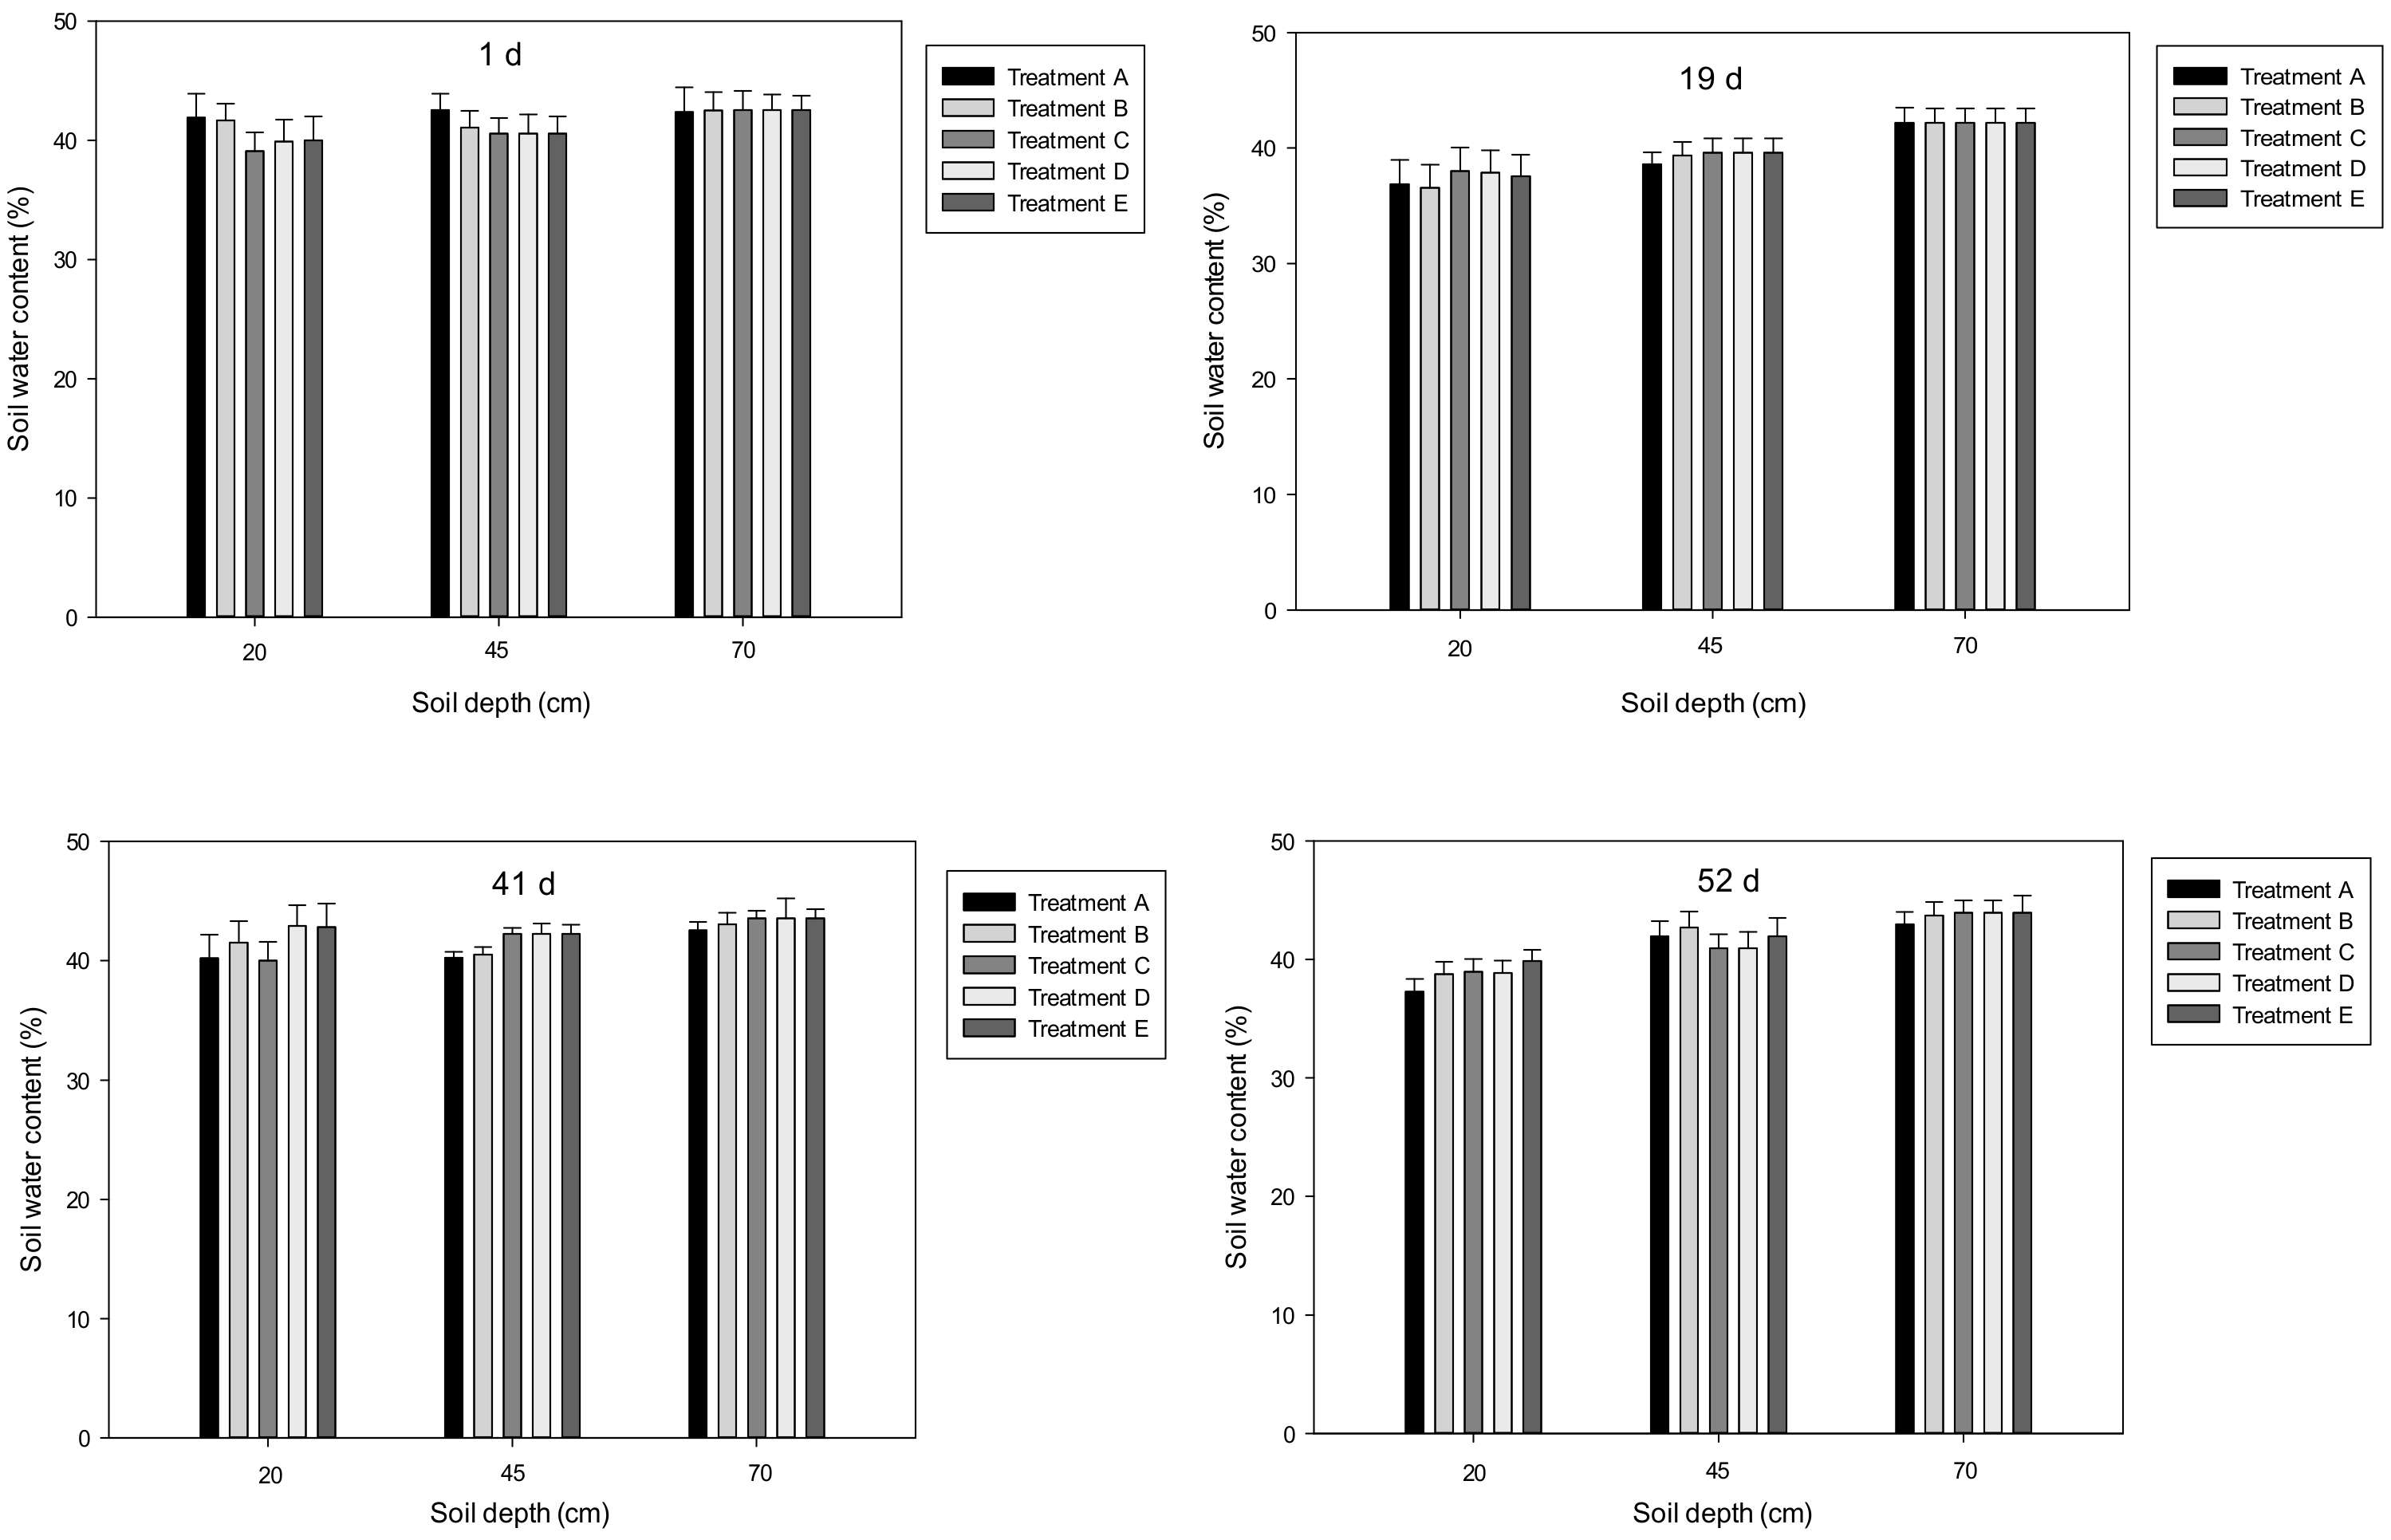
In addition to the effects on the groundwater, it is possible that flooding increases the soil water content. Therefore, our research also investigated the soil water content variation in the soil profile. Figure 6 shows that there are small variations in the soil water content for different times and depths: the soil profile from 20 to 70 cm has a high soil water content with little variation. The soil water content at a depth of 20 cm for all treatments, had a mean value of 40.2% (SE of 1.9%) on day 1, and there was a very small decrease to 36.7% (SE of 2.0%) on day 19. The highest value was 41.5% (SE of 1.9%), which occurred on day 41 due to the floodwater infiltrating the soil. On day 52, there was a stable value of 38.7% (SE of 1.1%).
The soil water content showed no significant difference during the experiment. For the soil moisture at a depth of 45 cm, the variation trend (maximum value occurred on day 41) was similar than that at a depth of 20 cm. However, the variation at 20 cm was smaller and the value was higher, ranging from 39.4 (SE of 1.2%) to 42.1% (SE of 0.9%) during the experimental period. The water content had the smallest change at a depth of 70 cm, where it ranged from 42.2 (SE of 0.1%) to 43.9% (SE of 0.8%), and the water content was close to that of the saturated soil water content during the experimental period. For all treatments, the process and values were similar, and there was no significant difference among them (Figure 6). These results show that the existence of the evaporation front was located in a layer very close to the surface (as a depth of less than 20 cm).
4. Discussion
In general, the evaporation levels were different between the saline and non-saline soils [12]. Compared with non-saline soils, in saline soils, the evaporation was often inhibited [28]. Two main reasons for this were found [17], the first salt was found to reduce evaporation as the osmotic potential of the solution increased. For the second salt, the soil’s pores became blocked due to salt precipitation, which reduced the vapor diffusion through the soils. Evaporation from non-saline soils is often described in terms of three stages [42]. In the initial stage, the evaporation rate is relatively constant (the so-called S1). This stage is followed by a transition period, where the drying rate continuously decreases due to the disruption of the capillary pathway (S2). Finally, all the liquid connections to the surface are disrupted and a low and stable evaporation rate via vapor diffusion through soils dominated (S3). Nachshon et al. [11] defined three new stages of evaporation for saline solutions as follows: SS1 (exhibits a low and gradual decrease in the evaporation rate due to the increasing osmotic potential), SS2 (evaporation rate falls progressively due to salt-crust formation), and SS3 (is characterized by a constant low rate of evaporation).
In our research, the evaporation rate decreased rapidly due to drier surface soil, and it also decreased due to the formation of the salt crust. A low and stable evaporation rate has been reported by many studies [1,3,11,18,28,43,44], and our research results are in agreement with this. In general, porewater solute concentration increases until saturation is reached and salt crystals begin to precipitate [45]. When advection dominates (i.e., when Pe ≫ 1), salt precipitation occurs [46], and then the salt crystals continue to laterally and vertically grow, causing a further decrease in evaporation [29]. The crystals stop growing when the salt crust is no longer connected to the solution due to the evaporation front generated [1]. Finally, a low and stable evaporation rate is maintained [1,3,11,18,28,43,44]. Therefore, a low and stable evaporation rate is an important indicator that is used to determine whether the salt crust has completely formed or reformed. In our research, when a low and stable evaporation rate was observed, we presumed that the salt crust had completely formed or reformed.
In our research, the salt crust tended to form domes over the surface of the soils, and the salt crust had breaks (Figure 3A). Dai et al. [30] reported that the upward movement of the salt crust has an average speed of approximately 5 µm/h. The author illustrated the mechanism, which is proposed herein, to explain salt crust migration along the internal wall of the acrylic cylinders after detaching from the soil surfaces. This condensation–deliquescence–transportation–precipitation sequence underlies the upward migration of salt crusts. However, in our experiment, the salt domes also formed in the center of the surface. Nachshon et al. [29] give more details about this phenomenon—they observed that the generated crust was not in full contact with the soil surface: the entire matrix was covered by the salt crust, but ~90% was elevated, while only ~10% of the crust was in contact with the underlying matrix. These findings are similar to our observation that most of the salt crust was elevated (Figure 3B). There was an interesting phenomenon in our experiments that was not reported by previous studies. The surface soil became relatively flat after flooding (Figure 3D,E), indicating that the salt crust was dissolved by the floodwater—the salt crust elevation had disappeared. However, the elevation reoccurred after flooding (Figure 3F), indicating that the floodwater dissolved the salt crust and temporarily made the surface relatively flat; however, the salt crust elevation ultimately returned.
The salt crust demonstrated some breakage (Figure 3B), which we deduced may be related to its elevation. Figure 3B shows that the breakage at locations where the salt crust was elevated; however, Figure 3F also shows an elevated salt crust but without breakage. This is because breakage did not occur until the salt crust was dry, suggesting that such breakage only occurs in dry salt crusts; if the salt crust is wet, breakage does not occur, even if the salt crust is elevated. Rose et al. [3] reported that the salt crust cracked and the evaporation rate from the soil surface increased by approximately 60% (from 2.5 to 4 mm day−1) then decreased steadily to a rate lower than that previously observed. In our research, there was a small increase in the evaporation rate from 1.5 to 1.9 mm day−1 (max value)—an increase of approximately 26%—associated with breaks in the salt crust. Since the study did not present pictures of the cracking phenomenon observed [3], we do not know whether it was similar to that observed in our research or not. The evaporation rate increased due to the broken salt crust, exposing the soil surface to the air, which, in turn, leads to a greater amount of evaporation. Nachshon et al. [17] reported that the evaporation rate reverted to its initial condition when the salt crust was removed because the soil was directly exposed to the air. In our research, the salt crust was broken, but most of the soil surface was still covered; therefore, only a small increase in evaporation (26%) was observed.
Sghaier and Prat [31] experimentally explored the evaporation of an aqueous NaCl solution from porous media and concluded that evaporation was taking place on top of the salt crust. However, Nachshon et al. [17] supported the assumption that evaporation occurs below the salt crust. Then, Nachshon et al. [29] strengthened this assumption by performing a salt crust dome analysis. Our research result showed that the evaporation rate increased when the salt crust broke; therefore, we believe that evaporation takes place below the salt crust. Thus, we support the assertion that evaporation takes place at the matrix surface, within the gap below the salt crust [29], and not on the surface of the salt crust as proposed by Sghaier and Prat [31].
Our research results showed some difference in the duration of salt crust reformation and flood ponding under different flood water depths ranging from 2 to 18 mm. The flood ponding lasted several hours (0–7 h), while salt crust reformation lasted for much longer (about 17–100 h). The differences were caused by the extents to which soil salt was flushed under different the water amount applied. When floods occur, the inflow dissolves the old surface saline crust [33] and the salt was leached [47]; however, the high evaporative demand causes these salts to reaccumulate. The more flood water that was applied, the deeper the salt was leached, and the more time that was needed to reaccumulate at the soil surface along with the evaporation. This was the main reason that caused the difference in the duration of salt crust reformation and flood ponding under different treatments. In our research, the evaporation rate was increased significantly in salt crust soils but the evaporation rate was also increased for soils without salt crust after flooding, due to the fact that the soil was wetted. If the soil column treated with pure water from the Marriotte bottle, the soils dried faster due to the low osmotic potential, and a steady evaporation rate occurred was achieved earlier [3], but the vapor diffusion rate was higher without salt crust impeded [17]. Therefore, the evaporation process in salt crust soils still differed from that of soils with no salt crust, even though both experienced flooding.
Chen [23] reported that when distilled water was added to the salt crust, the evaporation rate increased 10–20-fold for a short time and then returned to the previous low value. Groeneveld et al. [27] provided a conceptual model: (1) salt crusts dissolve after receiving sufficient direct precipitation; (2) high rates of evaporation then rapidly remove water; (3) the brine becomes saturated once again, which causes crusts to reform; and (4) evaporation drops once more to extremely low rates. In our research, all of the soil columns showed the same trend after flooding: the evaporation rate increased to a much higher level after flooding, then decreased to a final stable rate that was similar to the previous low value. This final low evaporation rate is caused by the reformation of the salt crust.
In arid and hyper-arid climates, evaporation from shallow groundwater is a major outflow component of the water balance [48,49]. In our research, the only water loss was by evaporation, and when the groundwater table reached a maximum value after a floodwater recharge, the water table started falling due to evaporation and the velocity of the decrease in the water table was significantly lower than the velocity at which the water table increased. After water ponding ceased, the evaporation rate decreased continually, similarly to the trend observed for the decreasing groundwater table. In general, the evaporation rate is much higher for shallower groundwater [3,44,50,51,52].
Chen [23] reported that only a portion of the rain evaporated during their field and lab experiments, and the relative evaporation returned to the previous rate after the evaporation of 52% and 68%, respectively, of the added flood water. Chen [23] deduced that the rainwater recharged the groundwater brine because the soil water content was close to saturation throughout the whole experiment. In our research, the groundwater table was not lifted in treatment A, but the rest of treatments (B, C, D and E) showed that the groundwater table was lifted before the salt crust reformed and the evaporation rate returned to a low value. Our research results extend to the conclusion that if the amount of floodwater less than 2 mm, the groundwater was not recharged. Therefore, we suggest that the groundwater recharge should be considered in similar studies when the floodwater is greater than 2 mm; otherwise, the evaporation may be overestimated, particularly when using a micrometeorology method (e.g., Eddy covariance or Bowen ratio). On the contrary, the groundwater recharge could be neglected, when the floodwater depth less than 2 mm.
The soil water content decreased toward the soil surface, but the magnitude of the change was much greater in the upper soil profile than it was closer to the water table [3]. In our research, there was just a very small variation in the soil water content among the different soil depths (20–70 cm). The main reason for this is that the existence of the evaporation front located in a layer very close to the surface is very narrow for salt-crusted soils [1,3,28], and evaporation is restricted to a very narrow zone [1]. This front corresponds to a plane that divides the soil into two zones [28]: high salinity and dry area above the evaporation front, and a diluted solution and wet area below it. The gradient is high in the dry zone but low in the wet zone [53]. Salt precipitation only occurred above the evaporation front, which occupied a very narrow region [1,3,28]. In our research, the first sensor was located at a depth of 20 cm. The high soil water content during the experiment indicated that the evaporation front located above a depth of 20 cm and the soil water content was almost completely saturated with a low gradient below the evaporation front. This was the main reason for the very small variation in the soil water content among the different soil depths (20–70 cm). Rose et al. [3] reported that below a depth of 10 cm, no appreciable changes were observed, and the water content remained close to the values recorded before the start of the experiment. Salt precipitation occurred only above the evaporation front, which occupied a very narrow region at a depth of 4 cm in the sand columns [1]. Rose et al. [3] also reported that the evaporation front was located 40, 60, and 120 mm under the groundwater table depths of 30, 45, and 70 cm, respectively. Hernández-López, et al. [28] suggested that it was located between depths of 0 and 5 cm for the groundwater table depths of 30, 45, and 50 cm. Some studies have indicated that soils with high soil water content almost saturated the underlying crust throughout the whole experiment [23]. Li and Liu [38] reported similar results for the Tarim River. Therefore, our research results strengthen the conclusion that the evaporation front is located in a layer very close to the surface and is very narrow for salt-crusted soils. It was also implied that to quantify the dynamics of water and salt, we must consider the evaporation front location in the soil profile for salt crust soils.
The existing literature has shown that the salt crust has a very narrow evaporation front, and the soil is wet—even close to saturation—below the evaporation front but dry above the evaporation front. Most observations of the wider soil region (5–10 cm) are made by sensors; therefore, it is hard to monitor the dynamic water variation from the surface to the evaporation front, reflecting the soil water variation over the evaporation front. Rose et al. [3] used a self-designed sensor that could observe the soil water content every 1 cm. Other studies [1,23] have measured the soil water content in soil columns using the oven-drying method and periodically withdrawing individual soil columns. Hernández-López et al. [28] used time-domain reflectometry (TDR) probes (CS645, Campbell Scientific, Logan, UT), but they did not identify the evaporation rate for 50 and 45 cm groundwater tables, probably because the soil evaporation front was located above the first sensor, i.e., between depths of 0 and 5 cm. However, based on the above-mentioned studies, our research results are not likely to be influenced by not having observed the soil water content near the soil surface because the soil water content near the surface tends to undergo small changes within a very narrow region. In addition, our research mainly focused on the variation in the groundwater table and the evaporation rate. Therefore, our research results are supported by our experimental data.
We have not considered the mass changes caused by the added salts, the main reason was the solution concentration was 10 g/L, the mass change was influenced by the added salt was little (less than 1%). In addition, this study investigated the effect of floodwater on the groundwater, focused on the evaporation process from “added the floodwater” to “salt crust reformed”. The added salts from saline solution had little influence on our research. Therefore, the mass changes caused by the added salts was not considered. Our experiment was conducted in isothermal conditions. In reality, the evaporation demand varies with radiation, humidity, and wind speed, and there is a significant difference at night. We conducted the experiment in the lab to simulate the effect of flooding on the evaporation and the groundwater table under salt-crusted soils. However, in real flood events of natural systems, it is possible that the salt is washed away laterally to a lower land area and that the salt is removed directly to another place with little vertical infiltration. In our research, we only made the assumption that the flood water movement was vertical, and the soil surface was flat without lateral flow. We will consider the horizontal movement of the salt for future studies. In addition, our research only considered homogeneous soils, but there is usually a great difference compared with heterogeneous soils, the heterogeneous soil should be considered in future research work.
5. Conclusions
The effects of different flood water depths (2, 6, 10, 14, and 18 mm) on the evaporation rate, soil water content, and groundwater table level were investigated in the lab using a silt loam soil column from a groundwater table with a depth of 90 cm. Our research results revealed that the salt crust caused a low evaporation rate and tended to form a dome. The evaporation rate increased due to salt crust breakage, indicating that evaporation takes place below the salt crust. The soil moisture did not significantly change in the soil profile from 20 to 70 cm during the experimental period, which indicated that the existence of the evaporation front was located in a layer very close to the surface. As expected, the evaporation rate significantly increased after the floodwater was added, but except for treatment A, the other treatments showed that just a portion of the added water evaporated and the groundwater table was lifted before the salt crust reformed and a low and stable evaporation rate returned. The shallow groundwater table of 90 cm in depth also contributed to maintaining the soil water content at a high level. Thus, it was easy for the applied water to infiltrate the soil column, even though it was only by a small amount (6 mm). We suggest that the groundwater was recharged which should not be neglected. Otherwise, groundwater consumption may be overestimated. These results may be of particular interest in secretohalophyte water use strategy applications. For example, the Tamarix spp., a very common secretohalophyte with a salt crust, only depends on the groundwater in an arid region; however, our research results imply that the Tamarix spp. could also use the floodwater or rainfall when the water depth was larger than 2 mm, because a portion of the floodwater remained in the soils and the groundwater table was lifted. Our research results strengthen the conclusion that the evaporation occurs near the soil surface; however, we have not observed the dynamics of the evaporation front due to limited experimental conditions. Describing the evaporation is very important to reflect the soil water content and salt variation in salt crust soils; therefore, how to quantify the evaporation front location in a soil profile should be the focus of future research work.
Author Contributions
X.L. designed performed and the experiments and wrote the paper. F.S. reviewed and revised this paper.
Funding
This research was funded by [National Natural Science Foundation of China] grant number [41571035] and [Youth Innovation Promotion Association CAS] grant number [2017477].
Conflicts of Interest
The authors declare no conflict of interest.
References
- Gran, M.; Carrera, J.; Massana, J.; Saaltink, M.W.; Olivella, S.; Ayora, C.; Lloret, A. Dynamics of water vapor flux and water separation processes during evaporation from a salty dry soil. J. Hydrol. 2011, 396, 215–220. [Google Scholar] [CrossRef]
- Shimojima, E.; Yoshioka, R.; Tamagawa, I. Salinization owing to evaporation from bare-soil srufaces and its infuluence on the evaporation. J. Hydrol. 1996, 178, 109–136. [Google Scholar] [CrossRef]
- Rose, D.A.; Konukcu, F.; Gowing, J.W. Effect of watertable depth on evaporation and salt accumulation from saline groundwater. Aust. J. Soil Res. 2005, 43. [Google Scholar] [CrossRef]
- Howari, F.M.; Goodell, P.C.; Miyamoto, S. Spectral properties of salt crusts formed on saline soils. J. Environ. Qual. 2002, 31, 1453–1461. [Google Scholar] [CrossRef]
- Nachshon, U. Cropland Soil Salinization and Associated Hydrology: Trends, Processes and Examples. Water 2018, 10, 1030. [Google Scholar] [CrossRef]
- Singer, A.; Banin, A.; Poberejzsky, L.; Gilenko, M. Soil Crusts in the Amudarya River Delta: Properties and Formation. In Sustainable Land Use in Deserts; Breckle, S.-W., Veste, M., Wucherer, W., Eds.; Springer-Verlag: Berlin/Heidelberg, Germany, 2001. [Google Scholar]
- Argaman, E.; Singer, A.; Tsoar, H. Erodibility of some crust forming soils/sediments from the Southern Aral Sea Basin as determined in a wind tunnel. Earth Surf. Process. Landf. 2006, 31, 47–63. [Google Scholar] [CrossRef]
- Langston, G.; Neuman, C.M. An experimental study on the susceptibility of crusted surfaces to wind erosion: A comparison of the strength properties of biotic and salt crusts. Geomorphology 2005, 72, 40–53. [Google Scholar] [CrossRef]
- Kampf, S.K.; Tyler, S.W.; Ortiz, C.A.; Munoz, J.F.; Adkins, P.L. Evaporation and land surface energy budget at the Salar de Atacama, Northern Chile. J. Hydrol. 2005, 310, 236–252. [Google Scholar] [CrossRef]
- Tyler, S.W.; Kranz, S.; Parlange, M.B.; Albertson, J.; Katul, G.G.; Cochran, G.F.; Lyles, B.A.; Holder, G. Estimation of groundwater evaporation and salt flux from Owens lake, California, USA. J. Hydrol. 1997, 200, 110–135. [Google Scholar] [CrossRef]
- Nachshon, U.; Weisbrod, N.; Dragila, M.I.; Grader, A. Combined evaporation and salt precipitation in homogeneous and heterogeneous porous media. Water Resour. Res. 2011, 47. [Google Scholar] [CrossRef] [Green Version]
- Fujimaki, H.; Shimano, T.; Inoue, M.; Nakane, K. Effect of a salt crust on evaporation from a bare saline soil. Vadose Zone J. 2006, 5, 1246–1256. [Google Scholar] [CrossRef]
- Yang, J.-L.; Zhang, G.-L.; Yang, F.; Yang, R.-M.; Yi, C.; Li, D.-C.; Zhao, Y.-G.; Liu, F. Controlling effects of surface crusts on water infiltration in an arid desert area of Northwest China. J. Soils Sediments 2016, 16, 2408–2418. [Google Scholar] [CrossRef]
- Srivastava, D.S.; Jefferies, R.L. A Positive Feedback: Herbivory, Plant Growth, Salinity, and the Desertification of an Arctic Salt-Marsh. J. Ecol. 1996, 84, 31. [Google Scholar] [CrossRef]
- Duan, Z.; He, Y.; Zhao, A.; Zhang, X. Study on Soil Salinity Change Under Irrigation in Takelamagan Desert. J. Arid Land Resour. Environ. 2000, 14, 65–70. [Google Scholar] [CrossRef]
- Eloukabi, H.; Sghaier, N.; Ben Nasrallah, S.; Prat, M. Experimental study of the effect of sodium chloride on drying of porous media: The crusty–patchy efflorescence transition. Int. J. Heat Mass Transf. 2013, 56, 80–93. [Google Scholar] [CrossRef] [Green Version]
- Nachshon, U.; Shahraeeni, E.; Or, D.; Dragila, M.; Weisbrod, N. Infrared thermography of evaporative fluxes and dynamics of salt deposition on heterogeneous porous surfaces. Water Resour. Res. 2011, 47. [Google Scholar] [CrossRef] [Green Version]
- Nachshon, U.; Weisbrod, N. Beyond the Salt Crust: On Combined Evaporation and Subflorescent Salt Precipitation in Porous Media. Transp. Porous Media 2015, 110, 295–310. [Google Scholar] [CrossRef]
- Maestre, F.T.; Bowker, M.A.; Canton, Y.; Castillo-Monroy, A.P.; Cortina, J.; Escolar, C.; Escudero, A.; Lazaro, R.; Martinez, I. Ecology and functional roles of biological soil crusts in semi-arid ecosystems of Spain. J. Arid Environ. 2011, 75, 1282–1291. [Google Scholar] [CrossRef] [Green Version]
- Li, X.; Feng, G.; Zhao, C.; Shi, F. Characteristics of soil infiltration in the Tarim River floodplain. Environm. Earth Sci. 2016, 75, 782. [Google Scholar] [CrossRef]
- Belnap, J. Comparative Structure of Physical and Biological Soil Crusts; Belnap, J., Lange, O.L., Eds.; Springer: Berlin/Heidelberg, Germany, 2001. [Google Scholar]
- Levy, G.J. Crusting. In Soil Management: Building a Stable Base for Agriculture; Hatfield, J.L., Sauer, T.J., Eds.; American Society of Agronomy and Soil Science Society of America: Madison, WI, USA, 2011. [Google Scholar]
- Chen, X.Y. Evaporation from a Salt-Encrusted Sediment Surface—Field and Laboratory Studies. Aust. J. Soil Res. 1992, 30, 429–442. [Google Scholar] [CrossRef]
- Zhang, J.G.; Xu, X.W.; Lei, J.Q.; Li, S.Y.; Hill, R.L.; Zhao, Y. The effects of soil salt crusts on soil evaporation and chemical changes in different ages of Taklimakan Desert Shelterbelts. J. Soil Sci. Plant Nutr. 2013, 13, 1019–1028. [Google Scholar] [CrossRef]
- Malek, E.; Bingham, G.E. Comparison of the Bowen ratio energy balance and the water balance methods for the measurement of evaporation. J. Hydrol. 1993, 146, 209–220. [Google Scholar] [CrossRef]
- Parlange, M.B.; Eichenger, W.L.; Albertson, J.D. Regional scale evaporation and the atmospheric boundary layer. Rev. Geophys. 1995, 33, 99–124. [Google Scholar] [CrossRef]
- Groeneveld, D.P.; Huntington, J.L.; Barz, D.D. Floating brine crusts, reduction of evaporation and possible replacement of fresh water to control dust from Owens Lake bed, California. J. Hydrol. 2010, 392, 211–218. [Google Scholar] [CrossRef]
- Hernández-López, M.F.; Gironás, J.; Braud, I.; Suárez, F.; Muñoz, J.F. Assessment of evaporation and water fluxes in a column of dry saline soil subject to different water table levels. Hydrol. Process. 2014, 28, 3655–3669. [Google Scholar] [CrossRef]
- Nachshon, U.; Weisbrod, N.; Katzir, R.; Nasser, A. NaCl Crust Architecture and Its Impact on Evaporation: Three-Dimensional Insights. Geophys. Res. Lett. 2018, 45, 6100–6108. [Google Scholar] [CrossRef]
- Dai, S.; Shin, H.; Santamarina, J.C. Formation and development of salt crusts on soil surfaces. Acta Geotech. 2015, 11, 1103–1109. [Google Scholar] [CrossRef]
- Sghaier, N.; Prat, M. Effect of Efflorescence Formation on Drying Kinetics of Porous Media. Transp. Porous Media 2009, 80, 441–454. [Google Scholar] [CrossRef]
- Zhang, G.; Feng, G.; Li, X.; Xie, C.; Pi, X. Flood Effect on Groundwater Recharge on a Typical Silt Loam Soil. Water 2017, 9, 523. [Google Scholar] [CrossRef]
- Lowenstein, T.K.; Hardie, L.A. Criteria for the recognition of salt-pan evaporites. Sedinientology 1985, 32, 327–644. [Google Scholar] [CrossRef]
- Olivella, S.; Carrera, J.; Gens, A.; Alonso, E.E. Porosity Variations in Saline Media Caused by Temperature Gradients Coupled to Multiphase Flow and Dissolution/Precipitation. Transp. Porous Media 1996, 25, 1–25. [Google Scholar] [CrossRef]
- Goodall, T.M.; North, C.P.; Glennie, K.W. Surface and subsurface sedimentary structures produced by salt crusts. Sedimentology 2000, 47, 99–118. [Google Scholar] [CrossRef]
- Weisbrod, N.; Dragila, M.I. Potential impact of convective fracture venting on salt-crust buildup and ground-water salinization in arid environments. J. Arid Environ. 2006, 65, 386–399. [Google Scholar] [CrossRef]
- Malek, E. Comparison of the Bowen Ratio-Energy Balance and Stability-Corrected Aerodynamic Methods for Measurement of Evapotranspiration. Theor. Appl. Climatol. 1993, 48, 167–178. [Google Scholar] [CrossRef]
- Li, Z.; Liu, Z. Distribution of the Soil Moisture (0–15 cm) During the Soil Drifting in the Lower Reach of Tarim River. Sci. Geogr. Sin. 2012, 32, 511–515. [Google Scholar] [CrossRef]
- Li, X.H.; Feng, G.L.; Zhao, C.Y.; Zheng, Z.H. Fine-Particle Emission Potential From Overflowing Areas of the Tarim River. Soil Sci. 2013, 178, 556–567. [Google Scholar] [CrossRef]
- Klute, S.; Dirksen, C. Hydraulic Conductivity and Diffusivity: Laboratory Methods; ASA and SSSA: Madison, WI, USA, 1986. [Google Scholar]
- Chen, Y.N.; Li, W.H.; Xu, C.C.; Ye, Z.X.; Chen, Y.P. Desert riparian vegetation and groundwater in the lower reaches of the Tarim River basin. Environ. Earth Sci. 2015, 73, 547–558. [Google Scholar] [CrossRef]
- Idso, S.B.; Reginato, R.J.; Jackson, R.D.; Kimball, B.; Nakayama, F.S. The three stages of drying of a field soil. Soil Sci. Soc. Am. Proc. 1974, 38, 831–837. [Google Scholar] [CrossRef]
- Konukcu, F.; Istanbulluoglu, A.; Kocaman, I. Determination of water content in drying soils: Incorporating transition from liquid phase to vapour phase. Soil Res. 2004, 42. [Google Scholar] [CrossRef]
- Gowing, J.W.; Konukcu, F.; Rose, D.A. Evaporative flux from a shallow watertable: The influence of a vapour–liquid phase transition. J. Hydrol. 2006, 321, 77–89. [Google Scholar] [CrossRef]
- Espinosa, R.M.; Franke, L.; Deckelmann, G. Phase changes of salts in porous materials: Crystallization, hydration and deliquescence. Constr. Build. Mater. 2008, 22, 1758–1773. [Google Scholar] [CrossRef]
- Shokri-Kuehni, S.M.S.; Vetter, T.; Webb, C.; Shokri, N. New insights into saline water evaporation from porous media: Complex interaction between evaporation rates, precipitation, and surface temperature. Geophys. Res. Lett. 2017, 44, 5504–5510. [Google Scholar] [CrossRef] [Green Version]
- Xu, H.; Zhang, P.; Zhao, X.; Zhang, P.; Ling, H. Effect of River-flooding on soil salinity in Lower Reaches of Tarim River. Bull. Soil Water Conserv. 2016, 36, 1–6. [Google Scholar] [CrossRef]
- Saito, H.; Simunek, J.; Mohanty, B.P. Numerical analysis of coupled water, vapor, and heat transport in the vadose zone. Vadose Zone J. 2006, 5, 784–800. [Google Scholar] [CrossRef]
- Sakai, M.; Toride, N.; Simunek, J. Water and Vapor Movement with Condensation and Evaporation in a Sandy Column. Soil Sci. Soc. Am. J. 2009, 73, 707–717. [Google Scholar] [CrossRef]
- Li, X.P.; Chang, S.X.; Salifu, K.F. Soil texture and layering effects on water and salt dynamics in the presence of a water table: A review. Environ. Rev. 2014, 22, 41–50. [Google Scholar] [CrossRef]
- Gardner, W.R. Some steady-state solutions of the unsaturated moisture flow with applications to evaporation from a water table. Soil Sci. 1958, 85, 228–232. [Google Scholar] [CrossRef]
- Hu, S.; Zhao, R.; Tian, C.; Song, Y. Empirical models of calculating phreatic evaporation from bare soil in Tarim river basin, Xinjiang. Environ. Earth Sci. 2009, 59, 663–668. [Google Scholar] [CrossRef]
- Gran, M.; Carrera, J.; Olivella, S.; Saaltink, M.W. Modeling evaporation processes in a saline soil from saturation to oven dry conditions. Hydrol. Earth Syst. Sci. 2011, 15, 2077–2089. [Google Scholar] [CrossRef]
Figure 1.
Diagram of the lysimeter.

Figure 2.
Daily variation in the evaporation rate in five treatments.

Figure 3.
Pictures of salt crusts in different conditions. (A) salt precipitation; (B) salt crust elevated with some breakage; (C) water ponding after flooding; (D) water ponding in recession; (E) surface soil drying; (F) salt crust elevated again without breakage.
Figure 3.
Pictures of salt crusts in different conditions. (A) salt precipitation; (B) salt crust elevated with some breakage; (C) water ponding after flooding; (D) water ponding in recession; (E) surface soil drying; (F) salt crust elevated again without breakage.

Figure 4.
The duration of salt crust reformation and flood ponding.

Figure 5.
Hourly variation in the evaporation rate and groundwater table after flooding in five treatments (the right axis shows the changes of groundwater table).
Figure 5.
Hourly variation in the evaporation rate and groundwater table after flooding in five treatments (the right axis shows the changes of groundwater table).

Figure 6.
Variation in the soil water content of the soil profile in five treatments.

© 2019 by the authors. Licensee MDPI, Basel, Switzerland. This article is an open access article distributed under the terms and conditions of the Creative Commons Attribution (CC BY) license (http://creativecommons.org/licenses/by/4.0/).
Share and Cite
MDPI and ACS Style
Li, X.; Shi, F. The Effect of Flooding on Evaporation and the Groundwater Table for a Salt-Crusted Soil. Water 2019, 11, 1003. https://doi.org/10.3390/w11051003
AMA Style
Li X, Shi F. The Effect of Flooding on Evaporation and the Groundwater Table for a Salt-Crusted Soil. Water. 2019; 11(5):1003. https://doi.org/10.3390/w11051003
Chicago/Turabian StyleLi, Xinhu, and Fengzhi Shi. 2019. "The Effect of Flooding on Evaporation and the Groundwater Table for a Salt-Crusted Soil" Water 11, no. 5: 1003. https://doi.org/10.3390/w11051003
Note that from the first issue of 2016, this journal uses article numbers instead of page numbers. See further details here.