Assessment of Lifestyle Factors Helps to Identify Liver Fibrosis Due to Non-Alcoholic Fatty Liver Disease in Obesity

 , ,
, ,
Abstract
:
1. Introduction
2. Materials and Methods
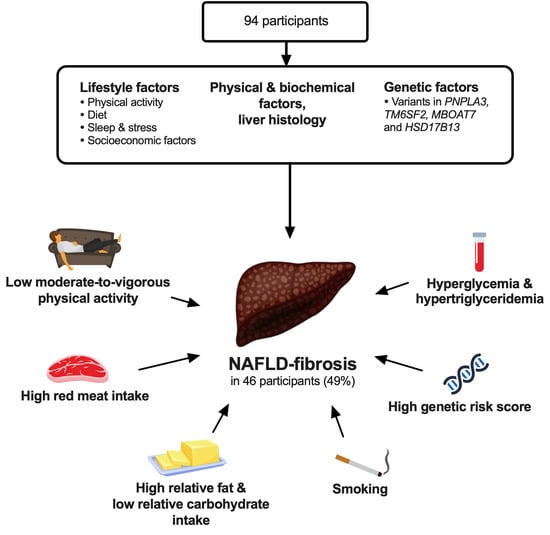
2.1. Participants
2.2. Study Design
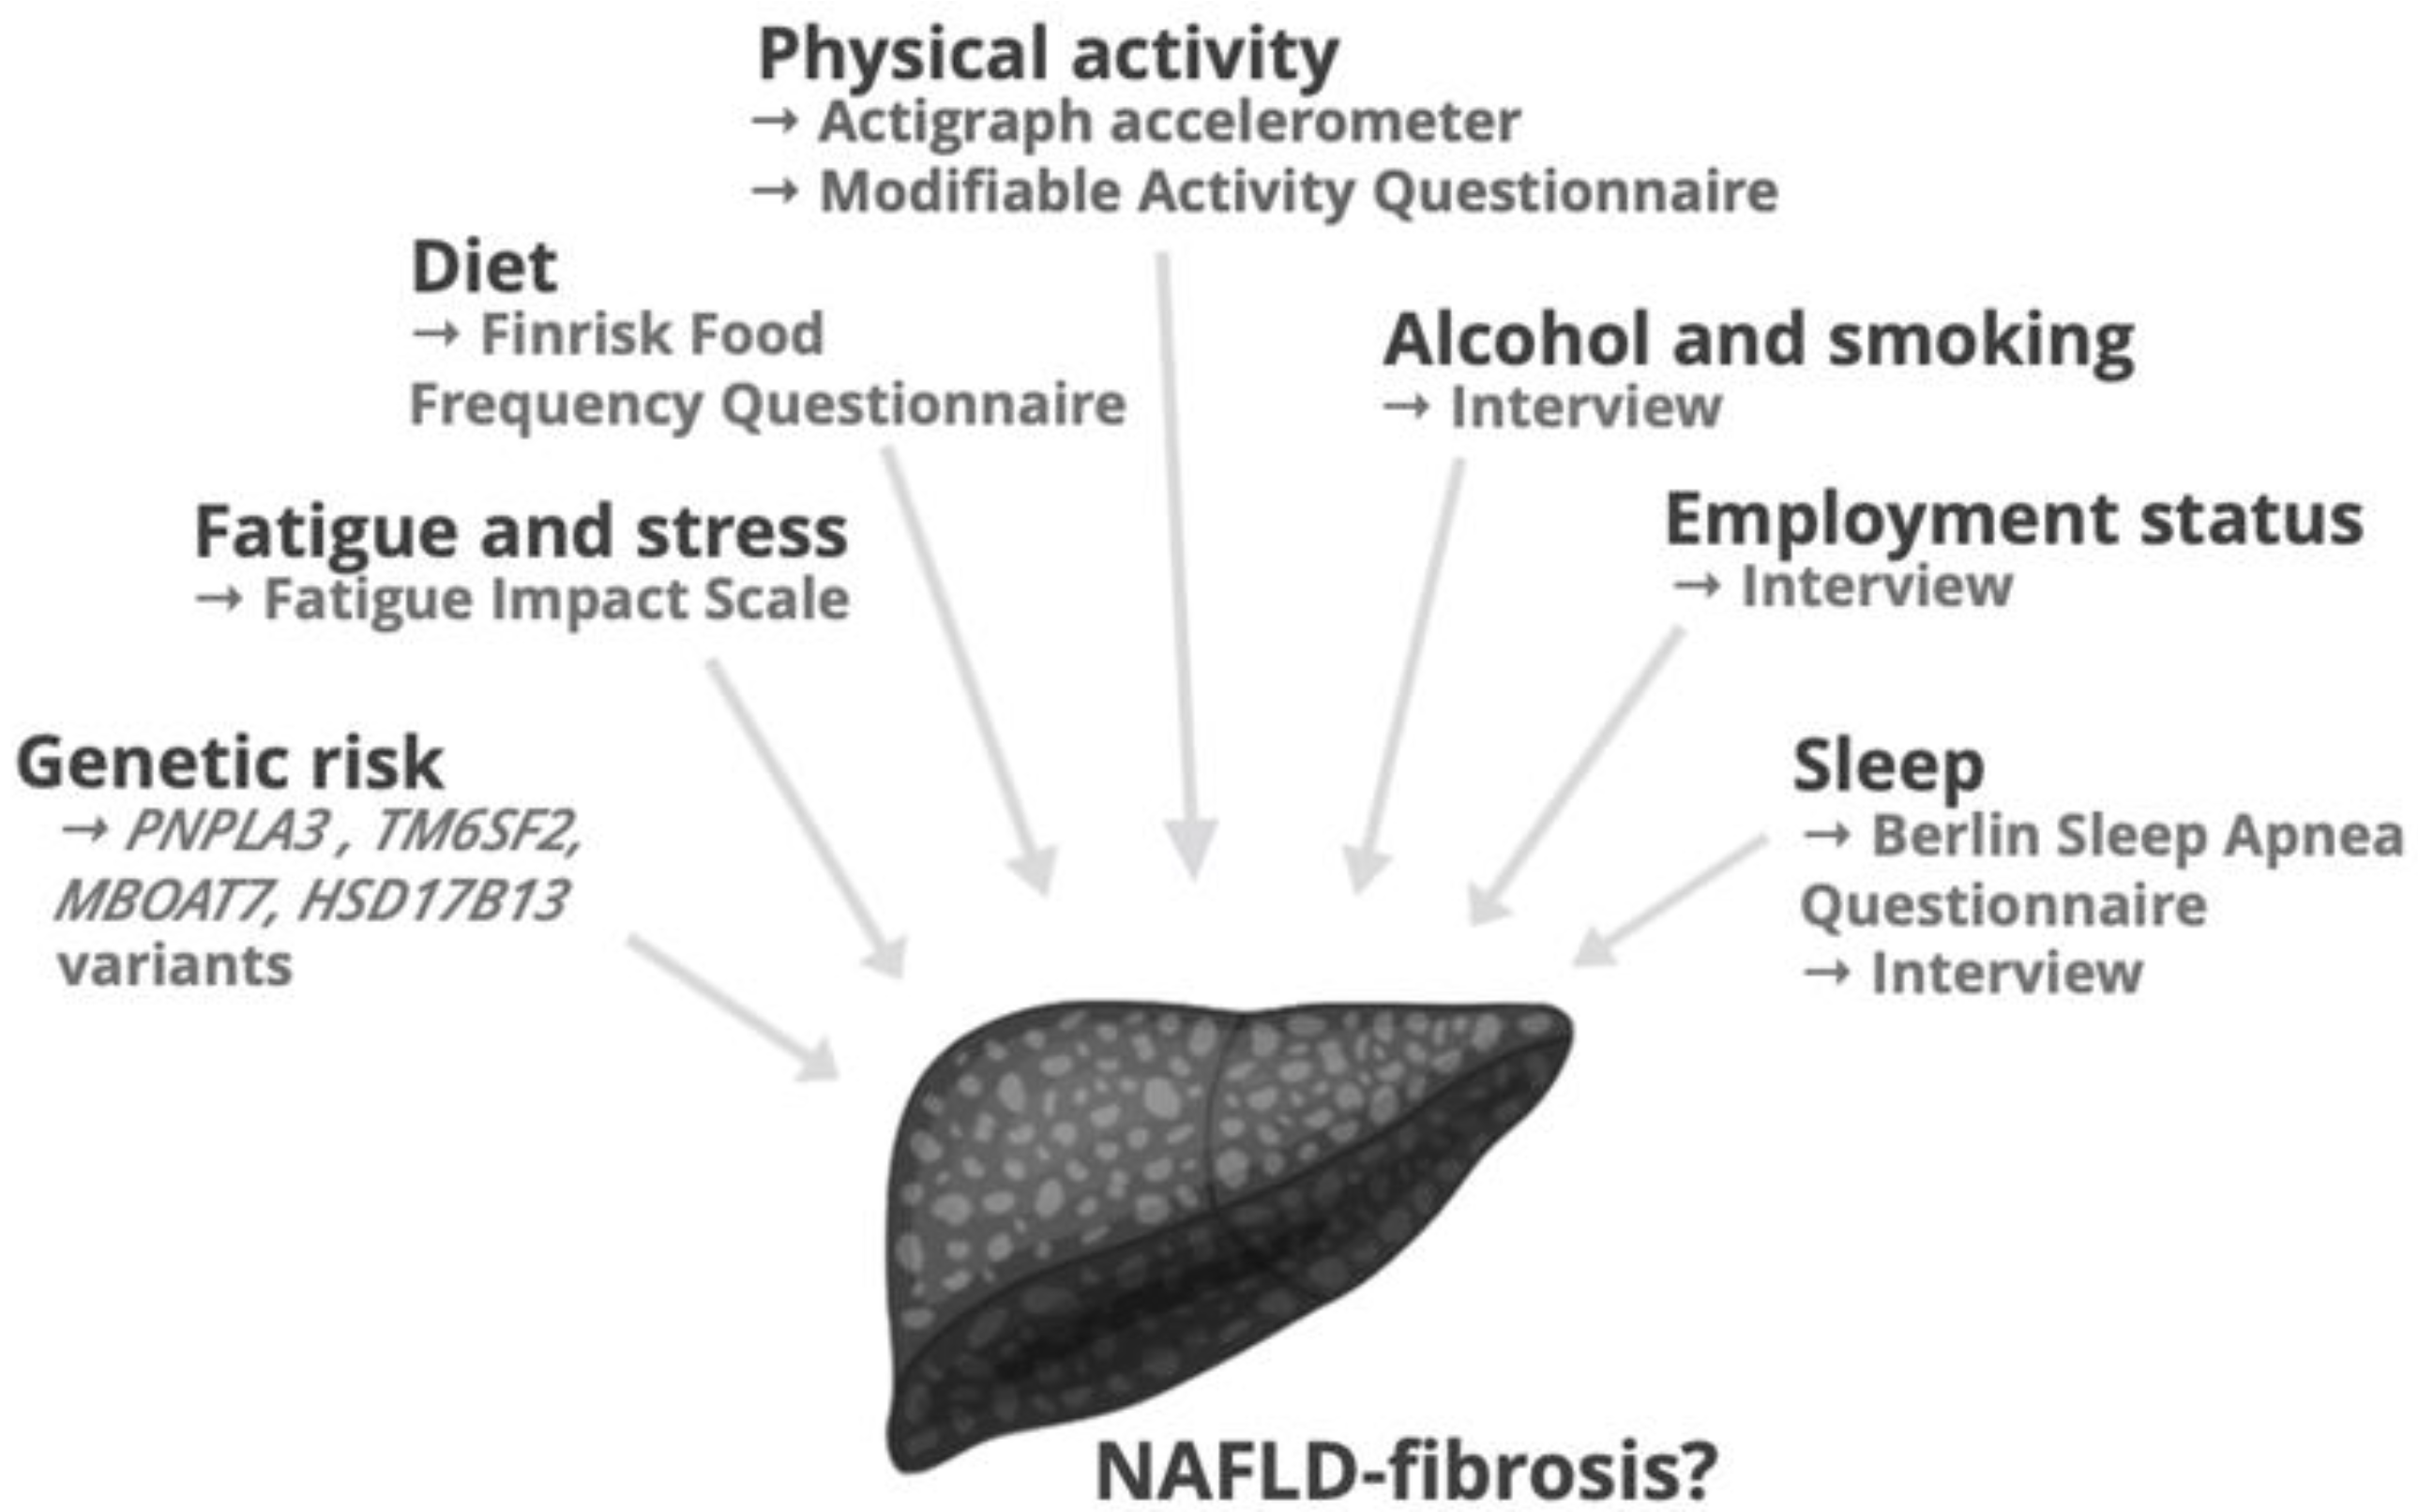
2.3. Lifestyle Factors
2.3.1. Physical Activity
2.3.2. Diet
2.3.3. Sleep, Stress and Socioeconomic Factors
2.4. Physical and Biochemical Factors, and Liver Histology
2.5. Genetic Factors
2.6. Statistical Analyses
3. Results
3.1. Lifestyle Factors
3.1.1. Physical Activity
3.1.2. Diet
3.1.3. Sleep, Stress and Socioeconomic Factors
3.2. Physical and Biochemical Factors, and Liver Histology
3.3. Genetic Factors
3.4. Multivariable Analyses
4. Discussion
5. Conclusions
Author Contributions
Funding
Institutional Review Board Statement
Informed Consent Statement
Data Availability Statement
Acknowledgments
Conflicts of Interest
References
- Brunt, E.M.; Janney, C.G.; Bisceglie, A.M.D.; Neuschwander-Tetri, B.A.; Bacon, B.R. Nonalcoholic steatohepatitis: A proposal for grading and staging the histological lesions. Am. J. Gastroenterol. 1999, 94, 2467–2474. [Google Scholar] [CrossRef]
- Ekstedt, M.; Hagström, H.; Nasr, P.; Fredrikson, M.; Stål, P.; Kechagias, S.; Hultcrantz, R. Fibrosis stage is the strongest predictor for disease-specific mortality in NAFLD after up to 33 years of follow-up. Hepatology 2015, 61, 1547–1554. [Google Scholar] [CrossRef] [Green Version]
- Angulo, P.; Kleiner, D.E.; Dam-Larsen, S.; Adams, L.A.; Bjornsson, E.S.; Charatcharoenwitthaya, P.; Mills, P.R.; Keach, J.C.; Lafferty, H.D.; Stahler, A.; et al. Liver fibrosis, but no other histologic features, is associated with long-term outcomes of patients with nonalcoholic fatty liver disease. Gastroenterology 2015, 149, 389–397.e310. [Google Scholar] [CrossRef] [Green Version]
- Machado, M.; Marques-Vidal, P.; Cortez-Pinto, H. Hepatic histology in obese patients undergoing bariatric surgery. J. Hepatol. 2006, 45, 600–606. [Google Scholar] [CrossRef]
- Alkhouri, N.; McCullough, A.J. Noninvasive diagnosis of NASH and liver fibrosis within the spectrum of NAFLD. Gastroenterol. Hepatol. 2012, 8, 661. [Google Scholar]
- Baranova, A.; Lal, P.; Birerdinc, A.; Younossi, Z.M. Non-Invasive markers for hepatic fibrosis. BMC Gastroenterol. 2011, 11, 1–15. [Google Scholar] [CrossRef] [PubMed] [Green Version]
- Angulo, P.; Hui, J.M.; Marchesini, G.; Bugianesi, E.; George, J.; Farrell, G.C.; Enders, F.; Saksena, S.; Burt, A.D.; Bida, J.P. The NAFLD fibrosis score: A noninvasive system that identifies liver fibrosis in patients with NAFLD. Hepatology 2007, 45, 846–854. [Google Scholar] [CrossRef] [PubMed]
- Shah, A.G.; Lydecker, A.; Murray, K.; Tetri, B.N.; Contos, M.J.; Sanyal, A.J.; Network, N.C.R. Comparison of noninvasive markers of fibrosis in patients with nonalcoholic fatty liver disease. Clin. Gastroenterol. Hepatol. 2009, 7, 1104–1112. [Google Scholar] [CrossRef] [Green Version]
- Aller, R.; Izaola, O.; de la Fuente, B.; Roman, D.A.D.L. Mediterranean diet is associated with liver histology in patients with non alcoholic fatty liver disease. Nutr. Hosp. 2015, 32, 2518–2524. [Google Scholar] [PubMed]
- Abdelmalek, M.F.; Suzuki, A.; Guy, C.; Unalp-Arida, A.; Colvin, R.; Johnson, R.J.; Diehl, A.M.; Network, N.S.C.R. Increased fructose consumption is associated with fibrosis severity in patients with nonalcoholic fatty liver disease. Hepatoloy 2010, 51, 1961–1971. [Google Scholar] [CrossRef] [Green Version]
- Kistler, K.D.; Brunt, E.M.; Clark, J.M.; Diehl, A.M.; Sallis, J.F.; Schwimmer, J.B. Physical activity recommendations, exercise intensity, and histological severity of nonalcoholic fatty liver disease. Am. J. Gastroenterol. 2011, 106, 460–468. [Google Scholar] [CrossRef] [PubMed] [Green Version]
- Bernsmeier, C.; Weisskopf, D.M.; Pflueger, M.O.; Mosimann, J.; Campana, B.; Terracciano, L.; Beglinger, C.; Heim, M.H.; Cajochen, C. Sleep disruption and daytime sleepiness correlating with disease severity and insulin resistance in non-alcoholic fatty liver disease: A comparison with healthy controls. PLoS ONE 2015, 10, e0143293. [Google Scholar] [CrossRef] [PubMed] [Green Version]
- Zein, C.O.; Unalp, A.; Colvin, R.; Liu, Y.C.; McCullough, A.J. Nonalcoholic Steatohepatitis Clinical Reseach Network. Smoking and Severity of Hepatic Fibrosis in Nonalcoholic Fatty Liver Disease. J. Hepatol. 2011, 54, 753–759. [Google Scholar] [CrossRef] [PubMed] [Green Version]
- Danford, C.J.; Yao, Z.; Jiang, Z.G. Non-alcoholic fatty liver disease: A narrative review of genetics. J. Biomed. Res. 2018, 32, 389–400. [Google Scholar] [CrossRef] [PubMed]
- Torkamani, A.; Wineinger, N.E.; Topol, E.J. The personal and clinical utility of polygenic risk scores. Nat. Rev. Gene. 2018, 19, 581–590. [Google Scholar] [CrossRef]
- Gellert-Kristensen, H.; Richardson, T.G.; Smith, G.D.; Nordestgaard, B.G.; Tybjærg-Hansen, A.; Stender, S. Combined effect of PNPLA3, TM6SF2, and HSD17B13 variants on risk of cirrhosis and hepatocellular carcinoma in the general population. Hepatology 2020. [Google Scholar] [CrossRef]
- Santos-Lozano, A.; Santin-Medeiros, F.; Cardon, G.; Torres-Luque, G.; Bailon, R.; Bergmeir, C.; Ruiz, J.R.; Lucía Mulas, A.; Garatachea, N. Actigraph GT3X: Validation and determination of physical activity intensity cut points. Int. J. Sports Med. 2013, 34, 975–982. [Google Scholar] [CrossRef]
- Kriska, A.M.; Knowler, W.C.; LaPorte, R.E.; Drash, A.L.; Wing, R.R.; Blair, S.N.; Bennett, P.H.; Kuller, L.H. Development of questionnaire to examine relationship of physical activity and diabetes in Pima Indians. Diabetes Care 1990, 13, 401–411. [Google Scholar] [CrossRef]
- Bauer, P.W.; Pivarnik, J.M.; Feltz, D.L.; Paneth, N.; Womack, C.J. Validation of an historical physical activity recall tool in postpartum women. J. Phys. Act. Health 2010, 7, 658–661. [Google Scholar] [CrossRef]
- Momenan, A.A.; Delshad, M.; Sarbazi, N.; Rezaei Ghaleh, N.; Ghanbarian, A.; Azizi, F. Reliability and validity of the Modifiable Activity Questionnaire (MAQ) in an Iranian urban adult population. Arch. Iran. Med. 2012, 15, 279–282. [Google Scholar]
- Peltonen, M.; Harald, K.; Männistö, S.; Saarikoski, L.; Peltomäki, P.; Lund, L.; Sundvall, J.; Juolevi, A.; Laatikainen, T.; Aldén-Nieminen, H. Kansallinen FINRISKI 2007-Terveystutkimus: Tutkimuksen Toteutus ja Tulokset. In Kansanterveyslaitoksen julkaisuja B 34/2008; KTL-National Public Health Institute: Helsinki, Finland, 2008. [Google Scholar]
- Fineli National Food Composition Database in Finland. National Institute for Health and Welfare. Available online: https://fineli.fi/ (accessed on 31 January 2018).
- Fisk, J.D.; Ritvo, P.G.; Ross, L.; Haase, D.A.; Marrie, T.J.; Schlech, W.F. Measuring the functional impact of fatigue: Initial validation of the fatigue impact scale. Clin. Infect. Dis. 1994, 18, S79–S83. [Google Scholar] [CrossRef] [PubMed]
- Dunai, A.; Novak, M.; Chung, S.A.; Kayumov, L.; Keszei, A.; Levitan, R.; Shapiro, C.M. Moderate exercise and bright light treatment in overweight and obese individuals. Obesity 2007, 15, 1749–1757. [Google Scholar] [CrossRef] [PubMed]
- Newton, J.L.; Pairman, J.; Wilton, K.; Jones, D.E.; Day, C. Fatigue and autonomic dysfunction in non-alcoholic fatty liver disease. Clin. Auton. Res. 2009, 19, 319–326. [Google Scholar] [CrossRef] [PubMed]
- Netzer, N.C.; Stoohs, R.A.; Netzer, C.M.; Clark, K.; Strohl, K.P. Using the Berlin Questionnaire To Identify Patients at Risk for the Sleep Apnea Syndrome. Ann. Int. Med. 2019, 131, 485–491. [Google Scholar] [CrossRef]
- Lallukka, S.; Sadevirta, S.; Kallio, M.T.; Luukkonen, P.K.; Zhou, Y.; Hakkarainen, A.; Lundbom, N.; Orho-Melander, M.; Yki-Jarvinen, H. Predictors of Liver Fat and Stiffness in Non-Alcoholic Fatty Liver Disease (NAFLD)—An 11-Year Prospective Study. Sci. Rep. 2017, 7, 14561. [Google Scholar] [CrossRef] [Green Version]
- Matthews, D.; Hosker, J.; Rudenski, A.; Naylor, B.; Treacher, D.; Turner, R. Homeostasis model assessment: Insulin resistance and β-cell function from fasting plasma glucose and insulin concentrations in man. Diabetologia 1985, 28, 412–419. [Google Scholar] [CrossRef] [Green Version]
- Lallukka, S.; Sevastianova, K.; Perttila, J.; Hakkarainen, A.; Orho-Melander, M.; Lundbom, N.; Olkkonen, V.M.; Yki-Jarvinen, H. Adipose tissue is inflamed in NAFLD due to obesity but not in NAFLD due to genetic variation in PNPLA3|SpringerLink. Diabetologia 2013, 56, 886–892. [Google Scholar] [CrossRef] [Green Version]
- Luukkonen, P.K.; Zhou, Y.; Sadevirta, S.; Leivonen, M.; Arola, J.; Oresic, M.; Hyotylainen, T.; Yki-Jarvinen, H. Hepatic ceramides dissociate steatosis and insulin resistance in patients with non-alcoholic fatty liver disease. J. Hepatol. 2016, 64, 1167–1175. [Google Scholar] [CrossRef] [Green Version]
- Luukkonen, P.K.; Zhou, Y.; Nidhina Haridas, P.A.; Dwivedi, O.P.; Hyotylainen, T.; Ali, A.; Juuti, A.; Leivonen, M.; Tukiainen, T.; Ahonen, L.; et al. Impaired hepatic lipid synthesis from polyunsaturated fatty acids in TM6SF2 E167K variant carriers with NAFLD. J. Hepatol. 2017, 67, 128–136. [Google Scholar] [CrossRef] [Green Version]
- Luukkonen, P.K.; Zhou, Y.; Hyotylainen, T.; Leivonen, M.; Arola, J.; Orho-Melander, M.; Oresic, M.; Yki-Jarvinen, H. The MBOAT7 variant rs641738 alters hepatic phosphatidylinositols and increases severity of non-alcoholic fatty liver disease in humans. J. Hepatol. 2016, 65, 1263–1265. [Google Scholar] [CrossRef] [Green Version]
- Hanley, J.A.; McNeil, B.J. The meaning and use of the area under a receiver operating characteristic (ROC) curve. Radiology 1982, 143, 29–36. [Google Scholar] [CrossRef] [PubMed] [Green Version]
- DeLong, E.R.; DeLong, D.M.; Clarke-Pearson, D.L. Comparing the areas under two or more correlated receiver operating characteristic curves: A nonparametric approach. Biometrics 1988, 44, 837–845. [Google Scholar] [CrossRef]
- Vilar-Gomez, E.; Martinez-Perez, Y.; Calzadilla-Bertot, L.; Torres-Gonzalez, A.; Gra-Oramas, B.; Gonzalez-Fabian, L.; Friedman, S.L.; Diago, M.; Romero-Gomez, M. Weight loss through lifestyle modification significantly reduces features of nonalcoholic steatohepatitis. Gastroenterology 2015, 149, 367–378.e365. [Google Scholar] [CrossRef] [PubMed]
- Freedman, N.D.; Cross, A.J.; McGlynn, K.A.; Abnet, C.C.; Park, Y.; Hollenbeck, A.R.; Schatzkin, A.; Everhart, J.E.; Sinha, R. Association of meat and fat intake with liver disease and hepatocellular carcinoma in the NIH-AARP cohort. J. Nat. Cancer Inst. 2010, 102, 1354–1365. [Google Scholar] [CrossRef] [PubMed] [Green Version]
- Bouvard, V.; Loomis, D.; Guyton, K.Z.; Grosse, Y.; Ghissassi, F.E.; Benbrahim-Tallaa, L.; Guha, N.; Mattock, H.; Straif, K.; Corpet, D. Carcinogenicity of consumption of red and processed meat. Lancet Oncol. 2015, 16, 1599–1600. [Google Scholar] [CrossRef] [Green Version]
- Åberg, F.; Helenius-Hietala, J.; Puukka, P.; Färkkilä, M.; Jula, A. Interaction between alcohol consumption and metabolic syndrome in predicting severe liver disease in the general population. Hepatology 2018, 67, 2141–2149. [Google Scholar] [CrossRef] [Green Version]
- Guha, I.; Parkes, J.; Roderick, P.; Harris, S.; Rosenberg, W. Non-invasive markers associated with liver fibrosis in non-alcoholic fatty liver disease. Gut 2006, 55, 1650–1660. [Google Scholar] [CrossRef]
- Koo, B.K.; Joo, S.K.; Kim, D.; Lee, S.; Bae, J.M.; Park, J.H.; Kim, J.H.; Chang, M.S.; Kim, W. Development and Validation of a Scoring System, Based on Genetic and Clinical Factors, to Determine Risk of Steatohepatitis in Asian Patients with Nonalcoholic Fatty Liver Disease. Clin. Gastroenterol. Hepatol. 2020, 118, 2592–2599. [Google Scholar] [CrossRef]
- Uslusoy, H.S.; Nak, S.G.; Gülten, M. Noninvasive predictors for liver fibrosis in patients with nonalcoholic steatohepatitis. World J. Hepatol. 2011, 3, 219–227. [Google Scholar] [CrossRef]
- Amarapurkar, D.; Amarapurkar, A.; Patel, N.D.; Agal, S.; Baigal, R.; Gupte, P.; Pramanik, S. Nonalcoholic steatohepatitis (NASH) with diabetes: Predictors of liver fibrosis. Ann. Hepatol. 2006, 5, 30–33. [Google Scholar] [CrossRef]
- Savvidou, S.; Hytiroglou, P.; Orfanou-Koumerkeridou, H.; Panderis, A.; Frantzoulis, P.; Goulis, J. Low Serum Adiponectin Levels Are Predictive of Advanced Hepatic Fibrosis in Patients With NAFLD. J. Clin. Gastroenterol. 2009, 43, 765–772. [Google Scholar] [CrossRef] [PubMed]
- Thompson, P.D.; Buchner, D.; Piña, I.L.; Balady, G.J.; Williams, M.A.; Marcus, B.H.; Berra, K.; Blair, S.N.; Costa, F.; Franklin, B. Exercise and physical activity in the prevention and treatment of atherosclerotic cardiovascular disease: A statement from the Council on Clinical Cardiology (Subcommittee on Exercise, Rehabilitation, and Prevention) and the Council on Nutrition, Physical Activity, and Metabolism (Subcommittee on Physical Activity). Circulation 2003, 107, 3109–3116. [Google Scholar] [PubMed] [Green Version]
- Ambrose, J.A.; Barua, R.S. The pathophysiology of cigarette smoking and cardiovascular disease: An update. J. Am. Coll. Cardiol. 2004, 43, 1731–1737. [Google Scholar] [CrossRef] [PubMed] [Green Version]
- Pan, A.; Sun, Q.; Bernstein, A.M.; Schulze, M.B.; Manson, J.E.; Stampfer, M.J.; Willett, W.C.; Hu, F.B. Red meat consumption and mortality: Results from 2 prospective cohort studies. Arch. Int. Med. 2012, 172, 555–563. [Google Scholar]


| NAFLD-Fibrosis | OR (95% CI) | ||
|---|---|---|---|
| No (FIB−, n = 48) | Yes (FIB+, n = 46) | ||
| Physical activity | |||
| Accelerometer | |||
| Use (h/day) | 12.4 (11.3–13.9) | 11.7 (10.6–13.4) | 0.94 (0.74–1.19) |
| Steps (per day) | 4981 (3775–6503) | 4872 (4062–6628) | 0.84 (1.00–1.01) |
| PA EE (MET-h/week) | 30 (21–43) | 30 (19–42) | 1.00 (0.98–1.02) |
| MVPA (h/week) | 2.1 (0.9–3.7) | 2.0 (0.8–3.7) | 1.00 (0.88–1.19) |
| Light PA (%) | 32 (27–37) | 31 (25–34) | 0.94 (0.89–0.99) * |
| Sedentary (%) | 65 (57–70) | 68 (62–73) | 1.06 (1.01–1.11) * |
| Sitting (h/day) | 6.6 ± 0.2 | 6.6 ± 0.2 | 1.01 (0.77–1.33) |
| Modifiable Activity Questionnaire | |||
| PA EE (MET-h/week) | 36 (17–128) | 27 (9–77) | 0.97 (0.93–1.00) |
| Occupational PA (MET-h/week) | 3 (0–87) | 0 (0–12) * | 0.99 (0.98–1.00) |
| Leisure time PA (MET-h/week) | 20 (12–65) | 18 (9–32) | 1.00 (0.98–1.03) |
| MVPA (h/week) | 8.1 (4.4–31.4) | 5.7 (2.0–16.5) * | 0.97 (0.93–0.99) * |
| Screen time (h/day) | 3 (2–4) | 4 (3–6) | 1.16 (0.98–1.37) |
| Diet | |||
| Carbohydrates E% | 43 ± 1 | 39 ± 1 * | 0.91 (0.85–0.98) * |
| Proteins E% | 19 (18–21) | 20 (19–23) | 1.12 (0.99–1.27) |
| Fats E% | 33 (28–38) | 36 (33–40) * | 1.09 (1.01–1.17) * |
| MUFA E% | 10.7 ± 0.5 | 11.5 ± 0.4 | 1.10 (0.96–1.27) |
| PUFA E% | 5.5 ± 0.2 | 5.6 ± 0.2 | 1.03 (0.79–1.34) |
| SFA E% | 10.3 ± 0.3 | 11.3 ± 0.4 * | 1.16 (0.98–1.37) |
| Fiber (g/day) | 21 (16–31) | 19 (14–29) | 0.98 (0.94–1.02) |
| Salt (g/day) | 6.0 ± 0.3 | 5.7 ± 0.3 | 1.01 (0.85–1.19) |
| Coffee (cups/day) | 3 (1–5) | 3 (1–5) | 1.00 (0.98–1.02) |
| Fruits & Vegetables # | 4.6 ± 0.2 | 4.3 ± 0.2 | 0.93 (0.78–1.12) |
| Red meat # | 1 (1–3) | 3 (1–3) * | 1.76 (1.18–2.64) ** |
| Sleep, stress and socioeconomic factors | |||
| Sleep length (h) | 7.5 (6.7–8.0) | 8.0 (6.8–8.5) | 1.13 (0.80–1.60) |
| Sleep apnea (yes) | 13 (28%) | 18 (40%) | 1.74 (0.73–4.18) |
| Fatigue & | 19 (9–31) | 27 (14–42) | 1.01 (0.99–1.03) |
| Alcohol (portions/week) ## | 0.6 ± 0.4 | 1.5 ± 0.4 ** | 1.16 (0.95–1.41) |
| Smoking (never/current/former) | 24/4/19 | 11/4/31 ** | 3.71 (1.49–9.23) ** |
| Duration of overweight (years) | 24 (19–37) | 29 (20–42) | 1.03 (0.99–1.07) |
| Unemployed (yes) | 3 (7%) | 10 (23%) * | 4.22 (1.08–16.53) * |
| NAFLD-Fibrosis | OR (95% CI) | ||
|---|---|---|---|
| No (FIB−, n = 48) | Yes (FIB+, n = 46) | ||
| Physical characteristics | |||
| Age (years) | 49 (42–56) | 53 (44–57) | 1.03 (0.98–1.08) |
| Sex (female) | 42 (88%) | 32 (70%) * | 0.29 (0.10–0.91) * |
| Weight (kg) | 109 ± 3 | 116 ± 3 | 1.03 (0.98–1.08) |
| BMI (kg/m2) | 39.1 ± 0.8 | 40.3 ± 0.7 | 1.04 (0.96–1.13) |
| Waist-to-hip ratio | 0.91 ± 0.02 | 0.97 ± 0.02 * | 1.06 (1.01–1.11) ** |
| Systolic blood pressure (mmHg) | 124 ± 2 | 125 ± 1.9 | 1.01 (0.98–1.04) |
| Diastolic blood pressure (mmHg) | 79 (72–85) | 77 (74–85) | 1.00 (0.95–1.04) |
| Biochemical characteristics | |||
| fP-glucose (mol/L) | 5.7 ± 0.1 | 5.9 ± 0.1 | 1.41 (0.81–2.47) |
| HbA1c (mmol/mol) | 35 (33–37) | 38 (34–45) ** | 1.14 (1.04–1.24) ** |
| fS-insulin (mU/L) | 8.7 (6.2–10.8) | 12.7 (7.6–17.9) *** | 1.12 (1.04–1.21) ** |
| HOMA-IR | 2.2 (1.6–2.9) | 4.2 (2.2–4.9) *** | 1.56 (1.18–2.07) ** |
| S-ALT (U/L) | 24 (18–41) | 30 (22–39) | 1.01 (0.99–1.03) |
| S-AST (U/L) | 25 (22–31) | 27 (23–33) | 1.03 (0.99–1.08) |
| AST/ALT-ratio | 1.06 (0.72–1.29) | 0.96 (0.81–1.13) | 0.75 (0.34–1.64) |
| P-GGT (U/L) | 21 (15–34) | 28 (20–51) * | 1.01 (1.00–1.03) |
| P-Albumin (g/L) | 38.0 ± 0.3 | 38.9 ± 0.4 | 1.18 (0.99–1.40) |
| Platelet count (×109/L) | 259 (217–288) | 260 (231–288) | 1.00 (0.99–1.01) |
| fP-Triglycerides (mmol/L) | 0.93 (0.80–1.20) | 1.12 (0.87–1.42) * | 4.62 (1.43–14.94) * |
| fP-HDL cholesterol (mmol/L) | 1.21 (1.05–1.46) | 1.13 (0.96–1.36) | 0.27 (0.06–1.22) |
| fP-LDL cholesterol (mmol/L) | 2.4 (2.1–3.1) | 2.2 (1.9–2.9) | 0.87 (0.57–1.31) |
| Lipid medication (yes) | 11 (23%) | 14 (30%) | 1.47 (0.59–3.70) |
| Metabolic syndrome (yes) | 23 (48%) | 33 (72%) * | 2.46 (1.04–5.80) * |
| Type 2 diabetes (yes) | 12 (25%) | 22 (48%) * | 2.86 (1.17–7.00) * |
| Glucose-lowering medication (yes) | 11 (23%) | 20 (43%) * | 2.59 (1.06–6.30) * |
| Liver histology | |||
| Macrovesicular steatosis (%) | 0 (0–5) | 10 (0–20) *** | |
| Ballooning (0/1/2) | 48/0/0 | 39/4/3 ** | |
| Inflammation (0/1/2) | 47/1/0 | 38/8/0 * | |
| Grade of activity (0/1/2/3) | 47/1/0/0 | 38/1/4/3 * | |
| Stage of fibrosis (0/1/2/3/4) | 48/0/0/0/0 | 0/39/6/1/0 *** | |
| Genetic characteristics | |||
| PNPLA3 (CC/CG/GG) | 35/12/0 | 25/16/3 * | 2.22 (0.91–5.34) |
| TM6SF2 (CC/CT/TT) | 40/7/0 | 37/7/0 | 0.93 (0.32–2.70) |
| MBOAT7 (CC/CT/TT) | 21/18/7 | 13/19/12 | 2.00 (0.85–4.57) |
| HSD17B13 (--/-A/AA) | 32/14/1 | 31/10/3 | 0.75 (0.36–2.11) |
| Genetic risk score (0/1/2/3/4/5/6/7/8) | 0/4/17/14/11/0/0/0/0 | 0/3/8/11/15/6/1/0/0 ** | 1.79 (1.18–2.70) ** |
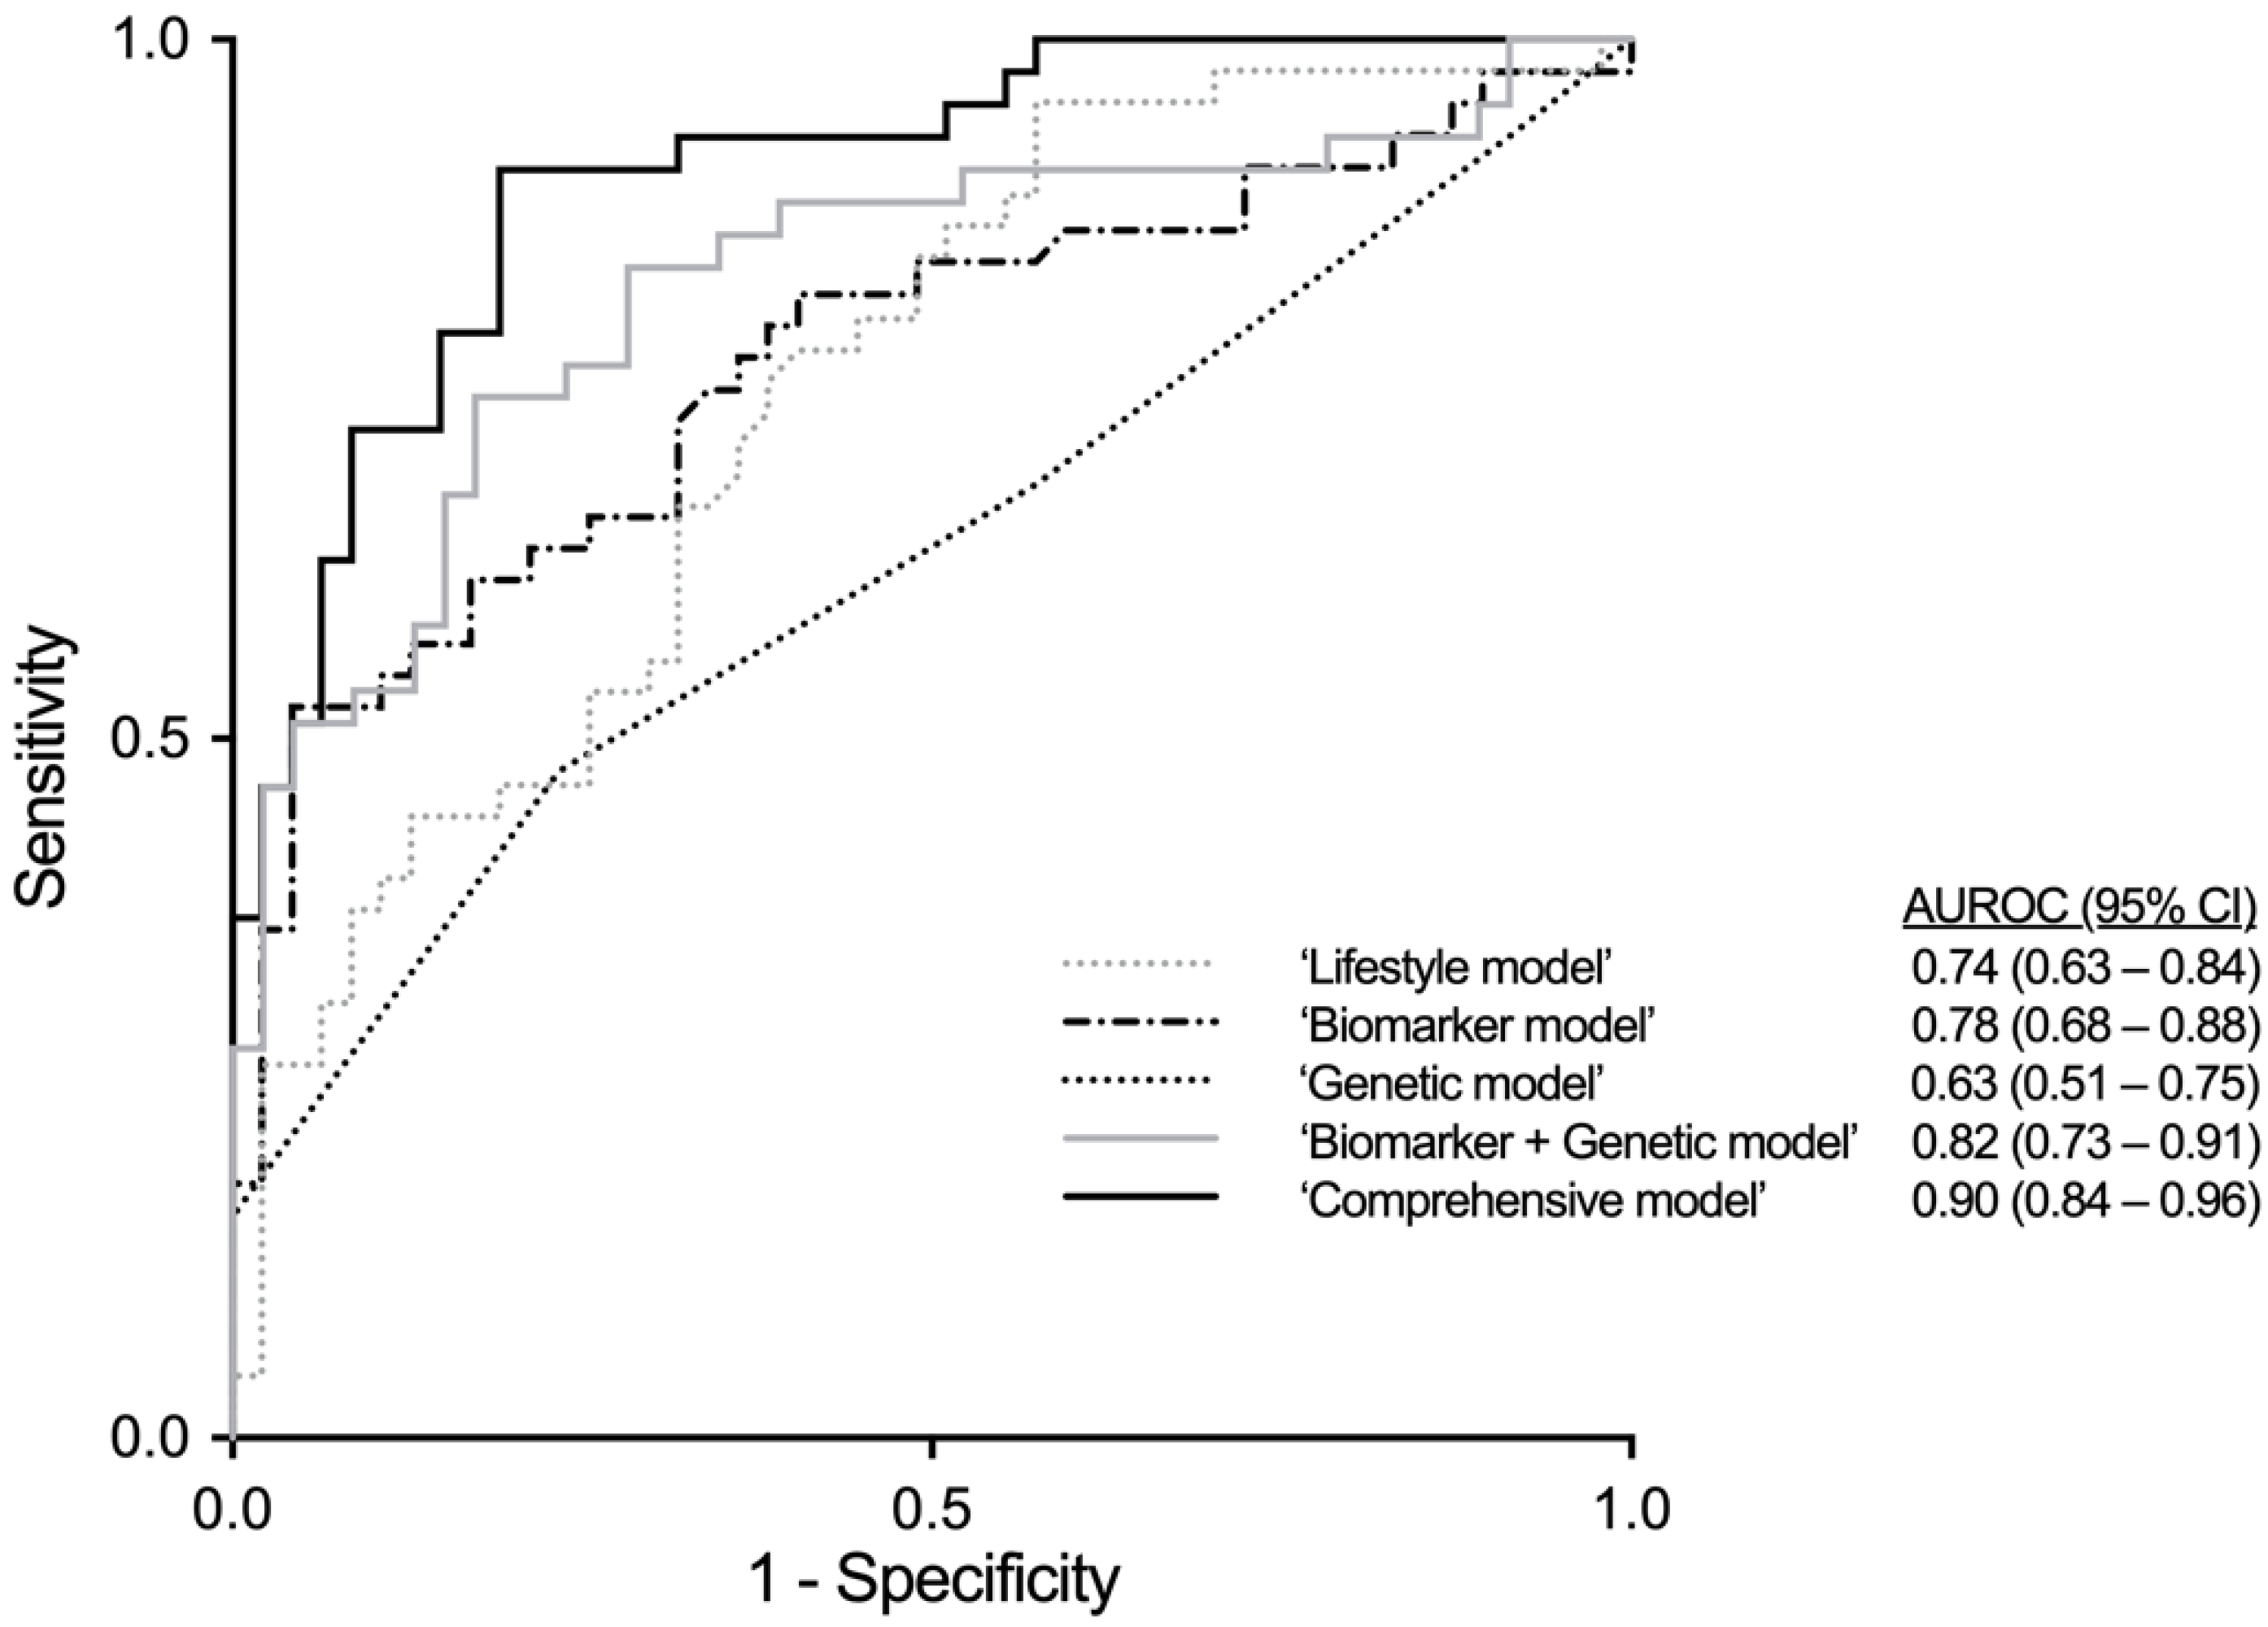
| Model | AUROC (95% CI) | B | S.E. | OR (95% CI) | p-Value |
|---|---|---|---|---|---|
| ‘Lifestyle model’ | 0.743 (0.643–0.843), p < 0.001 | ||||
| Red meat intake # | 0.536 | 0.237 | 1.97 (1.18–3.28) | 0.024 | |
| Carbohydrate E% | −0.098 | 0.042 | 0.91 (0.84–0.99) | 0.020 | |
| Unemployment (no = 0/yes = 1) | 2.033 | 0.826 | 7.63 (1.51–38.52) | 0.014 | |
| Constant | 1.950 | 2.015 | 0.008 | 0.994 | |
| ‘Biomarker model’ | 0.776 (0.677–0.875), p < 0.001 | ||||
| HbA1c (mmol/mol) | 0.102 | 0.048 | 1.11 (1.01–1.22) | 0.032 | |
| Insulin (mU/L) | 0.096 | 0.039 | 1.10 (1.02–1.19) | 0.014 | |
| Triglycerides (mmol/L) | 0.815 | 0.582 | 2.26 (0.72–7.07) | 0.161 | |
| Constant | −5.931 | 1.777 | 0.003 | 0.001 | |
| ‘Genetic model’ | 0.629 (0.513–0.745), p = 0.035 | ||||
| Genetic risk score | 0.465 | 0.203 | 1.59 (1.07–2.40) | 0.022 | |
| Constant | −0.458 | 0.645 | 0.233 | 0.024 | |
| ‘Biomarker + Genetic model’ | 0.824 (0.733–0.914), p < 0.001 | ||||
| HbA1c (mmol/mol) | 0.126 | 0.051 | 1.13 (1.03–1.25) | 0.014 | |
| Insulin (mU/L) | 0.092 | 0.043 | 1.10 (1.01–1.19) | 0.032 | |
| Triglycerides (mmol/L) | 0.987 | 0.628 | 2.68 (0.78–9.19) | 0.116 | |
| Genetic risk score | 0.509 | 0.254 | 1.66 (1.01–2.74) | 0.046 | |
| Constant | −8.424 | 2.273 | 0.000 | 0.000 | |
| ‘Comprehensive model’ | 0.903 (0.841–0.964), p < 0.001 | ||||
| MVPA (h/week) | −0.060 | 0.027 | 0.94 (0.89–0.99) | 0.024 | |
| Red meat intake # | 0.581 | 0.303 | 1.79 (0.99–3.24) | 0.055 | |
| Carbohydrate E% | −0.131 | 0.059 | 0.88 (0.78–0.99) | 0.027 | |
| Smoking (never = 0/current or former = 1) | 1.310 | 0.663 | 3.71 (1.01–13.60) | 0.048 | |
| HbA1c (mmol/mol) | 0.186 | 0.067 | 1.21 (1.06–1.39) | 0.006 | |
| Triglycerides (mmol/L) | 2.504 | 0.981 | 12.23 (1.79–83.63) | 0.011 | |
| Genetic risk score | 0.936 | 0.333 | 2.55 (1.33–4.90) | 0.005 | |
| Constant | −9.098 | 4.035 | 0.000 | 0.024 | |
Publisher’s Note: MDPI stays neutral with regard to jurisdictional claims in published maps and institutional affiliations. |
© 2021 by the authors. Licensee MDPI, Basel, Switzerland. This article is an open access article distributed under the terms and conditions of the Creative Commons Attribution (CC BY) license (http://creativecommons.org/licenses/by/4.0/).
Share and Cite
Lahelma, M.; Luukkonen, P.K.; Qadri, S.; Ahlholm, N.; Lallukka-Brück, S.; Porthan, K.; Juuti, A.; Sammalkorpi, H.; Penttilä, A.K.; Arola, J.; et al. Assessment of Lifestyle Factors Helps to Identify Liver Fibrosis Due to Non-Alcoholic Fatty Liver Disease in Obesity. Nutrients 2021, 13, 169. https://doi.org/10.3390/nu13010169
Lahelma M, Luukkonen PK, Qadri S, Ahlholm N, Lallukka-Brück S, Porthan K, Juuti A, Sammalkorpi H, Penttilä AK, Arola J, et al. Assessment of Lifestyle Factors Helps to Identify Liver Fibrosis Due to Non-Alcoholic Fatty Liver Disease in Obesity. Nutrients. 2021; 13(1):169. https://doi.org/10.3390/nu13010169
Chicago/Turabian StyleLahelma, Mari, Panu K. Luukkonen, Sami Qadri, Noora Ahlholm, Susanna Lallukka-Brück, Kimmo Porthan, Anne Juuti, Henna Sammalkorpi, Anne K. Penttilä, Johanna Arola, and et al. 2021. "Assessment of Lifestyle Factors Helps to Identify Liver Fibrosis Due to Non-Alcoholic Fatty Liver Disease in Obesity" Nutrients 13, no. 1: 169. https://doi.org/10.3390/nu13010169