Climate Change Impacts on Atlantic Oceanic Island Tuna Fisheries
 Bryony L. Townhill
 Elena Couce
 James Bell
 Stuart Reeves1
 - 1Centre for Environment, Fisheries and Aquaculture Science (Cefas), Lowestoft, United Kingdom
- 2Royal Society for the Protection of Birds (RSPB), The Lodge, Sandy, United Kingdom
Climate change is already affecting the distributions of marine fish, and future change is expected to have a particularly large impact on small islands that are reliant on the sea for much of their income. This study aims to develop an understanding of how climate change may affect the distribution of commercially important tuna in the waters around the United Kingdom’s Overseas Territories in the South Atlantic. The future suitable habitat of southern bluefin, albacore, bigeye, yellowfin and skipjack tunas were modelled under two future climate change scenarios. Of all the tunas, the waters of Tristan da Cunha are the most suitable for southern bluefin, and overall, the environmental conditions will remain so in the future. Tristan da Cunha is not projected to become more suitable for any of the other tuna species in the future. For the other tuna species, Ascension Island and Saint Helena will become more suitable in the future, particularly so for skipjack tuna around Ascension Island, as the temperature and salinity conditions change in these areas. Large marine protected areas have been designated around the territories, with those in Ascension and Tristan da Cunha closed to tuna fishing. Although these areas are small relative to the whole Atlantic, these model projections could be useful in understanding whether this protection will benefit tuna populations into the future, particularly where there is high site fidelity.
Introduction
For island countries and territories, fisheries are important for livelihoods, food, and government income (FAO, 1999). Globally, modelling suggests that fisheries catches will be redistributed this century with climate change, with decreases in the tropics, and increases in abundance in temperate areas (Cheung et al., 2010). Despite these increases, this might not result in an increase in revenue, if low value fish dominate. There is projected to be a global reduction in fisheries revenue with 89% of countries seeing a decline in their maximum revenue potential by 2050 under the high emissions scenario (RCP8.5) (Lam et al., 2016). Species distribution models project that marine species globally will shift polewards by an average of 72 km per decade (Poloczanska et al., 2013). Focusing on tuna distributions, 20 out of 22 stocks have shifted poleward between the 1950s and 2000s and temperate tunas are projected to shift further poleward in the future (Erauskin-Extramiana et al., 2019).
Tuna are highly valuable fish species and widely fished in the South Atlantic within and adjacent to the United Kingdom’s Overseas Territories (UKOTs) of Tristan da Cunha, Saint Helena and Ascension Island (RSPB, 2017). Much of the islands’ income comes from the sale of tuna and fishing licences, along with Tristan rock lobster (Jasus tristani) fishing in Tristan da Cunha (Glass et al., 2000). Tuna species caught in waters adjacent to the islands are bigeye tuna (Thunnus obesus), albacore (T. alalunga), yellowfin tuna (T. albacares), skipjack tuna (Katsuwonus pelamis) and southern bluefin tuna (T. maccoyii) (Yates et al., 2019). Climate change is expected to have a large impact on small islands (Nurse et al., 2014), but little is known about how the UKOTs would be impacted under different climate scenarios. This study aims to identify how the important tuna populations may be affected by climate change, to help inform long-term marine management around the islands of the UKOTs.
Tristan da Cunha, St Helena, and Ascension Island share tuna quota with other UKOTs, namely bigeye tuna (1,575 t) and albacore (300 t). There is no quota allocated to the UKOTs for yellowfin tuna or southern bluefin, and there is no limit set for skipjack (CCSBT, 2019a; ICCAT, 2019a). The UKOTs have historically sold licences under Access Agreements with other countries to permit foreign flagged vessels to fish in their waters. Under such agreements, any tuna catches are counted against the national quotas of the licensed vessels. Tuna populations declined by at least 60% on average between 1954 and 2006 because of fishing (Juan-Jordá et al., 2011). Southern bluefin tuna, which has been targeted in Tristan da Cunha, is considered overexploited (CCSBT, 2018) and classified as Critically Endangered (IUCN Redlist, Collette et al., 2011).
In the south Atlantic region around Tristan da Cunha, Saint Helena, and Ascension Islands (Figure 1), there is projected to be an overall increase in fisheries catch potential (Cheung et al., 2010). However, more recent modelling has suggested that there could be a reduction in catch potential in the Saint Helena and Ascension Island Exclusive Economic Zones (EEZ) and a slight increase in the Tristan da Cunha EEZ by the end of century under the high emissions scenario (RCP8.5) (FAO, 2018). However, both of these studies model a large number of species at the global scale; more specific models focusing on certain species and/or smaller regions often provide detailed results of more relevance to local and regional marine management. For example, detailed modelling of tuna in the Pacific has found that skipjack are expected to increase in biomass in the eastern Pacific, with some countries and territories seeing an increase in tuna in their EEZs, and therefore a potential increase in licence income from foreign vessels and local economic opportunities (Bell et al., 2013).
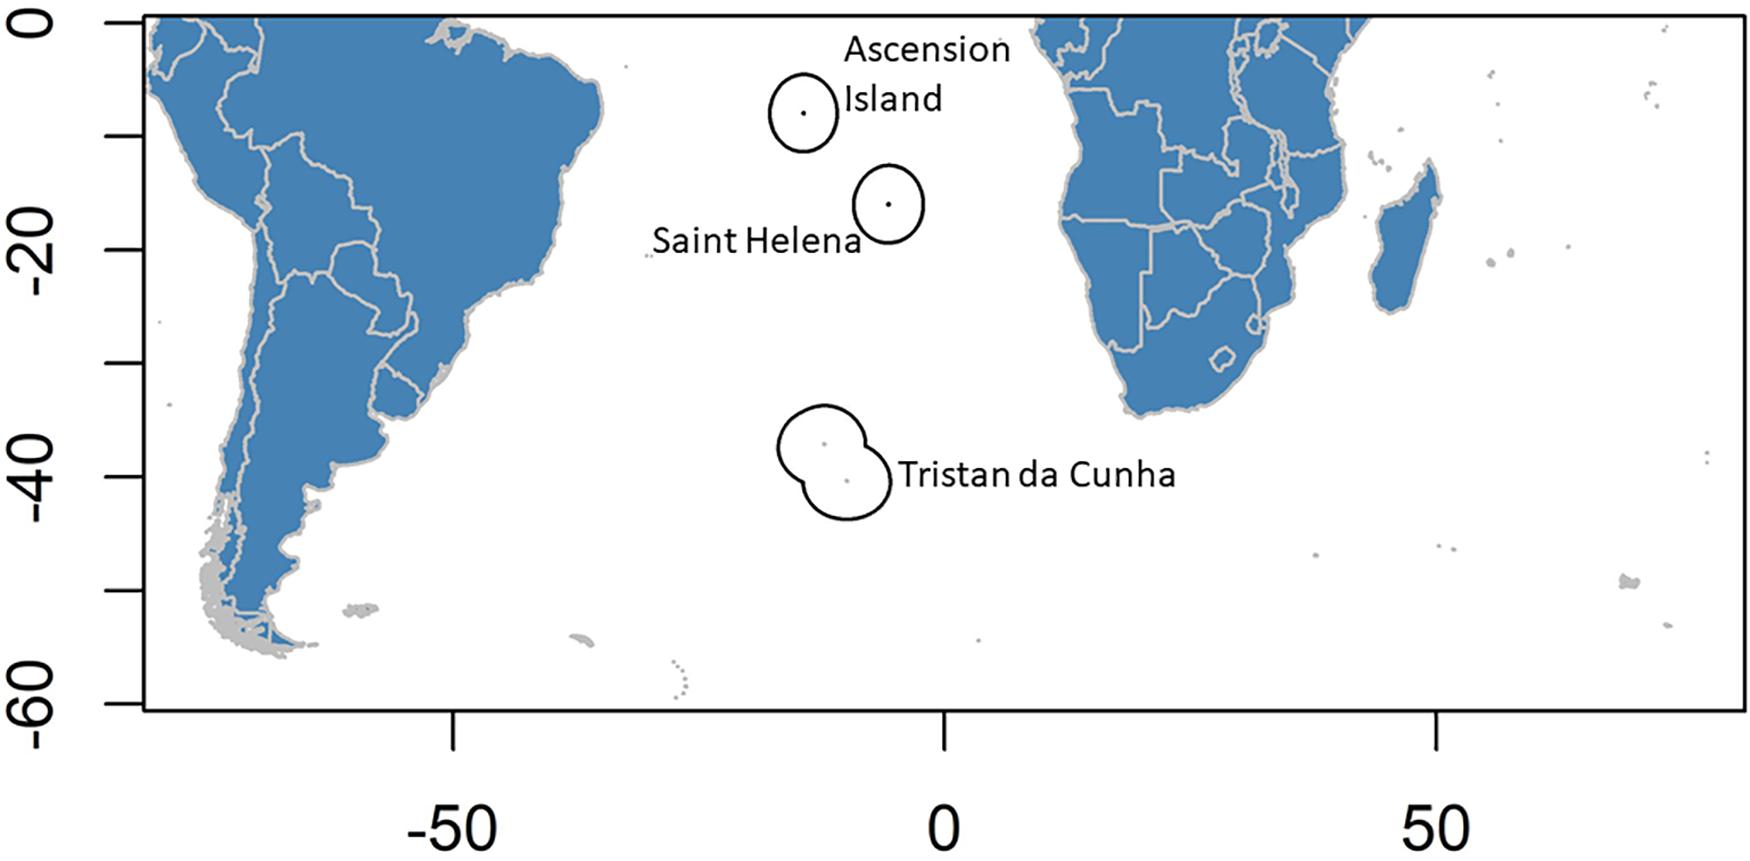
Figure 1. Location map of the EEZs of the UK Overseas Territories in the South Atlantic.
While variations in habitat suitability driven by climate change and the subsequent changes in distribution of marine species are important in fisheries management, they are also vital in planning marine protection strategies. Changing environmental conditions can cause species to shift away from areas that were originally designed to protect them, such as the Plaice Box in the North Sea (Van Keeken et al., 2007). Conversely, an endangered or threatened species may move into an area that was originally protected for another purpose. When designing management measures for a protected area, managers may wish to consider any commercially valuable species either currently present or which may enter that area in the future. For the UKOTs, in considering any proposed fishing restrictions or marine protection strategies, it is important to take into account the future distributions of the commercially important tunas.
To improve conservation planning, the future distributions of a species under climate change, and the biogeography of species and their environment must be considered (Hannah et al., 2002). Species distribution models are increasingly being used to understand how species might change their distributions in a changing environment (e.g., Cheung et al., 2011; Jones et al., 2012; Muhling et al., 2015; Rutterford et al., 2015), and such studies have been used to inform marine monitoring and management (e.g., Jones et al., 2013; Townhill et al., 2018). There are many different techniques which can be used to train these models, with different benefits and limitations, and one of the best ways to take account of modelling robustness and uncertainty is to use an ensemble of models (Jones et al., 2012). By using a number of models and a range of projections, different outcomes and an estimate of uncertainty can be incorporated into management decisions.
This study aims to determine how habitat suitability of tuna may change in the future in the waters of the UKOTs. An ensemble of four species distribution models, and two different climate change scenarios are used to explore the uncertainty in habitat suitability for each species.
Materials and Methods
Climate Data
To build and test the model under present day conditions, sea surface temperature and sea surface salinity were obtained from the Met Office Hadley Centre coupled Earth System Model HadGEM2-ES (Collins et al., 2008). Sea surface variables were chosen in the models because in the deep Atlantic Ocean, pelagic fish are more exposed to these than the near bed conditions. This model was used for the Coupled Model Intercomparison Project 5 (CMIP5) Fifth Assessment Report of the Intergovernmental Panel on Climate Change (IPCC) simulations. The ocean component has a 1-degree horizontal resolution (increasing to 1/3 of a degree at the equator), and 40 vertical levels. The model outputs are not a regular grid, and so were re-gridded to a regular 0.25-degree grid globally using bilinear interpolation in R statistical software Version 3.5.3 (R Core Team, 2013). 0.25 degrees was chosen as it is intermediate between the more detailed bathymetry to be captured in the species distribution models, and the lower resolution climate projections. Models were trained on the present day time period, with the variables averaged over the period between 2005 and 2018. For the future projections two time slices were chosen, averaged over 20 years to account for climate variability, and centred on 2050 and 2080. We considered two future carbon emissions scenarios, the Intergovernmental Panel on Climate Change (IPCC) Representative Concentration Pathway (RCP) 4.5 and RCP 8.5. These represent a medium emissions, high mitigation, and a high emissions, low mitigation future, respectively.
Depth data used was the General Bathymetry Chart of the Oceans (GEBCO), produced by the International Hydrographic Organisation (IHO) and the United Nations (UNESCO) Intergovernmental Oceanographic Commission (IOC). This was downloaded at 0.25-degree resolution from Nasa Earth Observations (NEO, 2019). The environmental data (sea surface temperature, sea surface salinity and depth) were then split into two datasets: one for the whole globe, and one for only the southern hemisphere, to be used in the species distribution models.
Species Data
The species modelled here were bigeye tuna, yellowfin tuna, albacore tuna, southern bluefin tuna and skipjack tuna. For all of these species, occurrence data for the training period (2005–2018) was obtained from Ocean Biogeographic Information System (OBIS) (for citations see Supplementary Material 1) and the Global Biodiversity Information Facility (GBIF) (GBIF.org, 2019a,b,c,d). For southern bluefin tuna which had less presence data on OBIS and GBIF, additional presence data for this time period was obtained from the Commission for the Conservation of Southern Bluefin Tuna (CCSBT, 2019b). The species data were cleaned for any mis-recordings of data, such as records on land, and duplicates were removed, using R statistical software (R Core Team, 2013).
Depending on their distribution, the species’ habitats were either modelled globally (i.e., albacore, bigeye, skipjack and yellowfin tuna) or only in the southern hemisphere (southern bluefin tuna). It is important that habitat suitability models are constrained to areas a species is likely to reach, so that absences reflect environmental unsuitability and not the effect of biogeographic barriers.
Species Distribution Modelling
An ensemble of species distribution models was used, comprising Maxent (version 3.4.1; Phillips et al., 2019), run directly through the Maxent user interface, Generalized Additive Models (GAM; Hastie and Tibshirani, 1990), Generalized Linear Models (GLM; McCullagh and Nelder, 1989), Random Forest (RF; Brieman, 2001) and Generalized Boosting Models (GBM) (Ridgeway, 2020), which were trained using the Biomod2 (Thuiller et al., 2016) package in R. Artificial Neural networks were also trained, but these did not perform sufficiently well (low Area Under the Curve value, see below) and so were discounted. In each case 10 replicates were performed, and 10 permutations to estimate variable importance. Pseudo-absences were generated using Biomod2, with 1000 absence records created per species, selected randomly within the background dataset. 70% of the data was used for training, and 30% for testing for model fit. All other values were set to the default in Biomod2. The Area Under the Curve (AUC) score used to discount any models with a score less than 0.8. The AUC value is bounded between 0 and 1, with 1 being the best fit. The 0.8 threshold was chosen for good model performance based on Mercks et al. (2011) who reviewed habitat suitability models, and the Biomod manual (Thuiller et al., 2009). These types of models are subject to autocorrelation, because of the bias in the presence data sampling. As such, the threshold is considered a guide to robustness rather than an absolute value, and so expert judgement is also needed. The variable importance for each model was also determined.
Maxent estimates the probability distribution of a species based on the environmental variables entered in the model, by finding the constraints that each environmental variable applies which lead to a distribution of the species which is as uniform as possible (the maximum entropy; Phillips et al., 2006). GLMs are similar to simple multiple regressions but provide error distributions which do not need to be normal (McCullagh and Nelder, 1989). GAMs build on the strengths of a GLM, but have smoothers that generalise the data into smooth curves by fitting sections of the data (Hastie and Tibshirani, 1990). They can be useful when fitting non-linear data. RF and GBMs are techniques based on classification trees, built by splitting and partitioning the data repeatedly, based on the explanatory variables, that lead to the most homogenous split (in our case, the best separation of species presences and absences). For RF trees are trained on bootstrap samples of the data, with an additional level of variation induced by selecting the environmental variable of each split within a randomly chose smaller subset of all the variables (Brieman, 2001). In the case of GBMs a succession of trees is trained on reweighted versions of the original dataset, each assigned more weight to the case misclassified by the previous trees. The final prediction is the weighted average across the trees (Ridgeway, 2020).
For each model output, the total habitat suitability for the Tristan da Cunha, Saint Helena, and Ascension Island Exclusive Economic Zones (EEZ) were determined for the present day, for 2050 and 2080, for each RCP scenario, and the percentage change calculated.
Results
For all species, the projected change is higher in 2080 compared with 2050. For the most part the changes are higher under the high emissions scenario RCP8.5 compared with the medium emissions scenario RCP4.5, but this varies across the different models (Tables 1–3). The largest projected changes are around Ascension Island, with smaller changes in the other territories.
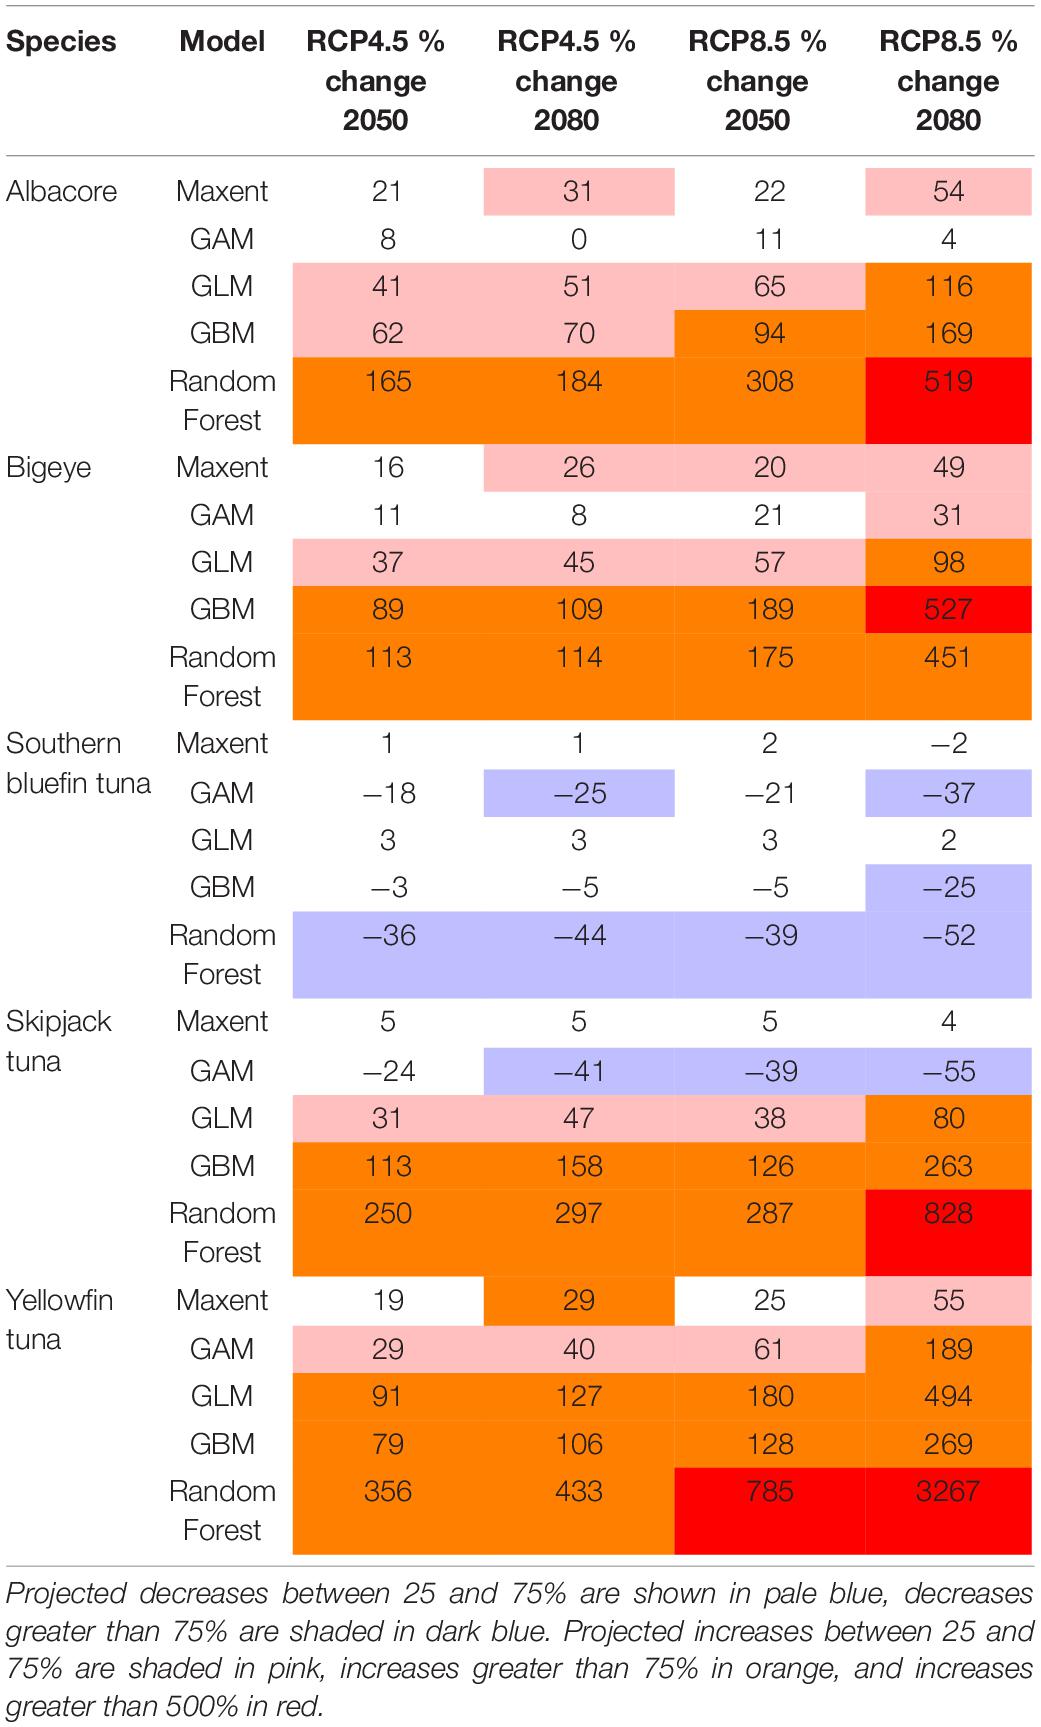
Table 1. The projected changes in habitat suitability in the Tristan da Cunha EEZ for each species, for each model.
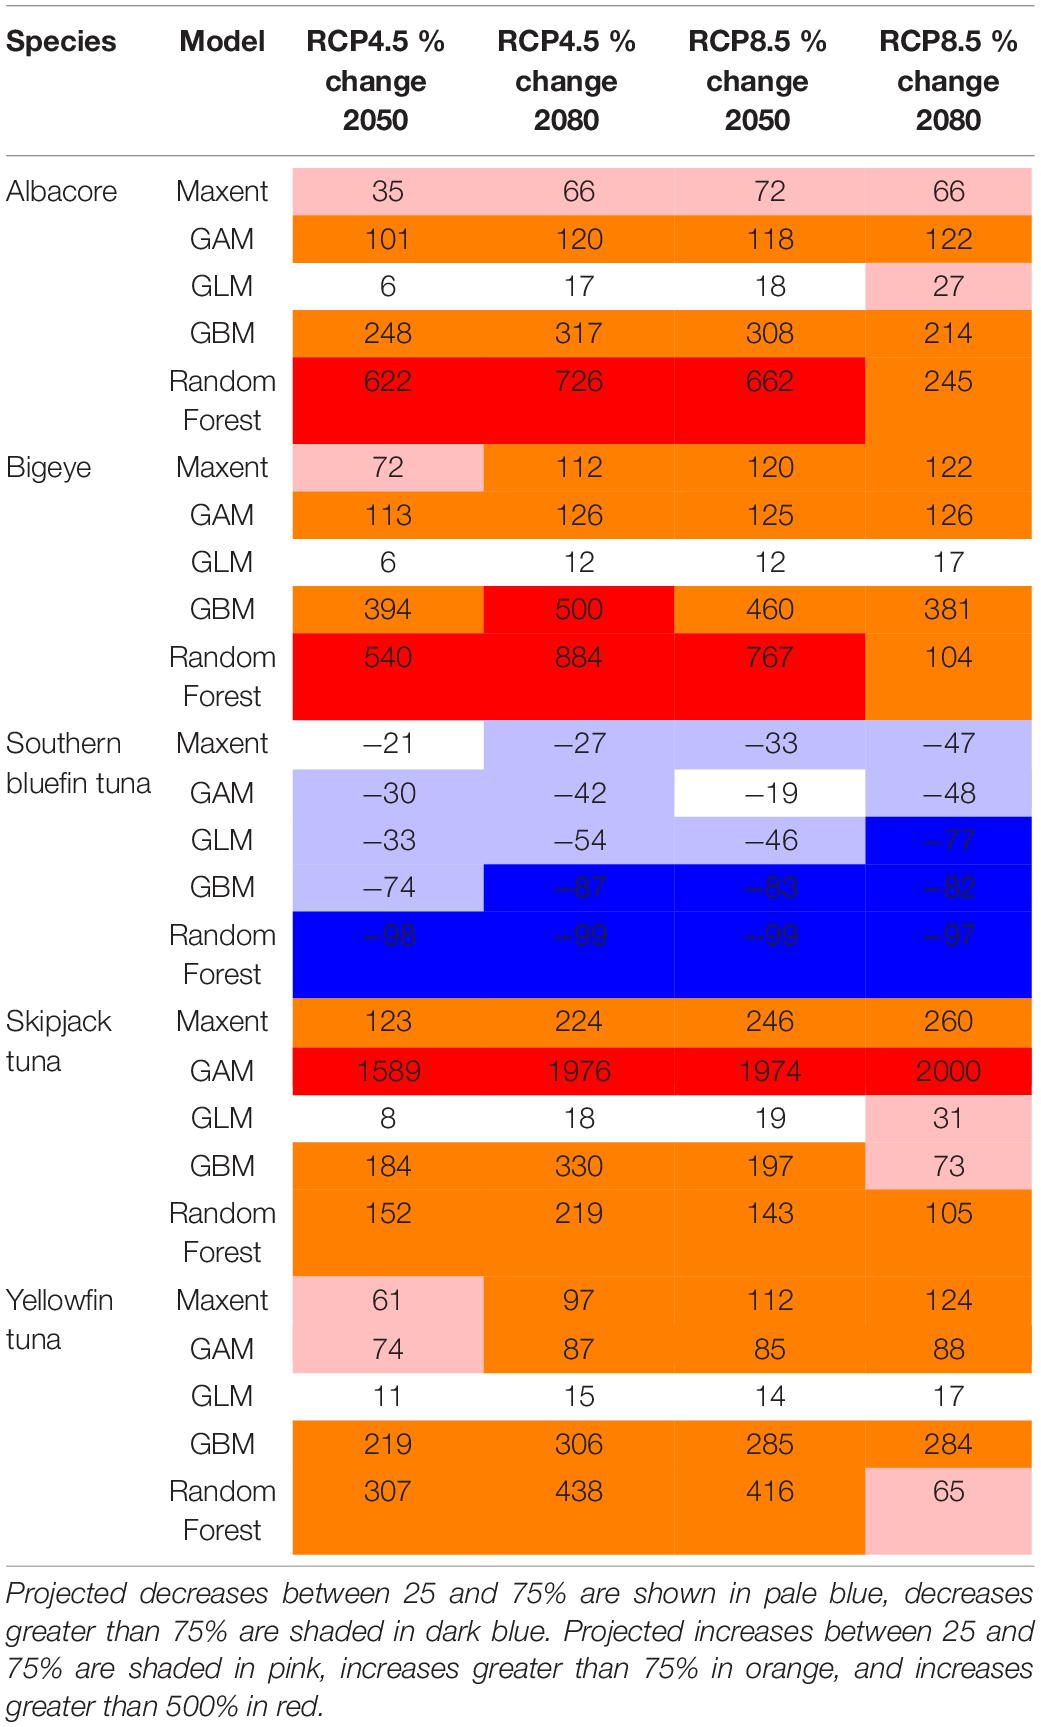
Table 2. The minimum, median and maximum projected changes in habitat suitability in the St Helena EEZ for each species, for each model.
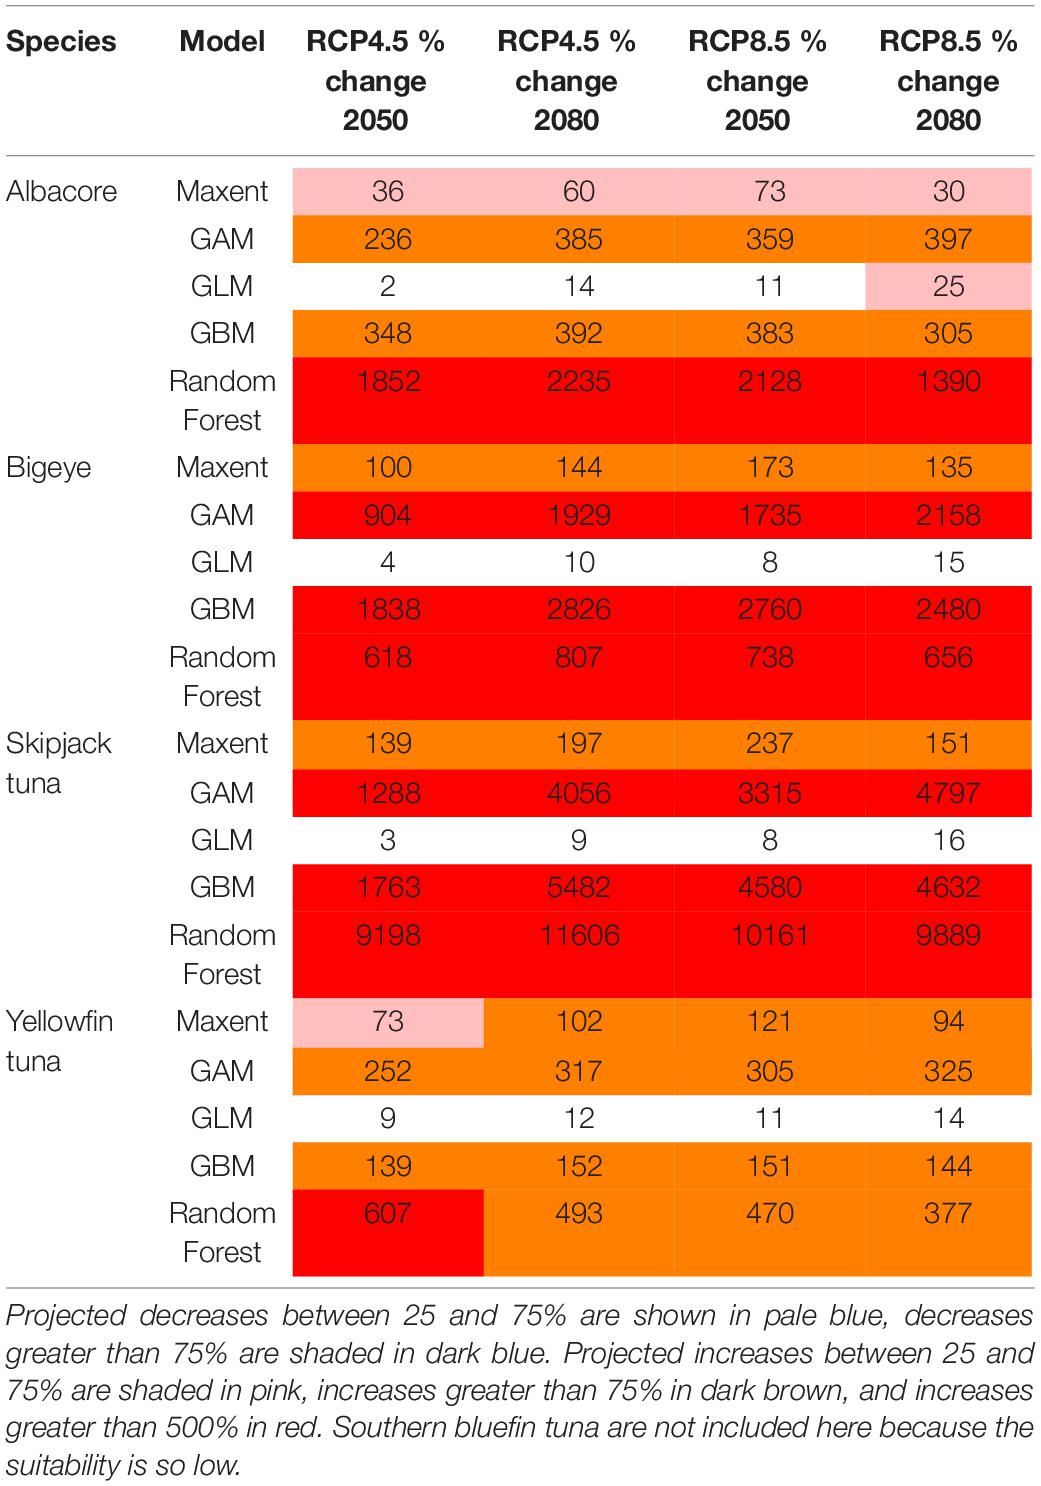
Table 3. The minimum, median and maximum projected changes in habitat suitability in the Ascension Island EEZ for each species, for each model.
For southern bluefin tuna, in the present day, the most suitable habitat is found between 20°S and 45°S, with this projected to expand southwards by the end of the century (Figure 2). This area, to the north of Tristan da Cunha and south of Saint Helena is where historically southern bluefin tuna have been fished, but are no longer present. Of the three territories, Tristan da Cunha is the most suitable for southern bluefin tuna, with low suitability in Ascension or Saint Helena, both now and in the future. In the future, the models project either no change or a slight decrease in suitable habitat in the Tristan da Cunha EEZ, although it will still remain suitable.
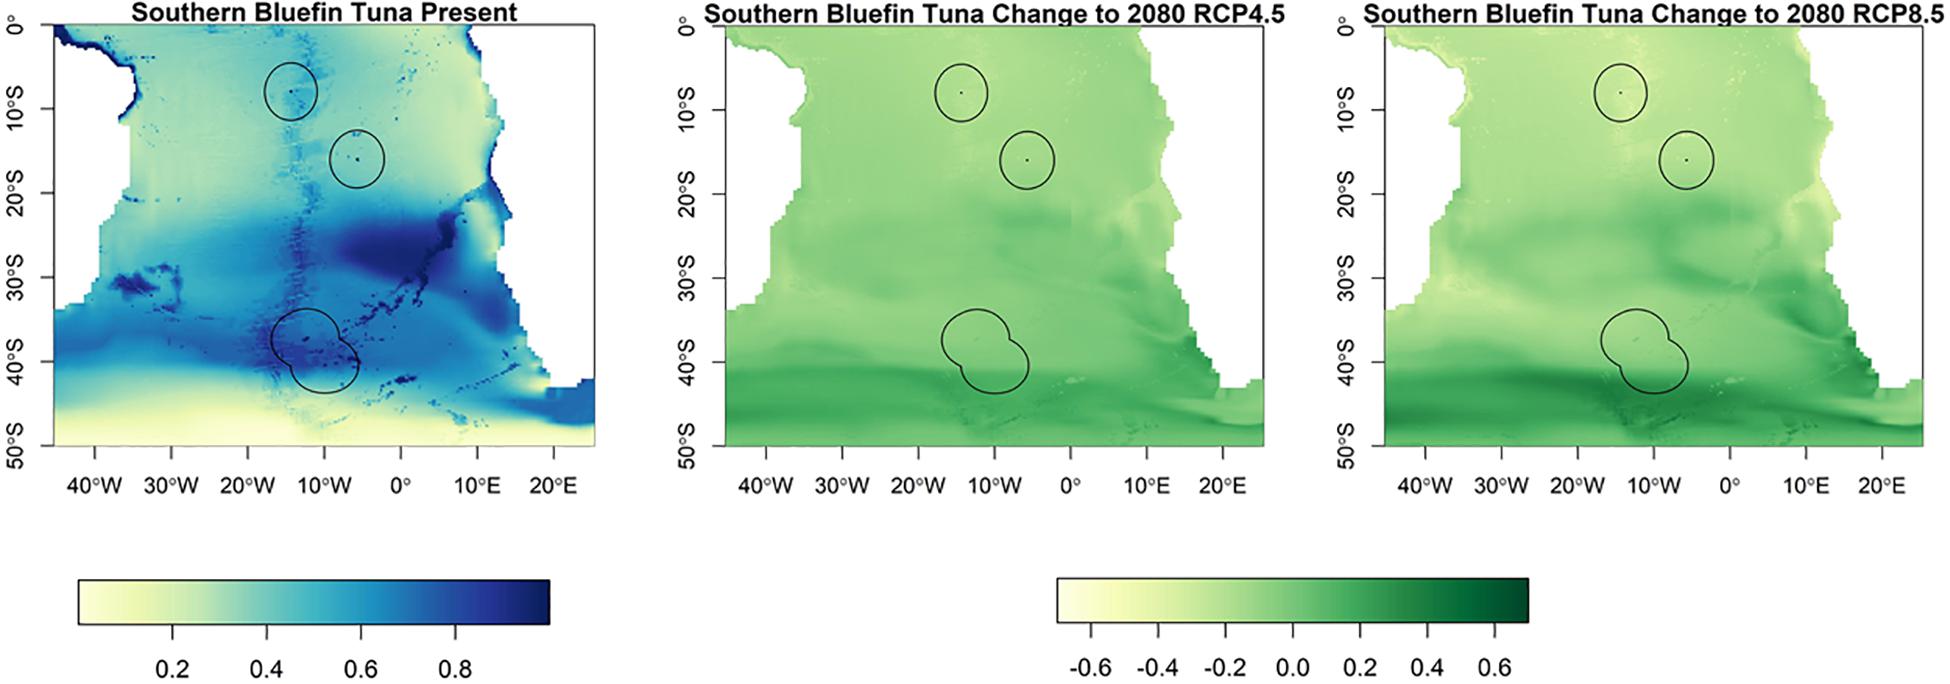
Figure 2. The habitat suitability for southern bluefin tuna from Maxent in the South Atlantic for the present day and the change to 2080 under RCP4.5 and RCP8.5. The EEZs are shown in the black outline. The yellow areas are the most suitable, and the dark blue the least suitable.
Suitable habitat for albacore, bigeye, skipjack and yellowfin tunas is found further north than for southern bluefin (Figures 3–6). The EEZs of Saint Helena and Ascension Island are the most suitable for these species. Tristan da Cunha is toward the edge of their suitable habitat, and this only slightly increases toward the end of the century, under both climate scenarios, but remains very low. Habitat suitability for these species is projected to increase around Saint Helena and Ascension Island in the future. Suitable habitat will increase, especially for bigeye and yellowfin tuna around Ascension Island and Saint Helena, with much of the South Atlantic between 0° S and 25° S being suitable (Figures 4, 5). For skipjack tuna, there is projected to be a large increase in suitable habitat around Saint Helena and Ascension Island, and this will increase further in Saint Helena.
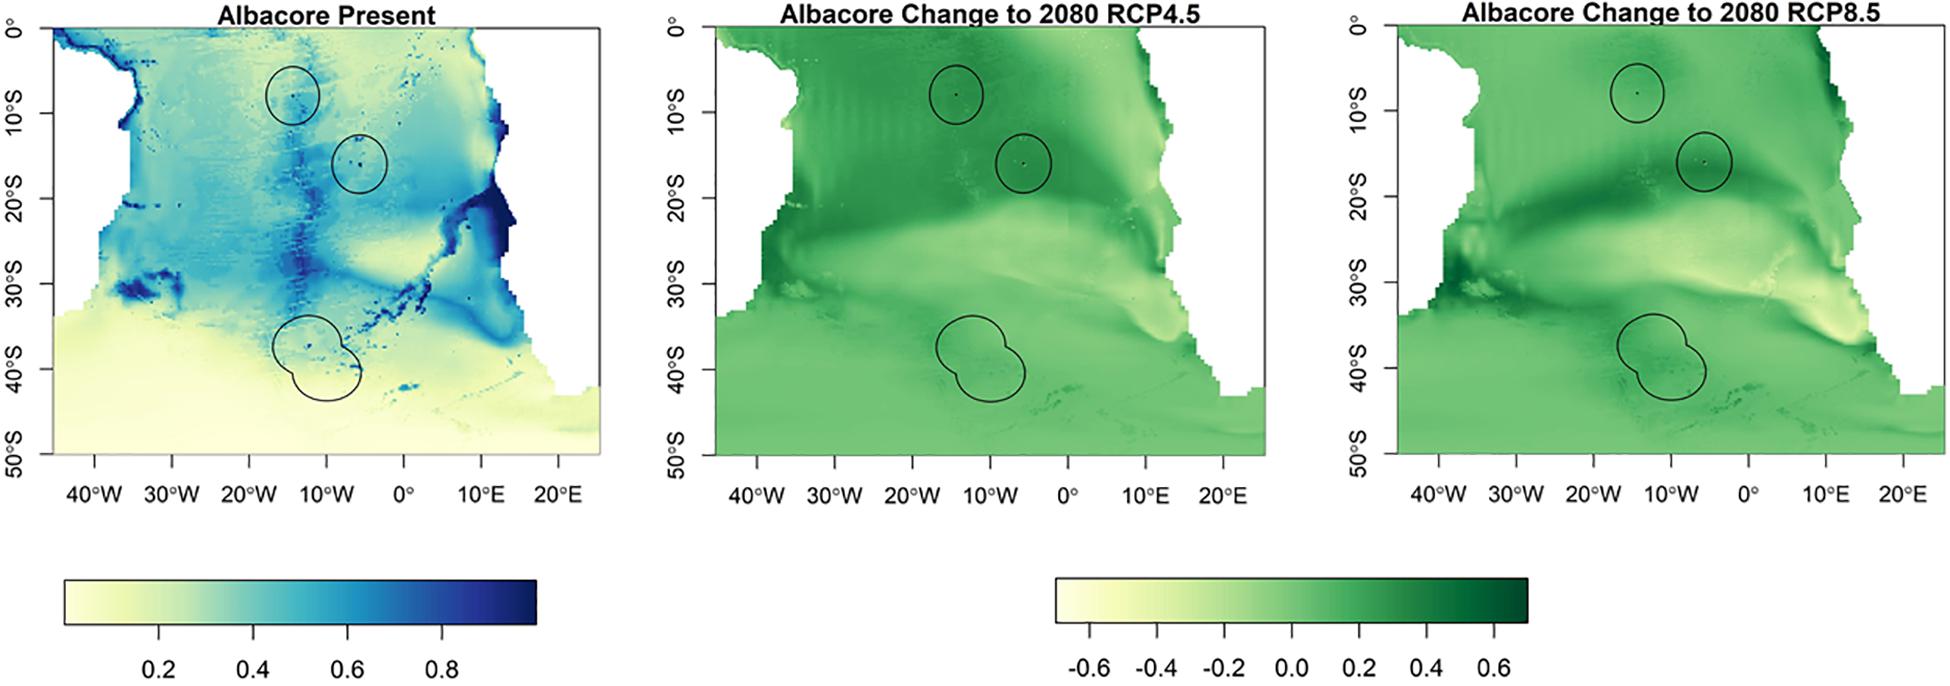
Figure 3. The habitat suitability for albacore tuna from Maxent in the South Atlantic for the present day and the change to 2080 under RCP4.5 and RCP8.5. The EEZs are shown in the black outline. The yellow areas are the most suitable, and the dark blue the least suitable.
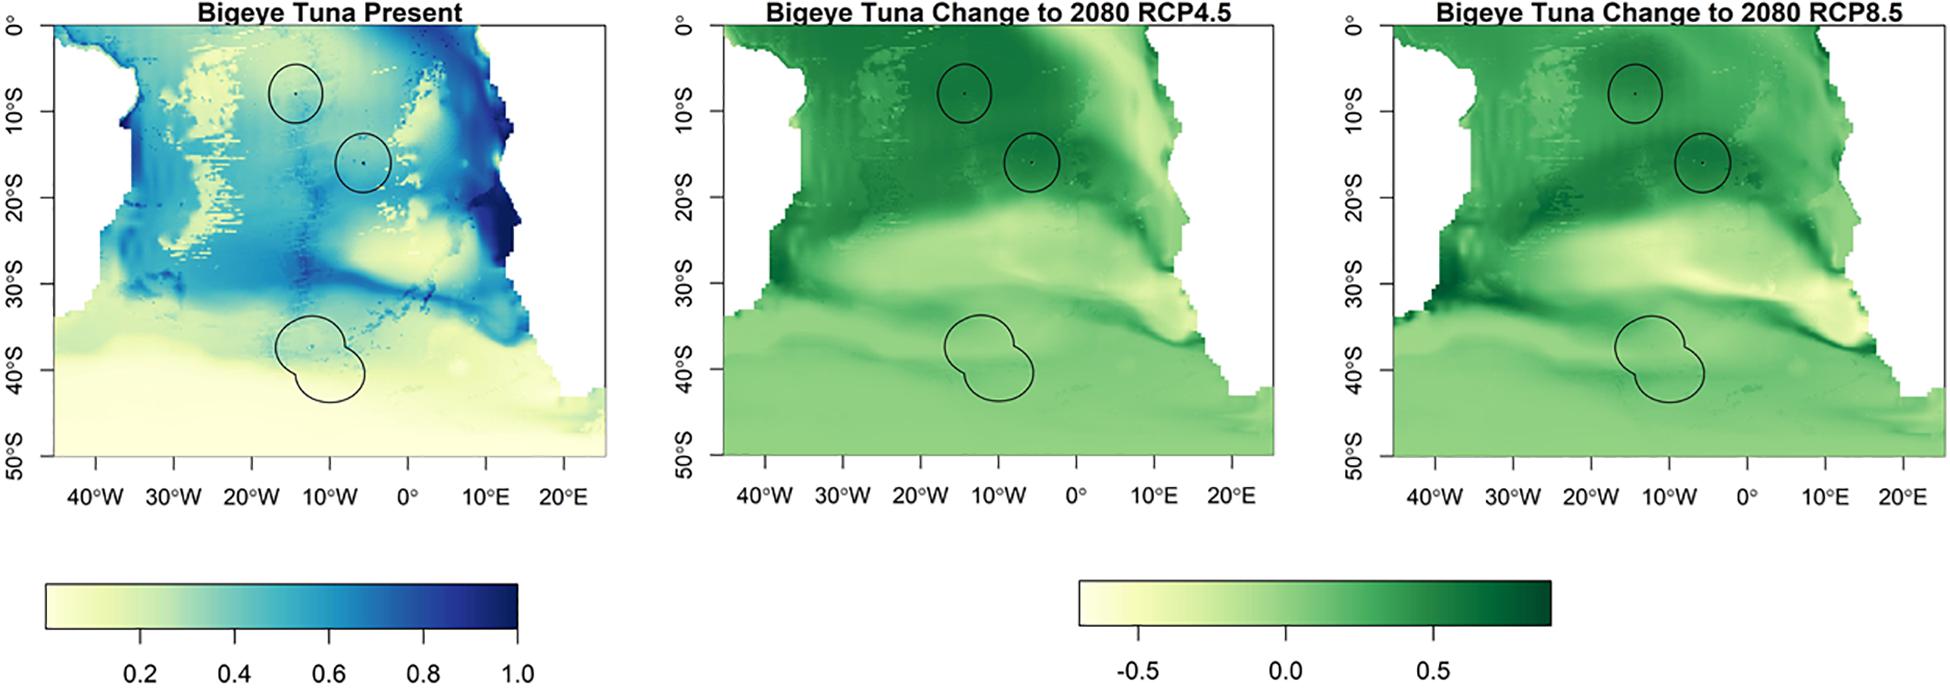
Figure 4. The habitat suitability for bigeye tuna from Maxent in the South Atlantic for the present day and the change to 2080 under RCP4.5 and RCP8.5. The EEZs are shown in the black outline. The yellow areas are the most suitable, and the dark blue the least suitable.
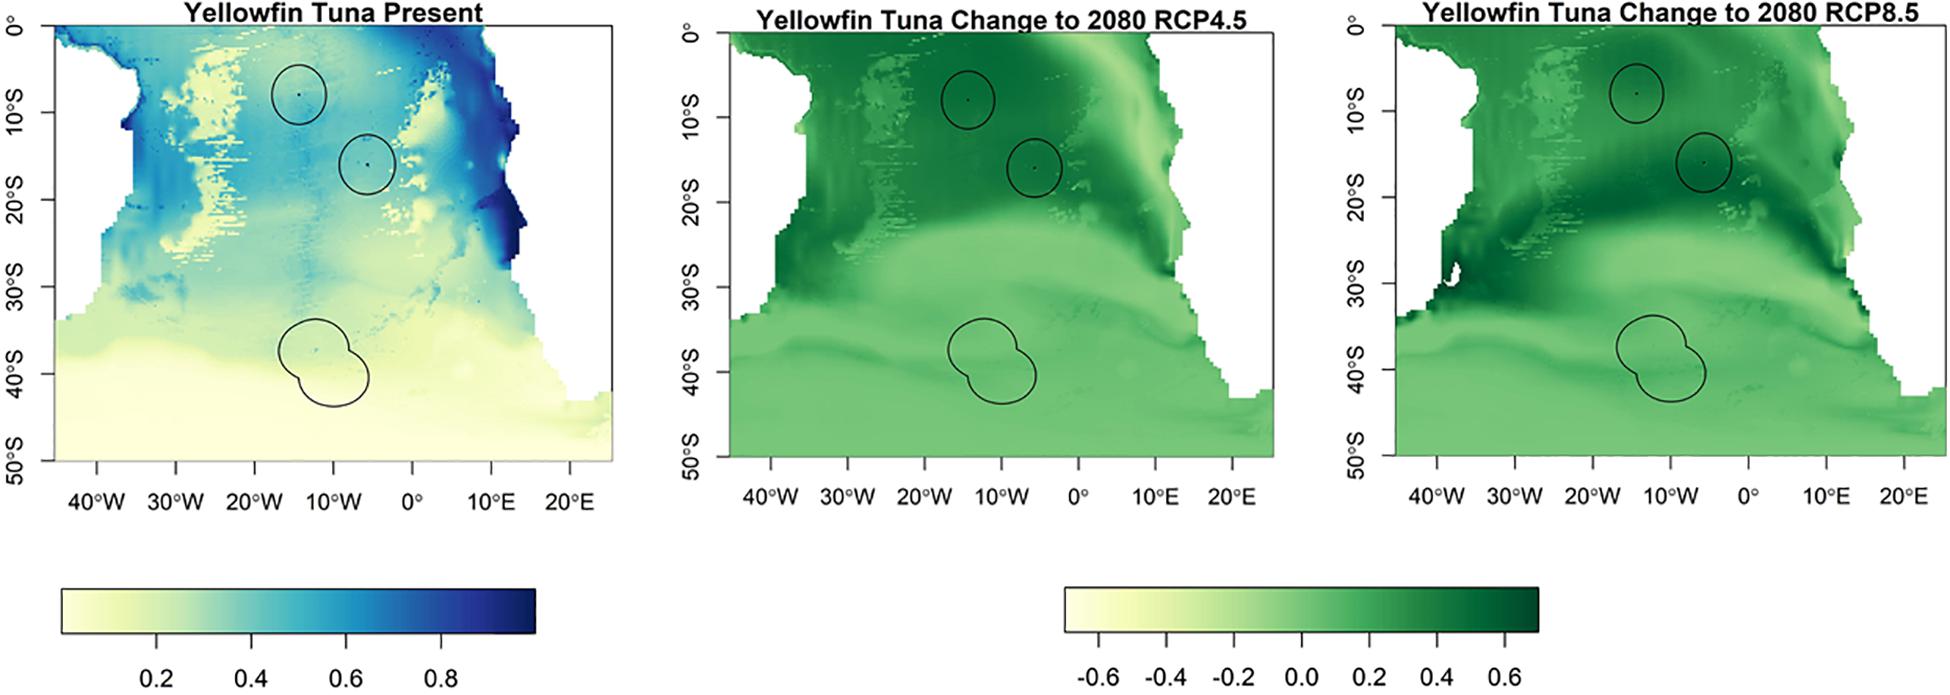
Figure 5. The habitat suitability for yellowfin tuna from Maxent in the South Atlantic for the present day and the change to 2080 under RCP4.5 and RCP8.5. The EEZs are shown in the black outline. The yellow areas are the most suitable, and the dark blue the least suitable.
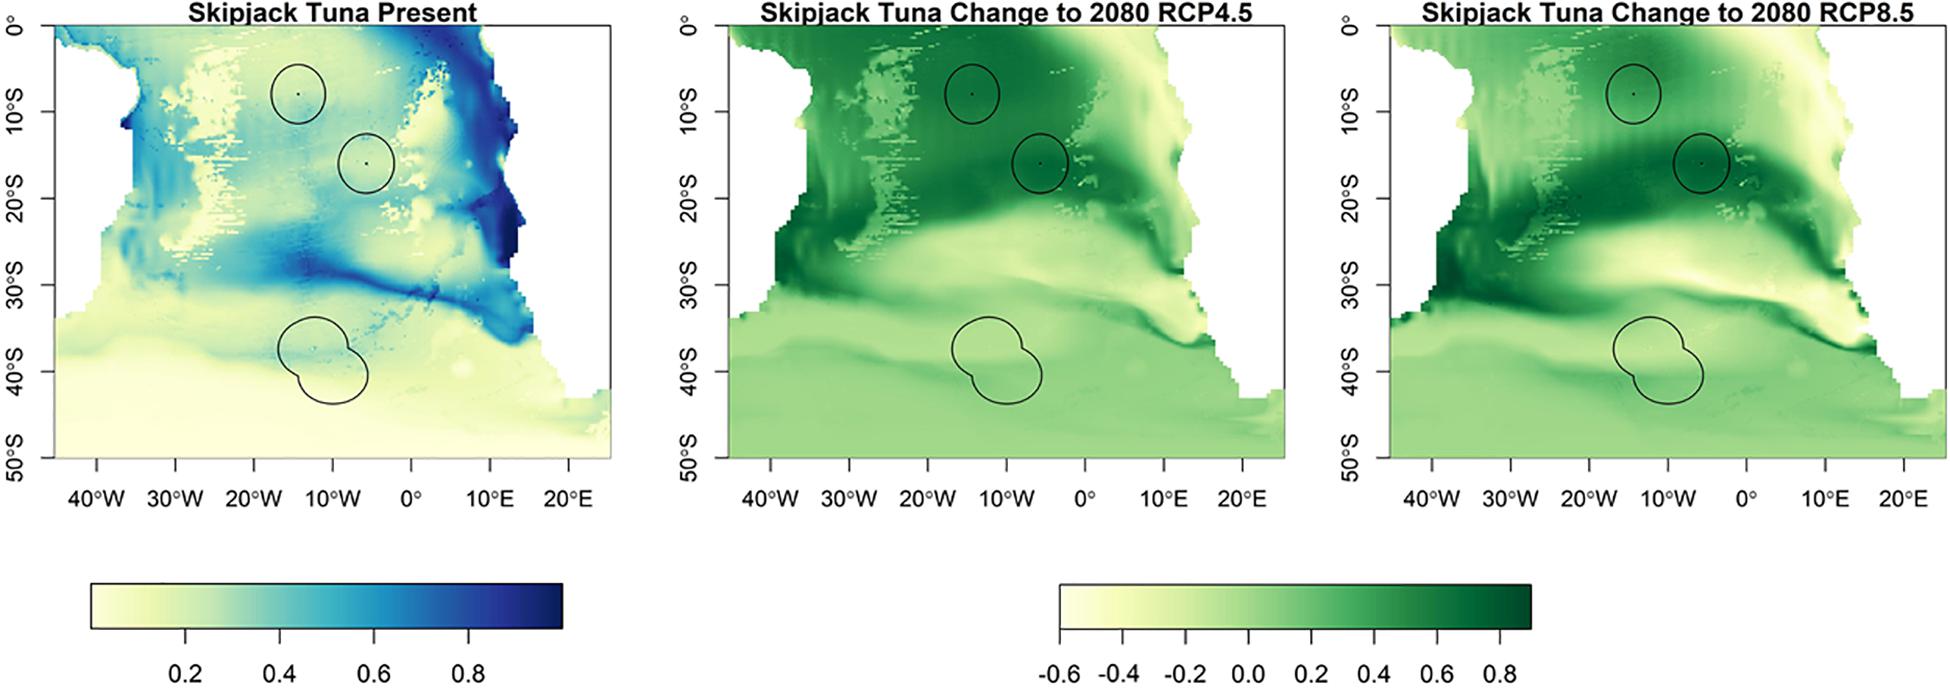
Figure 6. The habitat suitability for skipjack tuna from Maxent in the South Atlantic for the present day and the change to 2080 under RCP4.5 and RCP8.5. The EEZs are shown in the black outline. The yellow areas are the most suitable, and the dark blue the least suitable.
The projected changes for each model are shown in Tables 1–3. These show that the different models can project different rates of change into the future, but in general they agree in the direction of the change (i.e., increase or decrease) in suitable habitat. The lowest projected changes are given by the GLM, and the highest by the Random Forest. More consistent projected changes are given across Maxent, GAM and GBM.
All five models has AUC values greater than 0.85, with the majority above 0.90 (Table 4), showing a good model fit and well above the threshold of 0.80, considered to be a suitable model. Sea surface temperature and salinity had the highest contribution of all of the variables for all species, with general agreement between models (Table 5). Salinity was the most important for albacore and bigeye tuna, temperature for southern bluefin tuna and yellowfin tuna. For skipjack tuna, most models determined salinity to be the most important variable, while Maxent determined it to be temperature. The response curves for Maxent, showing the predicted presence based on each variable, are shown in Supplementary Material 2.
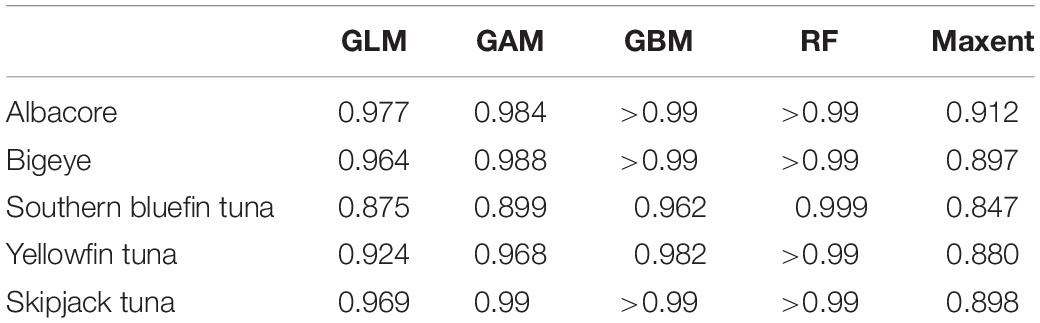
Table 4. AUC values of the species distribution models.
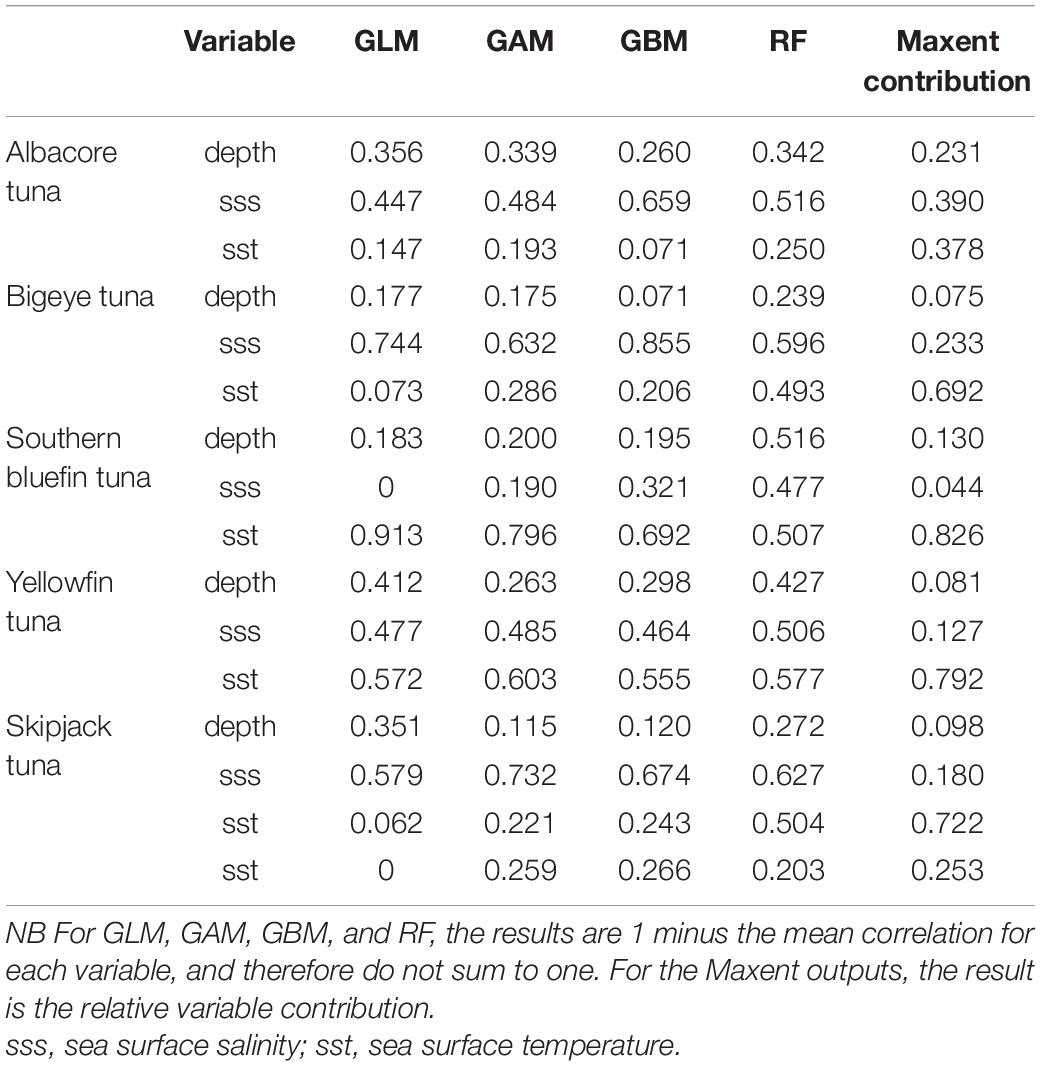
Table 5. The importance of each variable in the different species distribution models. The variable with the highest contribution to the model is highlighted in grey.
Discussion
Future Distributions
The waters around Ascension Island and Saint Helena are projected to become more suitable for albacore, yellowfin, bigeye, and skipjack tuna toward the end of the century, and especially so for skipjack tuna in Saint Helena. In Tristan da Cunha, suitability will remain low for albacore, yellowfin, bigeye and skipjack tuna in the coming century, since they have a more northerly distribution. The EEZ is projected to remain suitable overall for southern bluefin tuna.
A recent modelling study found that for the EEZs of Saint Helena, Ascension and Tristan da Cunha, the abundance of albacore, skipjack and yellowfin tuna would increase toward the end of century, but that southern bluefin and bigeye would decrease in abundance (Erauskin-Extramiana et al., 2019). The areas projected to change in the South Atlantic broadly agree with the present study, with the exception of bigeye tuna, which was projected to decrease across most of the central and southern Atlantic. It is difficult to identify why there might be differences in the projections for bigeye tuna, but this may be because different datasets were used to produce the models. This previous study did not include seafloor depth, which can be an important variable in limiting or determining realised niches, even for pelagic species, and only included Japanese long-line tuna records from 1980 to 1999, in comparison with the presence data from the 21st Century used here. One advantage of the Erauskin-Extramiana et al. study was that it included abundance data, giving projections of future abundance rather than only habitat suitability. It is encouraging that overall these two methodologies have yielded similar results in the wider area. A global study of catch potential changes under climate change scenarios (Cheung et al., 2010), projected that the seas around Ascension Island and Saint Helena would see a small percentage increase in catch potential, but that there would be a larger increase around Tristan da Cunha. A more recent study projected an increase in maximum catch and revenue potential for Tristan da Cunha, but a decrease for Ascension Island and Saint Helena (Lam et al., 2016). These results are not consistent with the present study, looking only at tuna, which projected a greater increase in suitable habitat for tuna in the northern territories. These previous studies included species other than tuna, and considered fisheries catch rather than purely suitable habitat, which might account for these differences.
The Effects of Fishing on Distribution
Species shifts have already happened in past decades for many species globally (Poloczanska et al., 2013) and so the models here were trained using presence data for the period 2005 to 2019. With species subjected to high fishing mortality, especially tuna (Juan-Jordá et al., 2011), their distributions can change as a result of fishing, instead of, or in addition to climate (Last et al., 2010). For example, southern bluefin tuna occurred much further north in the South Atlantic in the 20th Century than in the 21st Century. The CCSBT distribution maps also show that the species was caught further north and over a wider area in the Atlantic in the 1980s (CCSBT, 2018). The species has been overfished in this time (Juan-Jordá et al., 2011), and the distribution has contracted (Worm and Tittensor, 2011), with southern bluefin tuna now estimated to be at only 13% of its original biomass (CCSBT, 2018). The model outputs for the present day show that there is suitable habitat available to the southern bluefin tuna north of Tristan da Cunha, in the same areas of these historical records from before the species was overfished. The presence data suggests that this suitable habitat is not currently occupied, but it is possible that if the species recovers in the future, the population may be able to expand to these areas, back to the distribution of previous decades. Conversely, if fishing pressure increases for any of the species, the populations may contract in existing areas, or may not be able to expand into newly suitable areas. The models here do not include fishing pressure as a variable and as such are unable to predict the effects of fishing on the populations.
Modelling Limitations
Open source databases were used here for the species presence records, along with some additional fisheries data for the less data-rich southern bluefin tuna. Models using such data can be subject to autocorrelation, because of the way that the data sampling can be biased. Caution must therefore be applied when interpreting these species distribution models, and the projected distributions must not be taken as absolute. They are however, of use when considering climate change, as they give managers an indication of the future trends and relative suitability shifts.
Migrations undertaken by the tuna are also not accounted for in the models. For example, juvenile southern bluefin tuna migrate annually between Australia and the Indian Ocean or the Tasman sea, before dispersing across the southern hemisphere, including into the Atlantic (Hobday et al., 2015), where they enter the waters of Tristan da Cunha. Yellowfin, albacore and bigeye tuna have separate spawning grounds to their feeding grounds, with yellowfin tuna migrating between feeding zones in the west Atlantic and the spawning area in the Gulf of Guinea (Fonteneau and Soubrier, 1996). Skipjack show north-south and east-west movements in the Atlantic (ICCAT, 2019b). In this study, each species of tuna has been treated as one single population with the same environmental preferences. In reality, with the exception of southern bluefin tuna, there are a number of populations for each tuna species (Albaina et al., 2013). The International Commission on the Conservation of Atlantic Tunas (ICCAT) treats yellowfin and bigeye tuna as single stocks, while skipjack and albacore are each split into two stocks. There may be different temperature and salinity tolerances between populations or life stages, which are not considered in the models here. In addition, one important aspect which could ultimately determine the climate change impact on the distribution of tuna is the impact of climate change on the spawning and juvenile grounds of these species. The environmental requirements of early life stages can be different to that of adults and so could be considered in further work (Muhling et al., 2015). For example, changes in the Great Australian Bight and the waters around south-western Australia would affect the survival of juvenile southern bluefin tuna (Hobday et al., 2015), ultimately affecting their migrations to, and survival in, the South Atlantic.
The models used a limited number of variables, but the AUC values showed them to be valuable models for representing suitable habitat. There are other factors which affect fish distributions which were not included in the models here, such as prey availability, dissolved oxygen, chlorophyll, and pH. More complex models with higher computing costs could incorporate these variables. Future tuna fisheries catches have been modelled in the Pacific Ocean using the Spatial Ecosystem and Population Dynamics Model (SEAPODYM) model, which incorporates fisheries parameters, results from laboratory experiments and different scenarios of, for example, primary production (Senina et al., 2018). These types of ecosystem models require much larger data inputs but can provide more complex analyses of fish distributions and dynamics.
Management Implications
Tuna stocks globally are subject to high levels of exploitation. Albacore in the South Atlantic are moderately exploited, yellowfin in the Atlantic are nearly fully exploited, and bigeye are over-exploited (ICCAT, 2019b). Southern bluefin tuna are depleted (CCSBT, 2018). In the 2017 stock assessment, southern bluefin tuna were considered to be at 13% of their original biomass, up from 5.5% in 2011 (CCSBT, 2018). The current Total Allowable Catch has a 70% chance of rebuilding the stock to the target biomass of 20% by 2035. As such, in recent years there have been strict restrictions on fishing for southern bluefin tuna, including in the area of Tristan da Cunha. If the stock does rebuild, it may expand into the areas shown by the model as suitable, as described above. Any fishing of the other tuna species within the island EEZs would be subject to ICCAT quotas and other current management measures. The Saint Helena EEZ has been designated as a marine protected area, with tuna fishing only allowed using pole and line (Saint Helena Government, 2016). In 2018, plans were announced to designate at least 50% of Ascension Island’s EEZ as a marine protected area closed to all commercial fishing (Ascension Island Government, 2018). In 2020, the EEZ of Tristan da Cunha was declared a marine protected area (Tristan da Cunha Government, 2020). Tuna fishing has been banned in most of the area, and only small scale fishing is allowed close to the islands. The measures in each of these territories would protect a small area of the South Atlantic Ocean from tuna fishing. As these areas are small relative to the whole range for these species, it is not clear to what extent this protection will rebuild populations. However, recent tagging studies of yellowfin tuna around Saint Helena show that the fish have high site fidelity and do not move far from the Territory (Wright et al., accepted).
It is important to include the effects of climate change in decision making (Pecl et al., 2017), especially when planning marine management over decadal, or longer, time scales, such as planning fisheries management in an area, or a marine protected area. As such, the relatively simple species distribution models used here are highly valuable as they provide information on which species may be available for exploitation, or which could be protected for recovery. The financial and societal implications of fisheries management and marine protection are important considerations for small islands, and therefore understanding the future fisheries potential, with oceans subject to climate change, are essential. The information from these models is part of the evidence base for consideration of spatial management around the UKOTs associated with sustainable tuna fishing. South Atlantic fish stocks, and those of the UKOTs, are subject to, or at risk of overfishing and climate change, but modelling shows that the risk is much lower if fishing can be made sustainable, and greenhouse gas emissions reduced (Cheung et al., 2018).
Conclusion
Ascension Island and Saint Helena are projected to become more suitable for bigeye, skipjack, yellowfin and albacore tuna in the coming century. Alongside sustainable management, the newly designated marine protected areas around these territories may afford these species some protection in the future through sustainable management practices adopted by the respective Governments. Overall, the models project that suitable habitat for southern bluefin tuna to decrease slightly around Tristan da Cunha this coming century, but it will still remain more suitable in the future for southern bluefin than for the other tuna species. Suitable habitat is currently very low for albacore, bigeye, skipjack and yellowfin tuna, and although it is projected to increase many times by some of the models, it will remain very low overall. This is supported by previous modelling studies which use different data sources. With southern bluefin tuna populations currently being at such low levels, if the stock is able to recover, abundance may increase around Tristan da Cunha, as well more broadly in the South Atlantic. These models can also support marine management by presenting a snapshot of the future, enabling managers and governments to build resilience in their fisheries and consider which species might be sustainably targeted, or further protected, in future.
Data Availability Statement
The original contributions presented in the study are included in the article/Supplementary Material, further inquiries can be directed to the corresponding author/s.
Author Contributions
BT and OY conceived the idea for the research. BT and EC carried out the modelling. BT wrote the manuscript with significant contributions from JB, SR, and OY. All authors contributed to the article and approved the submitted version.
Conflict of Interest
The authors declare that the research was conducted in the absence of any commercial or financial relationships that could be construed as a potential conflict of interest.
Funding
This manuscript was funded by the Government of the United Kingdom’s Blue Belt Programme. Advice from Mark Payne (DTU-Aqua) was followed on how to re-grid irregular model grids (https://rpubs.com/markpayne/132500).
Supplementary Material
The Supplementary Material for this article can be found online at: https://www.frontiersin.org/articles/10.3389/fmars.2021.634280/full#supplementary-material
References
Albaina, A., Iriondo, M., Velado, I., Laconcha, U., Zarraonaindia, I., Arrizabalada, H., et al. (2013). Single nucleotide polymorphism discovery in albacore and Atlantic bluefin tuna provides insights into worldwide population structure. Anim. Genet. 44, 678–692. doi: 10.1111/age.12051
Ascension Island Government (2018). Ascension Island Marine Protected Area Evidence and Options Document. Available Online at: https://www.ascension-island.gov.ac/wp-content/uploads/2018/11/Ascension-Island-Marine-Protected-Area-Evidence-and-Options-Document-Second-draft-Nov-18-final.pdf [accessed on Feb18, 2020].
Bell, J. D., Ganachaud, A., Gehrke, P. C., Griffiths, S. P., Hobday, A. J., and Hoegh-Guldberg, O. (2013). Mixed responses of tropical Pacific fisheries and aquaculture to climate change. Nat. Clim. Change 3, 591–599. doi: 10.1038/nclimate1838
CCSBT (2018). Report on biology, stock status and management of southern bluefin tuna: 2018. Attachment 6. Online. Available online at: https://www.ccsbt.org/sites/default/files/userfiles/file/docs_english/meetings/meeting_reports/ccsbt_25/Attachment06_from_report_of_SC23.pdf [accessed Aug 5, 2019].
CCSBT (2019a). Report of the Twenty Sixth Annual Meeting of the Commission. 17 October 2019 Cape Town, South Africa. Available online at https://www.ccsbt.org/sites/default/files/userfiles/file/docs_english/meetings/meeting_reports/ccsbt_26/report_of_CCSBT26.pdf [accessed Feb 18, 2020].
CCSBT (2019b). Commission for the Conservation of Southern Bluefin Tuna. SBT data. Available online at https://www.ccsbt.org/en/content/sbt-data [accessed on May 18, 2019].
Cheung, W. W. L., Dunne, J., Sarmiento, J. L., and Pauly, D. (2011). Integrating ecophysiology and plankton dynamics into projected maximum fisheries catch potential under climate change in the Northeast Atlantic. ICES J. Mar. Sci. 68, 1008–1018. doi: 10.1093/icesjms/fsr012
Cheung, W. W. L., Jones, M. C., Reygondeau, G., and Frölicher, T. L. (2018). Opportunities for climate-risk reduction through effective fisheries management. Glob. Change Biol. 2018, 1–5. doi: 10.1111/gcb.14390
Cheung, W. W. L., Lam, V. W. Y., Sarmiento, J. L., Kearney, K., Watson, R., Zeller, D., et al. (2010). Large-scale redistribution of maximum fisheries catch potential in the global ocean under climate change. Global Change Biol. 16, 24–35. doi: 10.1111/j.1365-2486.2009.01995.x
Collette, B., Chang, S.-K., Di Natale, A., Fox, W., Juan Jorda, M., Miyabe, N., et al. (2011). Thunnus maccoyii. The IUCN Red List of Threatened Species 2011: e.T21858A9328286. Available online at http://dx.doi.org/10.2305/IUCN.UK.2011-2.RLTS.T21858A9328286.en. [accessed July 30, 2019]
Collins, W. J., Bellouin, N., Doutriaux-Boucher, M., Gedney, N., Hinton, T., and Jones, C. D. (2008). Evaluation of the HadGEM2 model. Met Office Hadley Centre Technical Note no. HCTN 74. Available at Met Office. Available online at: http://www.metoffice.gov.uk/publications/HCTN/index.html. [accessed Jan 1, 2020]
Erauskin-Extramiana, M., Arrizabalaga, H., Hobday, A. J., Cabré, A., Ibaibarriaga, L., Arregui, I., et al. (2019). Large-scale distribution of tuna species in a warming ocean. Glob. Change Biol. 25, 2043–2060. doi: 10.1111/gcb.14630
FAO (1999). Fisheries and aquaculture issues in small island developing states. Committee on Fisheries. Twenty-third session. Rome, Italy, 15-19 February 1999. Available online at: http://www.fao.org/3/X0463E/X0463E.htm. [accessed July 30, 2019]
FAO (2018). “Impacts of climate change on fisheries and aquaculture. Synthesis of current knowledge, adaptation and mitigation options,” in FAO Fisheries and aquaculture technical paper (Rome: FAO), 627.
Fonteneau, A., and Soubrier, P. P. (1996). “Interactions between tuna fisheries: A global review with specific examples from the Atlantic Ocean. In: Status of Interactions of Pacific Tuna Fisheries in 1995 [Shomura, R.S., Majkowski, J., Harman, R.F.],” in Proceeding of the Second FAO Expert Consultation on Interactions of Pacific Tuna Fisheries Shimizu, Japan 23 to 31 January 1995 (Rome: FAO).
GBIF.org (2019a). GBIF Occurrence Download Thunnus obesus. URL: https://eur02.safelinks.protection.outlook.com/?url=https%3A%2F%2Fdoi.org%2F10.15468%2Fdl.krojb6&data=02%7C01%7C%7C360e3effca1540f8b2b608 d70e8818c5%7Ceeea3199afa041ebbbf2f6e42c3da7cf%7C0%7C0%7C6369938 50014361873&sdata=Lee26wAMk3k5LrYb1yRMAp9Pte%2FjaOKt1UZzpOf 5yh8%3D&reserved=0.
GBIF.org (2019b). GBIF Occurrence Download Thunnus albacares. URL: https://eur02.safelinks.protection.outlook.com/?url=https%3A%2F%2Fdoi.org%2F10.15468%2Fdl.3hknqu&data=02%7C01%7C%7C634cd3df8f0349635fbd 08d70e8808d3%7Ceeea3199afa041ebbbf2f6e42c3da7cf%7C0%7C0%7C636993 849734216356&sdata=2041Rx1XUo0u6tCvkYbT0kpyzExIMwbm0jfIJLl1Sk 8%3D&reserved=0.
GBIF.org (2019c). GBIF Occurrence Download Thunnus alalonga. URL: https://eur02.safelinks.protection.outlook.com/?url=https%3A%2F%2Fdoi.org%2F10.15468%2Fdl.jbrfh1&data=02%7C01%7C%7Ce055ba2234704754445a 08d70e87e0b6%7Ceeea3199afa041ebbbf2f6e42c3da7cf%7C0%7C0%7C63699 3849066525930&sdata=3XJHj2TC8MfCzThP%2B7UVBbBDmQU9FrP7Um 057xsxQXc%3D&reserved=0.
GBIF.org (2019d). GBIF Occurrence Download Thunnus maccoyii. URL: https://eur02.safelinks.protection.outlook.com/?url=https%3A%2F%2Fdoi.org%2F10.15468%2Fdl.3y2hsi&data=02%7C01%7C%7C32e626d168a54618650f 08d6dde69227%7Ceeea3199afa041ebbbf2f6e42c3da7cf%7C0%7C0%7C6369 40379708577022&sdata=pqhKVp5O2QM7EF0vOtKEZkdZ%2BSOpLY QsD7u6%2BTFtWOk%3D&reserved=0.
Glass, N., Lavarello, I., Glass, J. P., and Ryan, P. G. (2000). Longline fishing at Tristan da Cunha: impacts on seabirds. Atlant. Seabirds. 2, 49–56.
Hannah, L., Midgley, G. F., and Millar, D. (2002). Climate change-integrated conservation strategies. Glob. Ecol. Biogeogr. 11, 485–495. doi: 10.1046/j.1466-822X.2002.00306.x
Hastie, T. J., and Tibshirani, R. (1990). Generalized additive models. London, UK: Chapman and Hall.
Hobday, A., Evans, K., Eveson, J. P., Farley, J., Hartog, J., Basson, M., et al. (2015). Distribution and Migration—Southern Bluefin Tuna (Thunnus maccoyii). Biol. Ecol. Bluef. Tuna 2015, 189–210. doi: 10.1201/b18714-12
ICCAT (2019a). Recommendation by ICCAT to replace recommendation 16-01 by ICCAT on a multi-annual conservation and management programme for tropical tunas. Available online at: https://www.iccat.int/Documents/Recs/compendiopdf-e/2019-02-e.pdf. [accessed Jan 25, 2021)
ICCAT (2019b). Report for biennial period 2018-2019 of the ICCAT Standing Committee on Research and Statistics (SCRS). Available at https://www.iccat.int/Documents/BienRep/REP_EN_18-19_I-2.pdf. [accessed Jan 25, 2021]
Jones, M. C., Dye, S. R., Pinnegar, J. K., Warren, R., and Cheung, W. W. L. (2012). Modelling commercial fish distributions: prediction and assessment using different approaches. Ecol. Model. 225, 133–145. doi: 10.1016/j.ecolmodel.2011.11.003
Jones, M. C., Dye, S. R., Pinnegar, J. K., Warren, R., and Cheung, W. W. L. (2013). Applying distribution model projections for an uncertain future: the case of the Pacific oyster in UK waters. Aqua. Conserv. 23, 710–722. doi: 10.1002/aqc.2364
Juan-Jordá, M. J., Mosqueira, I., Cooper, A. B., Freire, J., and Dulvy, N. K. (2011). Global population trajectories of tunas and their relatives. PNAS 108, 20650–20655. doi: 10.1073/pnas.1107743108
Lam, V. W. Y., Cheung, W. W. L., Reygondeau, G., and Sumaila, U. R. (2016). Projected change in global fisheries revenues under climate change. Scient. Rep. 6:32607. doi: 10.1038/srep32607
Last, P. R., White, W. T., Gledhill, D. C., Hobday, A. J., Brown, R., Edgar, G. J., et al. (2010). Long-term shifts in abundance and distribution of a temperate fish fauna: a response to climate change and fishing practices. Glob. Ecol. Biogeogr. 20, 58–72. doi: 10.1111/j.1466-8238.2010.00575.x
McCullagh, P., and Nelder, J. A. (1989). Generalized linear models. London, UK: Chapman and Hall. doi: 10.1007/978-1-4899-3242-6
Mercks, B., Steyaert, M., Vanreusel, A., Vincx, M., and Vanaverbeke, J. (2011). Null models reveal preferential sampling, spatial autocorrelation and overfitting in habitat suitability modelling. Ecol. Model. 222, 588–597. doi: 10.1016/j.ecolmodel.2010.11.016
Muhling, B. A., Liu, Y., Lee, S.-K., Lamkin, J. T., Roffer, M. A., Muller-Karger, F., et al. (2015). Potential impact of climate change on the Intra-Americas Sea: Part 2. Implications for Atlantic bluefin tuna and skipjack tuna adult and larval habitats. J. Mar. Syst. 148, 1–13. doi: 10.1016/j.jmarsys.2015.01.010
NEO (2019). Bathymetry (GEBCO). Available online at https://neo.sci.gsfc.nasa.gov/view.php?datasetId=GEBCO_BATHY. [accessed Jun 13, 2019].
Nurse, L. A., McLean, R. F., Agard, J., Briguglio, L. P., Duvat-Magnan, V., Pelesikoti, N., et al. (2014). “Small islands. In: Climate Change 2014: Impacts, Adaptation, and Vulnerability,” in Part B: Regional Aspects. Contribution of Working Group II to the Fifth Assessment Report of the Intergovernmental Panel on Climate Change, eds V. R. Barros, C. B. Field, D. J. Dokken, M. D. Mastrandrea, and K. J. Mach (Cambridge: Cambridge University Press), 1613–1654.
Pecl, G. T., Araújo, M. B., Bell, J. D., Blanchard, J., Bonebrake, T. C., Chen, I.-C., et al. (2017). Biodiversity redistribution under climate change: Impacts on ecosystems and human well-being. Science 355:eaai9214. doi: 10.1126/science.aai9214
Phillips, S. J., Anderson, R. P., and Schapire, R. E. (2006). Maximum entropy modelling of species geographic distributions. Ecol. Model. 190, 231–259. doi: 10.1016/j.ecolmodel.2005.03.026
Phillips, S. J., Dudík, M., and Schapire, R. E. (2019). Maxent software for modeling species niches and distributions (Version 3.4.1). Available online at http://biodiversityinformatics.amnh.org/open_source/maxent/. [accessed Jun 13, 2019]
Poloczanska, E. S., Brown, C. J., Sydeman, W. J., Kiessling, W., Schoemann, D. S., and Moore, P. J. (2013). Global imprint of climate change on marine life. Nat. Clim. Change 3, 919–925. doi: 10.1038/nclimate1958
R Core Team (2013). R: A language and environment for statistical computing. Vienna: R Foundation for Statistical Computing.
Ridgeway, G. (2020). Package (gbm) Generalised Boosted Regression Models Version 2.1.8. Available online at https://cran.r-project.org/web/packages/gbm/gbm.pdf (accessed on Oct 21, 2020].
RSPB (2017). South Atlantic Overseas Territories Commerical fisheries management review summary. An independent report by MarEcol, commissioned by the RSPB. January 2017. Online. Available online at https://www.rspb.org.uk/globalassets/downloads/documents/conservation-projects/ukots-hidden-treasures/2017/summary-south-atlantic-overseas-territories-fisheries-sustainability-report-2017.pdf. (accessed Jul 30, 2019)
Rutterford, L. A., Simpson, S. D., Jennings, S., Johnson, M. P., Blanchard, J. L., Schön, P.-J., et al. (2015). Future fish distributions constrained by depth in warming seas. Nat. Clim. Change 5, 569–573. doi: 10.1038/nclimate2607
Saint Helena Government (2016). St Helena Marine Management Plan. Environmental Management Division, Saint Helena Government. Online. Available online from: https://www.sainthelena.gov.sh/wp-content/uploads/2018/07/Marine-Management-Plan.pdf [accessed Feb 18, 2020]
Senina, I., Lehodey, P., Smith, N., Hampton, J., Reid, C., and Bell, J. (2018). Impact of climate change on tropical tuna species and tuna fisheries in Pacific Island waters and high seas areas. Final Report (C1-3) for SAN 6003922. Available online at http://www.fao.org/fileadmin/user_upload/common_oceans/docs/Final-report-PacificTunaClimateChange.pdf [accessed Jan 22, 2021]
Thuiller, W., Georges, D., Engler, R., and Breiner, F. (2016). Package ‘biomod2’. Functions for species distribution modelling, calibration and evaluation, ensemble of models. Available at https://cran.r-project.org/web/packages/biomod2/biomod2.pdf (accessed on Feb 4, 2020].
Thuiller, W., Lafourcade, B., and Araujo, M. (2009). ModOperating Manual for BIOMOD. Available online at http://r-forge.r-project.org/scm/viewvc.php/*$checkout*/pkg/inst/doc/Biomod%20Manual.pdf?revision=67&root=biomod&pathrev=218 [accessed on Feb 4, 2020]
Townhill, B. L., Tinker, J., Jones, M., Pitois, S., Creach, V., Simpson, S. D., et al. (2018). Harmful algal blooms and climate change: exploring future distribution changes. ICES J. Mar. Sci. 75, 1882–1893. doi: 10.1093/icesjms/fsy113
Tristan da Cunha Government (2020). Tristan’s Marine Protection Zone Announced. Available online at https://www.tristandc.com/government/news-2020-11-12-mpzgov13nov2020.php [accessed Jan 22, 2021]
Van Keeken, O. A., van Hoppe, M., Grift, R. E., and Rijnsdorp, A. D. (2007). Changes in the spatial distribution of North Sea plaice (Pleuronectes platessa) and implications for fisheries management. J. Sea Res. 57, 187–197. doi: 10.1016/j.seares.2006.09.002
Worm, B., and Tittensor, D. P. (2011). Range contraction in large pelagic predators. PNAS 108, 11942–11947. doi: 10.1073/pnas
Keywords: conservation, distributions, modelling, Overseas Territories, shifts, tuna, climate change
Citation: Townhill BL, Couce E, Bell J, Reeves S and Yates O (2021) Climate Change Impacts on Atlantic Oceanic Island Tuna Fisheries. Front. Mar. Sci. 8:634280. doi: 10.3389/fmars.2021.634280
Received: 27 November 2020; Accepted: 03 February 2021;
Published: 23 February 2021.
Edited by:
Rui Rosa, University of Lisbon, PortugalCopyright © 2021 Townhill, Couce, Bell, Reeves and Yates. This is an open-access article distributed under the terms of the Creative Commons Attribution License (CC BY). The use, distribution or reproduction in other forums is permitted, provided the original author(s) and the copyright owner(s) are credited and that the original publication in this journal is cited, in accordance with accepted academic practice. No use, distribution or reproduction is permitted which does not comply with these terms.
*Correspondence: Bryony L. Townhill, bryony.townhill@cefas.co.uk