Soil carbon stocks and nitrous oxide emissions of pasture systems in Orinoquía region of Colombia: Potential for developing land-based greenhouse gas removal projects
 Ciniro Costa Jr.1*
  Daniel M. Villegas1
  Mike Bastidas1
  Natalia Matiz-Rubio2
  Idupulapati Rao1
  Jacobo Arango1
- 1International Center for Tropical Agriculture (CIAT), Cali, Colombia
- 2Faculty of Energy, Process, and Bio-Engineering, Stuttgart University, Stuttgart, Germany
Improving grassland conditions under grazing has the potential not only to accumulate carbon in soils, but also to reduce nitrous oxide (N2O) emissions from animal urine deposition. However, measurements in developing countries are still scarce. In the Orinoquia region, permanent grasslands (PG; this unimproved, native pasture is considered as at some state of degradation) based on unimproved grasses are found due to extensive, inefficient grazing combined with annual burning of pastures. We hypothesized that, compared to PG, improved grasslands (IG) managed through rotational grazing of introduced, productive and deep-rooted pasture grass species promote soil organic carbon (SOC) accumulation and reduce N2O emission from urine deposited by grazing cattle. We determined SOC and N2O emissions from urine deposited on soils in an area of PG and in a 6.5 year-old IG area of Urochloa (Syn. Brachiaria) humidicola grass pasture in a beef cattle ranch in Orinoquía region (Colombia). In both areas, we sampled soil for chemical/physical analysis, and measured N2O emissions by simulating urine deposition over 21 days. We applied two-way analysis of variance considering pasture type and soil depth as fixed factors. Estimated SOC stocks (0–100 cm) were in the range of 224.8 Mg C ha−1 for the PG and 259.0 Mg C ha−1 for the IG, with a significant (p < 0.05) average accumulation of 2.0 Mg C ha−1 y−1 (0–20 cm) in the IG area. N2O emissions were 10 times lower in the IG compared to the PG. The introduction of U. humidicola grass influenced SOC accumulation probably through its more abundant root system and greater turnover together with higher (14%) forage dry matter production compared to PG. The reduced N2O emissions observed from urine patches in IG were attributed to biological nitrification inhibition ability and greater nitrogen uptake of U. humidicola grass. Compared to the reference default value of IPCC for, the SOC stock found in PG was almost 40% higher, whereas the N2O emission factor (5%) was within the uncertainty range (0.7–6%). The Orinoquía region shows significant potential for SOC storage and reduced N2O emissions in improved pastures with deep root systems. Thus, scaling the implementation of land-based SOC storage practices/projects could significantly contribute to reducing net emissions from beef production from this region.
Introduction
There has been a growing interest in land-based carbon (C) removals because of its large potential to reduce global emissions of greenhouse gases (GHG). Recent studies show that land-based measures that are directly related to the agriculture practices have the potential to sequester approximately 10.5 GtCO2eq yr−1 by 2050, which corresponds to about 20% of the mitigation needed to achieve the 1.5°C temperature target (Griscom et al., 2017; Jia et al., 2019; Roe et al., 2021).
The global land-based C removals potential associated with the expansion of agroforestry systems and improved pasture management is approximately 7.0 GtCO2 y−1. Close to 13% of this potential (1.0 GtCO2 y−1) is located in Latin America and the Caribbean (LAC) region, which is responsible for approximately one third of global beef production (FAO, 2017; Roe et al., 2021). If this level of C removal was realized, it could abate 140% of LAC's on-farm emissions from beef cattle in 2019 (0.7 GtCO2 y−1) (FAO-Stat, 2021). Therefore, scaling the implementation of land-based SOC storage practices could significantly contribute to reducing emissions from global beef cattle production.
Grazing management practices that increase SOC storage include, for example, improvements in forage varieties and species with deep, more abundant and recalcitrant root biomass and its turnover (Rao et al., 2001; Fisher et al., 2007; Kell, 2011; Wang et al., 2019), animal management (e.g., rotational grazing) (Li et al., 2022), and introduction of silvopastoral and agroforestry systems (Feliciano et al., 2018). The introduction of these practices in low fertility acid soils of tropical savannas in LAC can enhance the net primary production and quality of improved pasture species, and lead to greater storage of SOC to the point it can exceed the level found in the native vegetation (Fisher et al., 1994, 2007). However, the magnitude of SOC storage is dependent on a number of factors, including climate and grazing management strategy in addition to soil fertility and texture, level of soil degradation, and the use external inputs to sustain productivity (Fisher et al., 1994, 2007; Carvalho et al., 2014; Figueiredo et al., 2017; Ayarza et al., 2022).
On the other hand, it has been debatable whether improving grassland conditions may increase emissions of other GHGs in livestock systems, such as nitrous oxide (N2O) from urine deposition from livestock (Chirinda et al., 2019). Grassland degradation may reduce nitrogen (N) sinks for deposited excreta, increasing the vulnerability of N to loss through soil microbial processes and leaching and thus, increasing N2O emissions. Grassland degradation may also reduce root exudates and thus suppress microbial activity and N2O emissions (Henry et al., 2008). However, the relationship between grassland conditions and N2O emissions is actually more complex. For example, increasing soil compaction (e.g., through overstocking and overgrazing) reduces soil porosity, decreasing soil aeration and restricting plant growth and thus, consequently, increasing soil N2O emissions from urine patches (Van Groenigen et al., 2005). Increasing soil acidification may also affect N2O emissions from urine patches due to reduction in plant growth and inhibition of N2O reductase enzyme activity, thereby increasing N2O emissions (Robinson et al., 2014).
Although there is substantial GHG emissions reductions attainable in livestock production systems (Cusack et al., 2021; Roe et al., 2021), actions and investments to foster emission reduction in the sector are not currently taking place and largely miss the opportunity because of a series of barriers. But climate policy and finance could accelerate the transformation toward low emissions development practices (Wiese et al., 2021; World Bank, 2021). One major constraint has been the lack of data evaluating and validating mitigation potentials of those improved systems as well as cost-effective methods for measurement, reporting and verification (MRV) of GHG emissions and land-based removals (Paustian et al., 2019).
Promising approaches combine practical, user-friendly tools with site-specific modeling and the use of geospatial data sources and technology (Paustian et al., 2019; Costa et al., 2021). In this context, field measurements are necessary for improving the understanding of regional-specific GHG emissions and SOC dynamics and enhancing project capabilities to estimate and monitor changes over time more accurately (i.e., moving to higher IPCC methodological Tiers, improving IPCC default Tier 1 values, setting baselines and initiating models).
We tested the hypothesis that compared to permanent grassland (PG; this unimproved, native pasture is considered as at some state of degradation) based on unimproved grasses, improved grassland (IG) managed with deep-rooted and productive grass promote soil organic carbon (SOC) accumulation and reduce N2O emission from urine deposited by grazing cattle. This hypothesis was tested by measuring SOC stocks and N2O emissions from beef cattle urine patches in two pasture-based beef cattle production systems in a beef cattle farm located in the Orinoquía region of Colombia.
Materials and methods
Study area description
This study was conducted at the Hacienda San Jose (HSJ), located in La Primavera municipality, Vichada, Colombia, latitude 5°54'52.48” longitude N 69°37'12.54” W. According to the IDEAM (Instituto de Hidrología, Meteorología y Estudios Ambientales for its acronym in Spanish) the study area has an average temperature of 27.3°C and an average annual rainfall of 2,223 mm (IDEAM, 2021). The highest precipitation occurs in June with an average of 404 mm; the months with the lowest precipitation are January and February with 10.5 and 8.7 mm, respectively (Figure 1).
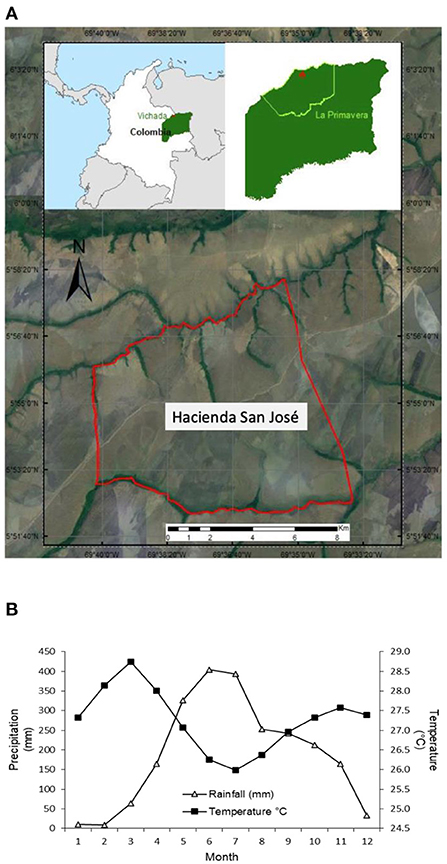
Figure 1. (A) Location of Hacienda San Jose (HSJ) and aerial view of the experimental area at HSJ and (B) historical climate (temperature and rainfall) pattern in the La Primavera municipality (IDEAM, 2021).
The department of Vichada is part of the Colombian Orinoquia region, and it has an area of 10 million hectares (6% of the entire national territory) (DANE, 2019). According to the ICA (2021) national cattle census, this department has a total of 256,954 cattle on an area of 4,628,030 hectares used for livestock; and in the municipality of La Primavera there are 141,228 cattle on 649 farms.
Grassland conditions and selection of two pasture systems for comparison
Livestock activities in the Colombian Orinoquia have been traditionally accompanied by burning of savanna to provide animals with tender forage and supply of minerals from the ashes, and to control unpalatable grasses (Peñuela et al., 2014). Thus, the region is dominated by permanent grassland (PG) based on unimproved grasses, mainly used for extensive cattle raising with very low stocking rates. HSJ started operations in 2014 as a cattle farm with two productive orientations: high-quality animal genetics (short-cycle Nelore breed) and cow-calf production. HSJ has since then implemented several management practices to improve grasslands (IG) pursuing a sustainable intensification, such as a rotational grazing system with improved grass pasture species [Urochloa (Syn. Brachiaria) humidicola] of acceptable forage quality and productivity, avoiding burning of introduced grass pastures.
Two pasture-based beef cattle production systems with different grassland conditions (Table 1) were selected to compare differences in SOC stocks and N2O emissions.
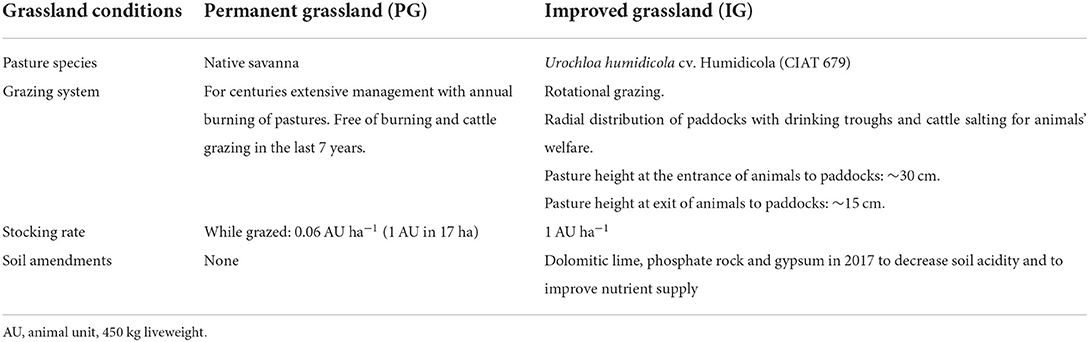
Table 1. Grassland conditions of the two pasture-based beef cattle production in the Orinoquia region of Colombia.
Soil characteristics
Soils at HSJ are ultisols and oxisols (IGAC, 2012), with an average pH of 4.5, silty clay loam texture (8% Sand, 55% Silt, 37% Clay), available phosphorus (BrayII-P) of 0.8 mg kg−1 and exchangeable aluminum of 2.9 cmol kg−1 (Table 2). Aluminum saturation is about 95% in the PG and 85% in the IG area of U. humidicola.
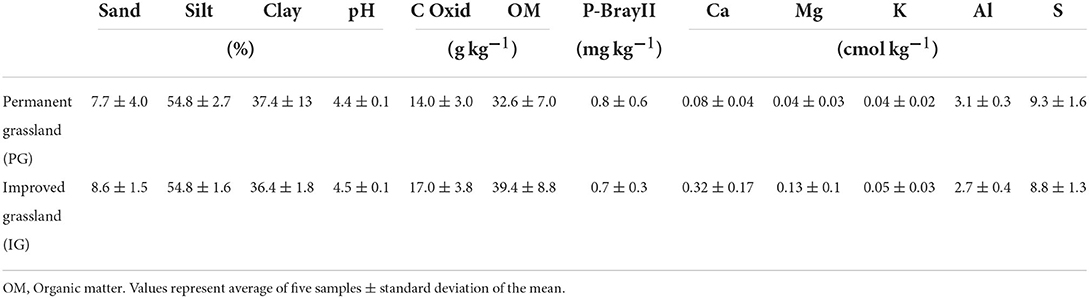
Table 2. Soil physical and chemical characteristics (0–20 cm) of two grassland systems at Hacienda San Jose (HSJ), Colombia.
Soil sampling and analysis
In August 2021, soil was sampled at HSJ in two grassland areas, PG and IG (Table 1), using a completely randomized design (n = 5) for the quantification of total SOC, bulk density (BD), and other chemical and physical characteristics. These two grassland areas (PG and IG) were located in close proximity (next to each other) and presented similar topographic and edapho-climatic conditions. The IG area was implemented 6.5 years ago (2015) by introducing U. humidicola to the degraded PG. These areas may, therefore, represent a sequence, in which PG preceded IG in a land use succession (Table 2).
In each grassland area (PG and IG) soil samples were collected from five trenches (replicates; n=5) arranged in a random transect along the pasture area, ~250–400 meters apart from each other. Soil samples were collected at 0–5, 5–20, 20–60 and 60–100 cm soil depth. In each sampling location and soil depth, two sub-samples were collected on two sides of the trench (which were further analyzed and combined in an attempt to account for SOC spatial variability). A total of 40 soil samples per area were collected. Samples from the 5–20, 20–60, and 60–100 cm soil layers were taken from the middle part of the corresponding soil layer.
For SOC analysis, soil samples were air-dried and then sieved at 2 mm. From each sample, 10 g were ground and sieved at 0.25 mm for the determination of total SOC content that was determined by dry combustion through a CHN Elemental Analyzer Perkin Elmer 2400. For the determination of soil bulk density (BD), samples of undisturbed areas were collected using a steel cylinder (5 x 5 cm) for subsequent evaluation of dry soil weight (at 110°C) and determination of soil bulk density.
The soil sampling approach used in this work has been applied in several agricultural SOC evaluations (e.g., Carvalho et al., 2010; Costa et al., 2013). For better assessment of changes, defining the number of samples may require pre-analysis of the SOC variation of the area (World Bank, 2021). Although this condition is not always possible due to time and financial constraints, it should be pursued in future assessments.
Soil carbon stock calculation
For each soil layer, we calculated the SOC stocks by multiplying the concentration of the soil C (g kg−1) by the soil bulk density (g cm−3) and the soil layer thickness (cm). As samples were collected from fixed layers, the stock calculation needed to be adjusted for variations in BD after the introduction of the U. humidicola. Therefore, the methodology described in Ellert and Bettany (1995) was used to adjust SOC stocks to an equivalent soil mass. For that, the depth of the IG area was adjusted for the same soil mass as the corresponding layer (0–100 cm) in the PG.
Measurement of nitrous oxide emissions and emission factors
In both PG and IG areas, N2O emissions from cattle urine patches were monitored over 19 days by the static chamber method. Sampling chambers consisted of two pieces, one PVC cylinder base of 26 cm diameter and 10 cm height, which was buried 5 cm into the soil, and another PVC cap of the same dimensions, placed above the base and sealing the intersection with a rubber band to avoid gas leakage. The top of the cap had two plastic flow control valves, in which a portable FTIR multigas analyzer Gasmet DX4040 was connected to determine the concentration of N2O in gas samples every 20 s for 10 min (Teutscherova et al., 2019; Villegas et al., 2020). In each pasture area (PG and IG) seven chambers were placed in random sites in the paddock, four adding urine, and three adding water (collected from rain) as experimental control. The urine was obtained by manual stimulation of a group of ~30 empty cows (~400 kg weight each), which were consuming U. humidicola and mineral salt (i.e., no nitrogen supplements). The collection of 8 L of urine needed for the experiment took around 2 h between 6:00 and 8:00 am. The whole volume obtained was mixed and instantaneously applied in the field.
In each sampling point 500 mL of urine or water were homogeneously spread in an area of 0.25 m2 (Durango Morales et al., 2021). Measurement of N2O emissions took place over a period of 19 days between 8:30 to 11:00 am, starting the day before urine/water application (baseline) and then over 14 time points until reaching the 19th day. Ten 10 mL urine subsamples were conserved adding 1% v/v H2SO4 and stored at −15°C for later analysis of N concentration following AOAC (1990) in a Kjeldahl AN 3001 FOSS analyzer. The N concentration recorded in the urine samples was of 1.9 mg L−1, whereas no detectable N was observed in the water applied to the control chambers.
The soil N2O fluxes were calculated using the formula:
(1) Where:
dN2O/dt: Accumulation rate of N2O in the air inside the chamber
V: Volume of chamber headspace + analyzer tubing and sample cell
M: Mass of N per mol of N2O
A: Area of soil surface covered by the chamber
Vm: Molecular volume for N2O
(2) After converting the fluxes into daily emissions (assuming constant efflux over 24 h) the accumulated emissions of N2O between two time points (t) were calculated by linear interpolation of gas concentration using the formula (2). Then, the cumulative emissions of the whole sampling period of 19 days were calculated summing the emissions from each time interval (Shen et al., 2018, 2019).
(3) Alongside with the gas measurements, soil samples were taken every third day to analyze the ammonium (NH) and nitrate (NO) concentration in soil over the measurement period (Byrnes et al., 2017). The protocol for quantitation of NH and NO was described in Villegas et al. (2020). Additionally, daily soil water content and temperature were recorded and water-filled pore space (WFPS) was calculated assuming a particle density of 2.63 and using the formula:
,
WFPS: Water-filled pore space, Θv: Volumetric soil water content, Tp: Total porosity (Bulk density/Particle density).
The calculation of the N2O-N emission factors (EF) for the IG and NSPG areas of HSJ was calculated using the following equation:
(4)
Statistical analysis
The statistical analysis of data was run considering a completely randomized design with five pseudo-replicates in each evaluated area. The use of pseudo-replicates is a procedure commonly applied in ecological studies and it is described in detail by Hurlbert (1984). Two-way analysis of variance (ANOVA) was applied to the results regarding SOC stocks considering pasture type and soil depth as fixed factors. The Tukey HSD test (α = 0.05) was applied to the comparison of mean values between the areas evaluated in each case study. All statistical analyses were run using the “r-companion” package of the R software. Figures were constructed using the “ggplot2” package of R and the software SigmaPlot v14.
Results
Soil bulk density, SOC content and SOC stocks
Both PG and IG areas showed the same pattern of SOC content and BD over the different soil layers. The highest SOC content was found in the upper 0–5 cm soil layer (32.7 g kg−1) with a decrease in the deeper layers (11.6 g kg−1). These values were higher under IG compared to PG. Soil BD values showed an opposite tendency compared to SOC contents, with results showing an increase with soil depth (from 1.19 to 1.5 g cm−3) and the values were lower under IG compared to PG (Figure 2).
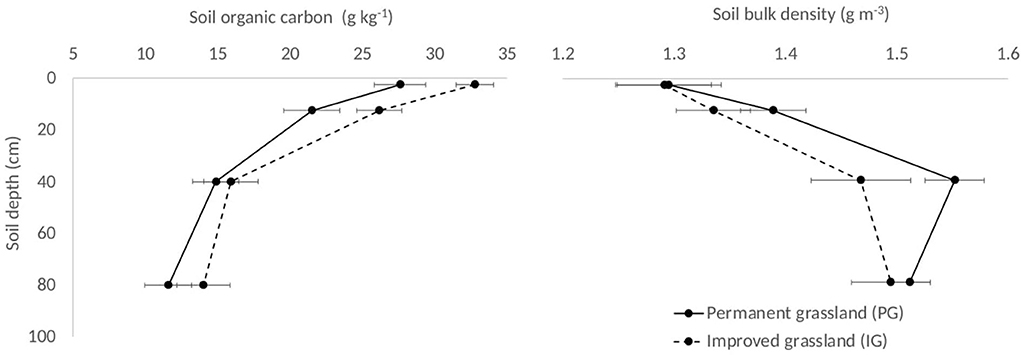
Figure 2. Soil carbon content (g kg−1) and soil bulk density (g cm−3) of soil layers in two grassland areas at Hacienda San Jose, Colombia.
The estimated total SOC stocks of the 0–100 cm layer were 224.8 and 259.0 Mg C ha−1 for the PG and IG, respectively (Figure 3). In both PG and IG areas, close to 10 and 30% of the total SOC stock (0–100 cm) was found in the top 0–5 cm (17.9 and 21.2 Mg C ha−1) and 0–20 cm soil layers (62.6 and 75.7 Mg C ha−1), respectively (Figure 3). The SOC stock (0–100 cm) was 15% higher in IG compared to the PG (224.8 and 259.0 Mg C ha−1), however, significant differences were only found in the upper soil layers, 0–5 and 0–20 cm. Differences between treatments suggested an SOC accumulation, over ~6.5 years, of 3.3 and 13.1 Mg C ha−1 or 0.5 and 2.0 Mg C ha−1 y−1 in the 0–5 and 0–20 cm soil depths, respectively.
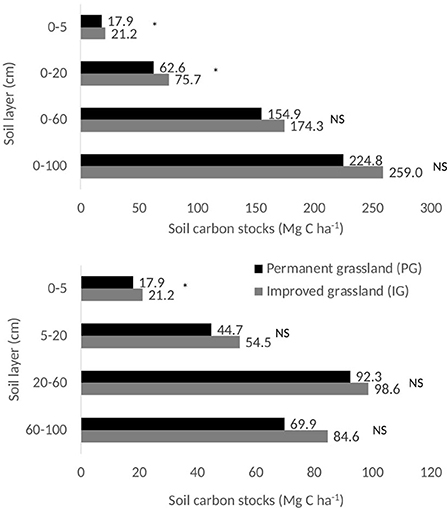
Figure 3. Soil carbon stocks (Mg C ha−1) of soil layers in two grassland areas at Hacienda San Jose, Colombia. Asterisk (*) represent significant differences according to the Tukey HSD test at 5% level. NS, non-significant.
The introduction and management (i.e., rotational grazing) of U. humidicola in previous PG areas influenced the SOC storage of the IG area probably through its more abundant and recalcitrant root system, which may have increased the amount of aboveground and belowground dead material (litter) returning to soil, including greater distribution of root system in deeper soil layers that was able to even reduce soil compaction (Figure 2). Compared to literature values for PG vegetation, field evaluations at HSJ show that forage dry matter (DM) production in IG was 14% higher annually than PG (7.2 vs. 6.3 t DM ha−1 y−1) and almost 8 times higher in the dry season (2.5 vs. 0.3 t DM ha−1) (Figure 4).
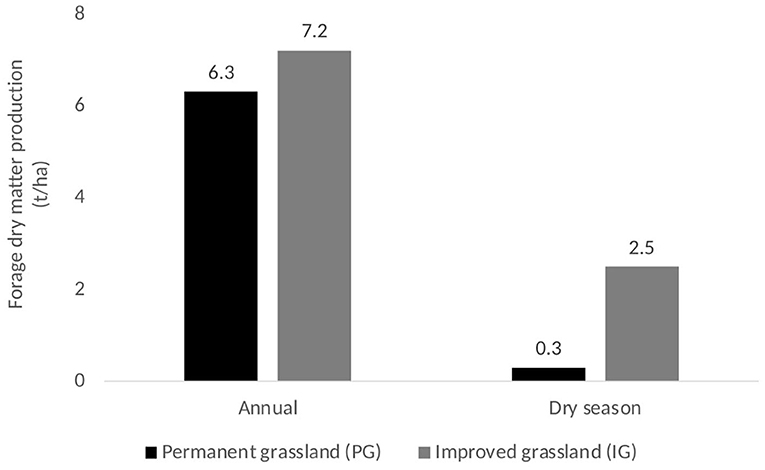
Figure 4. Forage dry matter (DM) in two grassland areas at Hacienda San Jose, Colombia.
N2O emissions
During the whole sampling period, daily N2O emissions were continuously higher in the PG compared to the IG (Figure 5A). The accumulated emissions in the PG were significantly higher (4.04 mg N2O urine patch−1) than from the IG (1.99 mg N2O urine patch−1) (Figure 5B). The largest difference observed in the emissions of both pastures occurred in the second day of measurements (i.e. about 24 h after urine application), when the emissions in the PG were of 371 μg N2O, whereas the emissions in the IG were 67 μg N2O.
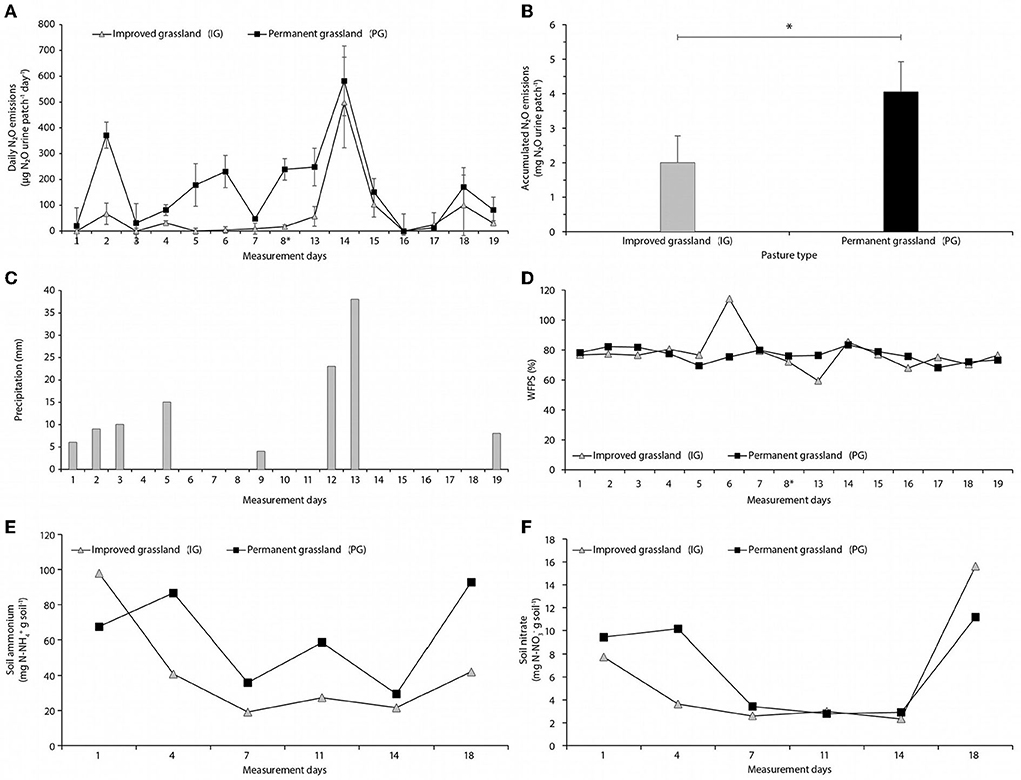
Figure 5. (A) Daily N2O fluxes. (B) Accumulated N2O emissions. (C) Daily precipitation. (D) Water-filled pore space. (E) Ammonium content in soil. (F) Nitrate content after urine application over a period of 19 days in two grassland areas at Hacienda San Jose, Colombia. Asterisk (*) represent significant differences according to the Tukey HSD test at 5% level.
Over the 19 day-measurement period, the accumulated precipitation in the field was 113 mm, mostly distributed during the first 5 days, and in days 12–13 (Figure 5C). The peaks of N2O emissions were consistent with the precipitation events observed. However, despite little rain was recorded during days 6–11 (4 mm), in the PG the daily N2O emissions were sustained at high levels of around 191 μg N2O day−1, whereas emissions from the IG were in the level of 22 μg N2O day−1. The emission factor (EF) calculated for the emission of N2O from urine patches in improved pasture of U. humidicola in HSJ was 0.05 mg N-N2O mg N−1.
Although the water-filled pore space (WFPS) was more variable in the IG than the PG (e.g., at one point the WFPS was over 100% because the paddock was flooded), there was virtually no difference in the average of both pastures along the measurement period (76% for PG and 77% for IP) (Figure 5D).
The NH concentration in soil before the urine application was 45% higher in the IG than in the PG. However, after the simulation of the urination event, the NH concentration of soil in the PG was continuously higher by a factor of 1.3 to 2.2 (Figure 5E). On the other hand, the NO concentration in PG soil was higher than in the IG during the first 7 days, followed by a period in which there was little difference between both pastures, and showing higher soil NO in the IG by the end of the sampling period (Figure 5F).
Discussion
Soil carbon stocks and N2O emissions
The SOC stocks measured in this work (>200 Mg C ha−1) are the high-end values when compared to other studies for the same land use, management and soil depth (0–100 cm). For example, Fisher et al. (1994) measured ~200 Mg C ha−1 researching in the same region as this work. Corazza et al. (1999) found 150 Mg C ha−1 in soils cultivated with Urochloa decumbens pasture in the Brazilian savanna and Batlle-Bayer et al. (2010) reported SOC stocks of 123–209 Mg C ha−1 in different types of Brazilian savannas.
The rates of SOC accumulation (~2.0 Mg C ha−1 y−1 for the 0–20 cm and ~5.5 Mg C ha−1 y−1 for the 0–100 cm), were also in the high-end values found in the literature, including those in the Orinoquia region. Out of 115 studies evaluating SOC stock changes in introduced pasturelands globally, Conant et al. (2001) found in 74% of the cases an increase in SOC between 0.11 and 3.04 Mg C ha−1 y−1, but just 35% of those cases showed significant differences. In a recent review, Bai and Cotrufo (2022) estimated that the achievable annual SOC sequestration potential in global grasslands is 0.6–2.0 Mg C for biodiversity restoration, 40.3–190.5 Mg C for improved grazing management, and 40.1 Mg C for sown legumes in pasturelands.
Discrepancies may be attributed to differences in climate, soil texture, pasture management, forage grass type and time of implementation as well as soil sampling design and SOC stock calculation (e.g., correction for the same soil mass) (Ayarza et al., 2022).
After ~7 years of U. humidicola establishment over PG on the same eastern plains of the Colombia's Orinoquía region, Fisher et al. (1994) estimated a lower SOC accumulation of ~1.0 Mg C ha−1 y−1 for the 0–20 cm soil layer in a clay loam soil, but a similar rate when considering deeper soil layers (~4.0 Mg C ha−1 y−1 for 0–80 cm). Another similar study evaluating 9 farms under different management conditions in the Orinoquía region reported much lower rates of ~0.4 (0–20 cm) and ~1.0 Mg C ha−1 y−1 (0–100 cm) with ~29 years-old pasture of U. humidicola compared to PG (CIAT-Agrosavia; unpublished data). The authors suggested that the higher SOC accumulation in the first study (Fisher et al., 1994) was related to adequate management of the introduced pasture under experimental condition (e.g., with maintenance fertilization and rotational grazing), which did not have the same type of management practices in the second case (CIAT-Agrosavia; unplished data). The management in the second case mainly in terms of pasture and animal management practices (i.e. continuous open grazing and savanna burning) has probably prevented the improved pasture grass from efficient nutrient cycling and, therefore, might have reduced the amount of belowground and aboveground organic residues going back into soil (Fisher et al., 2007; Ayarza et al., 2022).
Although the IG evaluated in this work did not receive any maintenance fertilization after establishment, the higher SOC storage rate found in this work could have also been favored by the higher clay content of the silty clay loam soils in the sampled area (~40% of clay content; Table 2), which represents ~16% of the Orinoquía region area only (Álvarez and Rincón, 2010). The majority of the area would have <25% clay content (medium texture soil), and therefore has less potential to store large amounts of SOC. The relationship between SOC and soil texture have been attributed to a chemical stabilization of SOC by soil clay/mineral surface (Feller and Beare, 1997). These relations suggest that clayey soils have more potential for SOC storage than sandy soils and, therefore, the percentage of clay content is a good predictor of SOC content and its potential accumulation (Ayarza et al., 2022). Differences in SOC storage rate can be further associated with climatic differences, where high temperatures and rainfall evenly distributed in Colombia favor U. humidicola to root deeply and, consequently, store more SOC (Fisher et al., 2007). The higher plant biomass productivity in IG (Figure 4), together with the introduction of more grazing animals depositing urine and dung have likely added extra deposition of organic residues, especially on the soil surface, with subsequent percolation into the soil profile (Fisher et al., 2007).
In the Brazilian savanna (Cerrado region), SOC storage rates with the introduction of improved pasture sepcies were also more conservative than the level observed in this study. Bustamante et al. (2006), reported that the conversion of native vegetation to pasture showed a mean SOC accumulation of 1.23 Mg C ha−1 y−1 (from −0.9 to 3.0 Mg C ha−1 y−1). Maia et al. (2009) observed variations in SOC after conversion of native vegetation (Cerrado and Amazon Forest) into pasture of −0.28 Mg C ha−1 y−1 (degraded pastures), 0.03 Mg C ha−1 y−1 (non-degraded pastures) and 0.61–0.72 Mg C ha−1 y−1 (improved pasture) (0–20 cm). Modeling (DayCent) impacts on SOC by improving and diversifying pasture management in Brazil (e.g., integrated crop-livestock and forest-livestock systems), Damian et al. (2021) estimated an increase in SOC of 0.04–0.95 Mg C ha−1 y−1. Braz et al. (2013), comparing the SOC stocks under native Cerrado vegetation, productive pasture, and degraded pastures in Brazil, reported that SOC stocks (under native Cerrado and pastures) increased with increasing clay content (from 55 to 117 Mg C ha−1 in soils with 11 and 67% clay content, respectively). The authors estimated a rate of SOC accumulation (0–100 cm) by recovering and improving pasture management from 0.25 to 2.95 Mg C ha−1 yr−1, over periods of up to 9 years.
Although the larger amount of root biomass and its turnover observed in the Brazilian Cerrado, possible due to lower values of soil bulk density in this region compared with the Lanos region (Ayarza et al., 2022), the greater rates of SOC accumulation observed in the Llanos by Fisher et al. (1994) may be due to its longer wet season, combined with relatively poorer drainage in the soils. These differences in soil and climatic conditions may slow down the decomposition of residues from both aboveground and belowground in the Llanos region (Fisher et al., 2007), thereby favoring higher SOC accumulation rates (up to 11.7 Mg ha−1 y−1) mostly in the form of particulate organic carbon (POC) compared to the Cerrado region (up to 7.0 Mg ha−1 y−1) (Ayarza et al., 2022). However, further field measurements are necessary in both regions to better understand the soil and climate interactions on SOC dynamics in terms of POC as well as mineral-associated organic carbon (MOAC).
Furthermore, the introduction of U. humidicola is relatively recent (6.5 years) and its soil is likely to be still developing its SOC storage curve, although accrual potentials remain unclear. Therefore, we may expect significant changes in SOC stocks occurring in deeper soil layers in the coming years (below 20 cm soil depth) if the current management continues or improves. Otherwise, stored SOC could decline over time in the absence of adequate management (Fisher et al., 2007; Ayarza et al., 2022). The IPCC guidelines assume 20 years as the default period in which new SOC stocks approach a new steady-state—which also enables comparison of results between regions and countries and with other estimation methods (IPCC, 2019). Nevertheless, a meta-analysis of field studies has suggested that SOC sequestration can continue for over 40 years before reaching a new equilibrium (Minasny et al., 2017), which depends on management practices, soil type and climate conditions (e.g., rainfall and temperature).
High rates of SOC accumulation found in this work, although in line with previous study in the region (Fisher et al., 1994), may also raise the question of the adequacy of the soil sampling design to accurately detect SOC changes as well as how long this situation can be sustained for. Although the soil sampling approach used in this work has been applied in several other SOC evaluations (Maia et al., 2009; Carvalho et al., 2010), as described above, future research could investigate the effect of land stratification in assessing the SOC variation and reducing uncertainties (World Bank, 2021).
Carbon sequestration in agricultural land has been widely acknowledged as a strategy to mitigate climate change. However, recent studies (both measuring and modeling soil organic C and N dynamics) have reported that alongside with increase in SOC accumulated, N2O emissions are likely to increase and may offset the C sequestered, either partially or even implying a surplus of Ceq emissions with respect to the baseline scenario (Li et al., 2005; Qiu et al., 2009).
In managed pastures in the low-tropics, although fertilizer-N application is scarce, the excretion of N in the form of animal urine and dung represent hotspots of high nitrification-denitrification processes, the main responsible for N2O production (Dubeux and Sollenberger, 2020). Considering the aforementioned hypothesis of SOC sequestration and N2O emissions trade-off, we evaluated the N2O emissions of two grassland areas in HSJ simulating an event of urine deposition during the rainy season. Our results indicated a correlation between grassland improvement (introduction of U. humidicola combined with a rotational grazing system) and the reduction of N2O emissions, which were halved compared to the PG.
Studies of Subbarao et al. (2007, 2009) determined that U. humidicola is one of the forage grasses with highest capacity of biological nitrification inhibition (BNI). BNI consist in the root exudation of “brachialactone,” a compound that inhibits nitrification, the microbial oxidation of NH into NO. As N2O is produced mainly via nitrification-denitrification dynamics, BNI is considered a potent strategy to mitigate N2O emissions in pasture systems. Indeed, this hypothesis was validated by field measurements comparing the N2O emissions in urine patches in the high-BNI grass U. humidicola CIAT 679 and the low-BNI Urochloa hybrid cv. Mulato, where the U. humidicola pasture showed potential to reduce about 60% of N2O emissions (Byrnes et al., 2017).
According to Wang et al. (2021) urine patches may be highly heterogeneous in space and time, and animal movement inside the paddock plays an important role e.g., increasing urine concentration near water tanks and gates. In the absence of fertilizer-N, manure accumulation becomes one of the main sources to enrich the soil N pool in grazed pastures (Byrnes et al., 2017; Dubeux and Sollenberger, 2020), thus, uneven distribution of deposited manure may lead to N2O “hotspot” areas. The experimental design used in our study, where soil static chambers were distributed randomly throughout the paddocks, although allowed to identify significant differences in the cumulative emissions between pasture management strategies might lead to underestimation of the gross N2O emissions in the IG. Future studies using the static chamber method in urine patches need to increase the sampling effort in paddock sites with higher occurrence of cattle.
Comparison with IPCC default values
The SOC stock found in PG represents 79.9 Mg C ha−1 for the 0–30 cm soil depth (regression analysis not shown), which is almost 40% higher than the reference default value for this climate zone and soil type provided by the IPCC (52 ± 6% Mg C ha−1; IPCC, 2019). Using the IPCC Tier 2 SOC stock change method to estimate SOC sequestration with improved practices, using an adjusted reference SOC stock (from 52 to 79.9 Mg C ha−1) (IPCC, 2019), we estimated a total SOC accumulation of 13.6 Mg C ha−1 for the 0–30 cm of the IG, which is similar to the value found in this work (12.7 Mg C ha−1 for the 0–30 cm). However, according to the IPCC (2019), this level of SOC accumulation would be expected in 20-year time (equivalent to a new steady-state for this stock). Here we estimated that this change was achieved just after 6 years.
The IPCC Tier 1 emission factor for urine deposited on grazed forages is 2% with an uncertainty range of 0.7–6% (IPCC, 2006, 2019). Although the emission factors of this short-term study (5%) were within the uncertainty range of the IPCC Tier 1 emission factor, several other trials conducted under tropical conditions (e.g., Argentina, Brazil, Colombia, Nicaragua, Trinidad and Tobago, and Kenya) have reported much lower N2O emissions range (0.01–1.2%) (Tully et al., 2017; Chirinda et al., 2019). We argue that there might be biases associated with the short-term monitoring of the N2O emissions (<20 days). In addition, it is important to notice that the urine N concentrations observed in the samples obtained in the farm and analyzed at CIAT yielded extraordinarily low N values. Whereas, other authors have reported that normal ranges of urine N are around 1 to 10 g N L−1 (Simon et al., 2020), the N concentration measured in this sample was considerably lower than 1 g N L−1. The analysis of N concentration in urine samples stored for various days proved to be challenging as N can be easily vaporized.
Results of this work suggest that improving grasslands in the region, besides enhancing SOC stocks, may also reduce emission of N2O from animal urine patches. This fact may help reduce the overall carbon footprint of beef production, especially if the animal stocking rates or emissions from additional sources of the production systems are kept constant. Furthermore, these results also underscore not only the importance of field measurements to improve local-specific SOC and GHG emissions data, but also the necessity of a systematic monitoring system for better understanding and validating findings (e.g., SOC stock variations) over time.
Conclusions
Although subsequent measurements over time are critical to better understanding the GHG emissions and SOC dynamics in the region, we conclude that improved grasslands (IG) achieved through the introduction of an improved pasture species under rotational grazing with U. humidicola into permanent grasslands (PG) in the Orinoquía region of Colombia increased SOC stocks of the topsoil layer (0–20 cm), with a tendency to increment SOC stocks at deeper soil layers (0–100 cm), and reduced N2O emissions from cattle urine deposition.
The large SOC accumulation capacity in IG in clay loam soils in the Orinoquía region (~2 Mg C ha−1 y−1) and the reduced N2O emissions from animal urine deposition on pastures (10 times), while increasing production of food (i.e., meat and milk), may be attractive for land-based GHG removal projects and also climate finance opportunities. However, to build the case for beef production in the region for climate finance, future research must focus on understanding the impact of other critical emissions sources from livestock systems (e.g., especially from enteric fermentation) in the net emissions of the production systems, as well as on other socio-environmental safeguards (e.g., avoided deforestation, effect of pasture species improvement on biodiversity).
This research provides valuable information for future monitoring of GHG emissions and land-based GHG removals under different grasslands in the Colombia's Orinoquia region for low emissions development in beef cattle production systems. We also expect findings from this research to contribute toward reducing uncertainties in future assessments of the importance of improving grassland management to achieve global climate commitments.
Data availability statement
The raw data supporting the conclusions of this article will be made available by the authors, without undue reservation.
Author contributions
CC, JA, DV, NM-R, MB, and IR conceived of the study. DV and MB carried out the field measurements. CC, DV, and MB carried out the modeling. All authors led the writing of the paper, contributed to the article, and approved the submitted version.
Funding
This study was co-financed by the World Bank Group with the following projects Livestock sector readiness to access climate finance, the BioCF project under the Initiative for Sustainable Forest Landscapes (ISFL), Developing Climate-Smart Agriculture Supply Chains: Opportunities, Challenges and Emerging Lessons and the IFC BioCF project under the Initiative for Sustainable Forest Landscapes (ISFL), MAS Advisory Services in Colombia. This study was also done as part of the One CGIAR initiative on Livestock, System and Climate Resilience (LSCR), the One CGIAR Sustainable Finance, and the Bezos Earth Fund project-Using genetic diversity to capture carbon through deep root systems in tropical soils.
Conflict of interest
The authors declare that the research was conducted in the absence of any commercial or financial relationships that could be construed as a potential conflict of interest.
Publisher's note
All claims expressed in this article are solely those of the authors and do not necessarily represent those of their affiliated organizations, or those of the publisher, the editors and the reviewers. Any product that may be evaluated in this article, or claim that may be made by its manufacturer, is not guaranteed or endorsed by the publisher.
References
Álvarez, M., and Rincón, A. (2010). “Características agroecológicas de la Orinoquía Colombiana,” in Establecimiento, Manejo Y Utilización de Recursos Forrajeros en Sistemas Ganaderos de Suelos Ácidos, Eds A. Rincón and C. Jaramillo (Villavicencio: Corporación Colombiana de investigación agropecuaria (CORPOICA)), 252.
AOAC (1990). Protein (Crude) Determination in Animal Feed: Copper Catalyst Kjeldahl Method 984.13, 15th Edn. Official Methods of Analysis of AOAC International, Gaithersburg.
Ayarza, M. A., Rao, I., Vilela, L., Lascano, C., and Vera-Infanzón, R. (2022). Soil carbon accumulation in crop-livestock systems in acid soil savannas of South America: a review. Adv. Agron. 173, 163–226. doi: 10.1016/bs.agron.2022.02.003
Bai, Y., and Cotrufo, M. F. (2022). Grassland soil carbon sequestration: current understanding, challenges, and solutions. Science 377, 603–608. doi: 10.1126/science.abo2380
Batlle-Bayer, L., Batjes, N. H., and Bindraban, P. S. (2010). Changes in organic carbon stocks upon land use conversion in the Brazilian Cerrado: a review. Agric. Ecosyst. Environ. 137, 47–58. doi: 10.1016/j.agee.2010.02.003
Braz, S. P., Urquiaga, S., Alves, B. J. R., Jantalia, C. P., Guimarães, A. P., dos Santos, S. C., et al. (2013). Soil carbon stocks under productive and degraded Brachiaria pastures in the Brazilian Cerrado soil sci. Soc. Am. J. 77, 914–928. doi: 10.2136/sssaj2012.0269
Bustamante, M. M. C., Corbeels, M., Scopel, E., and Roscoe, R. (2006). “Soil carbon storage and sequestration potential in the Cerrado region of Brazil,” in Carbon Sequestration in Soils of Latin America, eds R. Lal, C. C. Cerri, M. Bernoux, J. Etcherves, and C. E. P. Cerri (New York, NY: Food Products Press), 285–304.
Byrnes, R. C., Nùñez, J., Arenas, L., Rao, I., Trujillo, C., Alvarez, C., et al. (2017). Biological nitrification inhibition by Brachiaria grasses mitigates soil nitrous oxide emissions from bovine urine patches. Soil Biol. Biochem. 107, 156–163. doi: 10.1016/j.soilbio.2016.12.029
Carvalho, J. L. N., Raucci, G. S., Cerri, C. E. P., Bernous, M., Feigl, B. J., Wruck, F. J., et al. (2010). Impact of pasture, agriculture and crop-livestock systems on soil C stocks in Brazil. Soil Till. Res. 110, 175–186. doi: 10.1016/j.still.2010.07.011
Carvalho, J. L. N., Raucco, G. S., Frazao, L. A., Cerri, C. E. P., Bernoux, M., and Cerri, C. C. (2014). Crop-pasture rotation: a strategy to reduce soil greenhouse gas. Agric. Ecosyst. Environ. 183, 167–175. doi: 10.1016/j.agee.2013.11.014
Chirinda, N., Loaiza, S., Arenas, L., Ruiz, V., Faverín, C., Alvarez, C., et al. (2019). Adequate vegetative cover decreases nitrous oxide emissions from cattle urine deposited in grazed pastures under rainy season conditions. Sci. Rep. 9:908. doi: 10.1038/s41598-018-37453-2
Conant, R. T., Paustian, K., and Elliott, E. T. (2001). Grassland management and conversion into grassland: effects on soil carbon. Ecol. Appl. 11, 343–355. doi: 10.1890/1051-0761(2001)0110343:GMACIG2.0.CO;2
Corazza, E.J., Silva, J.E., Resck, D.V. S., and Gomes, A.C. (1999). Comportamento de diferentes sistemas de manejo como fonte ou depõsito de carbono em relaçã ã vegetaçã de Cerrado. R. Bras. Ci. Solo. 23, 425–432. doi: 10.1590/S0100-06831999000200025
Costa, C. Jr., Corbeels, M., Bernoux, M., Piccolo, M. D. C., Neto, M. S., Feigl, B. E., et al. (2013). Assessing soil carbon storage rates under no-tillage: comparing the synchronic and diachronic approaches. Soil Till. Res. 134, 207–212. doi: 10.1016/j.still.2013.08.010
Costa, C. Jr., Seabaur, M., Schwarz, M., Dittmer, K., and Wollenberg, E. (2021). Scaling Soil Organic Carbon Sequestration for Climate Change Mitigation. Wageningen: CGIAR Research Program on Climate Change, Agriculture and Food Security (CCAFS). Available online at: https://hdl.handle.net/10568/114846 (accessed February 25, 2022).
Cusack, D., Kazanski, A. H., Chow, K., Cordeiro, A. L., Karpman, J., and Ryals, R. (2021). Reducing climate impacts of beef production: a synthesis of life cycle assessments across management systems and global regions. Glob. Change Biol. 27,1721–1736. doi: 10.1111/gcb.15509
Damian, J. M., da Silva Matos, E., e Pedreira, B. C., de Faccio Carvalho, P. C., Premazzi, L. M., Williams, S., et al. (2021). Predicting soil C changes after pasture intensification and diversification in Brazil. Catena 202:105238. doi: 10.1016/j.catena.2021.105238
DANE (2019). National Agricultural Survey. Available online at: https://www.dane.gov.co/index.php/en/statistics-by-topic-1/agricultural-sector (accessed March 12, 2022).
Dubeux, J. C. B., and Sollenberger, L. E. (2020). “Nutrient cycling in grazed pastures,” in Management Strategies for Sustainable Cattle Production in Southern Pastures, Eds M. Rouquette and G. E. Aiken (Oxford: Academic Press), 59–75.
Durango Morales, S. G., Barahona, R., Bolívar, D. M., Arango, J., Verchot, L., and Chirinda, N. (2021). Apparent nitrogen recovery in milk and early dry season nitrous oxide emission factors for urine deposited by dual-purpose cattle on different soil types. Front. Sustain. Food Syst. 4:602657. doi: 10.3389/fsufs.2020.602657
Ellert, B. H., and Bettany, J. R. (1995). Calculation of organic matter and nutrients stored in soils under contrasting management regimes. Can. J. Soil Sci. 75, 529–538. doi: 10.4141/cjss95-075
FAO (2017). Global Livestock Environmental Assessment Model (GLEAM). Rome. Available online at: www.fao.org/gleam/en/ (accessed January 20, 2022).
FAO-Stat (2021). Food and Agriculture Data 2021. Food and Agriculture organization of the United Nations (FAO). Available online at: www.fao.org/faostat/en/#data (accessed January 20, 2022).
Feliciano, D., Ledo, A., Hillier, J., and Nayak, D. R. (2018). Which agroforestry options give the greatest soil and above ground carbon benefits in different world regions? Agri. Ecosyst. Environ. 245, 117–129. doi: 10.1016/j.agee.2017.11.032
Feller, C., and Beare, M. H. (1997). Physical control of soil organic matter dynamics in tropical land-use systems. Geoderma 79, 49–67. doi: 10.1016/S0016-7061(97)00039-6
Figueiredo, E. B., Jayasundara, S., Bordonal, R. O., Berchielli, T. T., Reis, R. A., Wagner-Riddle, C., et al. (2017). Greenhouse gas balance and carbon foot- print of beef cattle in three contrasting pasture-management systems in Brazil. J. Clean. Prod. 142, 420–431. doi: 10.1016/j.jclepro.2016.03.132
Fisher, M. J., Braz, S. P., dos Santos, R. S. M., Urquiaga, S., Alves, B. J. R., and Boddey, R. M. (2007). Another dimension to grazing systems: soil carbon. Trop. Grassl. 41, 65–83. Available online at: https://cgspace.cgiar.org/handle/10568/43186
Fisher, M. J., Rao, I. M., Ayarza, M. A., Lascano, C. E., Sanz, J. I., Thomas, R. J., et al. (1994). Carbon storage by introduced deep-rooted grasses in the South American savannas. Nature 371, 236–238. doi: 10.1038/371236a0
Griscom, B., Adams, J., Ellis, P., Houghton, R., Lomax, G., Miteva, D., et al. (2017). Natural climate solutions. Proc. Natl. Acad. Sci. 114, 11645–11650. doi: 10.1073/pnas.1710465114
Henry, S., Texier, S., and Hallet, S. (2008). Disentangling the rhizosphere effect on nitrate reducers and denitrifiers: insight into the role of root exudates. Environ. Microbiol. 10, 3082–3092. doi: 10.1111/j.1462-2920.2008.01599.x
Hurlbert, S. H. (1984). Pseudoreplication and the design of ecological field experiments. Ecol. Monogr. 54, 187–211. doi: 10.2307/1942661
ICA (2021). Censo Pecuario Nacional. ICA. Available online at: https://www.ica.gov.co/areas/pecuaria/servicios/epidemiologia-veterinaria/censos-2016/censo-2018 (accessed January 20, 2022).
IDEAM (2021). Consulta y Descarga de Datos Hidrometeorológicos. Available online at: http://www.ideam.gov.co/ (accessed April 20, 2022).
IPCC (2006). 2006 IPCCGuidelines for National Greenhouse Gas Inventories. Intergovernmental Panel on Climate Change (IPCC). Available online at: https://www.ipcc-nggip.iges.or.jp/public/2006gl/ (accessed April 20, 2022).
IPCC (2019). 2019 Refinement to the 2006 IPCCGuidelines for National Greenhouse Gas Inventories. Intergovernmental Panel on Climate Change (IPCC). Available online at: https://www.ipcc-nggip.iges.or.jp/public/2019rf/index.html (accessed April 20, 2022).
Jia, G., Shevliakova, E., Artaxo, P., Noblet-Ducoudré, N. D., Houghton, R., House, J., et al. (2019). “Land-climate interactions,” in Climate Change and Land: An IPCC Special Report on Climate Change, Desertification, Land Degradation, Sustainable Land Management, Food Security, and Greenhouse Gas Fluxes in Terrestrial Ecosystems.
Kell, D. B. (2011). Breeding crop plants with deep roots: their role in sustainable carbon, nutrient and water sequestration. Ann. Bot. 108, 407–418. doi: 10.1093/aob/mcr175
Li, C., Frolking, S., and Butterbach-Bahl, K. (2005). Carbon sequestration in arable soils is likely to increase nitrous oxide emissions, offsetting reductions in climate radiative forcing. Clim. Change 72, 321–338. doi: 10.1007/s10584-005-6791-5
Li, G., Cai, J., Song, X., Pan, X., Pan, D., Jiang, S., et al. (2022). Herbivore grazing mitigates the negative effects of nitrogen deposition on soil organic carbon in low-diversity grassland. J. Appl. Ecol. 59, 483–491. doi: 10.1111/1365-2664.14066
Maia, S. M. F., Ogle, S. M., Cerri, C. E. P., and Cerri, C. C. (2009). Effect of grassland management on soil carbon sequestration in Rondônia and Mato Grosso states, Brazil. Geoderma 149, 84–91. doi: 10.1016/j.geoderma.2008.11.023
Minasny, B., Malone, B. P., and McBratney, A. B. (2017). Soil carbon 4 per mille. Geoderma. 292, 59–86. doi: 10.1016/j.geoderma.2017.01.002
Paustian, K., Collier, S., Baldock, J., Burgess, R., Creque, J., DeLonge, M., et al. (2019). Quantifying carbon for agricultural soil management: from the current status toward a global soil information system. Carbon Manag. 21, 567–587. doi: 10.1080/17583004.2019.1633231
Peñuela, L., Solano, C., Ardila, V., and Galán, S. (Eds.). (2014). Sabana Inundable y Ganadería, Opción Productiva de Conservación en la Orinoquia. Asociación Red Colombiana de Reservas Naturales de la Sociedad Civil (RESNATUR); Fundación Natura (FN); World Wildlife Fund (WWF); The Nature Conservancy (TNC); Parques Nacionales Naturales de Colombia (PNN). Colombia (Conservación de la biodiversidad en predios productivos. 3).
Qiu, J. J., Wang, L. G., Hu, L., Tang, H. J., Li, C. S., and Van Ranst, E. (2009). Modeling the impacts of soil organic carbon content of croplands on crop yields in China. Agric. Sci. China 8, 464–471. doi: 10.1016/S1671-29270860233-3
Rao, I. M., Plazas, C., and Ricaurte, J. (2001). “Root turnover and nutrient cycling in native and introduced pastures in tropical savannas,” in Plant Nutritions: Food Security and Sustainability of Agro-Ecosystems Through Basic and Applied Research, Eds W. J. Horst, M. K. Schenk, A. Burkert, N. Claassen, H. Flessa, W. B. Frommer, et al. (Dordrecht: Kluwer Academic Publishers), 976–7.
Robinson, A., Di, H. J., Cameron, K. C., Podolyan, A., and He, J. Z. (2014). The effect of soil pH and dicyandiamide (DCD) on N2O emissions and ammonia oxidizer abundance in a stimulated grazed pasture soil. J. Soils Sediments 14, 1434–1444. doi: 10.1007/s11368-014-0888-2
Roe, S., Streck, C., Beach, R., Busch, J., Chapman, M., Daioglou, V., et al. (2021). Land-based measures to mitigate climate change: potential and feasibility by country. Glob. Chang. Biol. 27, 6025–6058. doi: 10.1111/gcb.15873
Shen, J., Treu, R., Wang, J., Hao, X., and Thomas, B. W. (2019). Modeling growing season and annual cumulative nitrous oxide emissions and emission factors from organically fertilized soils planted with barley in Lethbridge, Alberta, Canada. Agric. Syst. 176:102654. doi: 10.1016/j.agsy.2019.102654
Shen, J., Treu, R., Wang, J., Nicholson, F., Bhogal, A., and Thorman, R. (2018). Modeling nitrous oxide emissions from digestate and slurry applied to three agricultural soils in the United Kingdom: fluxes and emission factors. Environ. PollutSci. Tot. Environ. 243, 1952–1965. doi: 10.1016/j.envpol.2018.08.102
Simon, P. L., Dieckow, J., Zanatta, J. A., Ramalho, B., Ribeiro, R. H., van der Weerden, T., et al. (2020). Does Brachiaria humidicola and dicyandiamide reduce nitrous oxide and ammonia emissions from cattle urine patches in the subtropics? Sci. Tot. Environ. 720:137692. doi: 10.1016/j.scitotenv.2020.137692
Subbarao, G. V., Nakahara, K., Hurtado, M. D. P., Ono, H., Moreta, D. E., Salcedo, A. F., et al. (2009). Evidence for biological nitrification inhibition in Brachiaria pastures. Proc. Nat. Acad. Sci. 106, 17302–17307. doi: 10.1073/pnas.0903694106
Subbarao, G. V., Rondon, M., Ito, O., Ishikawa, T., Rao, I. M., Nakahara, K., et al. (2007). Biological nitrification inhibition (BNI)—is it a widespread phenomenon?. Plant Soil 294, 5–18. doi: 10.1007/s11104-006-9159-3
Teutscherova, N., Vazquez, E., Arango, J., Arevalo, A., Benito, M., and Pulleman, M. (2019). Native arbuscular mycorrhizal fungi increase the abundance of ammonia-oxidizing bacteria, but suppress nitrous oxide emissions shortly after urea application. Geoderma 338, 493–501. doi: 10.1016/j.geoderma.2018.09.023
Tully, K. L., Abwanda, S., Thiong'o, M., Mutuo, P. M., and Rosenstock, T. S. (2017). Nitrous oxide and methane fluxes from urine and dung deposited on Kenyan pastures. J. Environ. Qual. 46, 921–929. doi: 10.2134/jeq2017.01.0040
Van Groenigen, J. W., Kuikman, P. J., De Groot, W. J. M., and Velthof, G. L. (2005). Nitrous oxide emission from urine treated soil as influenced by urine composition and soil physical conditions. Soil Biol. Biochem. 37, 463–473. doi: 10.1016/j.soilbio.2004.08.009
Villegas, D., Arevalo, A., Nuñez, J., Mazabel, J., Subbarao, G., Rao, I., et al. (2020). Biological Nitrification Inhibition (BNI): phenotyping of a core germplasm collection of the tropical forage grass megathyrsus maximus under greenhouse conditions. Front. Plant Sci. 11:820. doi: 10.3389/fpls.2020.00820
Wang, J., Li, Y., Bork, E. W., Richter, G. M., Chen, C., Hussain Shah, S. H., et al. (2021). Effects of grazing management on spatio-temporal heterogeneity of soil carbon and greenhouse gas emissions of grasslands and rangelands: monitoring, assessment and scaling-up. J. Clean. Prod. 288:125737. doi: 10.1016/j.jclepro.2020.125737
Wang, J., Sun, J., Yu, Z., Li, Y., Tian, D., Wang, B., et al. (2019). Vegetation type controls root turnover in global grasslands. Glob. Ecol. Biogeogr. 28, 442–455. doi: 10.1111/geb.12866
Wiese, L., Wollenberg, E., Alćantara-Shivapatham, V., Richards, M., Shelton, S., Hönle, S. E., et al. (2021). Countries' commitments to soil organic carbon in Nationally Determined Contributions. Clim. Policy 21, 1005–1019. doi: 10.1080/14693062.2021.1969883
World Bank (2021). Soil Organic Carbon MRV Sourcebook for Agricultural Landscapes. Washington, DC: World Bank. Available online at: https://openknowledge.worldbank.org/handle/10986/35923 (accessed April 21, 2022).
Keywords: soil organic matter, improved pasture, natural vegetation, carbon sequestration, sustainable livestock farming
Citation: Costa C Jr, Villegas DM, Bastidas M, Matiz-Rubio N, Rao I and Arango J (2022) Soil carbon stocks and nitrous oxide emissions of pasture systems in Orinoquía region of Colombia: Potential for developing land-based greenhouse gas removal projects. Front. Clim. 4:916068. doi: 10.3389/fclim.2022.916068
Received: 11 April 2022; Accepted: 11 August 2022;
Published: 13 September 2022.
Edited by:
Junye Wang, Athabasca University, CanadaReviewed by:
Magda Aparecida De Lima, Brazilian Agricultural Research Corporation (EMBRAPA), BrazilLarissa Teodoro, Federal University of Mato Grosso Do Sul, Brazil
Copyright © 2022 Costa, Villegas, Bastidas, Matiz-Rubio, Rao and Arango. This is an open-access article distributed under the terms of the Creative Commons Attribution License (CC BY). The use, distribution or reproduction in other forums is permitted, provided the original author(s) and the copyright owner(s) are credited and that the original publication in this journal is cited, in accordance with accepted academic practice. No use, distribution or reproduction is permitted which does not comply with these terms.
*Correspondence: Ciniro Costa Jr., c.costajr@cgiar.org