Contents
1. Summary
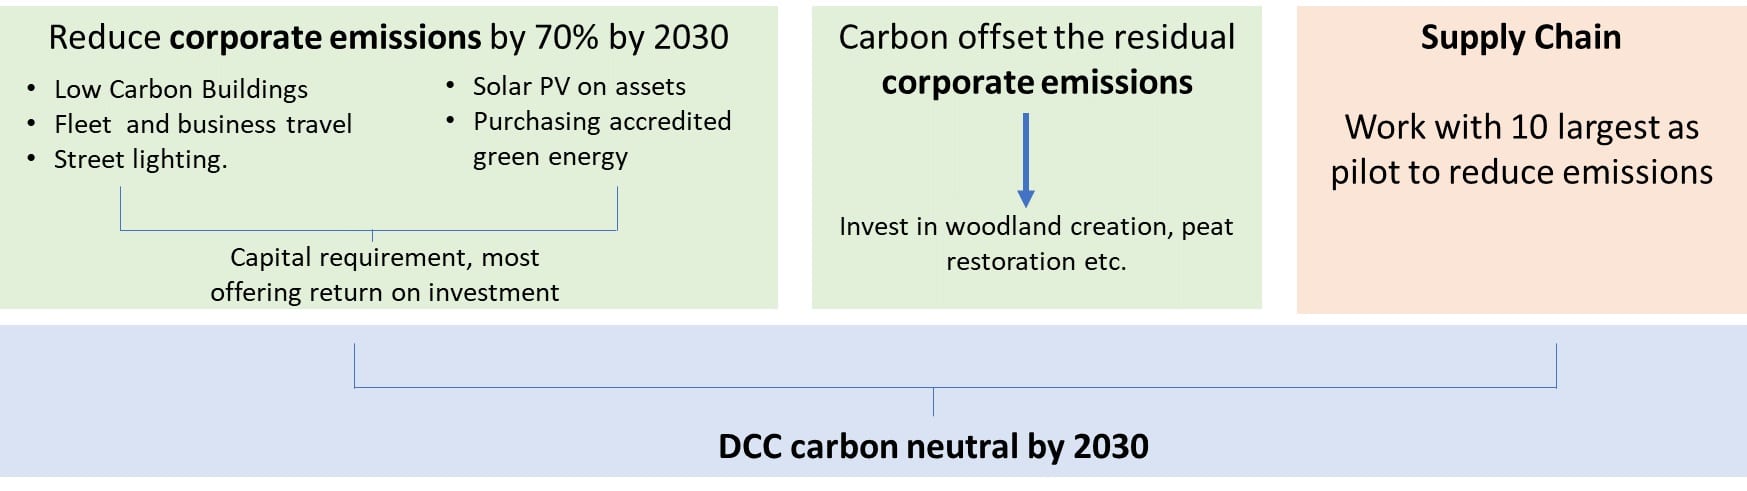
On the 9th December 2019, DCC set a target for its activities to be carbon neutral by 2030 in response to it signing the Devon Climate Declaration. This target is based on a realistic review of opportunities for decarbonisation. Figure 1 shows the strategic approach between 2020 and 2030.
The council will:
• Reduce the 2012/13 corporate carbon footprint by 70% by 2030/31, as a minimum
• Retain the existing target to source 30% of its total corporate energy requirement from renewable sources by 2030/31
• Incrementally increase the percentage of the remaining carbon footprint that is offset, from 5% in the current year to 100% by 2030/31
• Engage with contract providers to reduce carbon emissions from their operations and offset the remainder by 2030/31. As a first step, the council will engage the ten highest-value contract providers.
• Offset residual emissions from the supply chain from the year 2030 onwards.
The necessary revenue funding for 2021/22 and capital funding for 2021/22 and 2022/23 has been allocated to begin implementing this Plan.
2. Introduction
2.1. The Devon Climate Emergency
In February 2019 Devon County Council (DCC) declared a climate emergency and in May of the same year brought together partners from across the county to form the Devon Climate Emergency project. The 27 partners prepared the Devon Climate Declaration, which requires its signatories to review their plans (within 6 months) to reduce their own organisation’s carbon emissions. DCC signed the Declaration on the 12th June 2019.
2.2. Purpose of this Plan
On the 9th December 2019, DCC set a target for its activities to be carbon neutral by 2030/31 (as monitored by the corporate and supply chain carbon footprints – see Section 3). This document provides further detail about how this target will be achieved and describes the approach for facilitating a reduction of emissions from school buildings and county farm dwellings.
It replaces the council’s previous Energy Strategy and Action Plan of 2014.
Note that the term ‘carbon’ throughout this document refers to a basket of greenhouse gases, not just carbon dioxide, and is a term used for simplicity.
3. Carbon Emissions
3.1. The Council’s Carbon Footprint
DCC’s carbon emissions are reported through two, separate carbon footprints: Its Corporate Carbon Footprint and its Supply Chain Carbon Footprint.
3.1.1. Corporate Carbon Footprint
These are the emissions associated with the buildings, vehicles and street lighting that the council operates. It does not include any procured goods or commissioned services, other than for school transport; this is because robust data has been available for many years from these contracts.
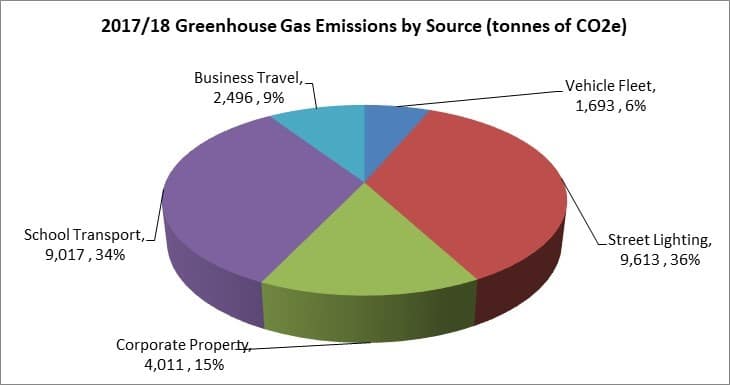
The components of DCC’s corporate carbon footprint are shown in Figure 1. The council’s corporate carbon footprint was last calculated for the financial year 2017/18. The carbon footprint is about 27 ktCO2e.
3.1.2. Supply Chain Carbon Footprint
These are the emissions associated with goods that the council procures and the services that the council commissions.
The supply chain carbon footprint is currently calculated using nationally published carbon-intensity factors for different categories of purchasing rather than asking each of the thousands of suppliers to submit data to the council.
It is estimated to be 330 ktCO2e, which is about twelve times larger than the corporate carbon footprint.
3.2. Schools’ Carbon Footprint
The council monitors the energy consumption of local-authority maintained schools’ buildings. The carbon footprint associated with these in 2017/18 was 3,092 tCO2e.
These emissions are not part of the council’s carbon footprint because financial control and management decisions for many elements of building maintenance lies with the individual governing bodies.
3.3. County Farm Dwellings’ Carbon Footprint
The authority provides 65 tenanted county farm dwellings generally as starter businesses to enable new entrants into the farming sector. The carbon footprint of the 68 dwellings across these holdings is not monitored as the energy consumption and billing of that consumption is the responsibility of the tenant and is only shared directly with their preferred energy supplier.
4. The Carbon Reduction Strategy
4.1. The Council’s Carbon Footprint
On the 9th December 2019, DCC set a target for the corporate and supply chain carbon footprints to be carbon neutral by 2030/31. This followed a period of analysis in partnership with the University of Exeter to understand the effect of national policy, population growth and potential carbon-reduction initiatives on the council’s carbon footprint over the next decade.
Figure 2 shows the strategic approach over the period to 2030. This is described in more detail in the sections below.
4.1.1. Corporate Strategy
The council will:
• Reduce the 2012/13 carbon footprint by 70% by 2030/31, as a minimum
• Retain the existing target to source 30% of its total corporate energy requirement from renewable sources by 2030/31
• Incrementally increase the percentage of the remaining carbon footprint that is offset, from 5% in the current year to 100% by 2030/31
Offsetting will be the last resort. The offsetting of residual emissions will be implemented through independently verified projects in Devon wherever possible, most likely to be habitat restoration and creation to respond to the ecological emergency, but not exclusively; funding energy efficiency and renewable energy schemes may also be considered.
Emerging technologies and the opportunity for the market to provide new services to help with decarbonisation will be kept under review.
Key areas for action have been identified to achieve the 70% reduction in corporate emissions – low carbon buildings, fleet and business travel, street lighting, renewable energy on assets and sourcing energy from renewable sources. Many of the opportunities in these areas require additional capital and revenue commitments but generally provide a payback on investment.
4.1.2. Supply Chain Strategy
The council will:
• Engage with contract providers to reduce carbon emissions from their operations and offset the remainder by 2030/31. As a first step, the council will engage the ten highest-value contract providers.
• Offset residual emissions from the year 2030 onwards.
4.2. School Buildings’ Carbon Footprint
The council will use its role to facilitate the decarbonisation of local-authority-maintained schools in collaboration with local governance arrangements.
4.3. County Farm Dwellings’ Carbon Footprint
The council will use its role as a responsible landlord to improve the energy efficiency of the dwellings in the county farm’s estate.
4.4. Innovation
The authority will continue to take opportunities to evaluate and test new approaches and technologies for their ability to help contribute towards and exceed its targets. As leaders in this space it is accepted that not all of these new approaches will be successful first-time round; we are prepared to take managed risks, learn from failures and share our new knowledge with partners. This will be essential to achieve the targets.
In recent years the council has operated innovative projects that have increased its understanding and experience of: integrating LED lighting into the public realm; using the latest computing technology to enable flexible working; operating electric vehicles; sensitively incorporating renewable energy into listed properties; using air source heat pumps as heating technology; working with community organisations to deploy renewables on its assets; and installing batteries to better match the timing of renewable electricity generation with local demand.
4.5. A Note about Covid-19
This Plan began preparation in 2019 before the Covid-19 pandemic. The lock-down enforced in Devon has changed the demand for council services and shown that many of them can continue to operate with substantial levels of remote working which will have reduced the council’s carbon footprint through reduced requirements for travel. As part of the recovery phase the council is likely to review the effectiveness of these working arrangements to understand which could continue post-Covid and carry the carbon savings into the future.
It may be that meeting the 70% reduction in corporate emissions will be easier than currently thought. The annual publication of the carbon footprints will enable the authority to monitor the effectiveness of this plan and revise its targets if necessary.
5. Progress Towards Targets
5.1. Corporate Carbon Footprint
DCC has reported its corporate carbon footprint and has been implementing projects to deliberately reduce carbon emissions since 2005.
In response to substantial changes to the structure of the organisation that had occurred due to national policy, in 2012/13 the baseline and scope of the carbon footprint was reset. These organisational changes meant that it was difficult to make meaningful comparisons with previous years’ data.
The council’s corporate carbon footprint was most-recently calculated for the financial year 2017/18. At that point the carbon footprint had fallen by 36% in gross terms from 42 ktCO2e in 2012/13 to 27 ktCO2e. Normalising the data by full-time-equivalent staff showed that the emissions per staff member had fallen by 7% over the same period.
5.2. Supply Chain Carbon Footprint
The supply chain carbon footprint has been reported since 2012/13.
Measures to reduce the supply chain carbon footprint have been being implemented for many years. They include, for example: using lower-temperature asphalt where appropriate in highways maintenance projects; specifying a proportion of aggregate from recycled sources in construction; using timber in buildings; moving waste disposal activity away from landfill towards energy from waste and anaerobic digestion; and incremental improvements to the energy efficiency of residential care facilities.
Due to the way the supply chain carbon footprint is currently estimated, the effect of individual initiatives at reducing carbon emissions, such as those described above, are not apparent in the data.
6. Reducing Corporate Emissions
The University of Exeter has assisted the council in understanding the effect of national policy on its carbon emissions over the next decade, as well as the effect of an increasing population putting more demand on the council’s services e.g. the additional street lighting that is likely to be added to the inventory as Devon’s population grows. Alongside these considerations, a set of projects has been developed that will be implemented over the next 10 years.
6.1. Low Carbon Buildings
6.1.1. Past Performance
Baseline emissions from corporate property in 2012/13 = 8,014 tCO2e
The buildings the council operates from emit 15% of its corporate carbon emissions. On a comparable basis, carbon emissions from buildings have reduced by 50% since 2012/13 to 4,011 tCO¬2e in 2017/18.
The property maintenance programme has implemented energy efficiency measures, such as replacement boilers, insulation and LED lighting. This, along with the replacement of desktop personal computers with laptops, has improved the energy efficiency of corporate property by 33% from 219 kWh/m2 to 146 kWh/m2. The remaining carbon reductions have been achieved thanks to the deployment of solar PV arrays and air source heat pumps in some buildings and more renewable energy providing the UK’s electricity that has reduced the carbon intensity of the UK’s grid-supplied electricity.
6.1.2. Future Effect of National Policy
The effect of the projected deployment of large-scale renewable energy on the UK’s electricity network by 2030/31 is expected to reduce annual emissions from the council’s buildings to 2,579t CO2e, a reduction of 68% from 2012/13.
6.1.3. Local Action Plan
The projects described in Table 1 will be implemented to achieve carbon reductions from corporate property beyond the effect of national policy.
Table 1 – Local actions to reduce emissions from corporate property
| Initiative | Funding | CO2e Saving/Year | Timing |
|---|---|---|---|
| Continue replacing fossil-fuel boilers at about 10 years old to benefit from efficiency improvements. | Existing maintenance programme | 94t | Ongoing |
| Deep retrofit of Lucombe House to include fabric improvements and renewable technologies. | Approved capital commitment. | 66t | 2020/21 and 2021/22 |
| Deep retrofit of ten council buildings by 2030/31 | An initial capital commitment of £720k to enable two buildings to be retrofitted during 2021/22 and 2022/23. The EU-funded South West Energy Partnership will fund feasibility studies in twenty buildings. | 135t | At least one building per year |
| New Resource: Low Carbon Support Officer to facilitate the deep retrofits | The EU-funded South West Energy Partnership will fund this resource up to May 2022. New request for revenue will be needed from June 2022 onwards of £25k per annum. | Nil. | Ongoing |
| Sub-Total | 295t |
These future local actions, combined with the effect of national policy will reduce annual carbon emissions from the council’s property to 2,018 tCO2e by 2030/31, a reduction of 72% since 2012/13.
Projected emissions from corporate property in 2030/31 = 2,283 tCO2e
6.2. Fleet, Business and School Transport
6.2.1. Past Performance
Baseline emissions from fleet, business and school transport in 2012/13 = 15,109 tCO2e
The annual carbon emissions from the council’s vehicle fleet, its staff undertaking travel for business purposes and the provision of school transport was 13,206 tCO2e in 2017/18, which represents 49% of the corporate carbon footprint. This has reduced by 13% since 2012/13 in comparable terms.
Energy consumption by the vehicle fleet is 27% below 2012/13 levels due to more effective vehicle use and improving fuel efficiency through technological improvements as vehicles are replaced. Four electric cars are part of the fleet.
The energy used for business travel has declined by 8% since 2012/13. This has been due to behaviour change enabled by more flexible and collaborative IT systems facilitating remote working and video calling which reduce the need to travel, and through the increasing efficiency of vehicles over time.
School transport provided by the council uses bespoke software to help identify the most efficient routing of vehicles which is having tangible effects on carbon emissions. For example, daily passenger numbers in 2017/18 were 2.5% higher than 2016/17 but the energy consumption per service user had fallen by 3.5%.
6.2.2. Future Effect of National Policy
The anticipated increase of the proportion of biofuel in forecourt petrol and diesel supplies from 5% now to 11% by 2030/31 is expected to reduce emissions from the council’s transport operations. However, the county’s population is due to rise which will put additional demand for community services. Combining these two factors results in emissions from the council’s transport operations increasing by 140 tCO2e per year by 2030/31 from 2017/18 levels, a rise of 1%, which is still 12% below 2012/13 levels.
6.2.3. Local Action Plan
The projects described in Table 2 will be implemented to achieve carbon reductions from fleet, business and school travel beyond the effect of national policy.
Table 2 – Local actions to reduce emissions from corporate property
| Initiative | Funding | CO2e Saving/Year | Timing |
|---|---|---|---|
| Achieve a 15% reduction in business mileage in private vehicles through demand reduction or a shift to sustainable modes by 2030/31. – Review strategic sites’ travel plans to include a stronger promotion of low-carbon commuting – Review business travel policy and flexible working policies to encourage reduced travel – Use the ICT Roadmap to continue to provide innovative technologyNOTE: This action may have already been achieved through the behaviour change of the Covid lockdown. |
Existing staff resources. Existing staff resources. ICT investments to be identified through existing procedures. | 368t |
After COVID pandemic once the ‘new normal’ staff working practices are known. Ongoing |
| Facilitate 50% of business mileage being undertaken in electric vehicles by 2030/31. This reflects the national move away from petrol and diesel, but it will require local action. – Install charging points at DCC work locations- Explore potential incentives to encourage staff to switch, such as salary sacrifice schemes for electric vehicles | The EU-funded DELETTI project is installing charging points in public car parks, including County Hall, Taw View, Great Moor House and the North Devon Enterprise Centre. An initial capital allocation of £50k per annum for 2021/22 and 2022/23 will install a further 20 charge posts.Existing staff resources. | 336t | Ongoing
2021/22 |
| Continue the existing period of fleet replacement of about 10 years to benefit from ongoing improvements of internal combustion energy efficiency
Note: replacing vehicles more quickly results in net positive emissions due to the emissions associated with manufacturing a new vehicle. | Existing fleet budget | 194t | Ongoing |
| When a DCC-owned fleet vehicle is due for replacement, undertake an appraisal of its daily routine to determine its suitability for electric operation. Aim for 50% of DCC’s owned-fleet to be electric by 2030/31. Note: replacing internal-combustion vehicles before the end of their useful life results in net positive emissions due to the emissions associated with manufacturing a new vehicle. | Initial capital allocation of £320k over the period 2021/22 and 2022/23 to provide ‘top-up’ funding for 22 vehicles and associated charging infrastructure. Starting at £60k per annum, rising to £210k. | 796t | From 2021/22 |
| Aim for 100% of school transport contract vehicles with fewer than 8 seats to be electric by 2030/31.
To be implemented through dialogue with providers and contractual mechanisms. | No funding identified at this time. The market may provide cost-effective vehicles in the latter half of the 2020s. Support from DCC may be necessary to help providers make the switch. | 1332t | Dialogue needs to commence 2021/22.
Vehicle replacements expected 2025 – 2030/31 |
| New Resource: Low Carbon Fleet Officer to facilitate the low-carbon transition | The EU-funded South West Energy Partnership will fund this resource up to May 2022. New revenue resource may be needed, depending upon team capacity from 2023/24 onwards of £30k per annum | Nil. | Ongoing |
| Sub-Total | 3026t |
These future local actions, combined with the effect of national policy will reduce annual carbon emissions from the council’s fleet, business and school transport to 10,180 tCO2e by 2030/31, a reduction of 32% from 2012/13.
Projected emissions from fleet, business and school transport in 2030/31 = 10,180tCO2e
It must be acknowledged that electric variants of many types of vehicles in the council’s fleet are not currently available but are forecasted to be available by 2030/31. Achieving the carbon reductions described above are therefore reliant on market innovation.
6.3 Street Lighting
6.3.1. Past Performance
Baseline emissions from street lighting in 2012/13 = 18,518 tCO2e
The annual carbon emissions from the council’s street lighting in 2017/18 are 9,613 tCO2e, which represents 36% of the corporate carbon footprint. This has reduced by 48% since 2012/13 despite an increasing number of streetlights being added to the inventory due to new development.
The considerable reduction has been achieved through:
• The part-night lighting programme that switches off lighting between 00:30 and 05:30 in locations away from principal routes
• The replacement of traditional lighting technologies with LED lamps in streetlights that remain lit all night. These progressively dim during the night to make further energy savings.
• Removal of unnecessary lighting and illuminated bollards and signage.
6.3.2. Future Effect of National Policy
The effect of the projected deployment of large-scale renewable energy on the UK’s electricity network by 2030/31, combined with the anticipated growth in the street light inventory due to Devon’s population and associated infrastructure development, is expected to reduce annual emissions from the council’s street lighting to 3145 tCO2e, a reduction of 83% from 2012/13.
6.3.3. Local Action Plan
The projects described in Table 3 will be implemented to achieve carbon reductions from street lighting beyond the effect of national policy.
Table 3 – Local actions to reduce emissions from street lighting
| Initiative | Funding | CO2e Saving/Year | Timing |
|---|---|---|---|
| Completing the replacement of traditional lighting technologies with LED lamps in streetlights that remain lit all night. | Assigned and spent. | 463t | Completed in 2019 |
| Replace traditional lighting technologies with LED lamps in streetlights that switch off between 00:30 and 0530. | £9m capital already confirmed | 619t | Ongoing through to end of 2022/23 |
| Sub-Total | 1082t |
These local actions, combined with the effect of national policy will reduce annual carbon emissions from the council’s street lighting to 2,063 tCO2e by 2030/31, a reduction of 89% from 2012/13.
Projected emissions from street lighting in 2030/31 = 2,063 tCO2e
6.4. Additional Renewable Energy
6.4.1. Current Performance
The council has a target to source 30% of its corporate energy requirements from renewable sources by 2030/31 to contribute to carbon emissions reduction.
In 2017/18 Devon County Council consumed 83 GWh of energy through its buildings’ use of electricity and heat and through its fleet, business and school transport use of fossil fuel for mobility. Renewable energy sources owned or facilitated by the council provided 0.3% of this energy consumption, which avoided emission of 102 tCO2e by enabling the council to consume less grid electricity.
Emissions avoided by renewable energy in 2017/18 = -102 tCO2e
6.4.2. Future Effect of National Policy
The effect of the projected deployment of large-scale renewable energy on the UK’s electricity network and the effect of the increase in the proportion of biofuel in the UK’s road transport fuels by 2030/31 has already been accounted for in sections 5.1, 5.2 and 5.3. To count it again in this section would be to count it twice. Therefore this section is only looking at the effect of additional renewable energy capacity that the council can develop or facilitate locally in Devon.
6.4.3. Local Action Plan
The projects described in Table 4 will be implemented to achieve carbon reductions through the deployment of additional renewable energy capacity in Devon.
Table 4 – Local actions to avoid emissions through renewable energy
| Initiative | Funding | CO2e Saving/Year | Timing |
|---|---|---|---|
| Deploy 2MW of solar photovoltaics on DCC assets by 2030/31 | An initial capital commitment of £400k over the years 2021/22 and 2022/23. | 199t | 2021/22 onwards |
| Facilitate the deployment of 23MW of new solar photovoltaic capacity in Devon by signing power purchase agreements direct with local generators. This is essentially using the spending power of DCC to give investment confidence to local renewable energy developers to construct local generating capacity that would have otherwise not been developed. | Existing electricity budget. A cost increase may be required – yet to be determined. Further analysis and development of the business case is continuing. | 2,286t | Ongoing through to 2030/31 |
| Sub-Total | 2,485t |
These future local actions will avoid 2,485 tCO2e of carbon emissions in the year 2030/31 and will generate around d 25GWh of energy. This is forecast to be 39% of the council’s 2030/31 energy consumption and will therefore exceed the 30% target.
Emissions avoided by renewable energy in 2030 = -2,485 tCO2e
It must be acknowledged that the avoided carbon emissions described above are reliant on local renewable energy projects finding land owners willing for development to occur, the projects gaining access to the local distribution network (which is currently constrained in certain locations) and obtaining planning permission.
6.5. Residual Corporate Emissions in 2030/31
The council’s forecasted residual corporate emissions in 2030/31 as a result of implementing the activity in Section 6.4 are 12,041 tCO2e as shown in Table 5.
Table 5 – Residual Corporate Carbon Emissions in 2030/31
| Source | 2012/13 | 2030/31 | % Reduction |
|---|---|---|---|
| Corporate Property | 8,014 | 2,283 | 72 |
| Fleet, Business and School Transport | 15,109 | 10,180 | 32 |
| Street Lighting | 18,518 | 2,063 | 89 |
| Additional Renewable Energy | – | -2,485 | – |
| Total | 41,641 | 12,041 | 71 |
In comparison to 2012/13 emissions, this is a reduction of 71%. As a package, these activities will meet the target of a 70% reduction if the necessary technologies come to market and risks regarding deployment can be overcome.
The contribution to the emissions reduction is split approximately 50/50 between the effect of national policy and local activity.
7. Offsetting Corporate Emissions
7.1. What is Offsetting?
Offsetting is the act of implementing a project elsewhere to avoid or store the same amount of carbon emissions arising from an activity for which it is difficult or very costly to reduce emissions to zero. Popular offset projects include planting trees (which absorb carbon dioxide whilst they are growing) or paying to install energy efficiency equipment in domestic or commercial premises. The common example of offsetting an activity is that of paying to plant some trees to absorb the same amount of carbon that has been emitted due to taking a flight to get to a holiday destination.
7.2 The Council’s Approach
The council has committed to offsetting 100% of its residual emissions in 2030/31 to achieve net-zero carbon. I.e. in 2030/31 the council will offset about 12,500 tCO2e, reflecting a 70% reduction from 2012/13 levels.
Furthermore, the council has stipulated that it wants to use offsetting in Devon as an opportunity to enhance the natural environment to help address the closely related ecological crisis and develop economic opportunities related to offsetting locally.
However, it is not quite as simple as planting some trees or installing some insulation in a village hall: The project needs to be subject to independent verification to confirm that it will absorb or avoid the desired amount of carbon.
Verification schemes exist for energy initiatives and for the restoration of some habitat types, but they don’t exist for Culm grassland or salt marsh – both of which would be of interest for Devon.
Moreover, there are no companies offering to deliver verified carbon offsets in Devon and therefore the council needs to start stimulating a market for offset products.
It is partly for this reason that the council has decided to begin offsetting its residual emissions on a ramped basis immediately, starting with 5% of the residual emissions. The ramp is indicated in Table 6.
Table 6 – Carbon Offset Commitment
| 2019/20 | 2020/21 | 2021/22 | 2022/23 | 2023/24 | 2024/25 | 2025/26 | 2026/27 | 2027/28 | 2028/29 | 2029/30 | 2030/31 | |
|---|---|---|---|---|---|---|---|---|---|---|---|---|
| Residual Emissions (ktCO2e) | 22 | 21 | 20 | 19 | 19 | 18 | 17 | 16 | 15 | 14 | 13 | 12.5 |
| % of Residual to be Offset | 5 | 7.5 | 10 | 20 | 30 | 40 | 50 | 60 | 70 | 80 | 90 | 100 |
| Offset Required (ktCO2e) | 1.1 | 1.6 | 2.0 | 3.8 | 5.6 | 7.1 | 8.4 | 9.6 | 10.6 | 11.4 | 12.0 | 12.5 |
7.3. Local Action
The activities described in Table 7 will begin to enhance the council’s experience of carbon offsetting and understanding of how the funds that will increasingly become available from all sorts of organisations wanting carbon offsetting services can be best spent in Devon to address the ecological emergency and decarbonise the built environment and transport sectors.
Table 7 – Activities to offset residual emissions
| Initiative | Funding | Timing |
|---|---|---|
| Offset emissions from 2019/20, 2020/21 and 2021/22 through a commercial provider of offsets, which will likely be outside of Devon due to a lack of current market offering within the county. | £44k revenue provided in 2020/21 to cover offsetting of 2019/20 and 2020/21 emissions. A further £44k has been committed in 2021/22. | 2020/21 – 2021/22 |
| Purchase land upon which it would be suitable to restore habitat for carbon storage purposes, having been guided by advice from the Local Nature Partnership. | Initial capital allocation of £544k to purchase the necessary land to offset emissions for 2022/23 and 2023/24. | Activity from 2021/22 onwards |
| Implement habitat enhancement using the land above to be verified for carbon offsetting purposes in partnership with a third-party provider. | Initial capital allocation of £19k for 2022/23 to use as match funding against Woodland Creation Grant to implement carbon offsetting project. | 2022/23 onwards |
| Work with the North Devon UNESCO Biosphere Reserve and other members of the Local Nature Partnership to develop carbon calculators for habitats of importance to Devon | Existing budgets, applications to grant schemes and research partnerships. | Ongoing |
| Look for innovative opportunities to use the carbon offsetting funds to pilot new approaches for obtaining verified offsets in the built environment and transport sectors in Devon | Funds outlined above. | Ongoing |
| Provide ongoing Carbon Offset expertise to identify approaches for carbon offsetting and to apply for various grant schemes. | Initial revenue allocation of £50k for 2021/22. | 2020/21 onwards |
8. Prioritisation of Corporate Emissions Reduction
All the initiatives described in this Plan need to be implemented to achieve the strategic targets by 2030. However, it can be helpful to consider the relative merits of each initiative to aid decision making over the life of this Plan about which initiatives to allocate finite resources towards.
Table 8 shows each initiative’s emissions saving per year, the upfront cost and the marginal abatement cost. The marginal abatement cost is the net-cost (not discounted for simplicity) over the lifetime of the initiative to save 1 tonne of carbon dioxide equivalent – a negative score shows that the initiative is an investment opportunity. It should be no surprise that some of the initiatives are not investment opportunities as the UK Committee on Climate Change is clear that meeting net-zero targets will have a net-cost of between 1 and 2% of the country’s gross domestic product.
These figures are each translated into a score on a three-point scale to show the relative merit of each initiative. A further score is added for viability – an indication of how challenging the initiative will be to implement. On the three-point scale, 3 is the better end of the scale. These four scores are added together to give an overall priority score.
Table 8 – Prioritisation of Initiatives
| Initiative | CO2e Saving Per Year | CO2e Score (A) | Upfront Cost (£m) | Upfront Cost Score (B) | Marginal Abatement Cost (£/tonne) | Marginal Abatement Cost Score (C) | Viability Score (D) | Priority Score (A+B+C+D) |
|---|---|---|---|---|---|---|---|---|
| 15% reduction of business mileage by 2030 facilitated by IT | 368 | 2 | £0 | 3 | -£428 | 3 | 3 | 11 |
| Replace vehicles at 10 years to achieve efficiency gains | 194 | 2 | £0 | 3 | -£75 | 3 | 3 | 11 |
| Facilitate 23MW of new solar photovoltaic capacity through power purchase agreements | 2,286 | 3 | £0 | 3 | £0 | 3 | 1 | 10 |
| Boiler replacements | 94 | 1 | £0 | 3 | -£32 | 3 | 3 | 10 |
| Offsetting (e.g. tree planting) | 12,521 | 3 | £0.79 | 2 | £63 | 2 | 3 | 10 |
| 50% of vehicles to be electric by 2030 | 796 | 2 | £1.6 | 2 | £27 | 2 | 3 | 9 |
| 2MW of solar photovoltaics on DCC assets | 199 | 2 | £2 | 2 | -£390 | 3 | 2 | 9 |
| LED lamps in streetlights | 619 | 2 | £9 | 1 | £25 | 2 | 3 | 8 |
| Install charging points at DCC locations for staff and visitors | 336 | 2 | £0.5 | 2 | £149 | 1 | 3 | 8 |
| Deep retrofit of Lucombe House | 66 | 1 | £0.5 | 2 | £98 | 2 | 3 | 8 |
| Deep retrofit of ten further buildings | 135 | 2 | £3.6 | 1 | £70 | 2 | 3 | 8 |
| 100% of school transport contract vehicles with fewer than 8 seats to be electric by 2030 | 1,332 | 3 | – | – | – | – | 2 | NOT SCORED |
The initiative to facilitate all school transport vehicles with fewer than 8 seats transitioning to electric by 2030 does not have a cost assigned and has therefore not been scored. This is because it is currently unknown how much this initiative will cost or how feasible it will be to implement until conversations have occurred with the transport providers.
9. Managing Supply Chain Emissions
9.1. Current Situation
The supply chain carbon footprint of 330 ktCO2e is estimated using nationally-available carbon intensity factors for different types of purchasing categories. The council knows how much it spends within each category and simply multiplies the spend by the conversion factor. This means that the carbon footprint doesn’t change very much and any local activity that is implemented to reduce the carbon emissions associated with specific contracts is not reflected in the figure the council reports.
This is not to say that the council has not worked to reduce carbon emissions from its supply chain. Impactful examples include the use of low temperature asphalt in some highways schemes, which can achieve carbon savings of 25% in comparison to the hot equivalent, and the choice of timber frame for certain new buildings rather than traditional brick and block. The decision-making processes that led to these outcomes need to become common place.
An holistic approach to commissioning is required to achieve maximum carbon savings, starting with the design of the product or service required. For example, designing a new building to use traditional construction methods and subsequently procuring bricks and blocks from manufacturers that use renewable energy in their manufacturing process and from distributors that use highly-efficient vehicles, won’t reduce carbon by very much in comparison to designing the building to use low carbon materials in the first place.
Using spend as a proxy for carbon, the most carbon intensive of the council’s supply chain activities are those involved in civil engineering, waste management and social care.
9.2. The Council’s Approach
The council has committed to carbon offsetting the residual supply chain carbon footprint in the year 2030/31 and each year thereafter. Estimates suggest this would cost in the region of £5m per annum.
To minimise the supply chain carbon footprint, the council will:
1. Encourage an ethos of designing and specifying low carbon where budgets allow
Designing a low-carbon solution in the first instance will avoid more carbon than trying to make a carbon-intensive solution lower carbon. However this requirement has to be mindful of the council’s statutory responsibilities to maintain its assets and provide community services with its finite budget.
2. Engage with the highest value contracts
The ten highest-value contracts represent 25% of the council’s annual procurement spend. The council will initially focus on the high value contracts to engage the contractors to determine the exact carbon emissions associated with these contracts and discuss how they could be willing to assist with the climate emergency over the remaining term of the contract.
3. Set reduction targets
Having established the carbon intensity of the highest value contracts, as intelligent clients, set carbon emissions reduction trajectories over the decade to 2030/31 that need to be met by subsequent contracts to ensure the activity is decarbonised as much as possible. A carbon reduction working group for highways maintenance and new structures has already been established for this purpose.
4. Ask contractors to report emissions
As contracts get renewed, the new specifications need to ask contractors to report to the council the carbon emissions associated with operating the contracts. The best way of doing this, and of supporting smaller companies with the skills to do this, needs to be explored.
5. Include carbon reduction in evaluation criteria
All new invitations to tender need to include as part of the evaluation criteria the requirement for the bidders to explain how they will minimise the carbon emissions arising from the operation of the contract in line with net-zero by 2030/31 aspirations.
To assist with the implementation of this approach the Procurement Category Managers will put in place Low-Carbon Procurement expertise to research best practice, facilitate the sharing of learning with other local authority partners and coordinate activity described above. A new revenue allocation of £25k per annum has been allocated for this resource in 2021/22.
10. Reducing School Buildings’ Emissions
10.1. Current Situation
The carbon footprint associated with the energy consumption of local authority-maintained schools’ buildings is monitored. In 2017/18 it was 3,092 tCO2e which was a reduction of 26% from 2014 (the earliest comparable data). This is due to a combination of energy efficiency improvements, renewable energy installations in the schools and deployment of renewable energy on the national grid reducing the carbon intensity of grid-supplied electricity.
Biomass boilers, solar photovoltaics and wind turbines provide 2.1% of schools’ energy needs. The energy used by school buildings has reduced by 9% since 2014 to 11.4 GWh through the installation of LED lighting, new boilers and insulation measures.
The council does not set targets to reduce the carbon footprint of local authority-maintained schools’ buildings as financial control and management decisions for many elements of building maintenance lie with the individual governing bodies.
10.2. The Council’s Approach
10.2.1. Existing School Buildings
The building maintenance activity that is the responsibility of the council will continue to look to install the best available technology for the budget available and make use of grant funding. As an example, the heating maintenance projects at Kenn and Denbury primary schools replaced old storage heaters with smart storage heaters, roof-top solar PV and battery storage to better align the renewable energy availability with the electricity demand in the schools.
The South West Energy Partnership, a collaboration between Bristol City Council, Plymouth City Council, and Devon County Council is looking to support schools with interest-free loans for energy projects to all schools in each area. These will be useful to the schools to install energy measures that are the responsibility of local governing bodies.
10.2.2. New School Buildings
Meeting current building regulations generally results in a new building achieving Energy Performance Certificate (EPC) level B. Innovative approaches to go beyond minimum requirements will be implemented where feasible: The budget for providing new school buildings is largely provided by national government using a prescribed formula.
Examples of innovative approaches that have been implemented include the Montgomery Primary School in Exeter which was the UK’s first Passivhaus certified school and the new Loddiswell Primary School generates more energy over a year than it consumes and as a result has an EPC level of A+.
11. Reducing County Farm Dwellings’ Emissions
11.1. Current Situation
11.1. Current Situation
These agricultural properties are currently exempt from the Minimum Energy Efficiency Standards regulations that require landlords to upgrade the energy performance of tenanted properties. Nonetheless, the authority is committed to refurbishing county farm dwellings to reflect the decent homes standard. Twenty refurbishments have been completed and a further 6 are in progress during 2020.
Typical decent homes works include damp treatment, new bathrooms, new kitchens, mechanical ventilation in bathrooms and kitchens, whole house ventilation systems, new boilers for heating and hot water, rewiring, installation of LED lighting, loft insulation, cavity wall insulation and double glazed doors and windows.
Nine of the 20 completed refurbishments have also received a roof top solar PV array.
Energy efficiency improvements can be evidenced though improvements to the EPC rating. Chapel Farm is a good example of what has been achieved on even a relatively modest and modern bungalow; the EPC was upgraded from a G to a C.
11.2. The Council’s Approach
The authority aims to complete decent homes refurbishments to the remaining 42 dwellings by 2030. Financial commitments of £600k per year from 2020/21 to 2023/24 have been assigned to this. Each property is costing in the region of £90k and so this funding will improve about 27 properties. Fund requests for the remaining properties will be made towards the end of the existing funded period.
12. Monitoring
The council’s corporate and supply chain carbon footprints, and the school buildings’ carbon footprint, will continue to be reported annually.
The responsibility for the implementation of the individual projects within this plan sit with the relevant Head of Service.
The responsibility for monitoring the implementation of this plan as a whole lies with the Environmental Performance Board.
13. The Finance Plan
This section provides the financial details for the projects that are required to be implemented to reduce the council’s carbon footprint (the corporate and supply chain carbon footprints) to net-zero by 2030. It breaks down the revenue and capital funding that is required, and indicates the revenue savings that are available from reduced energy consumption and purchasing.
13.1. Revenue Expenditure Detail
| Financial Year | 2020/21 | 2021/22 | 2022/23 | 2023/24 | 2024/25 | 2025/26 | 2026/27 | 2027/28 | 2028/29 | 2029/30 | 2030/31 |
|---|---|---|---|---|---|---|---|---|---|---|---|
| Low-Carbon Procurement Graduate | 25,000 | 27,500 | 30,000 | 30,000 | 30,000 | 30,000 | 30,000 | 30,000 | 30,000 | 30,000 | |
| Low-Carbon Fleet Graduate | 30,000 | 30,000 | 30,000 | 30,000 | 30,000 | 30,000 | 30,000 | 30,000 | |||
| Low-Carbon Estate Graduate (from June 2022) | 22,917 | 30,000 | 30,000 | 30,000 | 30,000 | 30,000 | 30,000 | 30,000 | 30,000 | ||
| Carbon Offset Officer (3 months + ICT kit) | 50,000 | 50,000 | 52,500 | 52,500 | 55,000 | 55,000 | 57,500 | 57,500 | 57,500 | 57,500 | |
| Carbon offsetting Devon CC’s emissions on a ramped basis using purchased offsets | 44,245 | 44,612 | |||||||||
| Maintenance of the land-based carbon offset schemes | 3,941 | 7,652 | 12,371 | 17,982 | 24,371 | 31,423 | 39,024 | 47,058 | 55,405 | ||
| Carbon offset for the supply chain | 5,000,000 | ||||||||||
| Total Revenue Required | 44,245 | 119,612 | 104,357 | 150,152 | 154,871 | 162,982 | 169,371 | 178,923 | 186,524 | 194,558 | 5,202,905 |
| Revenue Confirmed at February 2021 | 44,000 | 150,000 |
13.2. Capital Expenditure Detail
| Financial Year | 2020/21 | 2021/22 | 2022/23 | 2023/24 | 2024/25 | 2025/26 | 2026/27 | 2027/28 | 2028/29 | 2029/30 | 2030/31 |
|---|---|---|---|---|---|---|---|---|---|---|---|
| Purchasing land for carbon offsetting | 223,813 | 320,833 | 407,929 | 485,100 | 552,346 | 609,668 | 657,066 | 694,539 | 721,602 | 721,602 | |
| Implementing carbon offset on land | 95,920 | 137,500 | 174,827 | 207,900 | 236,720 | 261,286 | 281,600 | 297,660 | 309,258 | ||
| Capital grants for carbon offset activity | -76,736 | -110,000 | -139,861 | -166,320 | -189,376 | -209,029 | -225,280 | -238,128 | -247,406 | ||
| 50% of DCC’s fleet converted to electric | 120,000 | 90,000 | 80,000 | 105,000 | 90,000 | 100,000 | 100,000 | 120,000 | 90,000 | 60,000 | |
| Chargeposts for fleet | 60,000 | 50,000 | 40,000 | 60,000 | 60,000 | 60,000 | 60,000 | 90,000 | 90,000 | 90,000 | |
| 2MW of Solar PV on DCC assets | 200,000 | 200,000 | 200,000 | 200,000 | 200,000 | 200,000 | 200,000 | 200,000 | 200,000 | 200,000 | |
| Chargeposts for staff and visitors | 50,000 | 50,000 | 50,000 | 50,000 | 50,000 | 50,000 | 50,000 | 50,000 | 50,000 | 50,000 | |
| Ten building refurbishments | 360,000 | 360,000 | 360,000 | 360,000 | 360,000 | 360,000 | 360,000 | 360,000 | 360,000 | 360,000 | |
| Total Capital Required | 1,013,813 | 1,090,017 | 1,165,429 | 1,295,065 | 1,353,926 | 1,427,012 | 1,479,323 | 1,570,859 | 1,571,134 | 1,543,454 | |
| Capital Confirmed at February 2021 | 1,000,000 | 1,000,000 |
13.3. Reduced Revenue
| Financial Year | 2020/21 | 2021/22 | 2022/23 | 2023/24 | 2024/25 | 2025/26 | 2026/27 | 2027/28 | 2028/29 | 2029/30 | 2030/31 |
|---|---|---|---|---|---|---|---|---|---|---|---|
| 50% of DCC’s fleet converted to electric by 2030 | 4,603 | 27,919 | 43,399 | 65,922 | 90,036 | 123,670 | 160,849 | 221,776 | 282,286 | ||
| Lucombe House Refurbishment | 14,544 | 14,439 | 14,335 | 14,230 | 14,544 | 14,753 | 14,753 | 14,335 | 13,707 | 13,498 | |
| Building refurbishment – 60% energy reduction per building | 5,189 | 10,435 | 15,737 | 21,464 | 27,574 | 33,089 | 37,955 | 42,677 | 47,595 | ||
| 2MW of Solar PV on DCC assets | 17,142 | 34,411 | 52,082 | 71,134 | 89,139 | 105,800 | 123,350 | 141,149 | 159,614 | ||
| Total Reduced Revenue | – | 14,544 | 41,374 | 87,099 | 125,448 | 173,065 | 221,502 | 277,312 | 336,489 | 419,309 | 502,992 |