


I almost fell off my chair. The Department for Education (DfE) has finally gotten around to publishing findings from its Student Income and Expenditure survey for (home domiciled) students studying in England.
It’s based on a series of earlier surveys undertaken at regular intervals since the mid 1980s, although in recent years we’ve started to see large gaps – the last one was done in 2014-15, which means we’ve shifted from an almost annual exercise in the late 80s to a pretty much parliamentary-cycle cycle now.
The survey tracks the financial position of students and measures the impact of changes in funding and support, and is both a fascinating snapshot into the student condition, and essential data for anyone wanting to advocate for improvements to the student support system.
It’s a confusing picture overall. On the face of it what matters with income and expenditure is the difference between the two – and it looks like students are just about making ends meet, albeit with falls on both sides of the I&E. What that means in detail is much more interesting.
The thing was carried out by NatCen in both England and Wales – no sign of the Welsh report yet. And I’ve focussed mainly on FT students here – although there’s a treasure trove of data on PT students and other characteristics which we’ll explore in coming weeks.
One thing to note before we get into the weeds here is that the NatCen report fairly helpfully tends to do three things – focus on the “median” full-time or part-time student, compare their position to the 2014-15 exercise, and uses national inflation figures on the expenditure and national earnings growth on the work side to achieve a comparison.
It’s also worth bearing in mind the change in sample composition – for the first time, the 2021-22 data includes students in their fourth year of undergraduate study.
Of course medians hide how wide the spreads are, and neither headline inflation nor headline wage growth figures are appropriate for students – their basket of goods may be different, and their jobs might be different too. It’s also worth bearing in mind that inflation in particular continued to rise very sharply beyond the survey period. Nevertheless the comparisons are helpful – and in many cases really quite stark.
Income and expenditure
The big headline is that median total income across all full-time students (excluding any income from tuition fee loans) fell by 4 per cent from £12,022 in 2014-15 (adjusted for inflation) to just £11,500 in 2021-22. And it fell even more sharply for part-time students – by 10 per cent from £18,307 (adjusted) in 2014-15 to £16,460 in 2021-22.
Perhaps inevitably, on the expenditure side there were then also falls – the median total for full-time students fell by 12 per cent from £13,123 in 2014-15 to £11,509 in 2021-22 – and for part-time students fell by 19 per cent from £17,566 to £14,282. They have less income, and are spending less on their education.
Interestingly, that means that a shortfall between income and expenditure of £1,101 for full-time students just under a decade ago has now become a gap of just £9 – which may well be a facet of sources that top up the gap drying up – while a positive gap for PT students of £741 has become £2,178. That’s much more about the PT students that are left these days being better off, though.
And the closing of the gap for FT students hides how that is being done, and the impacts on students’ academic and personal lives that the more detailed tables then imply.
Grants and loans
If we dive down a bit into income, there’s some fascinating results once the medians and upratings are applied. For example if we look at the total value of the maintenance package (which used to be a mix of loans and grants but is now just loans) it’s gone from £5,253 to £5,950 – an increase of 13 per cent.
Don’t get too excited – the 2014-15 figures reflect the way in which students were being squeezed in preceding years ahead of George Osborne increasing the total package but converting it all to loans, while the 2021-22 figures to some extent pre-date the very sharp rises in inflation and lack of corresponding rises in maintenance we’ve seen in the last two years.
But a more important reason to not get too excited is what happens if we just look at those who got both maintenance grants and maintenance loans in 2014-15 – roughly the poorest half of full-time students. For them, the median received
was equivalent to £8,932 after up-rating, falling to a median of £7,100 received in maintenance loans only in 2021-22 – a huge decrease of 21 per cent. The poorest got poorer and the richest got richer, in other words.
The other sort of quasi-state supplied maintenance is hardship funds. Just 3 per cent of full-time students received hardship funds, receiving a median of £500 each. Back in 2014-15 the old Access to Learning Funds went to just 2 per cent of full-time students received, with a median of £778 (after adjustment), a decrease of 36 per cent between the two surveys. There’s more poor students, in other words, and they’re getting less each in hardship.
Doing the comparison for PT students is a bit trickier – partly because between the two surveys, part-time students (studying at least 25 per cent full-time equivalent or FTE) became eligible for maintenance loans. Just 10 per cent of part-time students had a maintenance loan in 2021-22 – they received a median of £4,744. Part-time students were not eligible for these loans in 2014 to 2015 so a comparison over time is not possible.
Bursaries and so on
Outside of all that, income from other sources of the student finance package included targeted other support from providers, employers and charities. Across all full-time students, in 2021-22 income from these other sources contributed 13 per cent of median total income, down from 19 per cent in 2014-15.
Given these are the sorts of funds that tend to be targeted, it’s important to look at who’s getting what beyond the headlines. In 2021-22, 41 per cent of all full-time students got cash from these other sources (down from 44 per cent in 2014-15), and the median for those who did get something reduced from £2,000 in 2021/22 to £2,594 – a decrease of 23 per cent in real terms.
Driving most of that is bursary or scholarship entitlement – and I suspect driving most of the decrease is access and participation evidence in the last decade that pointed away from financial support into other areas, and the way in which family income thresholds have been as stuck in universities as they’ve been in DfE – something I discussed recently on the site here.
The numbers certainly suggest that. Some 22 per cent of full time students got a bursary in 2021-22, down from 26 per cent in 2014-15 – and they got on average just £1,000 each, a decrease of 49 per cent in real terms from a 2014-15 median of £1,946.
Meanwhile healthcare students’ NHS entitlements went from £16,563 (adjusted) to just £5,391, but looking at support for disabled students is hard to compare thanks to policy changes. For those getting it, child-related support at least went from £1,975 to £2,660 – a 35 per cent increase in real terms.
There were falls for PT students too – just 22 per cent (down from 54 per cent in 2014-15 and 35 per cent in 2011-12) of them got any income from these other sources of the student finance package, and among those who did, the median amount was £3,000, down from £3,761 (adjusted for inflation) in 2014-15, a decrease of 20 per cent.
They’re working more
So where’s the rest coming from? Work. Across all full-time students, income from paid work increased over the period and these earnings contributed more towards total income, accounting for a quarter of mean total income – up from 17 per cent in 2014-15. Median earnings for those in work increased by 27 per cent from £2,824 (adjusted for earnings inflation) in 2014-15 to £3,600 in 2021/22.
That’s partly about more students working and partly about working more hours. Over the period we’ve gone from 52 to 58 per cent of FT students with a job, and they’re working on average 20 per cent more hours in the process. Those from routine/manual class backgrounds worked almost 4 times as many hours as those from managerial and professional, with the mean for routine/manual at 15 hours – so beyond that plenty were working longer than any study suggests they should be to avoid impacts on outcomes and mental health.
Once you’ve claimed everything you can and worked all the hours you can, all that’s then left is family support. The contribution from families is down, on average – 78 per cent of full-time students (81 per cent in 2014-15) received income from or contributed income to their families, receiving on average a median of £1,160 – a decrease of 11 per cent in real terms.
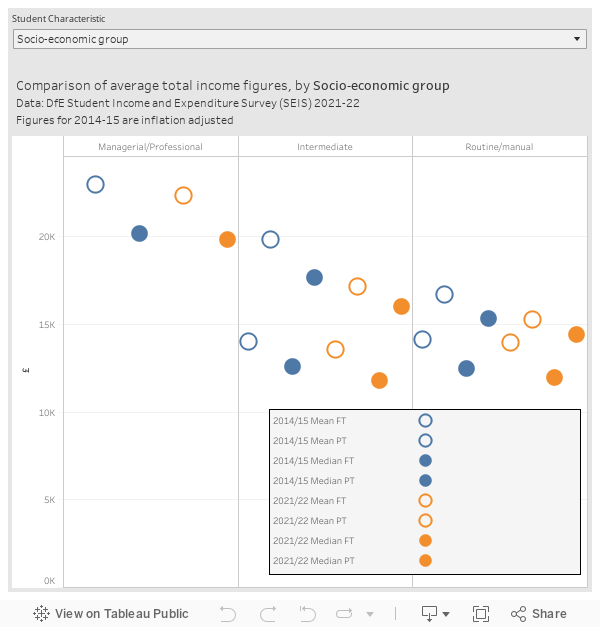
Charts
Here, thanks to DK, is a chart to play with that compares average total income by all sorts of characteristics:
Influences
As well as numbers, we do get a little bit of qual on the influences of finances on HE decisions.
A quarter of full-time students and a third of part-time students reported that they would not have studied at all without funding, and unsurprisingly this was (statistically) significantly more likely among FT students from routine and manual work backgrounds, with parents who had not been in HE, students reporting a disability, older students (aged over 25 at the start of the academic year), those living in a couple (with or without children), and students classed as independent.
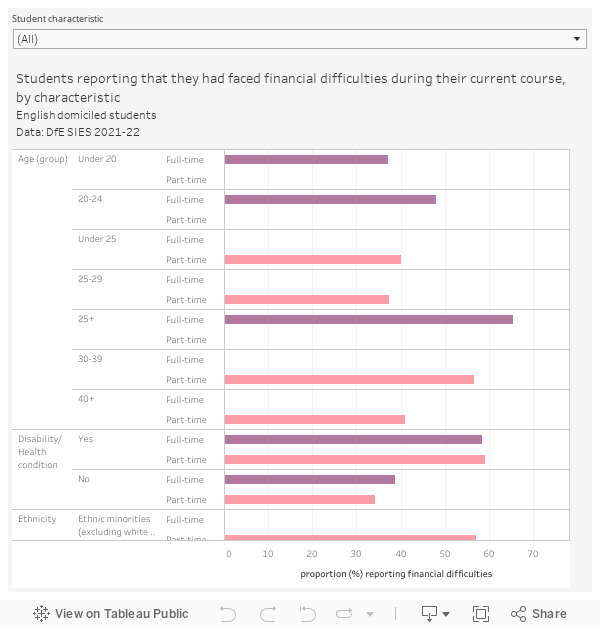
Between one-half and two-fifths of all students reported that they had faced financial difficulties during their current course, with about 10 per cent saying that those difficulties had affected how well they did at university “to a great extent.”
Here DK has plotted the percentage of students reporting that they had faced financial difficulties during their current course, by student characteristics:
Expenditure
So what are they spending it on? In SIES, “participation costs” are made up of direct course costs and so-called “facilitation costs” – all excluding fees. There’s also living costs (including food and drink, personal entertainment, household goods and non-course travel), housing costs (including mortgage and rent costs), and spending on children.
On those living costs – the “having a nice time as a human” stuff – the FT total median spend was £5,841 in 2021-22, a fall of 19 per cent compared with the total spending on living costs of £7,810 in 2014-15 after up-rating.
Crucially for those that still think students are big spending hedonists, they’re spending a third less on personal items, 29 per cent less on entertainment, and 20 per cent less on non-course related travel. For those away from home, rent is the kicker – up 6 per cent in real terms over the period for those in a private house. Full time students are also spending half what they did on direct course costs.
Meanwhile for PT students, the largest median spend on living costs for non-course related travel, with a median of £1,994 – much higher than found for full-time students.
That all leads to a borrowing problem. Around 14 per cent of full-time students had commercial credit debt – such as credit cards – and one in five had an overdraft. Of those FT students with commercial credit, the median commercial credit borrowings figure was £2,000, or 46 per cent borrowing £3,100 for PT students.
Characteristics
I’ve hinted at some of the differences by student characteristics above – but it’s worth drawing out a couple more here.
Many of the differences in receipt of state or university support reflect entitlement rules – but on support from family, those in the managerial/professional group got £2,000, down to £400 from those classed as “intermediate” and just £100 for those from routine/manual occupations. Perhaps inevitably, income from PT work is double for those from routine/manual backgrounds when compared to those from managerial/professional.
And for evidence of a “squeezed middle”, if we compare that £9 shortfall I was talking about, it’s those in the “intermediate” category where it dips into a negative.
Add all of that up, and students are working more, having less fun, and spending less time and money on their course – all while getting less help from the state, less help from their university and less help from their parents.
Yet, apart from the richest graduates, they’ll all pay more in the long run for the privilege – thanks to the stealth changes in the loan system that will see them hand more of their earnings back towards the debt they’re in. It’s hard to escape the headline message here – they’ll pay much more for much less than they did a decade ago.

(Green = old system, Grey = new system)
We should be particularly concerned, I think, about a growing “squeezed middle” – those whose families now earn more than the £25,000 thresholds built into the loan system and many providers’ bursary schemes. This student version of fiscal drag looks like an increasing problem.
The bottom line is that for the poorest half of full-time students, the state used to grant-and-loan them 68 per cent of their costs, and now only loans them 61 per cent of those costs – with work, debt and spending less on their education and themselves closing the gaps.
This, for the avoidance of doubt, is not an argument for contraction and nor is it an argument against expansion – but as a country we appear to have made poorer students pay the price of massification with their own education and health.


