
Public transport was severely impacted during COVID-19 as people’s daily mobility patterns changed. This led to a substantial drop in demand as many workers were instructed to work from home and social distancing measures were introduced on existing services. Department for Transport statistics show a decline from 91 to 26 million passenger journeys on local bus services for 2019/20 to 2020/21 for Wales: albeit with hints of a recovery in later quarters. This led to a total withdrawal of some routes as operators adjusted their networks, and a reduced frequency of service on others, in response to the declining passenger numbers.
This research investigates evidence for spatial disparities within this nationwide narrative, thereby adding to previous research that has investigated the role of changing levels of public transport services pre-pandemic on access to library, health and social care, banking, and sporting facilities for those groups who lack access to private transport. Under-pinning such research is the need for measures that permit spatial and temporal analysis of access to essential services via a range of travel modes using sophisticated GIS networking tools.
Measuring access to public transport
Various metrics exist for measuring public transport availability (Sun and Thakuriah, 2021). The Scottish Parliament recently published bus accessibility scores for data zones in Scotland based upon scheduled services listed in Traveline data (this analysis is based upon information supplied through the Traveline National Dataset, and is dependent on the accuracy, completeness, and consistency of this source over the timeframe adopted). Starting with the smallest census units – output areas – all bus stops within 400m walking distance by path or road of its population weighted centroid were identified, and from these the average number of buses accessible per hour computed. Using figures for the period before the COVID-19 pandemic they found that more deprived areas had better accessibility, both during the week and at weekends.
We adapted this index to derive equivalent scores within Wales. Using data relating to the period from August 2019 to August 2021 the aim is to investigate changes in access to bus services at the start of the pandemic. Our scores are derived using software built on OpenTripPlanner and using data from OpenStreetMap and Traveline (ibid.). We consider all bus services that operate between 6 am – 10 pm, on both weekdays and at weekends. Mapped Welsh Access to Bus Indicator (WABI) scores for both weekday and weekend services are presented in Figure 1. The initial OA level scores are aggregated to Lower Super Output Areas (LSOAs) by taking the median OA score within each LSOA.
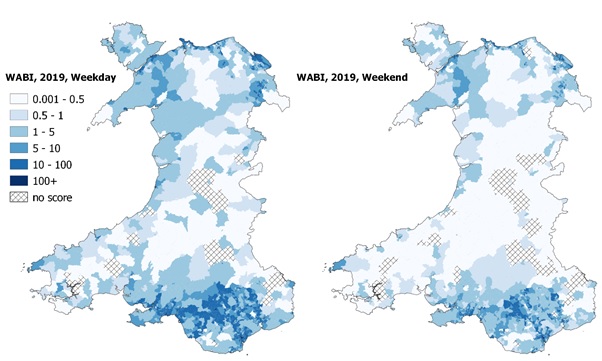
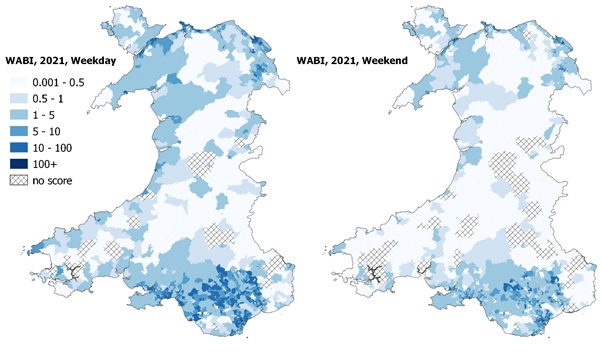
Figure 1: Welsh Access to Bus Index scores (average number of reachable buses per hour) by Lower Super Output Area. Upper maps are scores for August 2019 for weekday (left) and weekend (right) services. Lower maps are for August 2021. All maps adopt a common classification scheme, and the hatched symbol indicates no access recorded using this metric.
Changes in access to bus services in Wales, 2019-2021
Maps were created to show both the absolute and percentage change in WABI scores over the time period August 2019 – 2021 as presented in Figure 2.
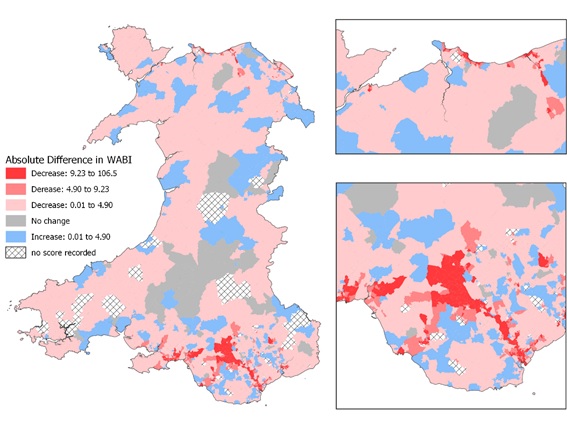
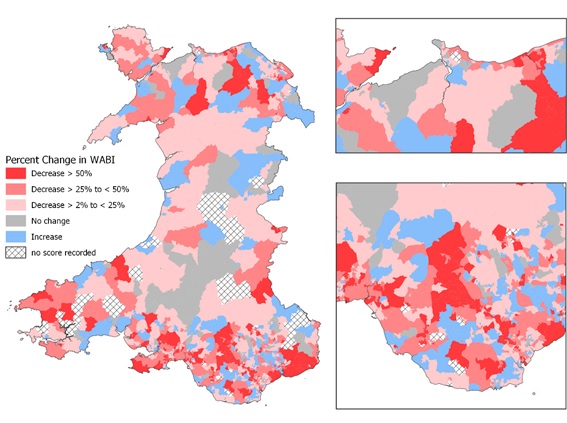
Figure 2: Change in WABI score (2019 – 2021) weekday services. Expressed as the absolute difference in average accessible bus frequency per hour (above), and percentage change (below).
Whilst there are some LSOAs that witnessed small increases in bus service accessibility most zones saw a decline. In terms of absolute change in WABI score, a notable geographical concentration of high rates of decline was evident running north through central Cardiff and into Rhondda Cynon Taff, expanding out into the Cynon Valley and Merthyr Vale. High declines were also seen in parts of Swansea, and in the Neath and Afan valleys to the east. Pockets also arose along the North Wales coast between Llandudno and Rhyl and extending inland towards Denbigh. These trends were broadly consistent between weekday and weekend services.
A wider range of circumstances are manifested within the percentage change data, with additional areas in North Pembrokeshire, the Vale of Glamorgan, and several localities in North-east and to a lesser extent North-west Wales rising in prominence. Large declines in ‘absolute’ scores are more likely to arise in urban areas because there are naturally more bus services running here due to the population base being served. Conversely, high percentage declines are more likely in rural areas because the loss of just one or two opportunities may represent a large proportion of a small original service total.
Variations by Rural-urban classification
WABI scores were compared to the Office for National Statistics rural-urban classification. Transport accessibility was shown to be highest in the “Urban, City and town” category followed by “Rural Town and fringe”, and lowest in the “Rural village and dispersed in a sparse setting”, for both weekday and weekend datasets. This was the case in both 2019 and 2021. The largest decline in score averages (illustrated by the orange shade) also occurred in “Urban City and Town” and “Rural town and fringe”, perhaps partly because these areas had more initial services to lose (Figure 3). In terms of percentage differences, the largest decline was once again in “Urban, City and town” followed by LSOAs categorised as “Rural village and dispersed”. For weekends, trends in WABI scores 2019 – 2021 mirrored those of the weekday changes although “Urban city and town in a sparse setting” and “Rural Town and fringe” experienced slightly greater percentage losses than LSOAs in “Urban city and town”.
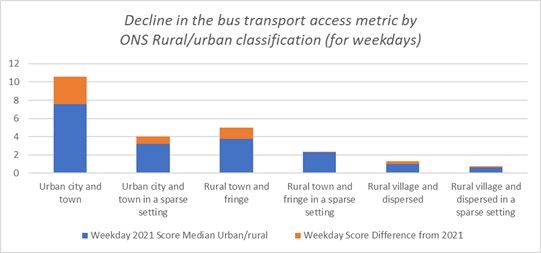
Figure 3: Changes in access scores by ONS Rural/Urban classification (2019-2021)
Variations by Welsh Index of Multiple Deprivation
We also examined transport accessibility variations with respect to deciles derived from the Welsh Index of Multiple Deprivation. In terms of absolute differences 2019-2021, decline was greatest amongst those LSOAs associated with the most deprived areas of Wales (see Figure 4). A decline in bus service accessibility was experienced in every decile, although these generally became less severe when moving from most to least deprived categories. However, a reversal seen in the 9th decile suggests that some of the least deprived areas have also experienced notable losses of service; in this instance it may reflect the fact that some of these LSOAs are likely to arise in the suburbs of urban areas which, as noted earlier, experienced the largest overall drops in WABI score.
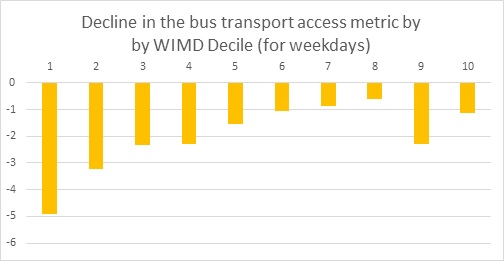
Figure 4: Changes in access scores by WIMD 2019 Decile (2019-2021) (WIMD Decile: 1 = most deprived; 10 = least deprived)
This profile of change was mirrored in weekend service frequencies, and in the percentage change data although here the 9th decile (i.e., towards the least deprived) experienced an elevated loss compared to the most deprived decile; nevertheless there remained the same broad pattern of larger losses of service seen amongst the more deprived areas.
Policy implications
Many areas lost bus service provision over the time-period August 2019 – 2021, but the biggest losses appear to have taken place in some of the most deprived areas of Wales. A decline could be caused by the loss of a complete route, a decline in frequency of service on an existing route, or the removal of a bus stop in this time window.
Any loss of provision is likely to have knock-on effects for those living in affected areas but will particularly impact on those most dependent upon public transport services to access vital retailing, education, and health facilities, as well as for maintaining social contact with family and friends.
A recent paper by Transport for Wales to the Senedd Committee on Climate Change, Environment and Infrastructure (Transport for Wales, 2022) suggests that around 25% of all bus users are disabled or have a long-term illness. Loss of bus services are also likely to be detrimental to those who regularly connect to alternative transport hubs. The 2021 National Survey for Wales found that 13% of all households in Wales do not have access to a car. With declining public transport services such groups may become more reliant on friends and families for lifts or may resort to the use of taxis to access key services.
Our follow up analysis will investigate the extent to which these effects continue to persist post-2021 and will include a wider range of access metrics (for example in relation to the opening times of service opportunities). Other metrics on service quality could be usefully added within this framework, such as the availability of shelters and seating at bus stops, safety issues in the vicinity of access points and raised kerbs for easier access. Attempts will also be made to actively identify public transport ‘cold spots’ based upon these analyses.
The implications of a recovery in the sector to address wider social and environmental goals has been alluded to previously. The need to extend the reach of bus services in Wales and have routes/services in close vicinity of people’s homes to reduce the need to use their cars, are key aims of the recently published ‘Bus Cymru‘, the National Bus Strategy for Wales. More broadly, this type of analysis can help address policy goals highlighted in Y Llwybr Newydd: the Wales Transport Strategy including the need to meet the Welsh Government target of 45% of journeys to be made by public transport, walking and cycling by 2040.