
Enhanced Eating Competence Is Associated with Improved Diet Quality and Cardiometabolic Profile in Finnish Adults with Increased Risk of Type 2 Diabetes

 , , ,
, , ,  , , , and
Abstract
:
1. Introduction
2. Materials and Methods
2.1. Study Design
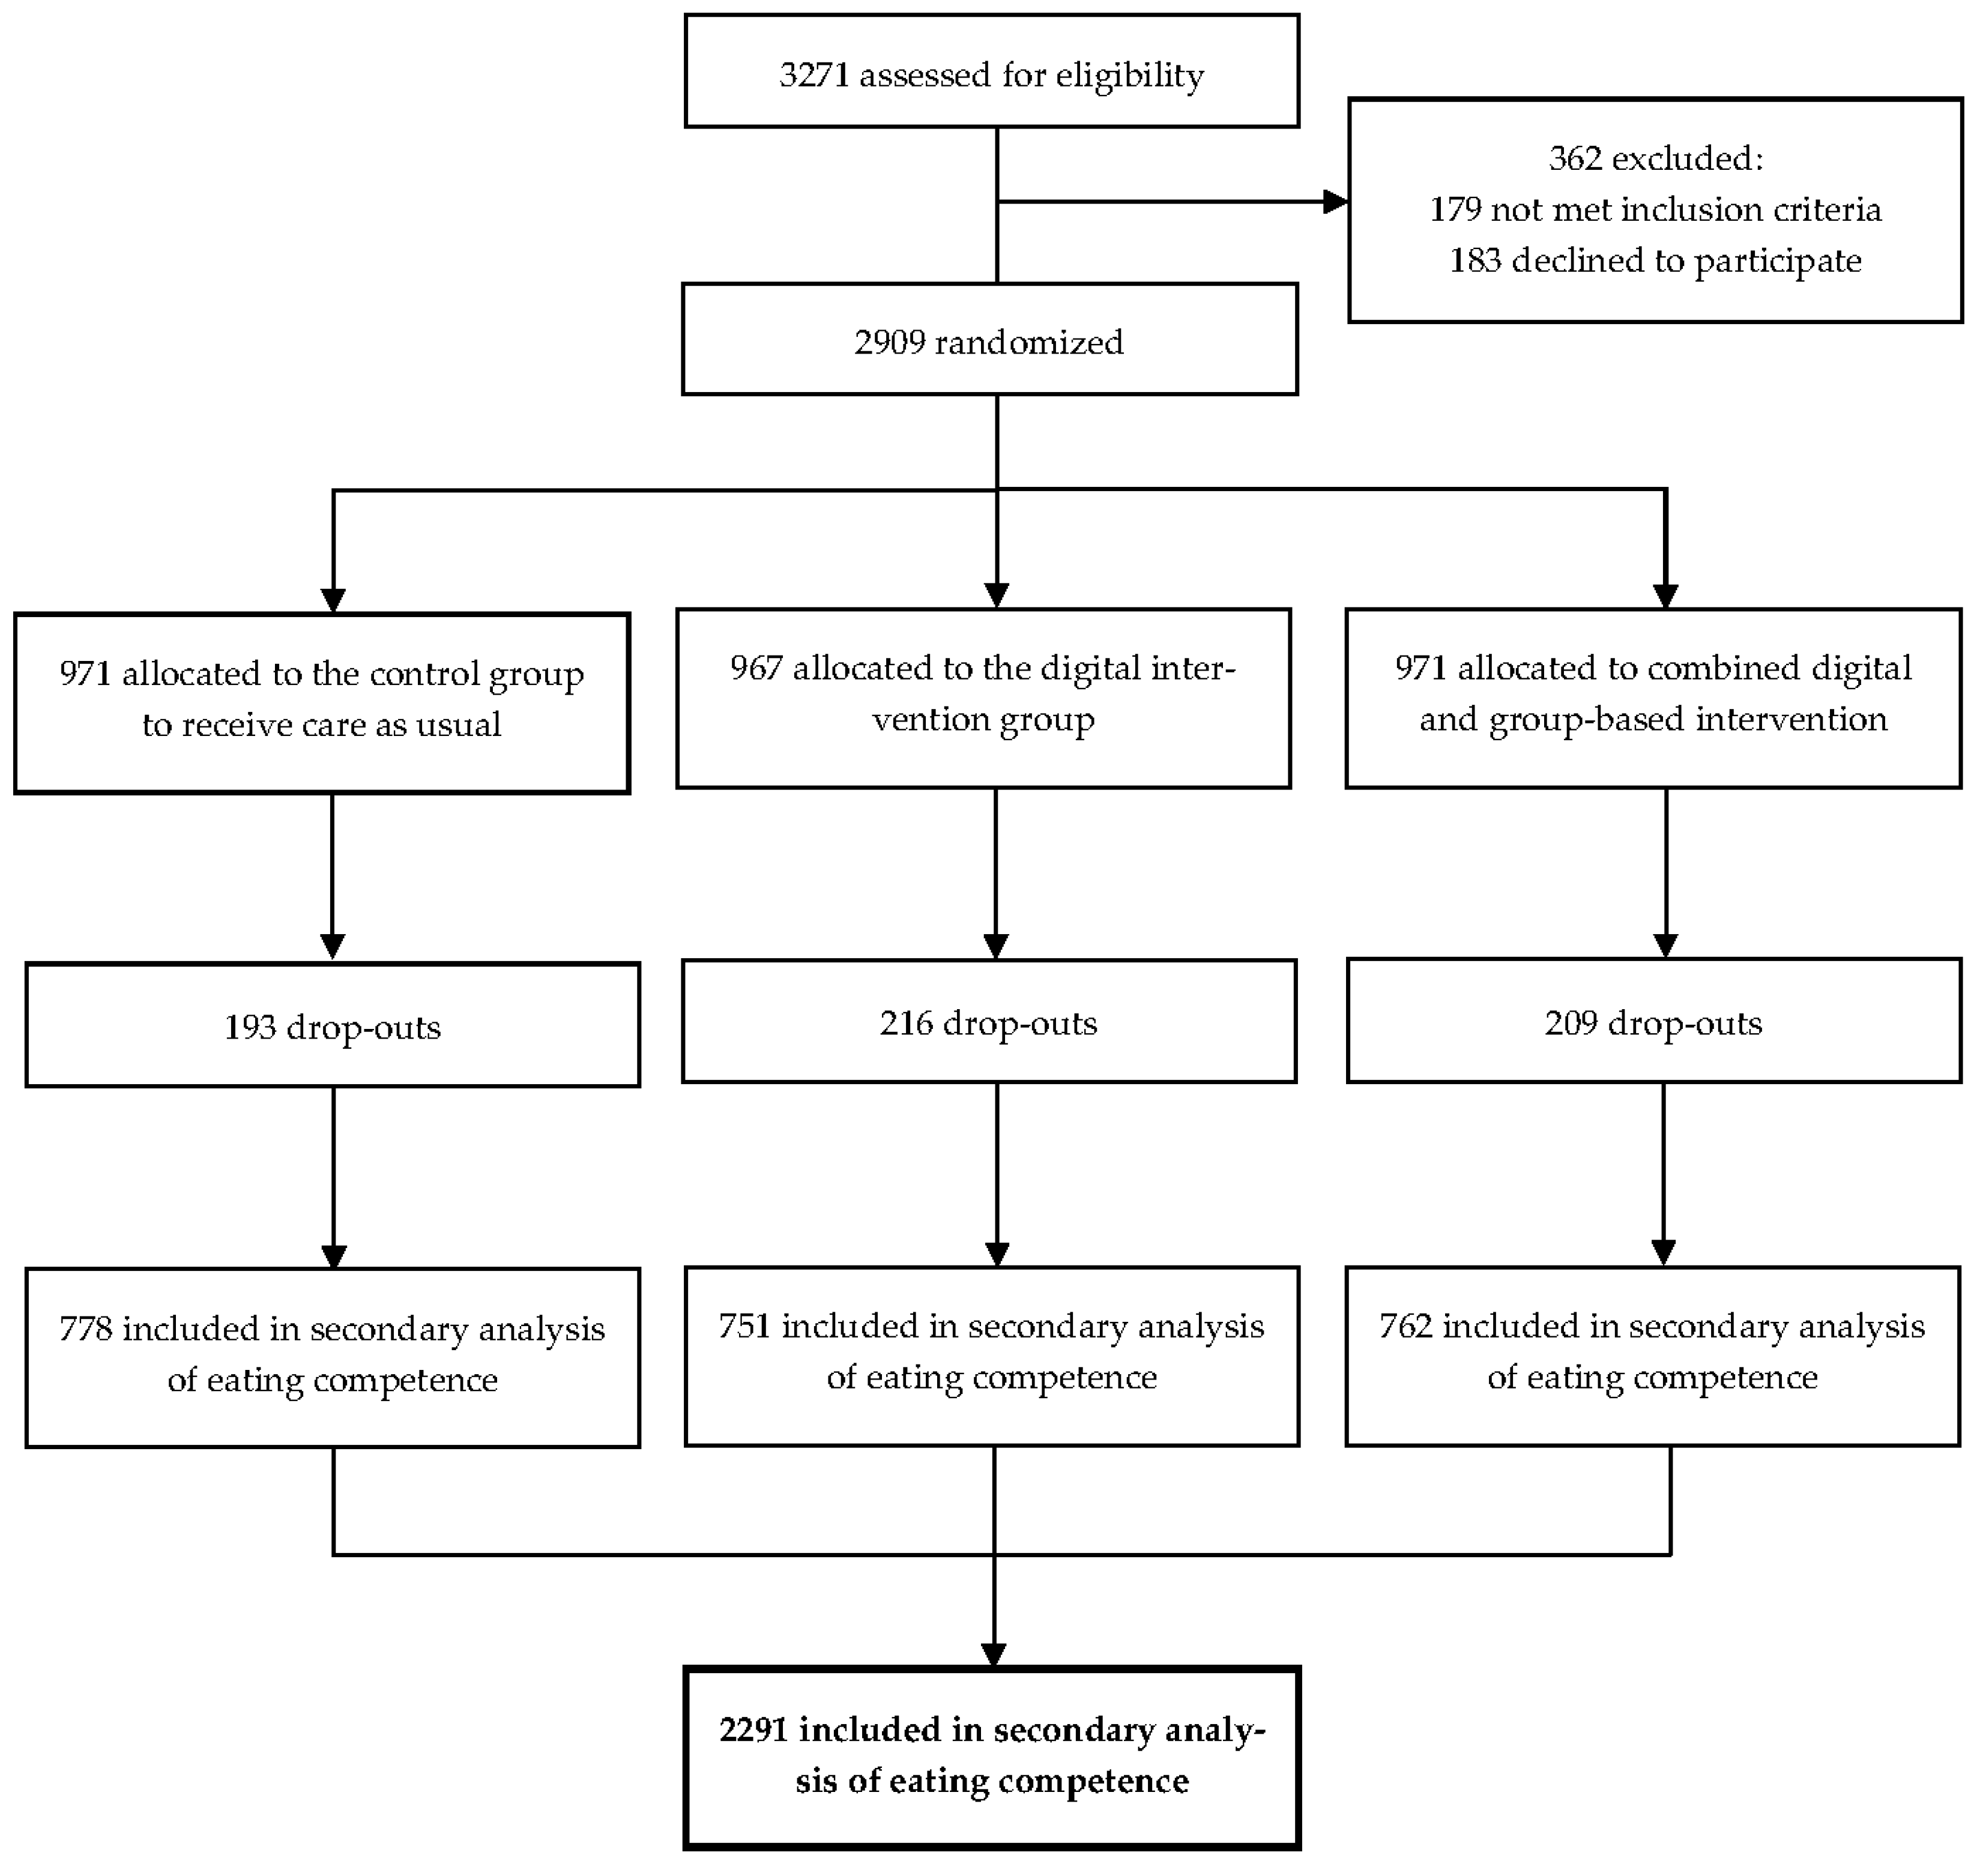
2.2. Participants
2.3. Lifestyle Interventions
2.4. Assessments
2.4.1. Eating Competence (EC)
2.4.2. Diet Quality
2.4.3. Physical Activity
2.4.4. Anthropometrics
2.4.5. Biochemical Measurements
2.4.6. Other Assessments
2.5. Statistical Analysis
3. Results
3.1. Characteristics of Particpants
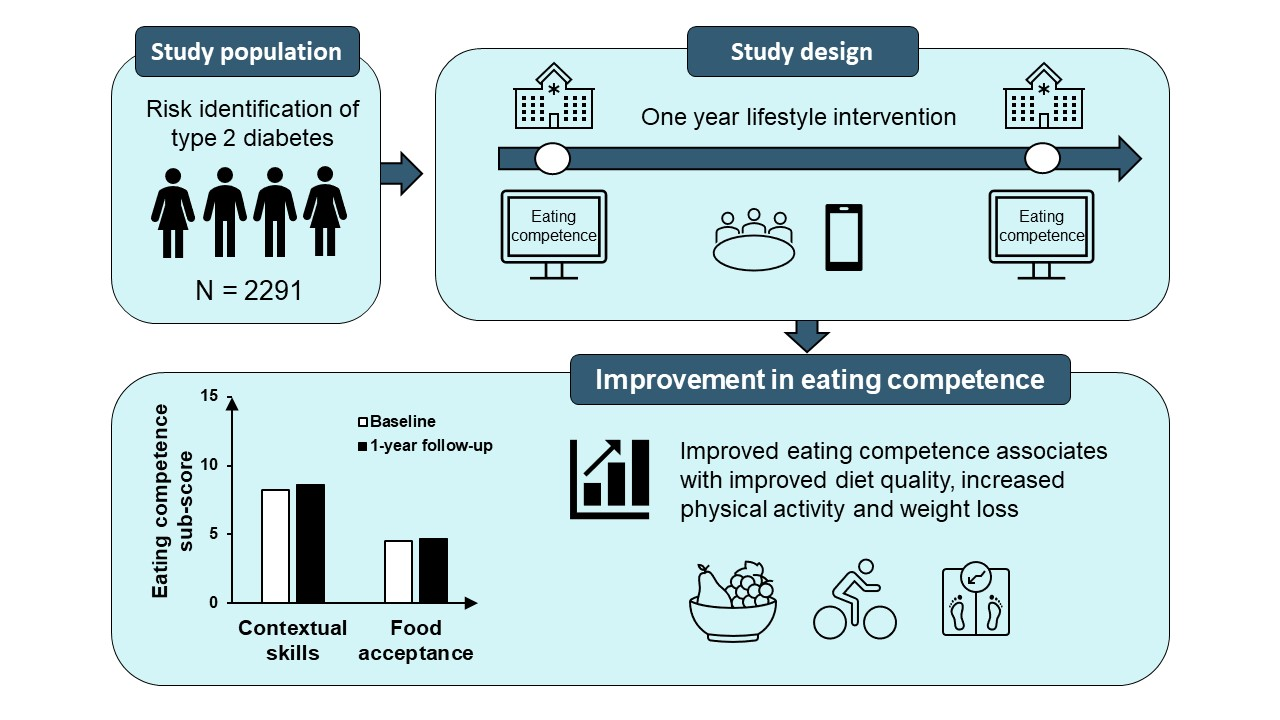
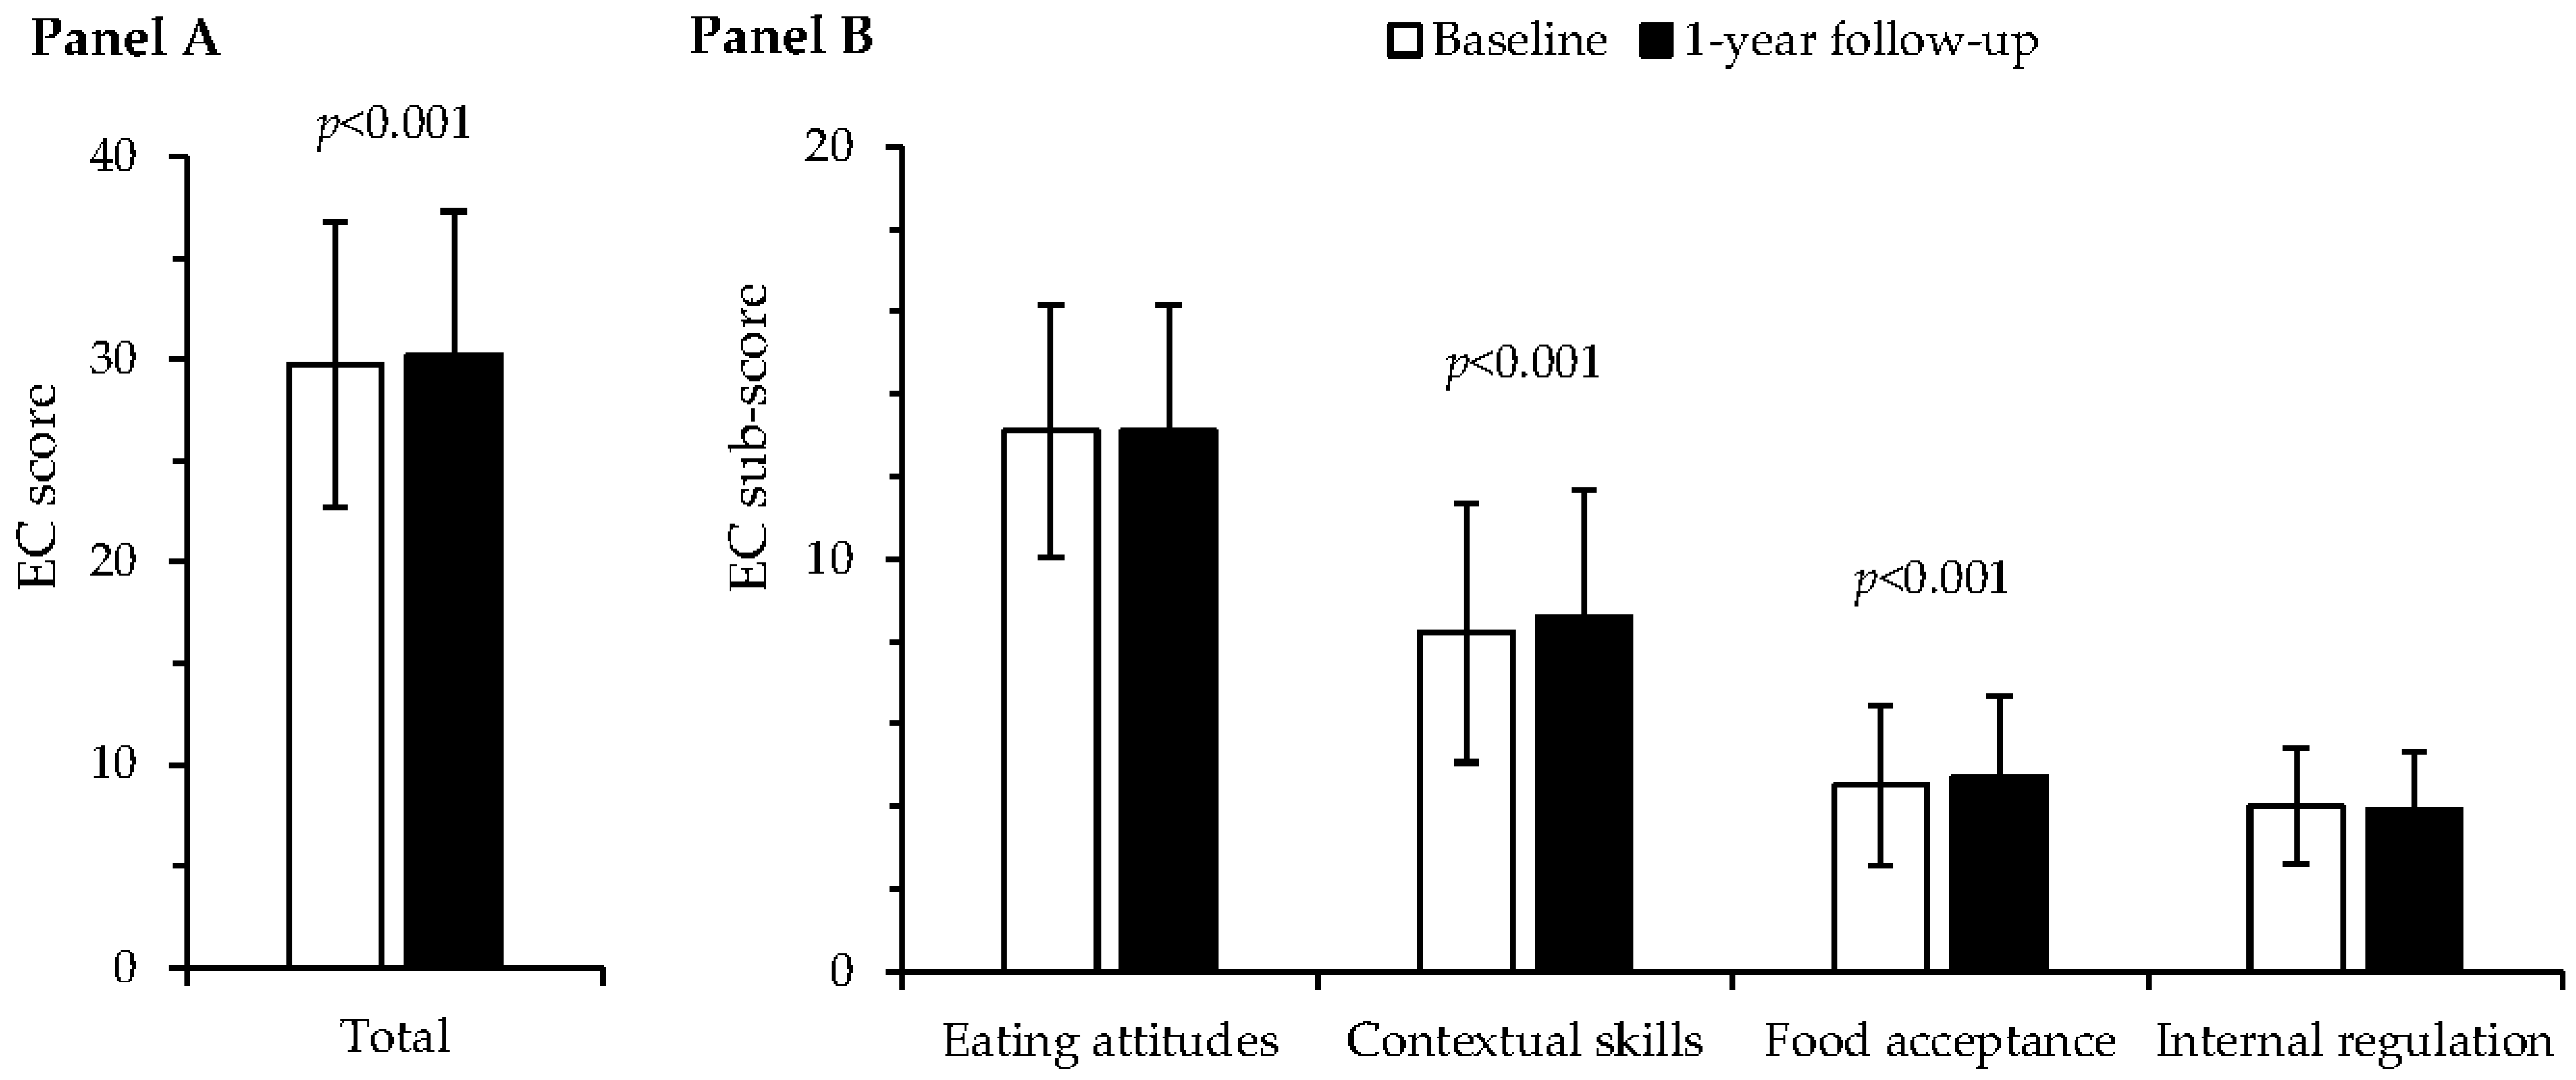
3.2. Eating Competence at Baseline and Change in Eating Competence over One Year
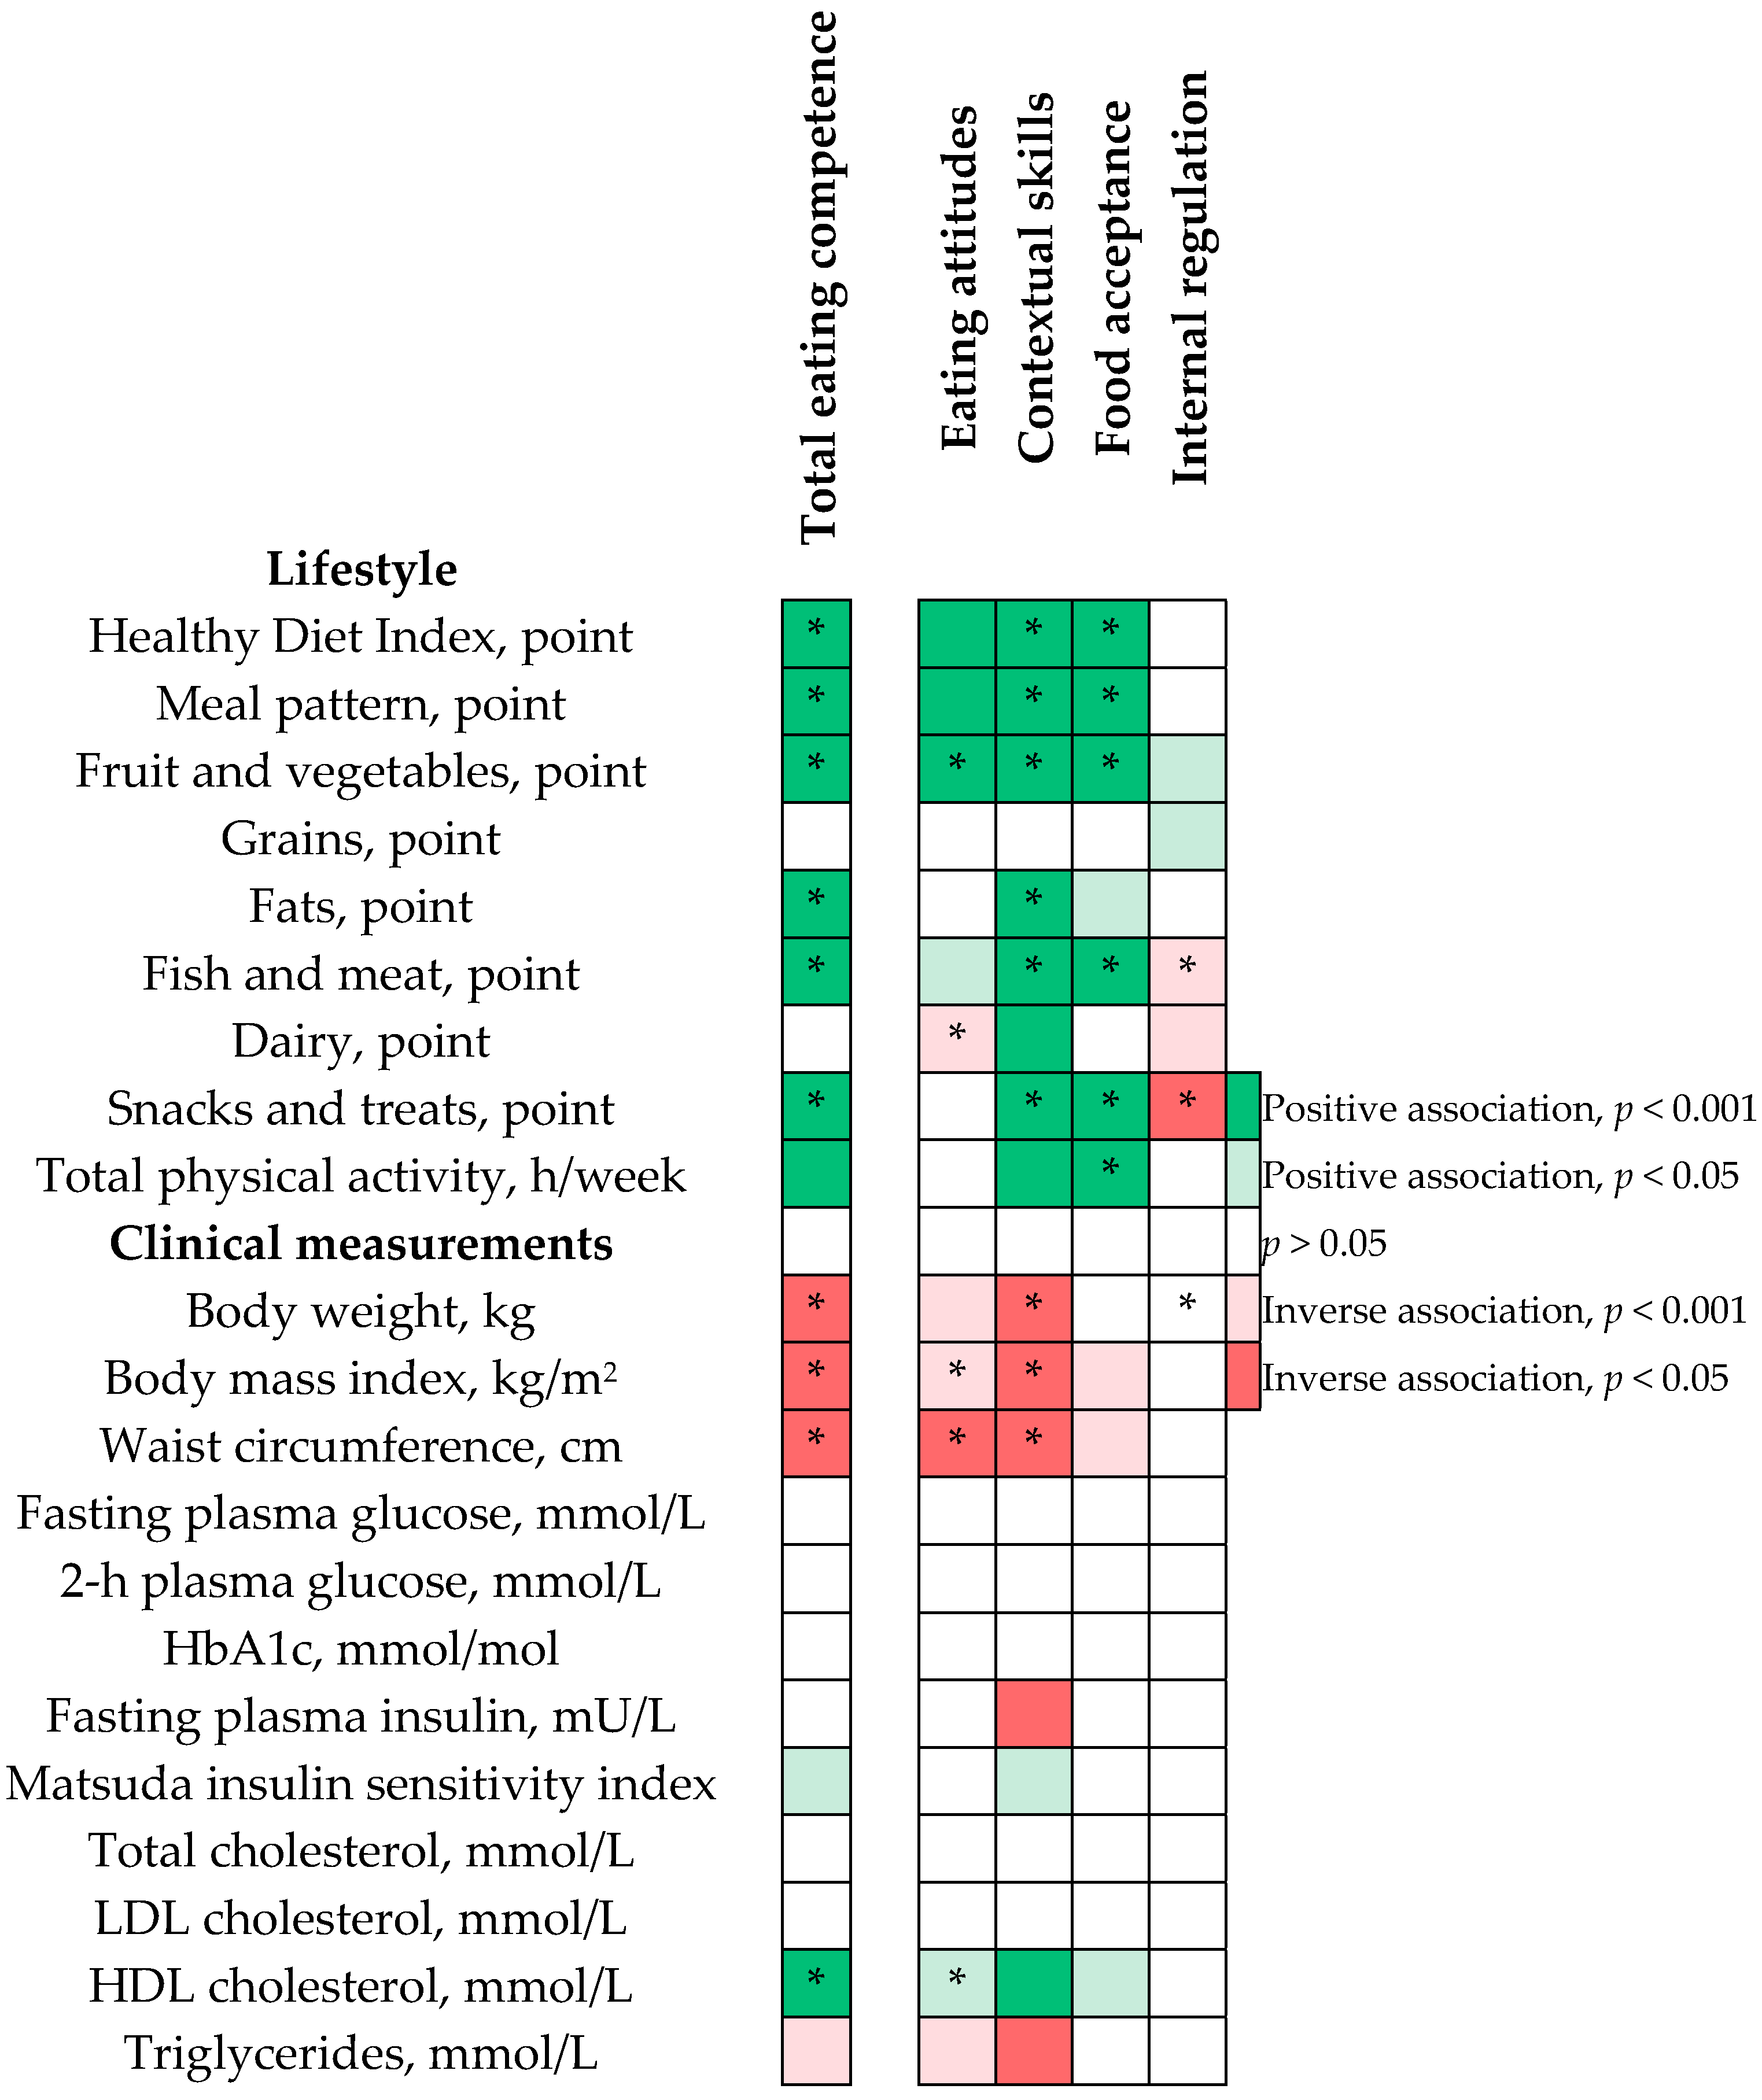
3.3. Change in Eating Competence Total Score Associated with Changes in Diet Quality and Physical Activity
3.4. Change in Eating Competence Total Score Associated with Changes in Anthropometry
3.5. Change in Eating Competence Total Score Associated with Changes in Biomarkers of Glucose and Lipid Metabolism
3.6. Changes Is Eating Competence Sub-Scores Associated with Changes in Diet and Clinical Characteristics
4. Discussion
5. Conclusions
Author Contributions
Funding
Institutional Review Board Statement
Informed Consent Statement
Data Availability Statement
Acknowledgments
Conflicts of Interest
Appendix A


| Eating Attitudes | Contextual Skills | Food Acceptance | Internal Regulation | ||||||
|---|---|---|---|---|---|---|---|---|---|
| β (95% CI) | p Value | β (95% CI) | p Value | β (95% CI) | p Value | β (95% CI) | p Value | ||
| Diet quality | |||||||||
| Healthy Diet Index | Model 1 | 0.18 (0.08 to 0.28) | <0.001 | 0.76 (0.67 to 0.85) | <0.001 | 0.72 (0.57 to 0.87) | <0.001 | 0.05 (−0.14 to 0.24) | 0.611 |
| Model 2 | 0.12 (−0.0002 to 0.24) | 0.050 | 0.55 (0.43 to 0.66) | <0.001 | 0.48 (0.30 to 0.67) | <0.001 | 0.01 (−0.21 to 0.24) | 0.902 | |
| Meal pattern | Model 1 | 0.03 (0.02 to 0.04) | <0.001 | 0.08 (0.07 to 0.09) | <0.001 | 0.05 (0.04 to 0.07) | <0.001 | 0.02 (−0.004 to 0.04) | 0.114 |
| Model 2 | 0.01 (−0.003 to 0.03) | 0.122 | 0.05 (0.03 to 0.06) | <0.001 | 0.04 (0.01 to 0.06) | 0.002 | 0.01 (−0.02 to 0.04) | 0.343 | |
| Fruit and vegetables | Model 1 | 0.14 (0.09 to 0.19) | <0.001 | 0.38 (0.33 to 0.42) | <0.001 | 0.42 (0.35 to 0.50) | <0.001 | 0.13 (0.03 to 0.23) | 0.010 |
| Model 2 | 0.09 (0.03 to 0.16) | 0.006 | 0.26 (0.19 to 0.32) | <0.001 | 0.23 (0.13 to 0.33) | <0.001 | 0.11 (−0.01 to 0.23) | 0.078 | |
| Grains | Model 1 | 0.02 (−0.03 to 0.07) | 0.392 | 0.02 (−0.03 to 0.06) | 0.448 | 0.01 (−0.06 to 0.08) | 0.757 | 0.12 (0.03 to 0.22) | 0.007 |
| Model 2 | 0.03 (−0.03 to 0.09) | 0.413 | 0.01 (−0.04 to 0.07) | 0.639 | 0.03 (−0.06 to 0.12) | 0.538 | 0.08 (−0.03 to 0.19) | 0.130 | |
| Fats | Model 1 | 0.01 (−0.02 to 0.04) | 0.575 | 0.10 (0.07 to 0.13) | <0.001 | 0.05 (0.0002 to 0.10) | 0.049 | 0.04 (−0.02 to 0.11) | 0.196 |
| Model 2 | −0.001 (−0.04 to 0.04) | 0.948 | 0.07 (0.03 to 0.11) | 0.001 | 0.03 (−0.03 to 0.10) | 0.350 | 0.04 (−0.04 to 0.12) | 0.330 | |
| Fish and meat | Model 1 | 0.03 (0.01 to 0.05) | 0.005 | 0.10 (0.08 to 0.12) | <0.001 | 0.11 (0.09 to 0.14) | <0.001 | −0.06 (−0.10 to −0.02) | 0.002 |
| Model 2 | 0.02 (−0.005 to 0.04) | 0.126 | 0.07 (0.05 to 0.10) | <0.001 | 0.04 (0.006 to 0.08) | 0.022 | −0.07 (−0.11 to −0.02) | 0.003 | |
| Dairy | Model 1 | −0.03 (−0.05 to −0.01) | 0.001 | 0.04 (0.02 to 0.06) | <0.001 | 0.004 (−0.03 to 0.03) | 0.814 | −0.07 (−0.11 to −0.03) | 0.001 |
| Model 2 | −0.03 (−0.06 to −0.002) | 0.037 | 0.02 (−0.005 to 0.05) | 0.103 | 0.01 (−0.04 to 0.05) | 0.736 | −0.04 (−0.09 to 0.01) | 0.116 | |
| Snacks and treats | Model 1 | 0.003 (−0.02 to 0.03) | 0.832 | 0.10 (0.08 to 0.12) | <0.001 | 0.09 (0.06 to 0.13) | <0.001 | −0.12 (−0.17 to −0.07) | <0.001 |
| Model 2 | 0.01 (−0.02 to 0.04) | 0.435 | 0.09 (0.06 to 0.12) | <0.001 | 0.10 (0.05 to 0.14) | <0.001 | −0.10 (−0.16 to −0.05) | <0.001 | |
| Physical activity | |||||||||
| Total physical activity, h/week | Model 1 | 0.04 (−0.06 to 0.14) | 0.417 | 0.24 (0.14 to 0.33) | <0.001 | 0.36 (0.22 to 0.51) | <0.001 | −0.11 (−0.31 to 0.08) | 0.257 |
| Model 2 | −0.02 (−0.15 to 0.11) | 0.764 | 0.12 (−0.01 to 0.25) | 0.070 | 0.27 (0.07 to 0.47) | 0.009 | −0.16 (−0.40 to 0.09) | 0.209 | |
| Anthropometry | |||||||||
| Body weight, kg | Model 1 | −0.08 (−0.14 to −0.02) | 0.009 | −0.17 (−0.23 to −0.11) | <0.001 | −0.09 (−0.18 to 0.004) | 0.061 | 0.10 (−0.01 to 0.21) | 0.075 |
| Model 2 | −0.06 (−0.12 to 0.01) | 0.072 | −0.13 (−0.19 to −0.07) | <0.001 | −0.08 (−0.18 to 0.02) | 0.113 | 0.12 (0.002 to 0.23) | 0.046 | |
| Body mass index, kg/m2 | Model 1 | −0.04 (−0.06 to −0.01) | 0.001 | −0.07 (−0.09 to −0.04) | <0.001 | −0.04 (−0.07 to −0.001) | 0.041 | 0.03 (−0.01 to 0.07) | 0.111 |
| Model 2 | −0.02 (−0.05 to <−0.001) | 0.050 | −0.05 (−0.07 to −0.02) | <0.001 | −0.03 (−0.06 to 0.01) | 0.121 | 0.04 (−0.0002 to 0.08) | 0.051 | |
| Waist circumference, cm | Model 1 | −0.18 (−0.26 to −0.10) | <0.001 | −0.24 (−0.32 to −0.17) | <0.001 | −0.17 (−0.29 to −0.05) | 0.005 | 0.09 (−0.05 to 0.23) | 0.226 |
| Model 2 | −0.13 (−0.21 to −0.05) | 0.002 | −0.15 (−0.23 to −0.07) | <0.001 | −0.12 (−0.25 to 0.003) | 0.056 | 0.12 (−0.03 to 0.27) | 0.115 | |
| Glucose metabolism | |||||||||
| Fasting plasma glucose, mmol/L | Model 1 | −0.001 (−0.01 to 0.004) | 0.579 | −0.002 (−0.01 to 0.003) | 0.375 | 0.003 (−0.01 to 0.01) | 0.509 | 0.002 (−0.01 to 0.01) | 0.729 |
| Model 2 | 0.002 (−0.005 to 0.01) | 0.506 | 0.002 (−0.005 to 0.01) | 0.577 | 0.004 (−0.01 to 0.01) | 0.506 | 0.003 (−0.01 to 0.02) | 0.596 | |
| 2-h plasma glucose from OGTT, mmol/L | Model 1 | −0.005 (−0.02 to 0.01) | 0.567 | 0.003 (−0.01 to 0.02) | 0.749 | −0.02 (−0.04 to 0.01) | 0.278 | −0.01 (−0.04 to 0.03) | 0.768 |
| Model 2 | 0.005 (−0.02 to 0.03) | 0.704 | 0.02 (−0.004 to 0.04) | 0.111 | −0.02 (−0.05 to 0.02) | 0.342 | 0.02 (−0.03 to 0.06) | 0.459 | |
| HbA1c, mmol/mol | Model 1 | −0.02 (−0.05 to 0.02) | 0.385 | −0.03 (−0.07 to 0.002) | 0.064 | 0.001 (−0.05 to 0.05) | 0.973 | 0.01 (−0.06 to 0.08) | 0.701 |
| Model 2 | −0.02 (−0.07 to 0.02) | 0.346 | −0.02 (−0.07 to 0.02) | 0.314 | 0.04 (−0.03 to 0.11) | 0.240 | 0.01 (−0.08 to 0.09) | 0.903 | |
| Fasting plasma insulin, mU/L | Model 1 | 0.02 (−0.09 to 0.13) | 0.729 | −0.20 (−0.31 to −0.09) | <0.001 | −0.13 (−0.29 to 0.04) | 0.127 | 0.09 (−0.13 to 0.31) | 0.402 |
| Model 2 | 0.08 (−0.08 to 0.23) | 0.333 | 0.03 (−0.13 to 0.18) | 0.737 | −0.02 (−0.26 to 0.22) | 0.887 | 0.06 (−0.23 to 0.34) | 0.686 | |
| Matsuda insulin sensitivity index | Model 1 | 0.06 (−0.01 to 0.14) | 0.115 | 0.13 (0.05 to 0.20) | 0.001 | 0.06 (−0.06 to 0.17) | 0.322 | 0.02 (−0.13 to 0.17) | 0.807 |
| Model 2 | 0.05 (−0.05 to 0.14) | 0.313 | 0.03 (−0.07 to 0.12) | 0.574 | 0.02 (−0.13 to 0.16) | 0.802 | 0.04 (−0.14 to 0.21) | 0.681 | |
| Lipid metabolism | |||||||||
| Total cholesterol, mmol/L | Model 1 | −0.0002 (−0.01 to 0.01) | 0.960 | −0.002 (−0.01 to 0.01) | 0.578 | 0.01 (−0.004 to 0.02) | 0.193 | 0.02 (−0.002 to 0.03) | 0.075 |
| Model 2 | −0.003 (−0.01 to 0.01) | 0.579 | −0.01 (−0.02 to 0.01) | 0.293 | 0.01 (−0.01 to 0.02) | 0.430 | 0.01 (−0.01 to 0.03) | 0.388 | |
| LDL cholesterol, mmol/L | Model 1 | −0.002 (−0.01 to 0.01) | 0.585 | −0.004 (−0.01 to 0.004) | 0.368 | 0.01 (−0.01 to 0.02) | 0.288 | 0.01 (−0.005 to 0.03) | 0.173 |
| Model 2 | −0.01 (−0.02 to 0.004) | 0.244 | −0.004 (−0.01 to 0.01) | 0.417 | 0.01 (−0.01 to 0.02) | 0.503 | 0.004 (−0.02 to 0.02) | 0.712 | |
| HDL cholesterol, mmol/L | Model 1 | 0.005 (0.002 to 0.01) | 0.001 | 0.01 (0.002 to 0.01) | <0.001 | 0.004 (0.0002 to 0.01) | 0.040 | 0.0004 (−0.005 to 0.01) | 0.877 |
| Model 2 | 0.005 (0.002 to 0.01) | 0.001 | 0.003 (−0.0005 to 0.01) | 0.093 | 0.004 (−0.001 to 0.01) | 0.129 | 0.001 (−0.005 to 0.01) | 0.708 | |
| Triglycerides, mmol/L | Model 1 | −0.01 (−0.01 to −0.0001) | 0.048 | −0.01 (−0.02 to −0.01) | <0.001 | −0.01 (−0.02 to 0.003) | 0.279 | 0.01 (−0.003 to 0.02) | 0.126 |
| Model 2 | −0.004 (−0.01 to 0.004) | 0.317 | −0.01 (−0.01 to 0.002) | 0.163 | 0.003 (−0.01 to 0.02) | 0.663 | 0.01 (−0.002 to 0.03) | 0.095 |
References
- Tuomilehto, J.; Lindström, J.; Eriksson, J.G.; Valle, T.T.; Hämäläinen, H.; Ilanne-Parikka, P.; Keinänen-Kiukaanniemi, S.; Laakso, M.; Louheranta, A.; Rastas, M.; et al. Prevention of type 2 diabetes mellitus by changes in lifestyle among subjects with impaired glucose tolerance. N. Engl. J. Med. 2001, 344, 1343–1350. [Google Scholar] [CrossRef]
- Merlotti, C.; Morabito, A.; Pontiroli, A.E. Prevention of type 2 diabetes; a systematic review and meta-analysis of different intervention strategies. Diabetes Obes. Metab. 2014, 16, 719–727. [Google Scholar] [CrossRef] [PubMed]
- Afshin, A.; Sur, P.J.; Fay, K.A.; Cornaby, L.; Ferrara, G.; Salama, J.S.; Mullany, E.C.; Abate, K.H.; Abbafati, C.; Abebe, Z.; et al. Health effects of dietary risks in 195 countries, 1990–2017: A systematic analysis for the Global Burden of Disease Study 2017. Lancet 2019, 393, 1958–1972. [Google Scholar] [CrossRef] [Green Version]
- Uusitupa, M.; Khan, T.A.; Viguiliouk, E.; Kahleova, H.; Rivellese, A.A.; Hermansen, K.; Pfeiffer, A.; Thanopoulou, A.; Salas-Salvadó, J.; Schwab, U.; et al. Prevention of type 2 diabetes by lifestyle changes: A systematic review and meta-analysis. Nutrients 2019, 11, 2611. [Google Scholar] [CrossRef] [PubMed] [Green Version]
- Lindström, J.; Peltonen, M.; Eriksson, J.G.; Ilanne-Parikka, P.; Aunola, S.; Keinänen-Kiukaanniemi, S.; Uusitupa, M.; Tuomilehto, J. Improved lifestyle and decreased diabetes risk over 13 years: Long-term follow-up of the randomised Finnish Diabetes Prevention Study (DPS). Diabetologia 2013, 56, 284–293. [Google Scholar] [CrossRef] [PubMed] [Green Version]
- Satter, E. Eating Competence: Definition and evidence for the Satter Eating Competence Model. J. Nutr. Educ. Behav. 2007, 39, S142–S153. [Google Scholar] [CrossRef]
- Lohse, B.; Satter, E.; Horacek, T.; Gebreselassie, T.; Oakland, M.J. Measuring eating competence: Psychometric properties and validity of the ecSatter inventory. J. Nutr. Educ. Behav. 2007, 39, S154–S166. [Google Scholar] [CrossRef]
- Lohse, B.; Psota, T.; Estruch, R.; Zazpe, I.; Sorli, J.V.; Salas-Salvado, J.; Serra, M.; Krall, J.S.; Marquez, F.; Ros, E. Eating competence of elderly Spanish adults is associated with a healthy diet and a favorable cardiovascular disease risk profile. J. Nutr. 2010, 140, 1322–1327. [Google Scholar] [CrossRef] [PubMed] [Green Version]
- Tilles-Tirkkonen, T.; Aittola, K.; Männikkö, R.; Absetz, P.; Kolehmainen, M.; Schwab, U.; Lindström, J.; Lakka, T.; Pihlajamäki, J.; Karhunen, L. Eating competence is associated with lower prevalence of obesity and better insulin sensitivity in Finnish adults with increased risk for type 2 diabetes: The StopDia study. Nutrients 2020, 12, 104. [Google Scholar] [CrossRef] [Green Version]
- Krall, J.S.; Lohse, B. Validation of a measure of the Satter Eating Competence Model with low-income females. Int. J. Behav. Nutr. Phys. Act. 2011, 8, 26. [Google Scholar] [CrossRef] [Green Version]
- Lohse, B.; Bailey, R.L.; Krall, J.S.; Wall, D.E.; Mitchell, D.C. Diet quality is related to eating competence in cross-sectional sample of low-income females surveyed in Pennsylvania. Appetite 2012, 58, 645–650. [Google Scholar] [CrossRef]
- Lohse, B.; Krall, J.S.; Psota, T.; Kris-Etherton, P. Impact of a Weight management intervention on eating competence: Importance of measurement interval in protocol design. Am. J. Health Promot. 2018, 32, 718–728. [Google Scholar] [CrossRef]
- De Queiroz, F.L.N.; Nakano, E.Y.; Botelho, R.B.A.; Ginani, V.C.; Cançado, A.L.F.; Zandonadi, R.P. Eating competence associated with food consumption and health outcomes among Brazilian adult population. Nutrients 2020, 12, 3218. [Google Scholar] [CrossRef] [PubMed]
- Clifford, D.; Keeler, L.A.; Gray, K.; Steingrube, A.; Morris, M.N. Weight attitudes predict eating competence among college students. Fam. Consum. Sci. Res. J. 2010, 39, 184–193. [Google Scholar] [CrossRef]
- Quick, V.; Shoff, S.; Lohse, B.; White, A.; Horacek, T.; Greene, G. Relationships of eating competence, sleep behaviors and quality, and overweight status among college students. Eat. Behav. 2015, 19, 15–19. [Google Scholar] [CrossRef] [Green Version]
- Bloom, L.; Shelton, B.; Bengough, M.; Brennan, L. Psychosocial outcomes of a non-dieting based positive body image community program for overweight adults: A pilot study. J. Eat. Disord. 2013, 1, 44. [Google Scholar] [CrossRef] [PubMed] [Green Version]
- Järvelä-Reijonen, E.; Karhunen, L.; Sairanen, E.; Muotka, J.; Lindroos, S.; Laitinen, J.; Puttonen, S.; Peuhkuri, K.; Hallikainen, M.; Pihlajamäki, J.; et al. The effects of acceptance and commitment therapy on eating behavior and diet delivered through face-to-face contact and a mobile app: A randomized controlled trial. Int. J. Behav. Nutr. Phys. Act. 2018, 15, 1–14. [Google Scholar] [CrossRef] [Green Version]
- Pihlajamäki, J.; Männikkö, R.; Tilles-Tirkkonen, T.; Karhunen, L.; Kolehmainen, M.; Schwab, U.; Lintu, N.; Paananen, J.; Järvenpää, R.; Harjumaa, M.; et al. Digitally supported program for type 2 diabetes risk identification and risk reduction in real-world setting: Protocol for the StopDia model and randomized controlled trial. BMC Public Health 2019, 19, 255. [Google Scholar] [CrossRef] [Green Version]
- Lindström, J.; Tuomilehto, J. The diabetes risk score: A practical tool to predict type 2 diabetes risk. Diabetes Care 2003, 26, 725–731. [Google Scholar] [CrossRef] [Green Version]
- Harjumaa, M.; Absetz, P.; Ermes, M.; Mattila, E.; Männikkö, R.; Tilles-Tirkkonen, T.; Lintu, N.; Schwab, U.; Umer, A.; Leppänen, J.; et al. Internet-based lifestyle intervention to prevent type 2 diabetes through healthy habits: Design and 6-month usage results of randomized controlled trial. JMIR Diabetes 2020, 5, e15219. [Google Scholar] [CrossRef]
- Stotts, J.L.; Lohse, B. Reliability of the ecSatter inventory as a tool to measure eating competence. J. Nutr. Educ. Behav. 2007, 39, S167–S170. [Google Scholar] [CrossRef]
- Lohse, B. The Satter Eating Competence Inventory for Low-income persons is a valid measure of eating competence for persons of higher socioeconomic position. Appetite 2015, 87, 223–228. [Google Scholar] [CrossRef]
- Krall, J.S.; Lohse, B. Cognitive testing with female nutrition and education assistance program participants informs validity of the Satter Eating Competence Inventory. J. Nutr. Educ. Behav. 2010, 42, 277–283. [Google Scholar] [CrossRef]
- Järvelä-Reijonen, E.; Karhunen, L.; Sairanen, E.; Rantala, S.; Laitinen, J.; Puttonen, S.; Peuhkuri, K.; Hallikainen, M.; Juvonen, K.; Myllymäki, T.; et al. High perceived stress is associated with unfavorable eating behavior in overweight and obese Finns of working age. Appetite 2016, 103, 249–258. [Google Scholar] [CrossRef] [Green Version]
- Godleski, S.; Lohse, B.; Krall, J.S. Satter Eating Competence Inventory subscale restructure after confirmatory factor analysis. J. Nutr. Educ. Behav. 2019, 51, 1003–1010. [Google Scholar] [CrossRef]
- Lindström, J.; Aittola, K.; Pölönen, A.; Hemiö, K.; Ahonen, K.; Karhunen, L.; Männikkö, R.; Siljamäki-Ojansuu, U.; Tilles-Tirkkonen, T.; Virtanen, E.; et al. Formation and validation of the Healthy Diet Index (HDI) for evaluation of diet quality in healthcare. Int. J. Environ. Res. Public Health 2021, 18, 2362. [Google Scholar] [CrossRef]
- VRN Valtion Ravitsemusneuvottelukunta. Terveyttä Ruoasta-Suomalaiset Ravitsemussuositukset 2014, 5th ed.; Valtion Ravitsemusneuvottelukunta: Helsinki, Finland, 2018; pp. 1–56. [Google Scholar]
- Matsuda, M.; DeFronzo, R.A. Insulin sensitivity indices obtained from oral glucose tolerance testing: Comparison with the euglycemic insulin clamp. Diabetes Care 1999, 22, 1462–1470. [Google Scholar] [CrossRef] [PubMed]
- Stancakova, A.; Javorsky, M.; Kuulasmaa, T.; Haffner, S.M.; Kuusisto, J.; Laakso, M. Changes in insulin sensitivity and insulin release in relation to glycemia and glucose tolerance in 6,414 Finnish men. Diabetes 2009, 58, 1212–1221. [Google Scholar] [CrossRef] [PubMed] [Green Version]
- Association, A.D. Classification and diagnosis of diabetes: Standards of Medical Care in Diabetes-2020. Diabetes Care 2020, 43, S14–S31. [Google Scholar] [CrossRef] [PubMed] [Green Version]
- Harris, P.A.; Taylor, R.; Thielke, R.; Payne, J.; Gonzalez, N.; Conde, J.G. Research electronic data capture (REDCap)-a metadata-driven methodology and workflow process for providing translational research informatics support. J. Biomed. Inform. 2009, 42, 377–381. [Google Scholar] [CrossRef] [PubMed] [Green Version]
- Lee, D.H.; Keum, N.; Hu, F.B.; Orav, E.J.; Rimm, E.B.; Willett, W.C.; Giovannucci, E.L. Comparison of the association of predicted fat mass, body mass index, and other obesity indicators with type 2 diabetes risk: Two large prospective studies in US men and women. Eur. J. Epidemiol. 2018, 33, 1113–1123. [Google Scholar] [CrossRef] [PubMed]
- Bellou, V.; Belbasis, L.; Tzoulaki, I.; Evangelou, E. Risk factors for type 2 diabetes mellitus: An exposure-wide umbrella review of meta-analyses. PLoS ONE 2018, 13, e0194127. [Google Scholar] [CrossRef] [PubMed]
- Galaviz, K.I.; Weber, M.B.; Straus, A.; Haw, J.S.; Venkat Narayan, K.M.; Ali, M.K. Global diabetes prevention interventions: A systematic review and network meta-analysis of the real-world impact on incidence, weight, and glucose. Diabetes Care 2018, 41, 1526–1534. [Google Scholar] [CrossRef] [PubMed] [Green Version]
- Pajunen, P.; Vartiainen, E.; Männistö, S.; Jousilahti, P.; Laatikainen, T.; Peltonen, M. Intra-individual changes in body weight in population-based cohorts during four decades: The Finnish FINRISK study. Eur. J. Public Health 2012, 22, 107–112. [Google Scholar] [CrossRef] [PubMed] [Green Version]
- Di Cesare, M.; Bentham, J.; Stevens, G.A.; Zhou, B.; Danaei, G.; Lu, Y.; Bixby, H.; Cowan, M.J.; Riley, L.M.; Hajifathalian, K.; et al. Trends in adult body-mass index in 200 countries from 1975 to 2014: A pooled analysis of 1698 population-based measurement studies with 19.2 million participants. Lancet 2016, 387, 1377–1396. [Google Scholar]
- alsta, L.; Kaartinen, N.; Tapanainen, H.; Männistö, S. (Eds.) Nutrition in Finland–The National FinDiet 2017 Survey; Report 12/2018; Institute for Health and Welfare (THL): Helsinki, Finland, 2018; pp. 1–239. [Google Scholar]
- Schwingshackl, L.; Hoffmann, G.; Lampousi, A.M.; Knüppel, S.; Iqbal, K.; Schwedhelm, C.; Bechthold, A.; Schlesinger, S.; Boeing, H. Food groups and risk of type 2 diabetes mellitus: A systematic review and meta-analysis of prospective studies. Eur. J. Epidemiol. 2017, 32, 363–375. [Google Scholar] [CrossRef] [Green Version]
- Schlesinger, S.; Neuenschwander, M.; Schwedhelm, C.; Hoffmann, G.; Bechthold, A.; Boeing, H.; Schwingshackl, L. Food groups and risk of overweight, obesity, and weight gain: A systematic review and dose-response meta-analysis of prospective studies. Adv. Nutr. 2019, 10, 205–218. [Google Scholar] [CrossRef] [Green Version]
- Kärkkäinen, U.; Mustelin, L.; Raevuori, A.; Kaprio, J.; Keski-Rahkonen, A. Successful weight maintainers among young adults—A ten-year prospective population study. Eat. Behav. 2018, 29, 91–98. [Google Scholar] [CrossRef] [Green Version]
- Larsen, S.C.; Heitmann, B.L. More frequent intake of regular meals and less frequent snacking are weakly associated with lower long-term gains in body mass index and fat mass in middle-aged men and women. J. Nutr. 2019, 149, 824–830. [Google Scholar] [CrossRef]
- Bédard, A.; Lamarche, P.O.; Grégoire, L.M.; Trudel-Guy, C.; Provencher, V.; Desroches, S.; Lemieux, S. Can eating pleasure be a lever for healthy eating? A systematic scoping review of eating pleasure and its links with dietary behaviors and health. PLoS ONE 2021, 15, e0244292. [Google Scholar] [CrossRef]
- Rose, S.A.; Poynter, P.S.; Anderson, J.W.; Noar, S.M.; Conigliaro, J. Physician weight loss advice and patient weight loss behavior change: A literature review and meta-analysis of survey data. Int. J. Obes. 2013, 37, 118–128. [Google Scholar] [CrossRef] [PubMed] [Green Version]
- Battista, F.; Ermolao, A.; Baak, M.A.; van Beaulieu, K.; Blundell, J.E.; Busetto, L.; Carraça, E.V.; Encantado, J.; Dicker, D.; Farpour-Lambert, N.; et al. Effect of exercise on cardiometabolic health of adults with overweight or obesity: Focus on blood pressure, insulin resistance, and intrahepatic fat—A systematic review and meta-analysis. Obes. Rev. 2021, 22, e13269. [Google Scholar] [CrossRef] [PubMed]
- Hemiö, K.; Pölönen, A.; Ahonen, K.; Kosola, M.; Viitasalo, K.; Lindström, J. A simple tool for diet evaluation in primary health care: Validation of a 16-item food intake questionnaire. Int. J. Environ. Res. Public Health 2014, 11, 2683–2697. [Google Scholar] [CrossRef] [PubMed] [Green Version]
- Dowd, K.P.; Szeklicki, R.; Minetto, M.A.; Murphy, M.H.; Polito, A.; Ghigo, E.; Ploeg, H.; van der Ekelund, U.; Maciaszek, J.; Stemplewski, R.; et al. A systematic literature review of reviews on techniques for physical activity measurement in adults: A DEDIPAC study. Int. J. Behav. Nutr. Phys. Act. 2018, 15, 1–13. [Google Scholar] [CrossRef] [PubMed]
- Burrows, T.L.; Ho, Y.Y.; Rollo, M.E.; Collins, C.E. Validity of dietary assessment methods when compared to the method of doubly labeled water: A systematic review in adults. Front. Endocrinol. 2019, 10, 850. [Google Scholar] [CrossRef] [PubMed] [Green Version]
- Koponen, P.; Borodulin, K.; Lundqvist, A.; Sääksjärvi, K.; Koskinen, S. Health, Functional Capacity and Welfare in Finland–Fin Health 2017 Study; Report 4/2018; National Institute for Health and Welfare (THL): Helsinki, Finland, 2018; pp. 1–236. [Google Scholar]


| Descriptive Variable | Control (n = 778) | Digital (n = 751) | Combined Digital and Group-Based (n = 762) |
|---|---|---|---|
| Sex, women | 628 (81%) | 601 (80%) | 617 (81%) |
| Age, years | 56.2 (9.3) | 55.8 (9.6) | 56.4 (9.6) |
| Native country, Finland | 771 (99%) | 744 (99%) | 756 (99%) |
| Study province | |||
| Northern Savo | 220 (28%) | 200 (27%) | 216 (28%) |
| Southern Carelia | 204 (26%) | 213 (28%) | 210 (28%) |
| Päijät-Häme | 354 (46%) | 338 (45%) | 336 (44%) |
| Education level | |||
| Low | 53 (7%) | 40 (5%) | 64 (8%) |
| Medium | 211 (27%) | 206 (27%) | 192 (25%) |
| High | 514 (66%) | 505 (67%) | 506 (66%) |
| Total physical activity, h/week * | 10.4 (11.1) | 10.2 (9.0) | 9.7 (8.6) |
| Healthy Diet Index (range 0–100) * | 63.0 (10.6) | 62.8 (11.3) | 63.0 (10.9) |
| Use of cholesterol lowering medication | 141 (18%) | 129 (17%) | 131 (17%) |
| Body weight, kg | 86.4 (16.6) | 85.4 (16.9) | 85.2 (17.3) |
| Body mass index, kg/m2 | 31.1 (5.4) | 30.7 (5.3) | 30.7 (5.4) |
| Waist circumference, cm | 102 (13) | 100 (13) | 101 (13) |
| Fasting plasma glucose, mmol/L * | 5.60 (0.56) | 5.55 (0.56) | 5.59 (0.57) |
| 2-h plasma glucose, mmol/L * | 6.38 (1.76) | 6.26 (1.68) | 6.45 (1.73) |
| EC total score (range 0–48) | 29.8 (7.0) | 29.8 (6.9) | 29.6 (7.2) |
| Median (IQR) | 30 (26–34) | 30 (25–35) | 30 (25–34) |
| Eating attitudes (range 0–18) | 13.1 (3.0) | 13.1 (3.0) | 13.1 (3.2) |
| Median (IQR) | 13 (11–15) | 13 (11–15) | 13 (11–15) |
| Contextual skills (range 0–15) | 8.2 (3.2) | 8.1 (3.1) | 8.1 (3.1) |
| Median (IQR) | 9 (6–10) | 9 (6–10) | 8 (6–10) |
| Food acceptance (range 0–9) | 4.4 (1.9) | 4.5 (1.9) | 4.5 (2.0) |
| Median (IQR) | 4 (3–6) | 5 (3–6) | 4 (3–6) |
| Internal regulation (range 0–6) | 4.0 (1.4) | 4.0 (1.4) | 3.9 (1.4) |
| Median (IQR) | 4 (3–5) | 4 (3–5) | 4 (3–5) |
| Eating competent (score ≥ 32 from ecSI 2.0TM) | 307 (40%) | 308 (41%) | 294 (39%) |
| Model 1 | Model 2 | |||
|---|---|---|---|---|
| Outcome Measures | β (95% CI) | p Value | β (95% CI) | p Value |
| Diet Quality | ||||
| Healthy Diet Index, points | 0.25 (0.21 to 0.30) | <0.001 | 0.18 (0.13 to 0.24) | <0.001 |
| Meal pattern | 0.03 (0.02 to 0.03) | <0.001 | 0.02 (0.01 to 0.02) | <0.001 |
| Fruit and vegetables | 0.15 (0.12 to 0.17) | <0.001 | 0.10 (0.07 to 0.13) | <0.001 |
| Grains | 0.01 (−0.01 to 0.03) | 0.160 | 0.02 (−0.01 to 0.04) | 0.273 |
| Fats | 0.03 (0.02 to 0.04) | <0.001 | 0.02 (−0.001 to 0.04) | 0.059 |
| Fish and meat | 0.03 (0.02 to 0.04) | <0.001 | 0.02 (0.01 to 0.03) | 0.001 |
| Dairy | −0.002 (−0.01 to 0.01) | 0.601 | −0.003 (−0.02 to 0.01) | 0.660 |
| Snacks and treats | 0.02 (0.01 to 0.03) | <0.001 | 0.02 (0.01 to 0.04) | 0.001 |
| Physical activity | ||||
| Total physical activity, h/week | 0.08 (0.04 to 0.12) | <0.001 | 0.03 (−0.03 to 0.09) | 0.291 |
| Anthropometry | ||||
| Body weight, kg | −0.06 (−0.08 to −0.03) | <0.001 | −0.04 (−0.07 to −0.01) | 0.008 |
| Body mass index, kg/m2 | −0.02 (−0.03 to −0.01) | <0.001 | −0.01 (−0.03 to −0.004) | 0.006 |
| Waist circumference, cm | −0.10 (−0.13 to −0.06) | <0.001 | −0.06 (−0.10 to −0.02) | 0.001 |
| Glucose metabolism | ||||
| HbA1c, mmol/mol | −0.01 (−0.02 to 0.01) | 0.259 | −0.01 (−0.03 to 0.02) | 0.616 |
| Fasting plasma glucose, mmol/L | −0.0004 (−0.003 to 0.002) | 0.706 | 0.002 (−0.002 to 0.005) | 0.342 |
| 2-h plasma glucose from OGTT, mmol/L | −0.002 (−0.01 to 0.01) | 0.623 | 0.01 (−0.01 to 0.02) | 0.371 |
| Fasting plasma insulin, mU/L | −0.04 (−0.09 to 0.005) | 0.079 | 0.03 (−0.04 to 0.10) | 0.450 |
| Matsuda insulin sensitivity index | 0.04 (0.01 to 0.08) | 0.011 | 0.02 (−0.03 to 0.06) | 0.404 |
| Lipid metabolism | ||||
| Total cholesterol, mmol/L | 0.001 (−0.003 to 0.005) | 0.614 | −0.001 (−0.01 to 0.004) | 0.727 |
| LDL cholesterol, mmol/L | −0.0001 (−0.004 to 0.003) | 0.972 | −0.002 (−0.01 to 0.003) | 0.506 |
| HDL cholesterol, mmol/L | 0.002 (0.001 to 0.004) | <0.001 | 0.002 (0.001 to 0.004) | 0.005 |
| Triglycerides, mmol/L | −0.004 (−0.01 to −0.001) | 0.009 | −0.001 (−0.005 to 0.003) | 0.629 |
Publisher’s Note: MDPI stays neutral with regard to jurisdictional claims in published maps and institutional affiliations. |
© 2021 by the authors. Licensee MDPI, Basel, Switzerland. This article is an open access article distributed under the terms and conditions of the Creative Commons Attribution (CC BY) license (https://creativecommons.org/licenses/by/4.0/).
Share and Cite
Aittola, K.; Karhunen, L.; Männikkö, R.; Järvelä-Reijonen, E.; Mikkonen, S.; Absetz, P.; Kolehmainen, M.; Schwab, U.; Harjumaa, M.; Lindström, J.; et al. Enhanced Eating Competence Is Associated with Improved Diet Quality and Cardiometabolic Profile in Finnish Adults with Increased Risk of Type 2 Diabetes. Nutrients 2021, 13, 4030. https://doi.org/10.3390/nu13114030
Aittola K, Karhunen L, Männikkö R, Järvelä-Reijonen E, Mikkonen S, Absetz P, Kolehmainen M, Schwab U, Harjumaa M, Lindström J, et al. Enhanced Eating Competence Is Associated with Improved Diet Quality and Cardiometabolic Profile in Finnish Adults with Increased Risk of Type 2 Diabetes. Nutrients. 2021; 13(11):4030. https://doi.org/10.3390/nu13114030
Chicago/Turabian StyleAittola, Kirsikka, Leila Karhunen, Reija Männikkö, Elina Järvelä-Reijonen, Santtu Mikkonen, Pilvikki Absetz, Marjukka Kolehmainen, Ursula Schwab, Marja Harjumaa, Jaana Lindström, and et al. 2021. "Enhanced Eating Competence Is Associated with Improved Diet Quality and Cardiometabolic Profile in Finnish Adults with Increased Risk of Type 2 Diabetes" Nutrients 13, no. 11: 4030. https://doi.org/10.3390/nu13114030