
Since our October 2021 EFO the real economy has performed largely as expected in 21-22 but tax receipts have come in well above that forecast. In this box, we examined reasons why tax receipts have recovered so quickly particularly in comparison to economic data.
This box is based on ONS data from March 2022 .
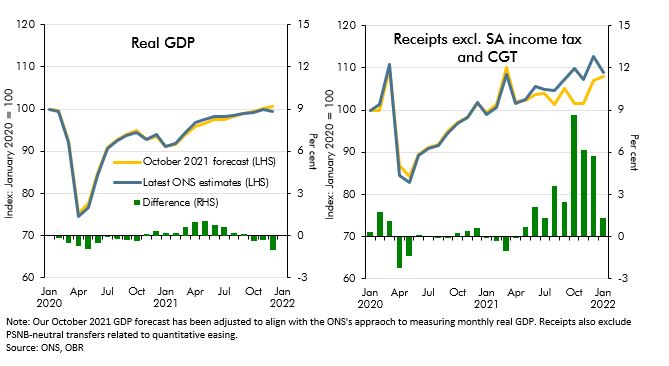
While the real economy has performed largely as expected since our October forecast, tax receipts have come in well above forecast (Chart A). And while consumer price inflation has exceeded our forecast, broader whole-economy inflation (the GDP deflator) has not, leaving nominal GDP also in line with our October forecast. The result is that we now expect the tax-to-GDP ratio this year to rise by 1.2 percentage points on last year, in contrast to the 0.5 percentage point fall we expected in October.a
Chart A: Real GDP and tax revenues: October forecast versus outturn
This outperformance of receipts relative to economic growth poses a challenge for our forecast, as the models we use to predict receipts are based on growth in tax bases, and other factors cannot explain all the strength in receipts this year. The unexplained strength in receipts in 2021- 22 amounts to £19.6 billion (0.8 per cent of GDP). Largely as a result, the tax-to-GDP ratio this year is, remarkably, set to be 1.4 percentage points higher than its pre-pandemic position in 2019-20 – whereas in October we assumed the ratio would be flat between those two years.
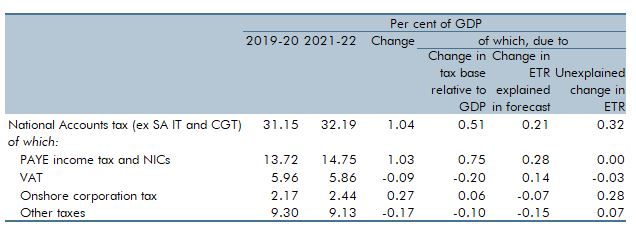
Understanding why receipts have recovered so strongly – and so much faster than nominal GDP – is therefore crucial to deciding how much of the recent strength will persist across the forecast. As Table A shows, our assessment is that the strength results from a combination of (i) growth in some tax bases outperforming nominal GDP and (ii) some effective tax rates (the pence raised in tax for every pound of tax base) having risen for identifiable reasons.b But it also shows that some of the strength in effective tax rates remains unexplained. As ever, the biggest yielding taxes account for much of the movement in the tax-to-GDP ratio. Taking them in turn:
- PAYE income tax and NICs receipts. Almost three-quarters of the jump in receipts relative to GDP reflects an increased labour share of national income, with wages and salaries
growing faster than nominal GDP thanks largely to fiscal support measures. The remaining quarter can be explained by fiscal drag – largely as a result of tax thresholds having risen only 0.5 per cent between 2019-20 and 2021-22, so that 8.9 per cent nominal earnings growth has dragged more income into higher tax brackets. - VAT. Relative to GDP, VAT receipts have remained broadly flat due to offsetting changes in the tax base and the effective tax rate. Household consumption has fallen relative to nominal GDP, which all else equal would have led to a 0.2 percentage point fall in the tax-to-GDP ratio. But the effective tax rate has risen due to a higher share of consumption on standard-rated items, such as durable goods, as well as a higher share of nonrefundable government procurement.
- Onshore corporation tax. Non-financial company profits have risen slightly as a share of GDP, which explains approximately a quarter of the rise in corporation tax relative to GDP. Financial sector profits have risen by 10 per cent between 2019-20 and 2021-22, while gross deductions (such as loss relief and capital allowances) have fallen relative to profits, increasing the effective tax rate. But the cost of the capital allowance superdeduction and other measures are so large that explainable contributions to the effective tax rate suggest that it should have fallen between 2019-20 and 2021-21. As a result, almost all the rise in receipts as a share of GDP is unexplained at this point.
- Other taxes. The modest fall in other taxes as a share of GDP is largely the result of identifiable sources of decline in effective tax rates – for example, due to the cuts to business rates that extended into 2021-22. And some tax bases have fallen relative to GDP – for example, the large drop in air travel that has hit air passenger duty receipts.
This analysis therefore explains two-thirds of the surprising rise in the tax-to-GDP ratio over this two-year period. Of the unexplained portion, nine-tenths relates to onshore corporation tax. It is
possible that this is due to other tax-related factors that we have not identified. But it is also possible that profits growth – an area that is particularly difficult to measure – has been faster than recorded in the National Accounts. For higher profits to explain all the 0.28 percentage points of the rise in onshore corporation tax receipts as a share of GDP that is currently unexplained, they would need to be around 13 per cent higher than our forecast assumes in 2021-22 based on the latest data. Such a large gap suggests other factors are at play too.
Table A: Explaining the rise in the tax-to-GDP ratio from 2019-20 to 2021-22
This box was originally published in Economic and fiscal outlook – March 2022