Key Stage 4 performance tables for 2019 have just been published along with associated statistics. Here’s a quick roundup of things we’ve spotted.
1. The south continues to outperform the north and Midlands – if you ignore context
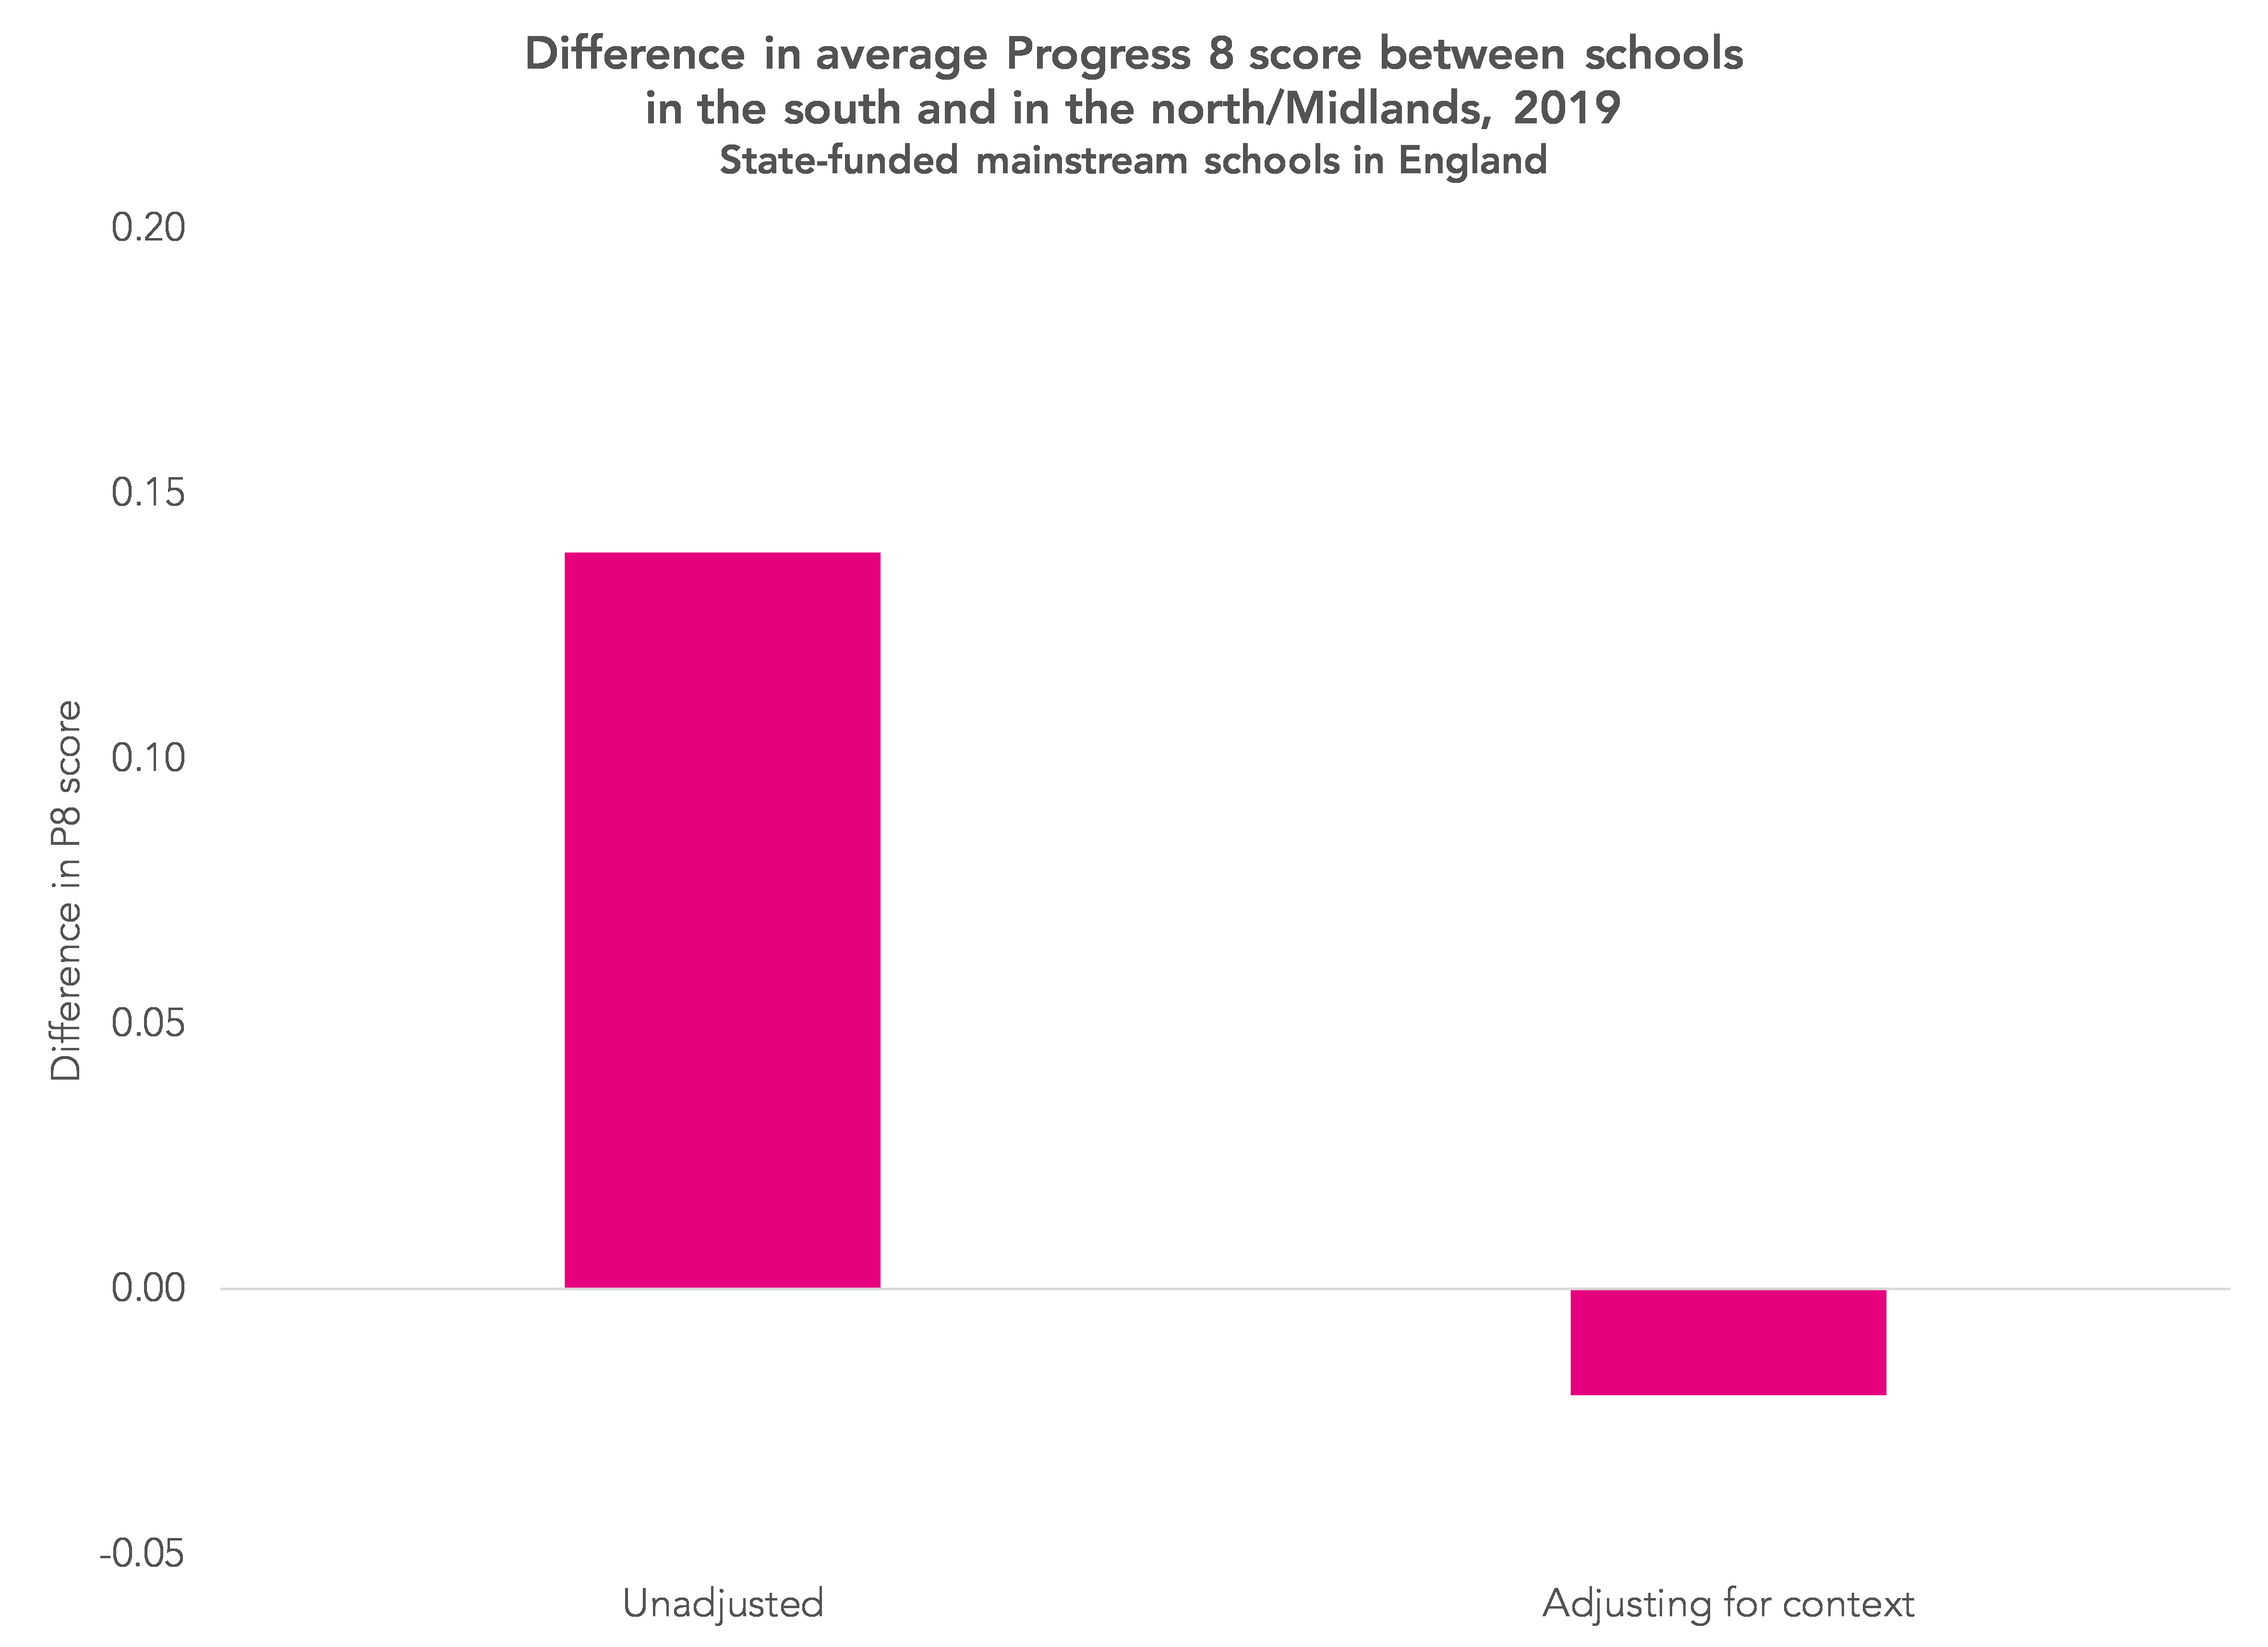
In this blogpost, we looked at recent claims made by the Sunday Times about a north-south divide in educational attainment.
Using today’s data to update this, we see that the average Progress 8 score for state-funded mainstream schools in the south[1] was 0.14 higher than that for schools in the north and Midlands. This is equivalent to around a seventh of a grade per pupil per subject.
However, this difference switches to a tiny difference (0.02) in favour of the north and Midlands if we take account of three key aspects of a school’s context: the percentage of pupils with a first language other than English, the percentage of pupils eligible for the Pupil Premium and the Key Stage 2 average point score of the cohort.
2. Slightly fewer schools are pursuing mass entry policies
We also recently looked at the practice of schools entering the vast majority – 75% or more – of their pupils for a qualification in a subject other than English, maths, science or religious studies.
We found 500 schools did so in 2018.[2]
And in today’s data there are 488 cases where the number of entries in at least one subject is at least 75% of the total number of pupils at a school – though this is on a slightly different basis to the figure of 500 schools, as the data published by the Department for Education today counts multiple entries by the same pupil. (In both cases, some of these schools will be small.)
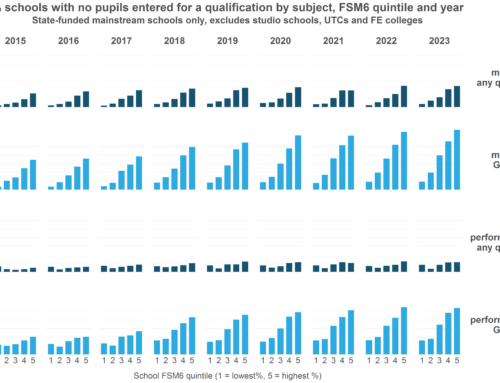
The chart below shows the subjects in which this happened most frequently.

A hundred schools entered the majority of its pupils for a non-GCSE qualification in personal finance[3] in 2019.
The number of schools doing similarly in non-GCSE sports science (usually BTEC but also including OCR National and some other qualifications) also increased. By contrast, the number entering more than 75% of their pupils in GCSE statistics fell. This may be because the reformed specification was available for the first time in 2019 and schools which entered pupils in legacy (A*-G) GCSEs in Year 10 would not have had their results counted.[4]
3. The disadvantage gap isn’t shrinking
Based on the DfE’s own measure – the attainment gap index- the gap between disadvantaged pupils and their peers has increased, albeit fractionally, for the second year in a row.

4. The importance of context
School performance measures tend to reflect the composition of the pupil intake more so than the quality of teaching and learning. Progress 8 recognises that school intakes vary in terms of prior attainment but not in terms of demographic characteristics.
Table CH1 of today’s statistical release shows how different groups of pupils perform nationally. I’ve summarised P8 scores in the chart below.

Girls tend to out-perform boys by just under half a grade per subject on average (in fact it is more than this in English). The gap between disadvantaged pupils and their peers is slightly higher. Pupils from the following ethnic backgrounds tend to be lower performing: Travellers of Irish heritage, Gypsy/Roma, black Caribbean and mixed white/black Caribbean. Pupils with a statement of SEN or an EHC plan tend to achieve very low P8 scores although these figures are somewhat misleading as I showed here.
Not only that, but there’s much more behind the surface. The long-term disadvantaged tend to be lower attaining than the short-term disadvantaged and the effects of disadvantage appear to vary according to ethnic background.
Pupils from these groups aren’t uniformly distributed between schools and this affects comparisons of schools’ P8 scores.
Solutions to this problem include calculating a contextualised P8 measure. Or comparing schools serving similar intakes. This is just what our Schools Like Yours tool does. It has now been updated with 2019 Key Stage 4 data.
Want to stay up-to-date with the latest research from FFT Education Datalab? Sign up to Datalab’s mailing list to get notifications about new blogposts, or to receive the team’s half-termly newsletter.
1. Defined as the following government office regions: London, south east, south west, East of England
2. Excluding grammar schools, studio schools and university technical colleges
3. LIBF Level 2 Certificate in Financial Education
4. Results in legacy GCSEs were not eligible for performance tables purposes
Leave A Comment