Article

Pre-Referral Primary Care Blood Tests and Symptom Presentation before Cancer Diagnosis: National Cancer Diagnosis Audit Data

1
Epidemiology of Cancer Healthcare and Outcomes (ECHO) Research Group, Department of Behavioural Science and Health, University College London, 1-19 Torrington Place, London WC1E 6BT, UK
2
University of Exeter Medical School, St Luke’s Campus, Exeter EX1 2HZ, UK
3
National Disease Registration Service, NHS England, Leeds LS1 4AP, UK
4
Cancer Research UK, London E20 1JQ, UK
5
Population Health Sciences Institute, Newcastle University, Newcastle upon Tyne NE1 4LP, UK
*
Author to whom correspondence should be addressed.
Cancers 2023, 15(14), 3587; https://doi.org/10.3390/cancers15143587
Submission received: 12 June 2023 / Accepted: 29 June 2023 / Published: 12 July 2023
(This article belongs to the Special Issue Cancer Detection in Primary Care)

Abstract

:

Simple Summary

Blood tests can support decisions by GPs about referring patients who present with symptoms of possible cancer for specialist assessment. This study analysed data on the use of blood tests in primary care in patients subsequently diagnosed with cancer to understand how often and when blood tests were used. We found that the use of generic blood tests (including full blood count, urea and electrolyte, liver function, and inflammatory marker tests) varied widely between patients presenting with different symptoms, with greater use in patients presenting with certain nonspecific symptoms (e.g., fatigue or loss of weight) and least frequently in those presenting with certain red-flag symptoms (e.g., breast or skin symptoms). Blood tests with greater specificity to certain organs/pathologies (including serum protein electrophoresis, ferritin, bone profile, and amylase tests) followed a similar use pattern regarding symptom specificity but at a lower use frequency. Commonly used cancer biomarkers were used in varying proportions depending on whether the presenting symptom could be related to prostate or ovarian cancer (for example, 88% of men presenting with lower urinary tract symptoms had presumed PSA measurement). The findings benchmark how often blood tests are used in certain clinical scenarios and identify opportunities for greater use in patients with symptoms of low (<3%) positive predictive value for cancer.

Abstract

Background: Blood tests can support the diagnostic process in primary care. Understanding how symptomatic presentations are associated with blood test use in patients subsequently diagnosed with cancer can help to benchmark current practices and guide interventions. Methods: English National Cancer Diagnosis Audit data on 39,751 patients with incident cancer in 2018 were analysed. The frequency of four generic (full blood count, urea and electrolytes, liver function tests, and inflammatory markers) and five organ-specific (cancer biomarkers (PSA or CA125), serum protein electrophoresis, ferritin, bone profile, and amylase) blood tests was described for a total of 83 presenting symptoms. The adjusted analysis explored variation in blood test use by the symptom-positive predictive value (PPV) group. Results: There was a large variation in generic blood test use by presenting symptoms, being higher in patients subsequently diagnosed with cancer who presented with nonspecific symptoms (e.g., fatigue 81% or loss of appetite 79%), and lower in those who presented with alarm symptoms (e.g., breast lump 3% or skin lesion 1%). Serum protein electrophoresis (reflecting suspicion of multiple myeloma) was most frequently used in cancer patients who presented with back pain (18%), and amylase measurement (reflecting suspicion of pancreatic cancer) was used in those who presented with upper abdominal pain (14%). Prostate-specific antigen (PSA) use was greatest in men with cancer who presented with lower urinary tract symptoms (88%), and CA125 in women with cancer who presented with abdominal distention (53%). Symptoms with PPV values between 2.00–2.99% were associated with greater test use (64%) compared with 52% and 51% in symptoms with PPVs in the 0.01–0.99 or 1.00–1.99% range and compared with 42% and 31% in symptoms with PPVs in either the 3.00–4.99 or ≥5% range (p < 0.001). Conclusions: Generic blood test use reflects the PPV of presenting symptoms, and the use of organ-specific tests is greater in patients with symptomatic presentations with known associations with certain cancer sites. There are opportunities for greater blood test use in patients presenting with symptoms that do not meet referral thresholds (i.e., <3% PPV for cancer) where information gain to support referral decisions is likely greatest. The findings benchmark blood test use in cancer patients, highlighting opportunities for increasing use.

1. Background

Most patients subsequently diagnosed with cancer first present with symptoms to their GP [1,2]. The nature of presenting symptoms is important for clinicians’ decisions on diagnostic management. For ‘alarm’ symptoms with relatively high predictive value for cancer, recommendations exist for urgent referrals for suspected cancer [3]. However, half of the patients with as-yet-undiagnosed cancer present with symptoms of lower specificity, for which clinical guideline recommendations about optimal management are lacking [4]. These patients typically experience longer intervals to diagnosis and are less likely to be referred to fast-track investigative pathways [5,6,7]. Evidence on the predictive value of blood tests for cancer supports their use in patients presenting with nonspecific symptoms [8,9,10,11,12,13,14,15]. Nonetheless, these potential benefits are contingent on the blood tests being ordered. Exploring variation in blood test use by presenting symptoms among patients subsequently diagnosed with cancer can provide a better understanding of the current clinical practice and determinants of blood test use. While certain predictors of primary care blood testing in cancer patients have been described [16], a detailed understanding of variation in their use by specific presenting symptoms is lacking. By generating evidence to address this gap, symptoms in which blood test use can be increased can be identified.

2. Methods

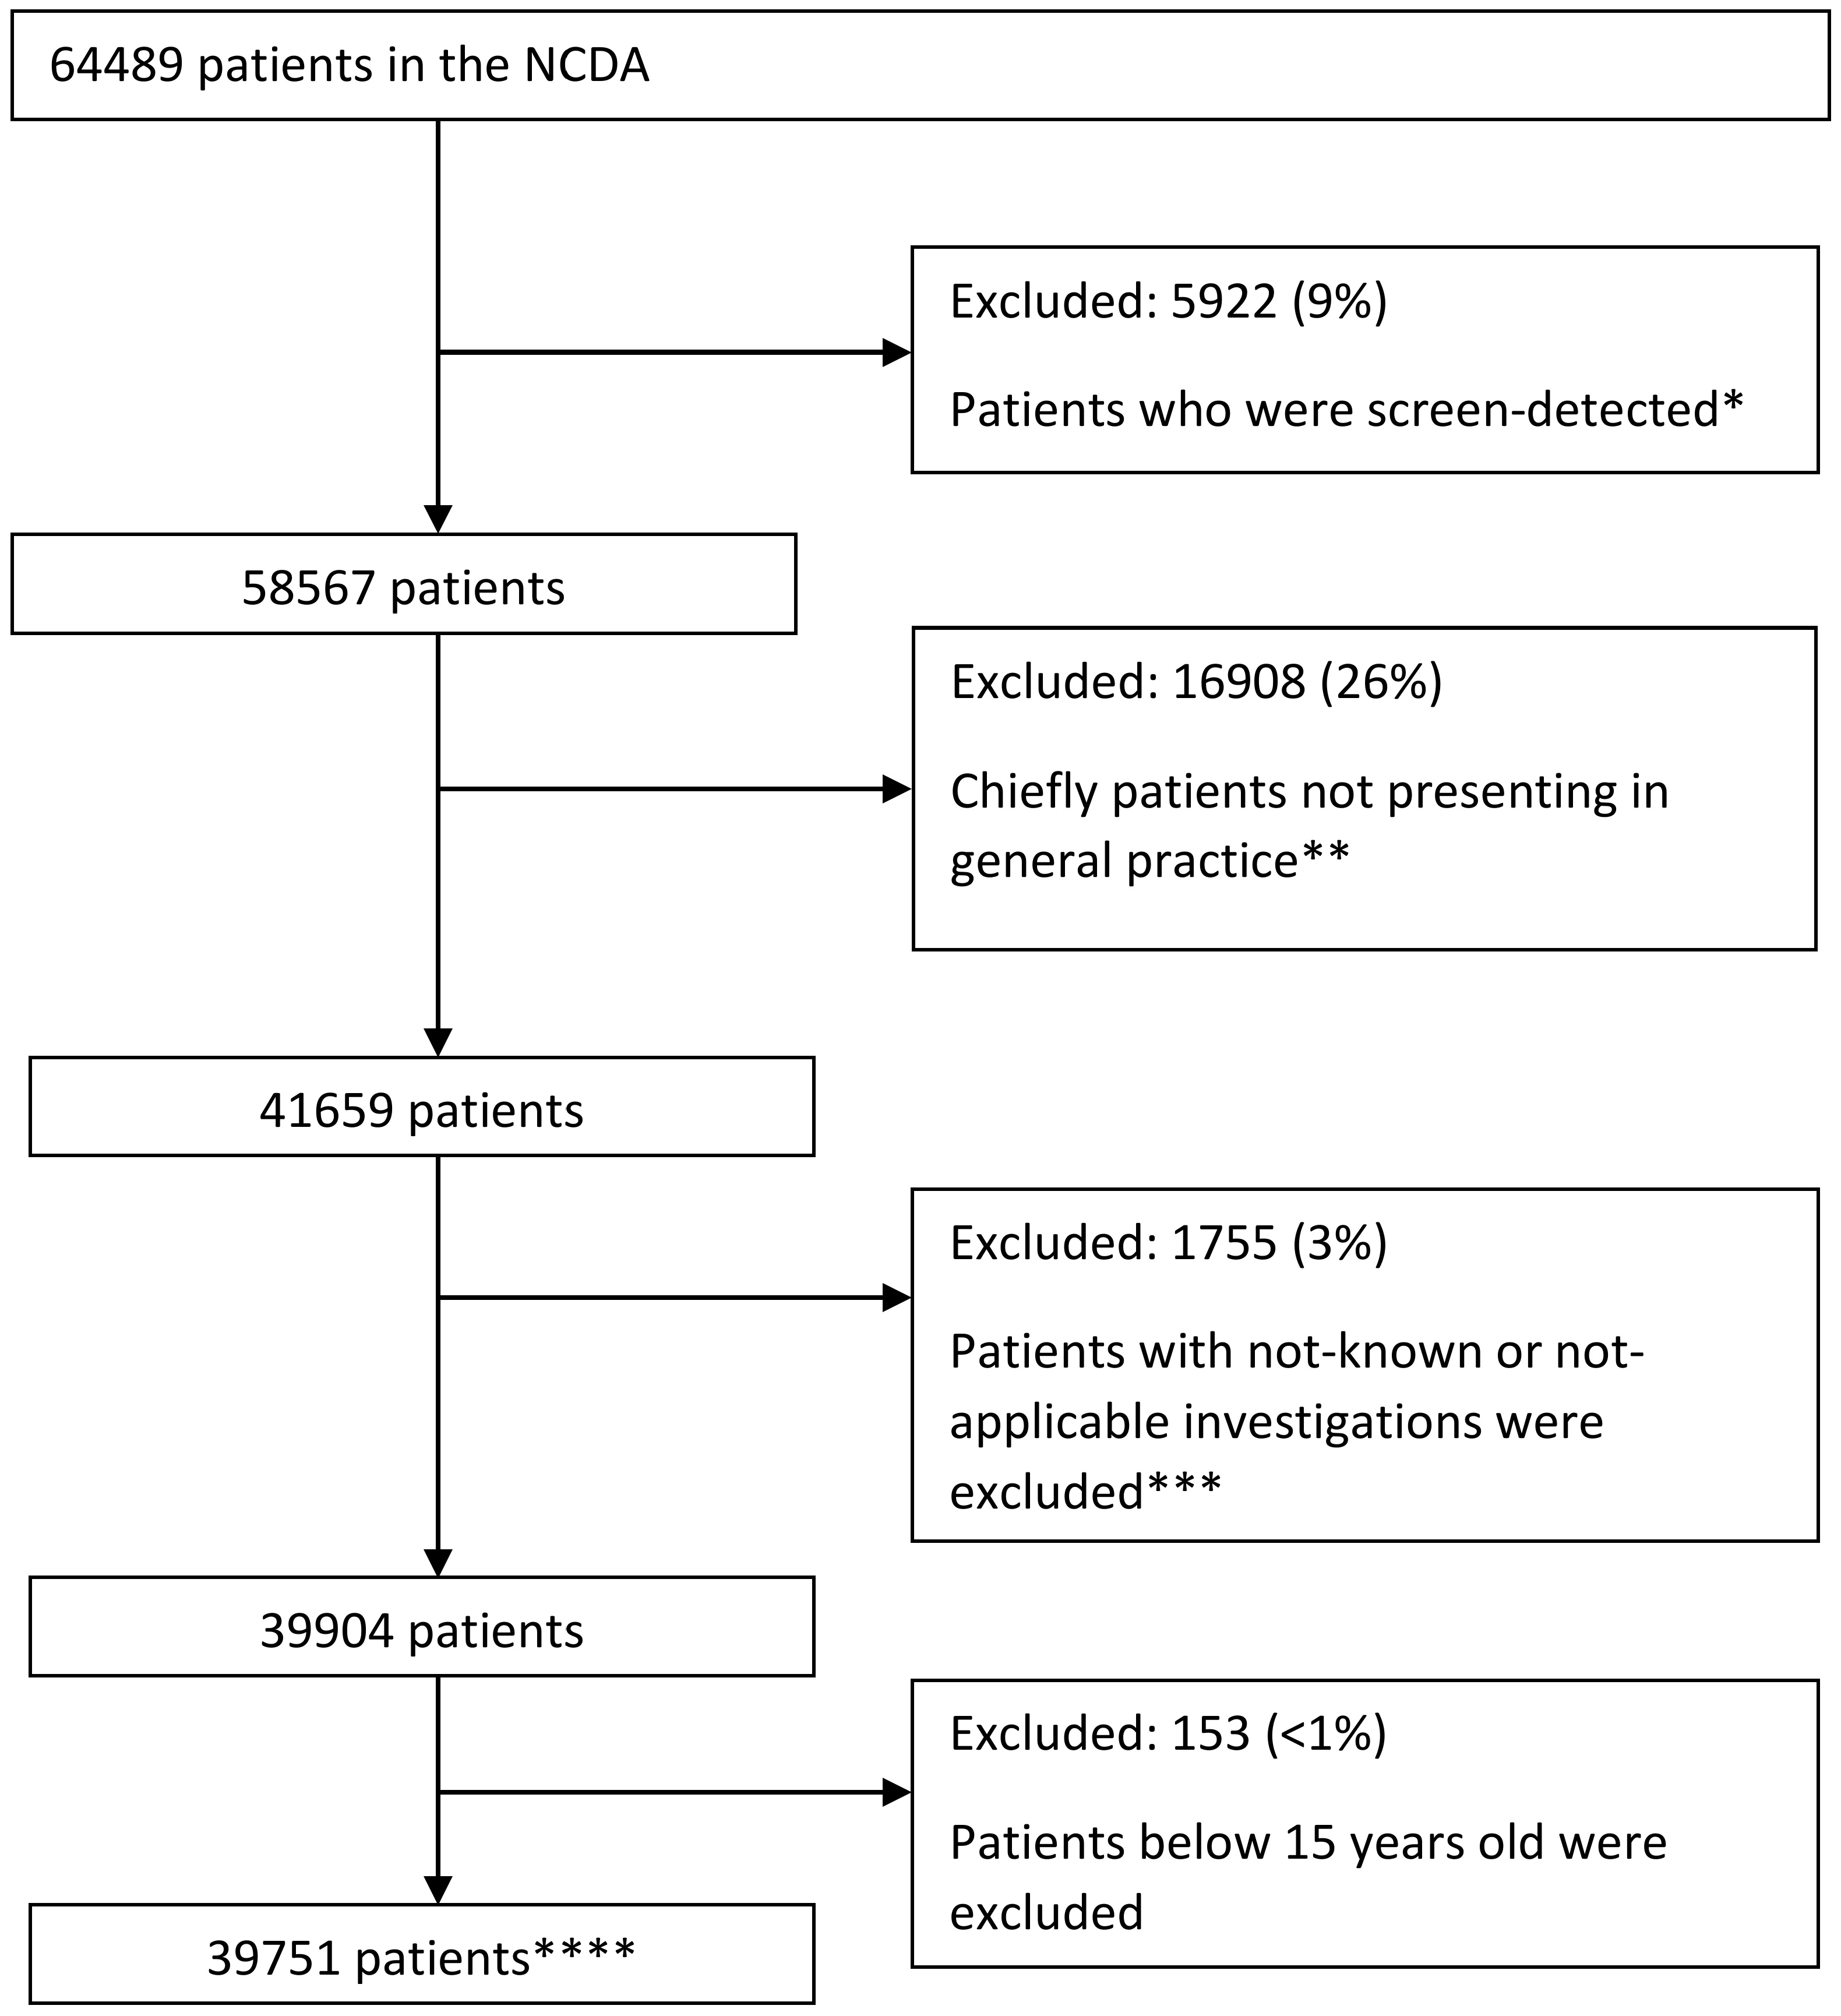
2.1. Study Design and Participants

Data were analysed from the (English) National Cancer Diagnosis Audit (NCDA) 2018. The nature of the data source, the characteristics of the study sample, and methodologies for sample definition and data collection have been described previously [16,17]. Data on the diagnostic process of 64,489 cancer cases diagnosed during 2018 were collected by participating GPs based on information in primary care records. Included patients were identified by the National Disease Registration Service responsible for cancer registration and were representative of the incident population of cancer patients in England. Participating general practices had comparable characteristics to nonparticipating practices though they were slightly larger [17].
The analysis sample included 39,751 non-screen-detected cancer patients aged 15 years or older, who first presented to general practice and for which there was complete information on investigation status (Derivation Sample: Figure 1).

2.2. Variables of Interest

The audit questionnaire collected information from patients’ medical records on whether blood tests were used in primary care pre-diagnosis using a relevant stem question (“Primary care led investigations that were ordered as part of the diagnostic assessment, and prior to referral, decided by the GP and in response to symptoms complained of, signs elicited, or abnormal test results”) with subsequent yes/no items for 4 generic blood tests (full blood count (FBC), urea and electrolytes (U&E), liver function tests (LFTs), and inflammatory markers (IM), and 5 organ-specific blood tests (cancer biomarkers, serum protein electrophoresis, ferritin, bone profile, and serum amylase).
Information on presenting symptoms during patients’ initial consultation was collected from responses to drop-down menu items pertaining to 83 pre-specified symptoms. Of these, 37 presenting symptoms were recorded in at least 1% of the study population and were treated as separate categories; 46 were recorded in <1% of the study population and were grouped into an “all other symptoms” category, which accounted for 17% of all cases.
In a supplementary analysis, symptoms were categorised into five groups by positive predictive value (PPV) for cancer, 0.01–0.99%, 1.00–1.99%, 2.00–2.99%, 3.00–4.99% and ≥5%, based on prior research [18] and clinical guidelines [3]. This analysis included a total of 42 symptoms (total n = 29,043, 73% of study population) for which there was previously published information to enable such classification—please see Supplementary File.

2.3. Analysis

We analysed the distribution of blood tests by presenting symptom categories. Analysis of cancer biomarkers was stratified by sex (i.e., assuming PSA testing in men and assumed CA125 testing in women).
In the supplementary analysis, we described proportions of test use and used logistic regression to estimate relevant crude and adjusted odds ratios (ORs) use (excluding blood biomarkers) for symptoms in different PPV range groups (0.01–0.99%, 1.00–1.99%, 2.00–2.99%, 3.00–4.99% and ≥5%), age group (15–29, 30–49, 50–69, ≥70 years), sex (male and female) and index of multiple deprivation quintile group (based on income domain). Another model was further adjusted for cancer sites to explore the influence of cancer-specific factors on blood test use by the symptom PPV group. Joint Wald tests were used to assess overall variation by the variable category.

3. Results

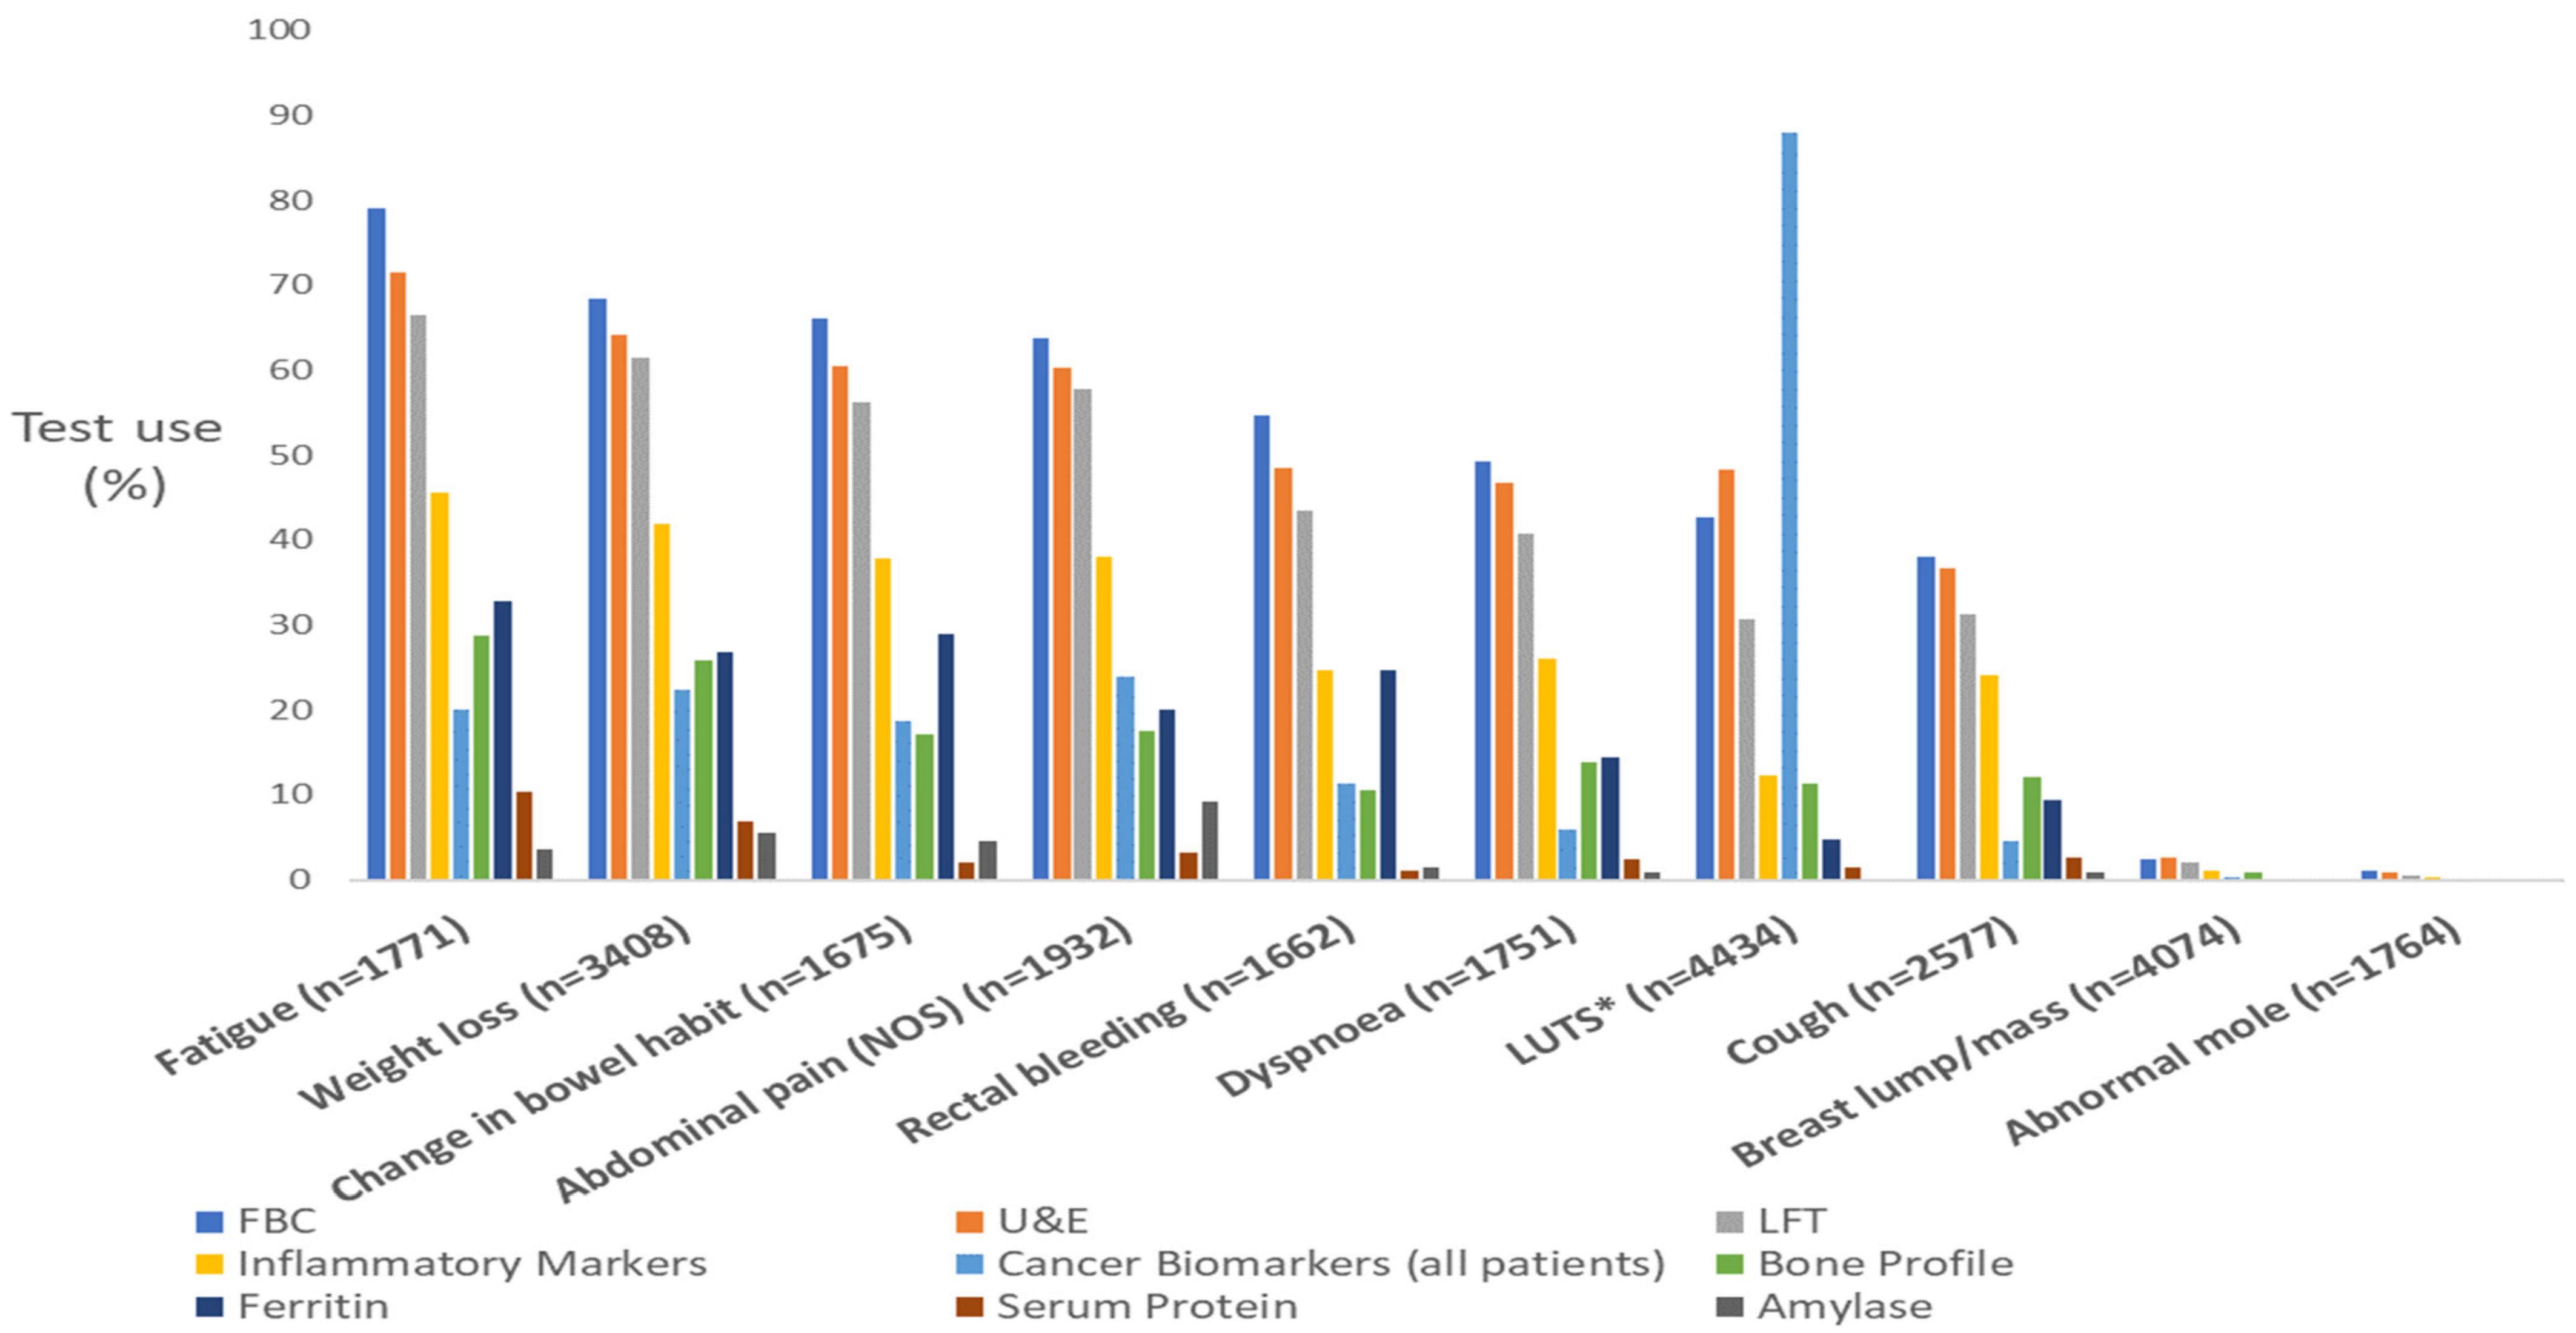
3.1. Generic Blood Tests

Our analysis included 39,751 incident cancer cases. Across all patients, overall use of FBC, U&Es, LFTs, and IM tests was 39%, 37%, 31%, and 19%, respectively. There was a large variation in the use of these blood tests by presenting symptoms following a pattern whereby symptoms of lower specificity (e.g., fatigue, loss of appetite, and weight loss) were associated with the greatest use (Table 1a and Figure 2). In contrast, organ-specific symptoms, including those related to the skin and breast, were associated with the lowest frequency of blood test use (≤3%, Table 1a, Figure 2).
About one in five patients presenting with symptoms had IM tests (Table 1a). The use of IM tests followed a pattern of relative variation that was similar to that observed for FBC, U&Es, and LFTs (i.e., reflecting symptom specificity) but at a lower absolute frequency.

3.2. Specific Blood Tests

Bone profile, ferritin, serum protein electrophoresis, and amylase tests were used less frequently than generic blood tests (Table 1b), the proportion of tested patients being 11% for bone profile and ferritin, 3% for serum protein electrophoresis, and 2% for amylase.
For all these four tests, use followed a similar pattern to that observed for common blood tests, where less specific symptoms (including fatigue, loss of appetite, and weight loss) were generally associated with higher use, and vice versa. However, the absolute percentage of tested patients for these 3 nonspecific symptoms was much greater for bone profile (29%, 29%, and 26%, respectively) and ferritin (33%, 30%, and 27%, respectively) than serum protein electrophoresis (10%, 7%, and 7%, respectively) and amylase (4%, 7%, and 5%, respectively).
Two tests, serum protein electrophoresis and bone profile, were used most commonly in patients with back pain (18% and 30%, respectively) or bone pain (16% and 32%), compared with percentages <10% in all patients presenting with all other symptoms. Amylase tests were more commonly used in patients presenting with upper abdominal pain (14%) compared with <9% of patients with all other symptoms.

3.3. Blood Biomarker Tests

Around one in three men who were subsequently diagnosed with cancer had a PSA test as part of their diagnostic process in primary care (see Table 2). PSA testing was chiefly concentrated in patients with urological symptoms, such as LUTS, dysuria, and UTI symptoms, and haematuria (35–88%). PSA use was also high among men presenting with back pain and bone pain (35% and 47%, respectively), and among men presenting asymptomatically, i.e., not-known—N/K symptoms (56%), or ‘not-applicable—N/A’ symptoms (63%).
Eight percent of women who were subsequently diagnosed with cancer had a CA125 test as part of their diagnostic process in primary care. CA125 testing was chiefly concentrated in patients with abdominal or urinary symptoms, including abdominal distension (53%), lower abdominal pain (32%), abdominal pain (30%) constipation (26%), LUTS (26%), and changes in bowel habit (22%). Several nonspecific symptoms, such as loss of appetite and weight loss, also had relatively high use (in around one in five women presenting with them).

3.4. Supplementary Analysis: Generic and Less Common Blood Test Use by Symptom PPV Group

A bimodal association was observed between increasing PPV range and test use, whereby use peaked in symptoms with PPV in the range of 2.00–2.99% and tailed off thereafter. Specifically, more than half (51–64%) of patients presenting with symptoms with PPVs ranging from 0.01–2.99% had a blood test, while the respective proportions were around two-fifths (42%) of those with PPVs between 3.00–4.99% and about one in three (31%) cases for symptoms with PPVs ≥5% (see Table 3). Multivariate analysis using the ≥5% PPV group as a reference provided concordant findings, with OR values of 2.40 (95% confidence interval [CI] = 2.21–2.60), 2.33 (CI = 2.19–2.48), and 3.89 (CI=3.61–4.18) for PPV range groups 0.01–0.99, 1.00–1.99, and 2.00–2.99%, respectively. In the 3.00–4.99% PPV range, the OR for use was 1.47 (1.34–1.62). Differences were attenuated and remained large and significant after adjustment for the cancer site to 1.57 (0.01–0.99 PPV; CI = 1.43–1.73), 1.96 (1.00–1.99 PPV; CI = 1.81–2.12), 2.79 (2.00–2.99 PPV; CI = 2.55–3.05), and 1.25 (3.00–4.99 PPV; CI = 1.11–1.40).

4. Discussion

Among patients subsequently diagnosed with cancer, blood test use as part of the diagnostic process in primary care is largely determined by the nature of presenting symptoms. The perceived organ specificity (or lack of organ specificity) of presenting symptoms regarding a possible cancer site seems to be the key driver of variation in the use of both generic and non-generic blood tests. Additionally, the affinity of non-generic tests to the presenting features of certain cancer sites has influenced their use.
Our analysis benefits from data obtained from a large and nationally representative sample of cancer patients [19]. Yet the precise timeframe between relevant symptom presentation and blood test use is not captured in the NCDA, although auditors were specifically requested to enter information on blood tests ordered before a referral decision. The availability of free-text information in the reviewed patient records may have improved the quality of symptom data capture compared with other sources of routine electronic health records data that predominantly rely on structured (coded) information, therefore improving the accuracy of their relationship with blood test use. The limitation of this study is that it is a case-only analysis; therefore, we are not able to decipher the frequency of use of the examined blood tests among patients who presented with the same symptoms but did not have underlying cancer. The findings add to earlier work that also described variation in blood test use by demographic characteristics, cancer site and presenting symptom category [16], by detailing observed variation by presenting symptom.
Generally, blood testing was greatest after nonspecific presentations and lowest for organ-specific (‘alarm’) symptoms. For example, back pain (FBC use 60%) has a positive predictive value (PPV) of 0.1% for myeloma, for which reason additional information from blood test results is helpful, e.g., combined back pain and hypercalcaemia has a PPV of 4.0% (above the normative 3% NICE referral threshold) [3,20]. In contrast, a breast lump (FBC use 3%) in 40+-year-olds has a PPV of 4.8% [21].
The use of nongeneric tests was greatest for symptoms that represent expected features of specific cancers. PSA was used in far greater proportions (88%) in men presenting with the LUTS, which mirrors guideline recommendations [3]. However, two-thirds of men presenting with haematuria did not have PSA testing, which may represent opportunities for greater use consistent with guidelines that recommend GPs to consider PSA testing (alongside a digital rectal examination) to assess for prostate cancer in people with visible haematuria [22,23]. Relatively large proportions of patients subsequently diagnosed with cancer who presented with back pain were tested by serum protein electrophoresis or bone profile, possibly reflecting suspicion of multiple myeloma, given its cardinal presenting symptom is musculoskeletal pain.
Exploring blood test use by symptom PPV group highlights a positive association between blood test use and symptom PPV for ranges between 0.01 and 2.99%, where testing occurs in over half (51–52%) of patients presenting with symptom PPVs ranging 0.01–1.99% and increases to nearly two-thirds (64%) when symptom PPVs approach clinical thresholds for referral (i.e., 2.00–2.99%). In patients presenting with symptom PPVs ≥ 3%, test use declines as symptom PPVs increase (3.00–4.99% PPV = 42%, ≥5% PPV = 31%). Clinicians seem to prefer using tests in lower symptom PPV ranges, particularly just below the 3% threshold (i.e., 2.00–2.99%) where the relative information gain to assess the risk of cancer seems to be deemed greatest (i.e., symptoms do not meet referral criteria with regard to their PPV but are close to referral threshold). It may seem that blood tests are deemed less informative for patients already considered at higher risk if presenting with alarm symptoms. Therefore, the findings highlight opportunities for greater use in patients with non-alarm (nonspecific and vague) symptoms, belonging to the <3% PPV groups.
The potential for GP referral decisions to be guided by the combined diagnostic utility of blood test results and symptom information requires current phlebotomy services to be optimised (such as through increasing capacity for on-site phlebotomy within general practices). Practical modifications to the testing process can help simplify access to primary care investigations such as blood tests [24,25]. Future research can assess the cost-effectiveness of greater than the current use of blood tests in patients in different risk categories.

5. Conclusions

Overall, the findings help to benchmark GPs’ use of blood tests in cancer patients. In the future, the proportions of patients with certain cancer sites who were tested with generic or organ-specific blood tests could help provide pilot targets for markers of diagnostic process quality. Generic blood tests may be underused in some populations (i.e., those presenting with symptoms with positive predictive value for cancer below the current (3%) referral thresholds). Given the growing evidence base supporting the use of blood tests to help assess cancer risk in symptomatic patients, research efforts to monitor blood test use over time and potential between-GP variation will be important for identifying opportunities to improve the diagnostic process.

Supplementary Materials

The following supporting information can be downloaded at: https://www.mdpi.com/article/10.3390/cancers15143587/s1. Table S1: Assignment of symptoms for supplementary analysis.

Author Contributions

B.M.C.: conceptualization, methodology, formal analysis, writing—original draft. G.A.A.: methodology, writing—review and editing. R.S.: writing—review and editing. S.F.M.: Resources and validation. S.M.: writing—review and editing. G.P.R.: writing—review and editing. G.L.: methodology, conceptualization, writing—review and editing, supervision. All authors have read and agreed to the published version of the manuscript.

Funding

This research relates to Cancer Research UK project C18081/A29738 and the CanTest Collaborative, which is funded by Cancer Research UK [C8640/A23385], of which Greg P Rubin is the chair; Georgios Lyratzopoulos is the associate director; Gary A Abel is a senior faculty member; and Ben M Cranfield is a faculty member (PhD Student). Georgios Lyratzopoulos is supported by Cancer Research UK Clinician Advanced Scientist Fellowship [grant number: C18081/A18180]. Gary A Abel is supported by the National Institute for Health Research Applied Research Collaboration South West Peninsula. The views expressed are those of the authors and are not necessarily those of Cancer Research UK.

Institutional Review Board Statement

Ethical approval was obtained by the East of England-Cambridge Central Research Ethics Committee (REC reference: 20/EE/0103 1 April 2020).

Informed Consent Statement

No informed consent was applicable given the anonymous nature of the data.

Data Availability Statement

Data are available through the Data Access Request Service of NHS England.

Acknowledgments

The authors would like to thank all GPs and health professionals who participated in the NCDA and contributing Cancer Research UK staff; the National Cancer Registration and Analysis Service, NHS England, the Royal College of General Practitioners, Macmillan Cancer Support, and Health Data Insight. This work uses data that have been provided by patients and collected by the NHS as part of their care and support. The data are collated, maintained, and quality assured by the National Cancer Registration and Analysis Service, which is part of NHS Digital (although Public Health England at the time of data collection). The NCDA received enabling support from Cancer Research UK, NHS England and the National Cancer Registration and Analysis Service. We also acknowledge Monica M Koo for her support.

Conflicts of Interest

The authors declare no conflict of interest.

References

  1. Emery, J.D.; Shaw, K.; Williams, B.; Mazza, D.; Fallon-Ferguson, J.; Varlow, M.; Trevena, L.J. The role of primary care in early detection and follow-up of cancer. Nat. Rev. Clin. Oncol. 2014, 11, 38–48. [Google Scholar] [CrossRef] [PubMed]
  2. Rubin, G.; Berendsen, A.; Crawford, S.M.; Dommett, R.; Earle, C.; Emery, J.; Fahey, T.; Grassi, L.; Grunfeld, E.; Gupta, S.; et al. The expanding role of primary care in cancer control. Lancet Oncol. 2015, 16, 1231–1272. [Google Scholar] [CrossRef] [PubMed] [Green Version]
  3. NICE Guidelines. Suspected Cancer: Recognition and Referral. Guidance and Guidelines; NICE Guidance: Nice, France, 2015; Available online: https://www.nice.org.uk/guidance/ng12/chapter/1-Recommendations-organised-by-site-of-cancer#upper-gastrointestinal-tract-cancers (accessed on 18 February 2022).
  4. Jensen, H.; Tørring, M.L.; Olesen, F.; Overgaard, J.; Vedsted, P. Cancer suspicion in general practice, urgent referral and time to diagnosis: A population-based GP survey and registry study. BMC Cancer 2014, 14, 636. [Google Scholar] [CrossRef] [Green Version]
  5. Lyratzopoulos, G.; Wardle, J.; Rubin, G. Rethinking diagnostic delay in cancer: How difficult is the diagnosis? BMJ 2014, 349, g7400. [Google Scholar] [CrossRef] [Green Version]
  6. Pearson, C.; Poirier, V.; Fitzgerald, K.; Rubin, G.; Hamilton, W. Cross-sectional study using primary care and cancer registration data to investigate patients with cancer presenting with non-specific symptoms. BMJ Open 2020, 10, e033008. [Google Scholar] [CrossRef] [Green Version]
  7. Zhou, Y.; Mendonca, S.C.; Abel, G.A.; Hamilton, W.; Walter, F.M.; Johnson, S.; Shelton, J.; Elliss-Brookes, L.; McPhail, S.; Lyratzopoulos, G. Variation in ‘fast-track’ referrals for suspected cancer by patient characteristic and cancer diagnosis: Evidence from 670 000 patients with cancers of 35 different sites. Br. J. Cancer 2018, 118, 24–31. [Google Scholar] [CrossRef] [Green Version]
  8. Bailey, S.E.; Ukoumunne, O.C.; Shephard, E.A.; Hamilton, W. Clinical relevance of thrombocytosis in primary care: A prospective cohort study of cancer incidence using English electronic medical records and cancer registry data. Br. J. Gen. Pract. J. R. Coll. Gen. Pract. 2017, 67, e405–e413. [Google Scholar] [CrossRef] [Green Version]
  9. Hopkins, R.; Bailey, S.E.; Hamilton, W.T.; Shephard, E.A. Microcytosis as a risk marker of cancer in primary care: A cohort study using electronic patient records. Br. J. Gen. Pract. 2020, 70, e457–e462. [Google Scholar] [CrossRef]
  10. Koshiaris, C.; Van den Bruel, A.; Oke, J.L.; Nicholson, B.D.; Shephard, E.; Braddick, M.; Hamilton, W. Early detection of multiple myeloma in primary care using blood tests: A case-control study in primary care. Br. J. Gen. Pract. J. R. Coll. Gen. Pract. 2018, 68, e586–e593. [Google Scholar] [CrossRef] [PubMed] [Green Version]
  11. Mounce, L.T.; Hamilton, W.; Bailey, S.E. Cancer incidence following a high-normal platelet count: Cohort study using electronic healthcare records from English primary care. Br. J. Gen. Pract. 2020, 70, e622–e628. [Google Scholar] [CrossRef] [PubMed]
  12. Næser, E.; Møller, H.; Fredberg, U.; Frystyk, J.; Vedsted, P. Routine blood tests and probability of cancer in patients referred with non-specific serious symptoms: A cohort study. BMC Cancer 2017, 17, 817. [Google Scholar] [CrossRef] [PubMed] [Green Version]
  13. Rasmussen, L.J.H.; Schultz, M.; Gaardsting, A.; Ladelund, S.; Garred, P.; Iversen, K.; Eugen-Olsen, J.; Helms, M.; David, K.P.; Kjaer, A.; et al. Inflammatory biomarkers and cancer: CRP and suPAR as markers of incident cancer in patients with serious nonspecific symptoms and signs of cancer. Int. J. Cancer 2017, 141, 191–199. [Google Scholar] [CrossRef] [Green Version]
  14. Watson, J.; Mounce, L.; Bailey, S.E.R.; Cooper, S.L.; Hamilton, W. Blood markers for cancer. BMJ 2019, 367, l5774. [Google Scholar] [CrossRef] [Green Version]
  15. Watson, J.; Salisbury, C.; Banks, J.; Whiting, P.; Hamilton, W. Predictive value of inflammatory markers for cancer diagnosis in primary care: A prospective cohort study using electronic health records. Br. J. Cancer 2019, 120, 1045–1051. [Google Scholar] [CrossRef] [Green Version]
  16. Cranfield, B.M.; Koo, M.M.; Abel, G.A.; Swann, R.; McPhail, S.; Rubin, G.P.; Lyratzopoulos, G. Primary care blood tests before cancer diagnosis: National Cancer Diagnosis Audit data. Br. J. Gen. Pract. 2022, 73, e95–e103. [Google Scholar] [CrossRef]
  17. Swann, R.; McPhail, S.; Shand, B.; Rashbass, J.; Witt, J.; Abel, G.A.; Hiom, S.; Lyratzopoulos, G.; Rubin, G. Diagnosing cancer in primary care: Results from the National Cancer Diagnosis Audit. Br. J. Gen. Pract. 2018, 68, e63–e72. [Google Scholar] [CrossRef]
  18. Moore, S.F.; Price, S.J.; Chowienczyk, S.; Bostock, J.; Hamilton, W. The impact of changing risk thresholds on the number of people in England eligible for urgent investigation for possible cancer: An observational cross-sectional study. Br. J. Cancer 2021, 125, 1593–1597. [Google Scholar] [CrossRef]
  19. Swann, R.; McPhail, S.; Abel, G.A.; Witt, J.; Wills, L.; Hiom, S.; Lyratzopoulos, G.; Rubin, G. National Cancer Diagnosis Audits for England 2018 versus 2014: A comparative analysis. Br. J. Gen. Pract. 2023, 1–9. [Google Scholar] [CrossRef]
  20. Shephard, E.A.; Neal, R.D.; Rose, P.; Walter, F.M.; Litt, E.J.; Hamilton, W.T. Quantifying the risk of multiple myeloma from symptoms reported in primary care patients: A large case-control study using electronic records. Br. J. Gen. Pract. 2015, 65, e106–e113. [Google Scholar] [CrossRef] [PubMed] [Green Version]
  21. Walker, S.; Hyde, C.; Hamilton, W. Risk of breast cancer in symptomatic women in primary care: A case–control study using electronic records. Br. J. Gen. Pract. 2014, 64, e788. [Google Scholar] [CrossRef] [PubMed] [Green Version]
  22. Hamilton, W.; Hajioff, S.; Graham, J.; Schmidt-Hansen, M. Suspected cancer (part 2—Adults): Reference tables from updated NICE guidance. BMJ 2015, 350, h3044. [Google Scholar] [CrossRef] [PubMed]
  23. Wiering, B.; Lyratzopoulos, G.; Hamilton, W.; Campbell, J.; Abel, G. Concordance with urgent referral guidelines in patients presenting with any of six “alarm” features of possible cancer: A retrospective cohort study using linked primary care records. BMJ Qual. Saf. 2022, 31, 579–589. [Google Scholar] [CrossRef] [PubMed]
  24. Harris, M.; Thulesius, H.; Neves, A.L.; Harker, S.; Koskela, T.; Petek, D.; Hoffman, R.; Brekke, M.; Buczkowski, K.; Buono, N.; et al. How European primary care practitioners think the timeliness of cancer diagnosis can be improved: A thematic analysis. BMJ Open 2019, 9, e030169. [Google Scholar] [CrossRef] [PubMed] [Green Version]
  25. Rubin, G.; Vedsted, P.; Emery, J. Improving cancer outcomes: Better access to diagnostics in primary care could be critical. Br. J. Gen. Pract. J. R. Coll. Gen. Pract. 2011, 61, 317–318. [Google Scholar] [CrossRef]
Figure 1. Derivation of the analysis sample (n = 39,751). * Screening detection status was assigned using a binary variable that categorised screen detection as “yes” or “no or unknown”. ** Includes a small number of cases with a recorded symptom that did not match the patient’s gender. *** Given the emphasis on describing associations between presenting symptoms and blood test use, patients with not known (N/K) or not applicable (N/A) investigations were excluded from subsequent analysis. **** Includes 571 patients with more than one tumour.
Cancers 15 03587 g001
Figure 2. Proportion of patients having each of the 9 blood tests studied after presenting with the 10 most frequently reported symptoms. * Lower urinary tract symptoms; cancer biomarker use by LUTs is restricted to men (88%). Symptoms presented in descending order by FBC use.
Cancers 15 03587 g002
Table 1. (a): Frequency of FBC, U&E, LFT, and IM blood tests based on presenting symptoms (proportions ranked by FBC order). (b): Frequency of bone profile, ferritin, serum protein, and amylase blood tests based on presenting symptoms (proportions ranked by FBC order).
(a)
Generic Blood Tests
Symptom NameFBC%U&E%LFT%IM%
Fatigue (n = 1771) b13987912677211776680846
Loss of appetite (n = 1264) a93974887708426758346
Weight loss (n = 3408) c233168218364209061142842
Upper abdominal pain (n = 1192) b80568741627366249241
Diarrhoea (n = 1013) b67366621615745740440
Change in bowel habit (n = 1675) d1107661013609415663338
Nausea and/or vomiting (n = 1067) b69365666626486143341
Abdominal pain (NOS) (n = 1932) c12336411636011145873638
Lower abdominal pain (n = 1060)68364631605845540738
Constipation (n = 831) b52763484584485429736
Distension (n = 980) c60962593615395535236
Back pain (n = 1405) a83760797577195157841
Dyspepsia (n = 805) b46858436544145124731
Rectal bleeding (n = 1662) e90755805487234441125
Bone pain (n = 490) a26253249512224518538
Other symptom (n = 2131)1093511021489264358928
Dyspnoea (n = 1751) b86349818477144145726
Dysuria (n = 551) b25546263481993611020
Urinary tract infection (n = 477) a2094421745148319319
LUTS (nocturia, frequency, hesitancy, urgency, retention) (n = 4434) e18934321394813603154512
Haematuria (n = 1465) d59941588403672518613
Neck lump/mass (n = 1201)49841422353673132527
Not applicable (n = 2795)112940912337342632612
Chest pain (n = 960) b38740365383303423625
Not known (n = 687)2703921932200297611
Dysphagia (n = 997) e38339366373413519019
Cough (n = 2577) b98238944378073162024
All other symptoms (n = 6828)231037211534190030131621
Chest infection (n = 686) a25137239352123115923
Other vaginal bleeding (n = 421)1313191227418379
Haemoptysis (n = 469) e1433013128111248017
Sore throat (n = 478)132281132496208818
Hoarseness (n = 468) c109231022297216213
Post-menopausal bleeding (n = 896) e166191451612414617
Breast pain (n = 768) b21324320391
Breast lump/mass (n = 4074) e10231093802441
Abnormal mole (n = 1764)1811718050
All patients (n = 39,751)15,5403914,5553712,41431759819
(b)
Less Common Blood Tests
Symptom NameBone Profile%Ferritin%Serum Protein Electrophoresis *%Amylase%
Fatigue (n = 1771) b509295813318510624
Loss of appetite (n = 1264) a3672937930927887
Weight loss (n = 3408) c878269132723671875
Upper abdominal pain (n = 1192) b210182522144417214
Diarrhoea (n = 1013) b1621627928212646
Change in bowel habit (n = 1675) d2871748329352754
Nausea and/or vomiting (n = 1067) b2292123822373979
Abdominal pain (NOS) (n = 1932) c33918387206131799
Lower abdominal pain (n = 1060)1951823322232394
Constipation (n = 831) b1852220425344395
Distension (n = 980) c1691717918172556
Back pain (n = 1405) a425302071525118373
Dyspepsia (n = 805) b1201517522223597
Rectal bleeding (n = 1662) e1751141125181241
Bone pain (n = 490) a1553260127916102
Other symptom (n = 2131)36817368171366563
Dyspnoea (n = 1751) b2431425415443141
Dysuria (n = 551) b6011336112112
Urinary tract infection (n = 477) a42933711251
LUTS ** (nocturia, frequency, hesitancy, urgency, retention) (n = 4434) e49811213569218<1%
Haematuria (n = 1465) d118879511191
Neck lump/mass (n = 1201)125107863025<1%
Not applicable (n = 2795)2599334121515201
Chest pain (n = 960) b138149610495192
Not known (n = 687)49769102942<1%
Dysphagia (n = 997) e98101361451222
Cough (n = 2577) b312122409683251
All other symptoms *** (n = 6828)72211551923341532
Chest infection (n = 686) a741148715281
Other vaginal bleeding (n = 421)2054611511<1%
Haemoptysis (n = 469) e3882963131
Sore throat (n = 478)2762866131
Hoarseness (n = 468) c266306512<1%
Post-menopausal bleeding (n = 896) e3444452<1%1<1%
Breast pain (n = 768) b41713<1%00
Breast lump/mass (n = 4074) e35117<1%6<1%2<1%
Abnormal mole (n = 1764)4<1%4<1%0000
All patients (n = 39,752)436711429911124037612
The blue–white–red boundaries are set at the upper, median, and lower values for each blood test. All other values are coloured proportionally. * Serum protein electrophoresis is coded as “Serum protein/paraprotein” in the NCDA. ** LUTS = lower urinary tract symptoms. *** Forty-six symptoms accounting for less than 1% (n = 398) of cases were grouped together, including nipple changes d, pelvic pain, lymphadenopathy (localised) a, jaundice e, night sweats, gastroesophageal reflux a, testicular lump, headache a, erectile dysfunction, prog/sub-acute loss of central neuro function, pruritis, lip/oral cavity/tongue lump/mass, testicular pain, loin pain, fever a, non-pigmented lesion e, axillary lump/mass, unexplained lump suspicious of sarcoma, lesions suspicious of BCC, nipple discharge e, thyroid lump/mass, lip/oral cavity/tongue ulcer, ulceration, early satiety, bruising, bleeding or petechiae, pallor, vaginal discharge b, anal mass, deep vein thrombosis a, visual disturbance or loss a, vulval mass, epistaxis, vulval ulceration, penile ulceration, vaginal mass, lymphadenopathy (generalised) a, fit/seizure b, new onset diabetes, stridor, leukoplakia a, fracture a, lymph node pain with alcohol, renal colic, clubbing, haematemesis c and vulval bleeding. a: denotes a PPV for cancer of 0.01–0.99%; b: denotes a PPV for cancer of 1.00–1.99%; c: denotes a PPV for cancer of 2.00–2.99%, d: denotes a PPV for cancer of 3.00–4.99%, e: denotes a PPV for cancer ≥5%, based on prior research [18] and clinicalguidelines [3] (for Supplementary Table S1).
Table 2. Frequency of cancer biomarker use based on symptom presentation (proportions ranked by cancer biomarker order).
Symptom NameCancer Biomarkers
MenWomen
Number of Men with Symptom Biomarker Use%Number of Women with SymptomBiomarker Use%
Fatigue (n = 1771) b9392492783210513
Loss of appetite (n = 1264) a6731552359113623
Weight loss (n = 3408) c204250024136625919
Upper abdominal pain (n = 1192) b619801357310518
Diarrhoea (n = 1013) b56392164507416
Nausea and/or vomiting (n = 1067) b461441060611018
Change in bowel habit (n = 1675) d9391491673616322
Abdominal pain (NOS) (n = 1932) c9361591799630230
Lower abdominal pain (n = 1060) 4381323062219932
Constipation (n = 831) b4431012338810226
Distension (n = 980) c351531562933253
Back pain (n = 1405) a851404475546412
Dyspepsia (n = 805) b4754393304514
Bone pain (n = 490) a30510835185137
Rectal bleeding (n = 1662) e954118127086910
Other symptom (n = 2131)123235329899819
LUTS * (nocturia, frequency, hesitancy, urgency, retention) (n = 4434) e42423716881925026
Dyspnoea (n = 1751) b973738778304
Dysuria (n = 551) b408261641431913
Urinary tract infection (n = 477) a293186631842614
N/A (n = 2795)2197123156598336
Haematuria (n = 1465) d11564103530983
N/K (n = 687)5323366315575
Neck lump/mass (n = 1201) 68025452182
Chest pain (n = 960) b536479424194
Cough (n = 2577) b14418661136293
Dysphagia (n = 997) e670294307165
All other symptoms (n = 6828) **33327152129492398
Chest infection (n = 686) a37423631293
Other vaginal bleeding (n = 421) 0** ≤3≤04215613
Haemoptysis (n = 469) e30272167≤31
Sore throat (n = 478) 328≤3≤115043
Hoarseness (n = 468) c35193117≤32
Post-menopausal bleeding (n = 896) e0≤3≤0896768
Breast pain (n = 768) b11≤3≤27757≤3<1
Breast lump/mass (n = 4074) e52≤3≤6402212<1
Abnormal mole (n = 1764) 811≤3≤195300
All patients (n = 39,752)21,85478283617,89814618
The blue–white–red boundaries are set at the upper, median, and lower values for each blood test. All other values are coloured proportionally. * LUTS = lower urinary tract symptoms. ** Biomarker use between 0–3 is represented as “≤3” to reduce the risk of residual disclosure, with corresponding proportions being calculated based on the use of 3 (or fewer) biomarker tests. a: denotes a PPV for cancer of 0.01–0.99%; b: denotes a PPV for cancer of 1.00–1.99%; c: denotes a PPV for cancer of 2.00–2.99%, d: denotes a PPV for cancer of 3.00–4.99%, e: denotes a PPV for cancer ≥5%, based on prior research [18] and clinical guidelines [3] (for Supplementary Table S1).
Table 3. Proportions and crude/adjusted ORs examining variation in blood test use by symptom PPV group.
Population Total, n (Column %)Received a Blood Test *, n (Row %)Crude OR (95% CI) and p-ValueAdjusted OR *** (Excluding Cancer Site) and p-ValueAdjusted OR (Including Cancer Site) and p-Value
Total:29,043 (100%) **12,998 (45%)
Symptom PPV * **** <0.001**** <0.001**** <0.001
0.01–0.99%3162 (11%)1656 (52%)2.41 (2.22–2.61)2.40 (2.21–2.60)1.57 (1.43–1.73)
1.00–1.99%7454 (26%)3779 (51%)2.25 (2.12–2.39)2.33 (2.19–2.48)1.96 (1.81–2.12)
2.00–2.99%4846 (17%)3113 (64%)3.94 (3.67–4.23)3.89 (3.61–4.18)2.79 (2.55–3.05)
3.00–4.99%2101 (7%)887 (42%)1.60 (1.45–1.76)1.47 (1.34–1.62)1.25 (1.11–1.40)
≥5.00% 11,480 (40%)3593 (31%)refrefref
* Blood test variables included FBC, U&E, LFT, IM, bone profile, serum protein electrophoresis, ferritin, or amylase tests. ** A total of 10,709 cases with symptoms not captured in the PPV groups (i.e., because no published evidence supported symptom allocation) were excluded from the Supplementary Table S1. *** Adjustments are made for age, sex, IMD, symptom PPV, and cancer site (when specified). **** Post estimations using Wald tests explained the significance of the symptom PPV group in predicting blood test use. See Table 1b for symptom allocation to PPV categories. CI = confidence interval. IMD=Index of Multiple Deprivation. OR = odds ratio. Ref = reference group.
Disclaimer/Publisher’s Note: The statements, opinions and data contained in all publications are solely those of the individual author(s) and contributor(s) and not of MDPI and/or the editor(s). MDPI and/or the editor(s) disclaim responsibility for any injury to people or property resulting from any ideas, methods, instructions or products referred to in the content.

