Darllenwch y dudalen hon yn Gymraeg
Last week, Wales, along with other UK nations, announced that if you have a positive lateral flow test result, you no longer need to take a follow-up PCR test. This type of policy change can have a knock-on impact on COVID-19 data. This blog aims to explain these changes and gives advice on interpreting data over the coming days and weeks.
How are COVID-19 cases calculated in Wales?
There are two main ways you can be tested for COVID-19 – if you don’t have symptoms, you can use the quick lateral flow tests that many of us have now got used to doing at home and, if you have symptoms, by arranging to take a PCR test at a testing centre, and the samples are sent away to a lab to be analysed.
Every day Public Health Wales publishes the new number of COVID-19 cases that have been identified through testing. These figures are based on results from PCR tests only. This data helps us understand current infection levels in Wales and monitor how this is changing over time.
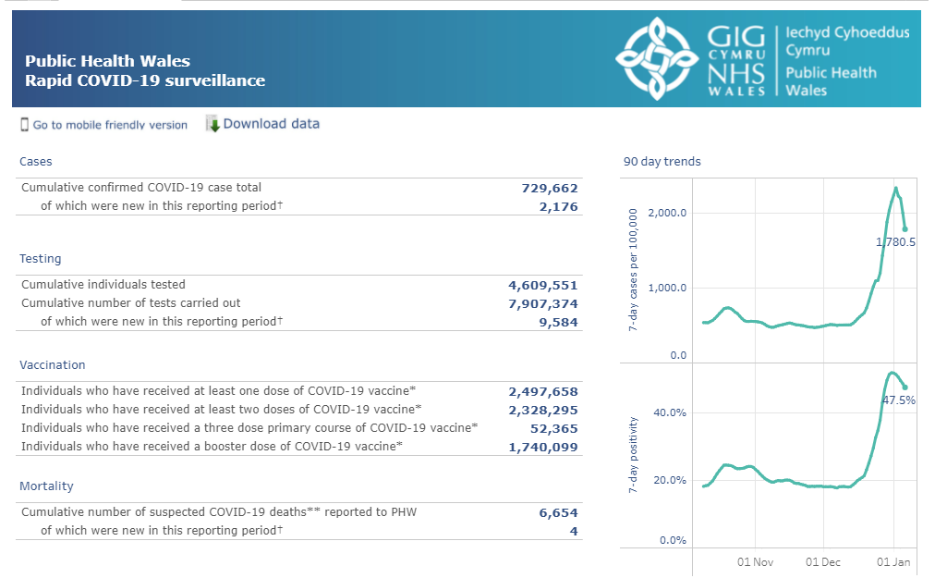
Alongside the daily results from PCR tests, Public Health Wales also publishes a weekly report about lateral flow testing. Not all lateral flow test results are registered on the gov.uk website but for those that are, information is provided about the number of tests recorded and how many were positive, as well as breakdowns by age, sex and local authority.
Positive lateral flow tests are not included in the headline COVID-19 case figures for Wales. They are only included in the case figures when there has been a follow-up positive PCR test.
The impact of policy changes on data
The recently announced policy changes mean that in some circumstances, people will now no longer have a PCR test. Public Health Wales estimates this is likely to reduce the overall number of reported cases by about 10%. This is based on an analysis of recent trends linking lateral flow tests to positive PCR tests.
The policy change was introduced on 6 January so this will start to affect data gathered from around that point. It’s unlikely that there will be a clean break in the data, so there will be a period of time where extra caution needs to be taken when looking at trends.
For example, in the short term, cases could appear to fall but that might not necessarily be the case. Over time, Public Health Wales expects the stability of the case figures to improve.
So how can we tell what’s happening with COVID-19 in Wales during this time?
As daily data can be volatile (even without testing regime changes) it’s important to:
- look at trends rather than a single day’s figures
- use other data sources to see if they are showing a consistent pattern
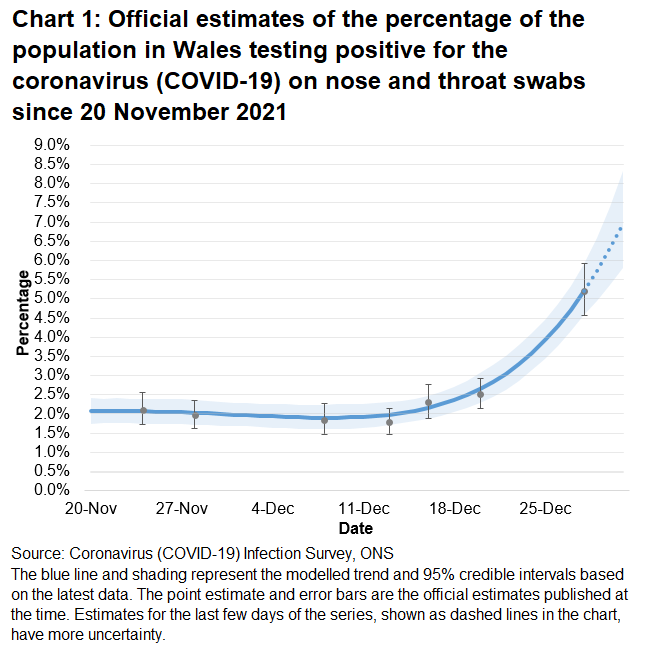
There are a number of other data sources, which can tell us how the pandemic is evolving in Wales. Data from the Office for National Statistics COVID-19 infection survey is published twice a week and estimates the percentage of population in Wales that would test positive. This survey is based on a random sample of the population and isn’t affected by changes in testing so it’s very helpful to compare with the Public Health Wales data. In the past, ONS and Public Health Wales data have tended to follow similar patterns.
Other indicators of more serious illness, like COVID-19 hospitalisation or mortality data, are more lagged but they also help shed light on any changes in trends.
There are also new innovative methods like monitoring levels of COVID-19 in wastewater, which provides us with another way of understanding changes. A summary of the latest wastewater analysis is published in the weekly COVID-19 situational report.
It’s always good practice to look at a wide range of data to see if it gives a consistent message, but this will be even more important while the recent testing changes bed in.
Stephanie Howarth
Chief Statistician
