


Abstract
The cnidarian model organism Hydra has long been studied for its remarkable ability to regenerate its head, which is controlled by a head organizer located near the hypostome. The canonical Wnt pathway plays a central role in head organizer function during regeneration and during bud formation, which is the asexual mode of reproduction in Hydra. However, it is unclear how shared the developmental programs of head organizer genesis are in budding and regeneration. Time-series analysis of gene expression changes during head regeneration and budding revealed a set of 298 differentially expressed genes during the 48-h head regeneration and 72-h budding time courses. In order to understand the regulatory elements controlling Hydra head regeneration, we first identified 27,137 open-chromatin elements that are open in one or more sections of the organism body or regenerating tissue. We used histone modification ChIP-seq to identify 9,998 candidate proximal promoter and 3,018 candidate enhancer-like regions respectively. We show that a subset of these regulatory elements is dynamically remodeled during head regeneration and identify a set of transcription factor motifs that are enriched in the enhancer regions activated during head regeneration. Our results show that Hydra displays complex gene regulatory structures of developmentally dynamic enhancers, which suggests that the evolution of complex developmental enhancers predates the split of cnidarians and bilaterians.
Significance
Little is known about how similar the developmental programs of head organizer genesis are in Hydra budding and head regeneration at the level of gene expression and chromatin regulation. We find that a subset of candidate regulatory elements is dynamically remodeled during head regeneration and identify a set of transcription factor motifs that are enriched in the enhancer regions activated during head regeneration. Hydra displays complex gene regulatory structures of developmentally dynamic enhancers, which suggests that the evolution of complex developmental enhancers predates the split of cnidarians and bilaterians.
Introduction
Hydra belongs to the phylum Cnidaria that consists of approximately 10,000 species divided into two major groups: Anthozoa (comprising sea anemones, corals, and sea pens) and Medusozoa (sea wasps, jellyfish, and Hydra). The hallmark traits of cnidarians are their external radial symmetry and their nematocytes, stinging cells used for predation. Cnidarians consist of two germ layers (endoderm and ectoderm) and have a single body axis called the oral–aboral axis. An adult Hydra has a simple structure consisting of a cylindrical tube with an apical head and a basal foot. The epithelial cells of both the ectoderm and endoderm of the body column (BC) are constantly in the mitotic cycle (Campbell 1967). As a consequence, tissue is continuously displaced toward and sloughed off at the two extremities (Campbell 1967). To maintain the structure of an adult Hydra in this context, a group of cells referred to as the head organizer are located in the hypostome in the upper part of the head (Browne 1909; Technau et al. 2000; Broun and Bode 2002). The head organizer actively maintains the pattern and morphology of the animal by signaling neighboring cells to adopt differentiated states appropriate to the head (hypostome and tentacles). When a Hydra is bisected anywhere along with the top one-thirds of the BC, a head regenerates after the formation of a head organizer (Bode 2003, 2012).
The mechanism driving Hydra head regeneration has yet to be deciphered but previous studies have found evidence of regulation by multiple developmental pathways. The most commonly studied pathway in head regeneration is the canonical Wnt pathway. Hydra Wnt and TCF genes are expressed in the hypostome where the organizer is located (Hobmayer et al. 2000). A critical component of organizer formation is β-catenin (Gee et al. 2010). When Hydra are treated with alsterpaullone, which blocks the degradation of β-catenin by GSK3β (Leost et al. 2000), the level of β-catenin is elevated throughout the BC and results in numerous head organizers forming all along the BC (Broun et al. 2005). Although the most well-known Wnt involved in head organizer formation is Wnt3, it is believed that multiple Wnts have a role in the head organizer and regeneration (Lengfeld et al. 2009). Seven Wnt genes: Wnt3, Wnt1, Wnt7, Wnt 9/10a, Wnt9/10c, Wnt11, and Wnt16 are expressed between 0 and 48 h of Hydra head regeneration. A number of other genes have been shown to affect or be associated with head organizer formation. These include Goosecoid (Broun et al. 1999), Brachyury (Technau and Bode 1999), Forkhead/HNF-3b (Martinez et al. 1997), and Chordin (Rentzsch et al. 2007). Furthermore, Notch signaling is also required for proper head formation, treatment of Hydra with DAPT inhibits proper HyWnt3 expression (Münder et al. 2013).
The head organizer also arises during bud formation, which is Hydra’s asexual form of reproduction. Under normal physiological conditions, Hydra reproduces asexually through budding in the lower BC area. During the initial stage of bud formation, a head organizer is formed in the budding zone, and subsequently directs the formation of a bud, which eventually develops into an adult Hydra. In addition to their role in the formation and maintenance of the head organizer at the hypostome, Hydra Wnt genes are also involved in the budding process as they are expressed at the budding zone where the presumptive bud arises and in the hypostome of the growing bud (Hobmayer et al. 2000). Eight Wnt genes (Wnt3, Wnt1, Wnt2, Wnt7, Wnt9/10a, Wnt9/10c, Wnt11, and Wnt16) are expressed in the developing bud (Lengfeld et al. 2009). Since both regeneration and budding involve the formation of a head organizer, with some differences in the Wnt genes expressed, a natural question is the extent to which the two gene expression programs are similar. Specifically, what are the common and regeneration-specific (or budding-specific) sets of genes involved in head organizer genesis during head regeneration and budding, and subsequently its activity and maintenance? RNA-seq has enabled gene expression profiling, full-transcript assembly, allele-specific expression profiling, and RNA-editing studies (Conesa et al. 2016). During the last 5 years, RNA-seq has been used to assemble a transcriptome of Hydra (Wenger and Galliot 2013), to characterize the transcriptome and proteome of Hydra during head regeneration (Petersen et al. 2015), and to profile the small noncoding RNA repertoire of Hydra (Krishna et al. 2013).
From a phylogenetic perspective, cnidarians and bilaterians diverged approximately 600 Ma (Technau and Steele 2012). Therefore, the study of cnidarians provides potential opportunities for elucidating key aspects of metazoan evolution such as the formation of mesoderm, bilaterian body plan, and the nervous system. Considering the insights that can be obtained from comparison of cnidarians and bilaterians, genome sequencing and functional genomic studies of cnidarians have been important in evolutionary research. The sequencing of the genomes of the anthozoan Nematostella vectensis (Putnam et al. 2007) and of the medusozoan Hydra vulgaris (Chapman et al. 2010) provided an important backbone for future studies. A rather surprising finding of these genomes was that the gene contents of these basal metazoans are similar to those of bilaterians (Putnam et al. 2007; Chapman et al. 2010). This finding led to speculation that the difference in the body plans of cnidarians and bilaterians is due to differences in gene regulation (Carroll 2008; Schwaiger et al. 2014) and differences in cis-regulatory elements among even closely related species (Frankel et al. 2011; Villar et al. 2015). A comparison of the gene regulatory landscapes of cnidarians and bilaterians requires systematic genome-wide mapping of cis-regulatory elements within sequenced cnidarian genomes. So far, this has only been attempted in Nematostella, leading to identification of over 5,000 enhancers and the surprising finding that the gene regulatory landscape of Nematostella is at least as complex as those of bilaterians (Schwaiger et al. 2014). Although studies in mammalian model systems show that enhancers evolve at a more rapid pace than the coding sequences, it remains to be determined if enhancer evolution is an important agent of metazoan evolution over long evolutionary periods.
The first step in a comparative study of enhancers in cnidarians is a genome-wide identification of enhancers and other regulatory elements. The most reliable approach involves experimental methods to identify genomic regions containing features associated with enhancers (Hardison and Taylor 2012). Experimental methods for mapping promoters and enhancers are based on detecting specific histone modifications that are associated with each cis-regulatory modules type, as well as, increased accessibility of such regions due to localized depletion of nucleosomes. Specific combinations of posttranslational modifications of histone proteins are associated with either promoters or enhancers. For example, histone H3 in promoter regions are associated with high levels of trimethylation or dimethylation at Lysine 4 (H3K4me3 and H3K4me2, respectively) in fungi, plants, and animals while high levels of H3K4me2 and H3K27ac (H3 Lysine 27 acetylation) but low levels of H3K4me3 are found at active enhancer regions in bilaterians. Chromatin immunoprecipitation followed by sequencing (ChIP-seq) using antibodies that recognize specific histone modifications can be used to map the locations of candidate active promoters and enhancers genome-wide. These candidate promoters and enhancers are furthermore located in genomic regions relatively depleted of nucleosomes, which allows transcription factors to bind their binding sites. These regions are more readily digested enzymatically due to easy accessibility compared with tightly wound “closed” chromatin. This is the basis for high-throughput assays, such as DNase-seq (Hesselberth et al. 2009; Boyle et al. 2011; Neph et al. 2012) and ATAC-seq (Buenrostro et al. 2013), which preferentially digest open-chromatin regions with the enzymes DNase and Tn5 transposase respectively when treated for a short period of time. In bilaterians, changes in open chromatin accessibility are observed during differentiation and development.
In this study, we sought to identify the common transcriptional dynamics of hypostome establishment during Hydra head regeneration and budding time courses. We also sought to map the open-chromatin landscape in Hydra genome in the context of head regeneration to identify its transcriptional regulation. We first used RNA-seq from different body tissues in Hydra to characterize genes upregulated in the adult hypostome. We then looked at genome-wide gene expression patterns during Hydra head regeneration and budding. We analyzed the resulting differentially expressed (DE) genes to assess the common and divergent sets of genes between head regeneration and budding in Hydra as well gene signatures of the Hydra hypostome. In addition, we profiled the open-chromatin elements of Hydra using ATAC-seq during a 48-h time course of head regeneration and body map. We generated corresponding ChIP-seq experiments of three histone modifications (H3K4me2, H3K4me3, and H3K27ac) to map genome-wide candidate promoter and enhancer-like elements in Hydra (fig. 1). The integrative analysis of ATAC-seq and ChIP-seq data sets allowed us to predict 9,998 candidate promoters and 3,018 candidate enhancer-like elements in the Hydra genome. We found evidence for extensive chromatin remodeling of the regenerating head tissue and we identified a set of motifs for specific transcription factors that are enriched in the enhancer regions that are activated during remodeling.
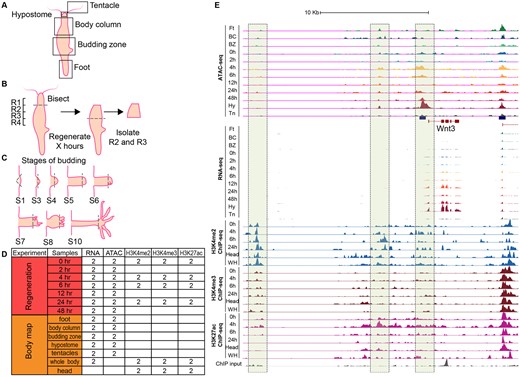
Outline of RNA-seq, ATAC-seq, and ChIP-seq experiments in Hydra. (A) Five Hydra body parts were isolated for RNA-seq and ATAC-seq to create a body map. (B) Hydra heads were bisected at the boundary of regions R1 and R2 and allowed to regenerate for specific time periods (0, 2, 4, 6, 12, 24, and 48 h). The regions R2 and R3 were isolated for RNA-seq to measure gene expression and ATAC-seq to map chromatin accessibility. (C) Hydra bud heads at various stages of budding (S1, S3, S4, S5, S6, S7, S8, and S10) were bisected and total RNA was extracted for RNA-seq. (D) Number of Hydra biological replicate samples assayed by RNA-seq, ATAC-seq, and ChIP-seq. Two biological replicates were also obtained for each stage of budding. (E) Genome browser signal tracks for RNA-seq, ATAC-seq, and ChIP-seq data for the Wnt3 locus. The Wnt3 promoter and an upstream “enhancer” region gain hypersensitivity along the head regeneration time course as gene expression is turned on.
Results
Hydra Body Map Transcriptome
Before investigating dynamic gene expression during regeneration and budding, we sought to characterize gene expression in the adult Hydra hypostome by comparing it to other tissues of the Hydra body plan. We generated RNA-seq libraries from Hydra tentacles, hypostome, BC, budding zone, and foot (two replicates per tissue type from one animal per replicate; fig. 1A). A principal component analysis (PCA) of RNA-seq samples from tentacles, hypostome, BC, budding zone, and foot showed that the libraries grouped by body part (supplementary fig. S1A, Supplementary Material online). The foot, tentacle, and hypostome were more distinct from each other than the BC and budding zone, which lie near each other on the PCA plot (supplementary fig. S1A, Supplementary Material online). We found 217 genes differenetially expressed (DE) between the BC and budding zone, 1,146 between the BC and foot, 847 between the foot and budding zone, 4,244 between the budding zone and the tentacles, 1,836 between the foot and hypostome, 1,774 between the BC and hypostome, 4,478 between the BC and tentacles, 1,887 between the budding zone and the hypostome, 3,421 between the foot and tentacles, and 2,760 between the hypostome and tentacles (supplementary table S1, Supplementary Material online). About 204 genes were uniquely upregulated in the hypostome (supplementary table S2, Supplementary Material online), 837 in the tentacles (supplementary table S3, Supplementary Material online), 58 in the BC (supplementary table S4, Supplementary Material online), one in the budding zone (supplementary table S5, Supplementary Material online), and 259 in the foot (fig. 2A and supplementary tables S1 and S6, Supplementary Material online). The low number of genes uniquely upregulated in the BC and budding zone is likely due to the similarity in expression profiles for the two tissues.
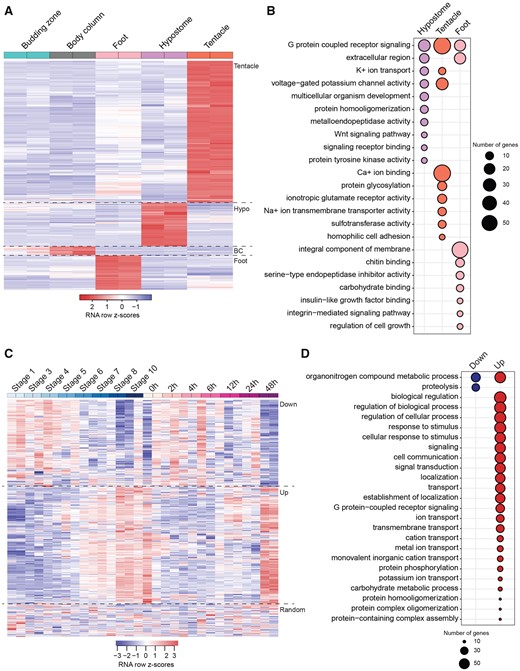
Heatmaps and functional enrichment of DE genes in the Hydra body map. (A) Heatmap showing clusters of genes upregulated in the tentacles, hypostome (hypo), BC, and foot. Only one gene was uniquely upregulated in the budding zone and is therefore not visible on the heatmap. (B) Functional enrichment of genes upregulated in the hypostome, tentacles, and foot. There was no significant enrichment for genes upregulated in the BC and budding zone. (C) Heatmap and grouping of the DE genes in the hypostome versus budding zone. Group 1 (Down) shows genes that decrease in expression during the stages of budding and time points of regeneration. Group 2 (Up) shows genes that increase in expression during budding and regeneration. Group 3 is the remainder of the genes with no trends in budding or regeneration. Although shown together, z scores were calculated separately for budding and regeneration. (D) Functional enrichment of genes in group 1 and group 2 of figure 2C. There was no significant functional enrichment for genes in group 3.
In order to determine the potential function of genes specific to each tissue, we did a gene ontology (GO) term enrichment analysis for the genes uniquely upregulated in each of the five tissues (fig. 2A). BC and budding zone did not have any significant GO term enrichment (fig. 2B). Genes upregulated in the tentacle were enriched for functions in G protein coupled receptor signaling, protein glycosylation, potassium ion transport, and homophilic cell adhesion (fig. 2B and supplementary table S3, Supplementary Material online). Genes uniquely upregulated in the foot were enriched for functions in G protein coupled receptor signaling pathway, regulation of cell growth, and integrin-mediated signaling pathway (fig. 2B and supplementary table S6, Supplementary Material online).
Genes uniquely upregulated in the hypostome were enriched for functions in G-protein coupled receptor activity, potassium ion transport, multicellular organism development, protein homooligomerization, Wnt signaling pathway, and peptidyl-tyrosine phosphorylation (fig. 2B and supplementary fig. S1 and table S7, Supplementary Material online). Genes involved in G protein coupled receptor activity were upregulated across most of the tissues that we sampled and are often associated with sensory transduction. A recent study characterized the molecular evolution and expression of G protein coupled opsin genes in Hydra and identified one gene expressed at high levels in all tissues (Macias-Munõz et al. 2019). Genes enriched for functions in Wnt signaling and multicellular organism development included Wnt3, Wnt1, Wnt9/10C, and KS1-like (supplementary table S8, Supplementary Material online). These genes are of interest because they may have a role in maintenance of the head organizer in the adult Hydra. Other potential genes of interest that were highly expressed in the hypostome relative to other tissues (due to low false discovery rates [FDR] and high log-fold change [logFC]) were EGF-like repeat and discoidin I-like domain-containing 3, COUP-TF1, Homeobox ARX, and zinc finger 681-like (supplementary fig. S1C, Supplementary Material online).
We expected to detect Wnt genes upregulated in the hypostome because Wnt genes have been implicated in the Hydra head organizer (Lengfeld et al. 2009). As mentioned earlier, Wnts 3, 1, 7, 9/10a, 9/10c, 11, and 16 are expressed in the developing head during budding and regeneration. Here, we were able to determine that Wnt3, Wnt1, Wnt9/10a, and Wnt9/10c were upregulated in the hypostome relative to other tissues. The reason that we did not detect the remainder of the Wnt genes as hypostome-specific is because Wnt11 is expressed in all tissues and Wnt8 and Wnt5a are highly expressed in both the hypostome and the tentacles. Next we inspected the expression dynamics of these genes during budding and regeneration (supplementary fig. S1D, Supplementary Material online). In a previous study that used in situs, Wnt3 was expressed at 1.5 h after decapitation at all stages of budding (Lengfeld et al. 2009). In our study, we found that Wnt3 expression was present at low levels at 0 h after decapitation and increases with time reaching high levels at 12 and 48 h (supplementary fig. S1D, Supplementary Material online). Similarly, for budding, expression increases throughout stages of budding with little to no expression at stage 1 (supplementary fig. S1D, Supplementary Material online). In situs showed that Wnt1 expression appeared at 3 h but did not reach high levels until 6 h during regeneration; Wnt1 was also expressed at all stages in budding (36). Using RNA-seq, we noticed different patterns of Wnt1 expression. During regeneration, Wnt1 had low expression until 48 h and during budding expression was low until stage 5 (supplementary fig. S1D, Supplementary Material online). Lastly, in situs showed the Wnt9/10a and Wnt9/10c began expression at 6 h and increased in expression at 12 h postbisection; Wnt9/10a and c were also expressed at all staged of budding (Lengfeld et al. 2009). RNA-seq showed that expression of Wnt9/10a and Wnt9/10c increased during regeneration. Wnt9/10a only reached high expression at 48 h, whereas Wnt9/10c had high expression at 12 h (supplementary fig. S1D, Supplementary Material online). During budding, Wnt9/10a and Wnt9/10c expression began increasing at stages 3 and 4 and reached high expression at stage 8, after which expression seemed to decrease (supplementary fig. S1D, Supplementary Material online). Although in situs help us localize where genes are expressed, these assays are absolute and can be sensitive to lowly expressed genes. Our results vary from previous in situ studies because we are able to quantify gene expression during different stages of budding and regeneration. Through these methods, we can better detect the dynamics of Wnt signaling to further understand head regeneration in Hydra.
Ks1 is another gene with a role in Hydra head formation (Weinziger et al. 1994). During head regeneration, Ks1 begins to be expressed 2 days after decapitation and is highly expressed at 4 days in the adult Hydra (Weinziger et al. 1994). In our study, we identified a Ks1-like gene highly expressed in the hypostome relative to other tissues (supplementary fig. S1C, Supplementary Material online). We found expression of Ks1-like to be somewhat consistent during regeneration with expression increasing at 48 h (supplementary fig. S1D, Supplementary Material online). In addition, Ks1-like expression began to increase at stage 4 of budding and was highly expressed during Hydra bud stages 6, 7, and 8. Compared with the Wnt genes, Ks1-like has a more similar trajectory in regeneration to Wnt3 but increased at a much slower rate. Based on the expression patterns that we observe during regeneration and budding, Ks1-like expression seems to follow that of Wnt3. Continued high expression in the hypostome of the adult Hydra also suggests that Ks1-like is actively transcribed and may play a role in the head organizer.
Additional interesting genes in the Hydra hypostome are those involved in transcription such as EGF-like repeat and discoidin I-like domain-containing 3 (EDIL3), COUP-TF1, Homeobox aristaless-like (ARX-like), and zinc finger 681-like (ZFN681-like). We focus on these genes because they have a high log-fold change and high FDR. The functions of EDIL3 and ZFN681 are not known in Hydra but zinc finger proteins typically function in binding RNA or DNA and stabilizing protein–protein interactions. EDIL3 encodes for an integrin protein in human. During regeneration, ZFN681-like had expression similar to Wnt1, low expression throughout 0–24 h and increased expression at 48 h (supplementary fig. S1D, Supplementary Material online). Conversely, EDIL3 has no expression in the first 24 h and expression began at 48 h (supplementary fig. S1D, Supplementary Material online). Another gene highly expressed in the hypostome is COUP-TF1 that has implications to function in neurogenesis. A COUP-TF gene family member was found expressed in cells that lead to nematocytes and neurons (Gauchat et al. 2004). Due to the overexpression of COUP-TF1 in our study, this gene may function in neurons that are high in number or condensed in the hypostome (supplementary fig. S1C, Supplementary Material online). Expression of COUP-TF1 increased throughout regeneration and budding. During regeneration, expression is low until 48 h and during budding average expression is similar at stage 5 to later stages (supplementary fig. S1D, Supplementary Material online). Lastly, we found an aristaless-like gene highly expressed in the hypostome whose expression during budding was similar to that of Wnt3 and similar to Wnt9/10a during regeneration (supplementary fig. S1D, Supplementary Material online). The particular function of this homeobox gene has yet to be described but a member of the aristaless gene family functions in tentacle formation in Hydra (Smith et al. 2000). The expression of Arx-like in our data set suggests this homeobox gene has a role in head patterning.
In addition to analyzing genes uniquely upregulated in each of the Hydra body tissues, we characterized genes that were DE between the hypostome and budding zone to investigate differences between a developing hypostome and an adult hypostome. As mentioned previously, a differential expression analysis between the hypostome and budding zone identified 1,887 DE genes. We then looked at the expression patterns of these genes during budding and regeneration. A heatmap shows that the genes form three groups, those that increase during regeneration and budding, those that decrease, and a third group of genes that do not follow any trend (fig. 2C). Group 1 genes, that decreased in budding and regeneration, were enriched for functions in proteolysis and organonitrogen compound metabolic process (fig. 2D). Group 2 genes, that increased in budding and regeneration, had functions in (generally) signaling, transport, response to stimuli, localization, metabolism, and biosynthesis (fig. 2D). We expected this analysis to rule out housekeeping genes and highlight important genes in the Hydra adult hypostome and developing Hydra. We predicted that the genes with increased expression during regeneration and budding would be enriched for functions important for head patterning. However, this was not the case. The reason for this discrepancy is because we focused on genes DE between the budding zone and adult hypostome. As Hydra have to be constantly regenerating a new head organizer, it is possible that head patterning genes are expressed in similar levels in the adult and developing or regenerating head.
Time-Series Analysis of Hydra Head Regeneration and Budding Transcriptomes
Hydra head regeneration is a classic example of the critical role of signaling pathways in axial patterning and head organizer formation and maintenance (Bode 2012). Head regeneration has been studied using both developmental approaches (Hobmayer et al. 2000) and more recently using transcriptomic and proteomic approaches (Petersen et al. 2015). However, less is known about the extent to which the regeneration and budding gene regulatory programs overlap. We applied PCA to compare globally the regeneration and budding transcriptomes (fig. 3A). This analysis revealed that the time courses of head regeneration and budding follow different trajectories (regeneration along PC3 and budding along PC2) but eventually converge along PC1 (which accounts for the highest amount of variance in the data) (fig. 3A). We repeated the PCA analysis to include three body map samples: tentacles, BC, and hypostome. Tentacles cluster separately from the regeneration time points, budding stages, BC, and hypostome along PC1, which accounts for the highest amount of variance (26%) (supplementary fig. S2, Supplementary Material online). Such sharp clustering and separation of regeneration and budding samples from tentacles along PC1 indicates that there is a large set of genes whose expression are very specific only to tentacles. To determine the potential variation between replicates, we generated correlation plots from our RNA-seq data. In general, replicates had the highest correlations coefficients with some similarities in time points of regeneration and budding (supplementary fig. S3, Supplementary Material online).
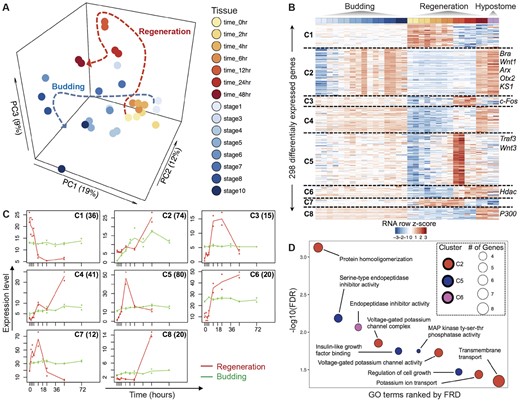
Comparative analysis of gene expression between head regeneration and budding in Hydra. (A) PCA plot of Hydra gene expression during head regeneration and budding shows that the developmental trajectories of head regeneration and budding converge along PC1. The dotted lines show the overall trajectories of regeneration and budding time courses. (B) Heatmap of the 298 DE genes, grouped in eight clusters based on similar expression dynamics during head regeneration and budding. (C) Median expression profiles of clusters in the time courses of regeneration (red profiles) and budding (green profiles). The clusters correspond to figure 3B and the number of genes in each cluster are shown inset. (D) Representative enriched GO terms for the clusters of DE genes in figure 3B. Significance level is at FDR of 0.05. Clusters 1, 3–4, and 7–8 did not have any enriched GO terms.
The PCA analysis of Hydra head regeneration and budding shows that there are sets of genes specific or common to both regeneration and budding time courses. For a higher resolution analysis to determine these gene sets, we performed a time-series analysis of the regeneration and budding transcriptomes using maSigPro (Nueda et al. 2014) to find clusters of DE genes that have similar expression profiles. This analysis identified 298 DE genes that form eight nonredundant clusters (fig. 3B). DE genes in seven clusters (C1 and C3–C8) were expressed at almost steady state during the budding time course but show complex dynamic temporal changes during regeneration (fig. 3B). The median expression profiles of DE genes in each cluster are shown in figure 3C. Genes in cluster C2 show gradual temporal activation along both time courses (fig. 3C). This cluster contains some of the hypostome marker genes such as Wnt1, ARX, and KS1 that are key developmental genes (supplementary fig. S1D, Supplementary Material online).
The genes in each of the eight distinct clusters (fig. 3B) were tested for enrichment of GO terms using Blast2GO’s Fisher exact test (FDR ≤ 0.05). Genes in three clusters (C2, C5, and C6) were enriched for GO terms, whereas five clusters (C1, C3, C4, C7, and C8) did not have any significantly enriched GO terms (fig. 3D). Cluster 2, consisting of 72 genes upregulated in mid-to-late stages of both head regeneration and budding, had enriched GO terms related to protein homooligomerization, voltage-gated potassium channel complex, voltage-gated potassium channel activity, potassium ion transport, and transmembrane transport. Cluster 5 (80 genes) was upregulated during early head regeneration time points (4–12 h postbisection) and was enriched in GO term such as serine-type endopeptidase inhibitor activity, insulin-like growth factor binding, MAP kinase tyrosine–serine–threonine phosphatase activity, and regulation of cell growth. Cluster 6 (20 genes) which increased in expression during regeneration was enriched in endopeptidase inhibitor activity. Although Cluster 3 did not have significant enrichment of GO terms, it had genes with similar expression patterns to that of Cluster 5, which included Wnt3, with peaks at 12 h postbisection. One of the genes in Cluster 3 was cFos, a transcription factor involved in animal regeneration (Petersen et al. 2015; Cazet et al. 2021).
Mapping the Open-Chromatin Landscape of Hydra
ATAC-seq was done on the Hydra adult body tissues including the hypostome, tentacles, BC, budding zone, and foot. ATAC-Seq was also performed during a regeneration time course at hours 0, 2, 4, 6, 12, 24, and 48 (fig. 1). We sequenced the ATAC-seq libraries to an average depth of 20 million reads and mapped the reads onto the latest release of the Hydra genome (Hydra 2.0 Genome Project) in order to identify open-chromatin “peaks” in each data set using Homer (Heinz et al. 2010). Peak calls from each biological replicate were compared and only those that overlapped were retained for downstream analysis. The sets of peaks from all samples in the regeneration time course and body-map were merged to obtain a consolidated set of 27,137 peaks.
We classified the 27,137 open-chromatin elements according to their genomic locations with respect to the annotated genes. Since no prior knowledge about the locations of regulatory elements in Hydra was available, we defined four classes of open-chromatin elements as follows: proximal promoter (peaks within ±2 kb of transcript start sites), intergenic (peaks located between genes), intronic (peaks overlapping annotated introns), and exonic (peaks overlapping annotated exons) (fig. 4A). Using this classification scheme, we identified 9,998 proximal promoter open elements, 8,962 intergenic open elements, 6,454 intronic open elements, and 1,723 exonic open elements (fig. 4B). We next looked at the distribution of ATAC-seq signal in the four types of open-chromatin elements defined above (supplementary fig. S4, Supplementary Material online). The proximal promoter open elements possess the highest amount of signal followed by the intergenic open elements. Most of the signal is located at the centers of the four types of peaks. Based on the genomic locations of the peaks and the enrichment of ATAC-seq signal at them and their distance from the annotated transcription start site (TSS), our set of open-chromatin elements provides candidate promoter (near TSS) and enhancer-like elements (intergenic). However, we cannot exclude that some intergenic elements represent unannotated TSSs without using additional evidence such as the ratio of H3K4me3 to H3K4me2 from the ChIP signal.
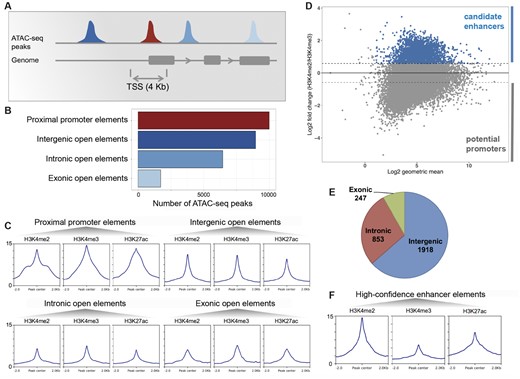
Identification of a high-confidence set of Hydra regulatory regions using ATAC-seq and ChIP-seq data. (A) Distribution of open-chromatin elements based on their genomic locations. (B) The 27,137 replicated ATAC-seq peaks found in one or more samples were classified based on overlap with gene loci. The proximal promoter regions were defined as regions within 2 kb of start of genes. (C) Enrichment of H3K4me2, H3K4me3, and H3K27ac histone modifications normalized signals at each type of open-chromatin elements. (D) About 3,018 open-chromatin elements (blue) with at least 50% higher H3K4me2 than H3K4me3 signal form a set of high-confidence candidate enhancer-like (in blue). Y axis shows log2-fold change of H3K4me2 signal over H3K4me3 signal and x axis shows the log2 of geometric mean of H3K4me2 and H3K4me3 signals. In the negative are potential promoters. (E) Genomic distribution of candidate enhancer-like elements. (F) Enrichment of H3K4me2, H3K4me3, and H3K27ac signals at the candidate enhancer-like elements.
Classification of Open-Chromatin Elements Using Histone Modifications
Using our ATAC-seq data sets, we obtained a set of 27,137 open-chromatin elements that were classified into four groups based on their genomic locations (fig. 4B). We used ChIP-seq (Schmidl et al. 2015) in several of the corresponding time points of the head regeneration time course and body parts as well as whole animal (fig. 1D) to generate histone modification profiles. We used antibodies that detect H3 dimethylation of Lys 4 (H3K4me2), trimethylation of Lys 4 (H3K4me3), and acetylation of Lys 27 (H3K27ac). The histone modifications H3K4me3 and H3K4me2 are known to mark chromatin at the promoter regions with a higher ratio of H3K4me3 to H3K4me2, whereas high H3K4me2 with low H3K4me3 predominantly mark the enhancer regions and H3K27ac marks active regulatory regions (Perino and Veenstra 2016). Correlation analysis of the ChIP-seq approaches found high correlation between replicates and low correlation between different histone modifications (supplementary fig. S5, Supplementary Material online). For the ATAC-seq data, correlation was in general higher for replicates but high for all samples (supplementary fig. S6, Supplementary Material online).
We computed and compared the normalized enrichment of the H3K4me2, H3K4me3, and H3K27ac at the peaks from the four sets of open-chromatin elements classified based on their genomic locations (fig. 4C). The proximal promoter open-chromatin elements showed the highest enrichment of H3K4me2, H3K4me3, and H3K27ac with a slightly higher enrichment of H3K4me3 (fig. 4C). Thus, the chromatin marks provide further evidence for the proximal promoter open-chromatin elements as candidate promoter regions in the Hydra genome. We expected higher enrichment of H3K4me2 compared with H3K4me3 at the remaining three classes of open-chromatin elements (intergenic, intronic, and exonic) since these were non-TSS overlapping. We observed almost equal (intergenic, fig. 4C) or slightly lower enrichment of H3K4me2 (intronic and exonic, fig. 4C) at these regions. A reason for the discrepancy in the relative enrichments of H3K4me2 and H3K4me3 at the non-TSS open-chromatin element sets could be the inclusion of peaks overlapping the nonannotated TSS regions. Therefore, we used the relative enrichment of H3K4me2 over H3K4me3 to score the peaks and identify candidate enhancer regions (fig. 4D). We defined H3K4me2 enriched peaks as having minimum 50% or higher enrichment of H3K4me2 signal over H3K4me3 (fig. 4D). This strategy led to the identification of 3,018 ATAC-seq peaks which are predominantly intergenic (1,918/3,018) followed by intronic (853/3,018) and exonic open-chromatin elements (247/3,018) that have higher H3K4me2 than H3K4me3 signal (fig. 4E). Comparison of the histone mark signals at the 3,018 peaks reveals considerable enrichment of H3K4me2 relative to the H3K4me3 mark (fig. 3F). Therefore, the set of 3,018 open-chromatin elements, based on their genomic locations and the enrichment of histone modifications, form the likeliest candidates for enhancer-like regions in the Hydra genome.
Dynamics of Open-Chromatin Elements during Hydra Head Regeneration
Hydra head regeneration is a dynamic process involving changes in expression of multiple genes related to Wnt signaling pathway (Lengfeld et al. 2009), MAPK pathway (Arvizu et al. 2006), and response to injury (Petersen et al. 2015) to name a few. An important question that remains unanswered is: How extensive is the remodeling of chromatin in Hydra genome in response to bisection and regeneration of a head? With a genome-wide set of open-chromatin elements obtained from data generated in this study, we explored the above question.
Dynamic remodeling of the chromatin during Hydra head regeneration time course can be observed at the Wnt3 gene locus (fig. 1E) which is known to be one of the earliest Wnt ligands expressed at the regenerating head (Lengfeld et al. 2009). Open-chromatin signals appear at the Wnt3 promoter and upstream candidate enhancer-like regions as early as 4 h postbisection (fig. 1E). We extended this analysis to the complete set of 27,137 open-chromatin elements by looking for differentially accessible (DA) elements genome-wide. Differential analysis of all the peaks identified 2,870 DA open-chromatin elements (∼10.5%), at 5% FDR and minimum 2-fold change, that form eight groups with distinct dynamic patterns when clustered (fig. 5A). The clusters reveal sets of open-chromatin elements specific to certain tissues or head regeneration time course. For example, cluster 1 consists of open-chromatin elements specific to the foot, budding zone, and BC tissues of Hydra, whereas clusters 3 and 8 consist of elements that lose or gain accessibility during head regeneration respectively (fig. 5A).
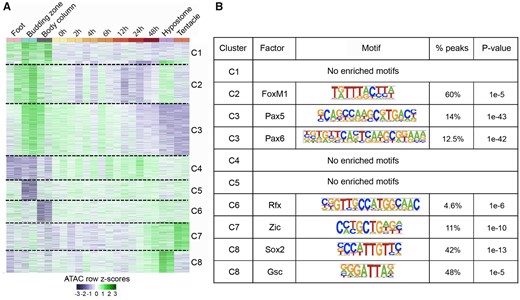
Dynamics and motif analysis of 2,870 DA peaks. (A) Normalized reads per million (RPM) values for the 2,870 DA peaks were converted to row z scores and k-means clustered into eight clusters based on the observed number of clusters when hierarchically clustered. (B) Transcription factor-binding motifs enriched in open chromatin regions of each cluster in figure 5A.
We next determined whether the tissue and regeneration time course specific clusters of the 2,870 DA peaks were enriched for transcription factor-binding sites using Homer (Heinz et al. 2010). Five clusters of DA peaks (C2–C3, C6–C8) had enriched motifs for transcription factor-binding sites, whereas three clusters (C1, C4, and C5) had no enriched motifs (fig. 5B). Open chromatin regions of cluster C2 (specific to foot, budding zone, BC, and hypostome) were enriched for binding site of FoxM1. Open chromatin regions specific to budding zone and BC that lose accessibility along regeneration time course (cluster C3) were enriched for the Pax5- and Pax6-binding motifs. Cluster 7, consisting of peak regions that gain accessibility in later stages of regeneration (24–48 h postbisection) and specific to hypostome and tentacles were enriched for Zic-binding site which is known to play a role in specification of sensory nematocytes (Lindgens 2004). Peak regions in cluster C8 that gain accessibility along the time course of regeneration were enriched for the binding sites of Sox2 and Goosecoid (Gsc). The Goosecoid homologue in Hydra is known to participate in head patterning (Broun et al. 1999). Overall, we found that the nearly ten percent of candidate regulatory elements that show dynamic changes during Hydra head regeneration included clusters that are enriched in predicted transcription factor-binding sites of developmental transcription factors.
Discussion
We carried out time-course experiments in Hydra using RNA-seq to compare gene expression during head regeneration and budding. We also used ATAC-seq to obtain a genome-wide view of open-chromatin landscape and remodeling in the genome of the adult Hydra body map and during a time course of head regeneration. To further classify the open-chromatin elements, we carried out ChIP-seq of three histone modifications (H3K4me2, H3K4me3, and H3K27ac) in a subset of these corresponding samples to annotate the open-chromatin elements as promoter-like or enhancer-like regions. Using these methods, we identified genes that were upregulated in the adult hypostome and may have a role in the head organizer. We also characterized gene clusters with similar trajectories of expression during head regeneration and budding. In addition to gene expression, we characterized chromatin regulation in Hydra and discovered approximately 27,000 candidate regulatory elements of which ∼37% were promoter-like and ∼11% were enhancer-like elements. We identified two clusters of open chromatin elements that are differentially regulated during head regeneration and identified transcription factor motifs enriched in these clusters.
The time-course RNA-seq experiments in this study has shed light on genome-wide gene expression patterns during formation of the head organizer in Hydra during head regeneration and budding. The head organizer in Hydra is estimated to consist of 50–300 cells at the apical tip of the head. Single animal profiling at a greater temporal resolution should provide additional insights into the establishment of head organizer in different developmental scenarios in Hydra and the processes that initiate and maintain it. Whether the head organizer plays a role in sexual embryonic development is not known, although it is likely also involved in the development of the structure of the animal during embryogenesis. Future extensions of this study to the comparison with the head organizer formation during sexual embryogenesis will reveal the extent of reuse of the normal developmental program during head regeneration.
Identification of developmental genes such as Wnt, Ks1, and ARX upregulated in the adult hypostome and their dynamic expression during regeneration and budding has implications for their role in the head organizer. As mentioned above, as Hydra grow and cells slough off, the head organizer must continuously be made anew through yet unknown signals and mechanisms. We predict that in adult Hydra, these head organizer “signals” must be expressed constantly for continuous cell differentiation. We also predict that these signals increase during head regeneration and budding. Interestingly enough, Wnt1, ARX, and Ks1 have similar expression patterns that follow what we predict would happen as the head organizer is determined (fig. 3B). Wnt3 is expressed in a different cluster due to coming on and peaking much earlier during regeneration and expression decreasing in the adult head (fig. 3B). In addition, a recent study used single cell sequencing to cluster cells based on cells of different stem cell trajectories (Siebert et al. 2019). Seibert et al. made their results available with an interactive portal. By searching this portal for our genes of interest, we found that Wnt1, Wnt3, Wnt7, Wnt9/10c, Wnt16, and ARX are highly expressed in the same cell cluster: head endodermal epithelial cell. Wnt1, Wnt3, and Wnt7 also show expression in the head ectodermal epithelial cell where Ks1 is expressed. These results imply that Wnt1, ARX, and Ks1 maintain head organizer differentiation; they are highly expressed in the adult, expressed during most stages of budding and only in late stages of regeneration once cells have taken on a head organizer role. Wnt3, while also important to the head organizer and upregulated in the hypostome, is crucial during head regeneration. Wnt3 is the first gene that comes on and may be triggering an increase of other Wnt and related genes. We propose that Wnt3 is responsible for head organizer cell determination, whereas other genes play a role in head organizer cell differentiation and maintenance.
Although our study combines ATAC-seq and histone mark ChIP-seq concurrently with RNA-seq, a previous study has looked at the head regeneration transcriptome in Hydra (Petersen et al. 2015). Petersen et al. (2015) explored gene expression during regeneration at times 0, 0.5, 3, 6, 12, 24, and 48 h using tophat2 and DESeq2. They used 100–200 animals per each of three replicates. Our results are similar to those of Petersen et al. in the general function of DE genes. Their paper and ours are enriched for genes that function in cell signaling and transport. In addition, we found similar patterns of expression for Wnt genes. Petersen et al. (2015) found that Wnt3 increased at 0.5 h, whereas other Wnt genes increase in expression at later time points during regeneration. Similarly, we found Wnt3 expression beginning to rise at 0–2 h, whereas other Wnt genes increased in expression at 12 h or later (supplementary fig. S2D, Supplementary Material online). Although some of their analyses focused on stem cell factors, we focused on candidate developmental genes discovered by doing a comparison between the hypostome and other tissues. The genes that we focus on had the highest log-fold change or FDR. Using this method, we uncovered genes that cluster together during regeneration in a transcriptome-wide analysis (fig. 3B). It should be noted that we used one animal per biological replicate in our RNA-seq study. This may account for differences in patterns of expression for some genes compared with other work using much larger sample sizes, pooled individuals, or increased numbers of replicates.
Characterization and comparisons of gene regulatory networks have gained traction with advances in the field of evolutionary developmental biology (evo-devo) (Carroll 2008). The conservation of hox genes highlighted genome similarities across species (McGinnis et al. 1984). In addition, description of a gene regulatory network with over 40 genes in sea urchin development revealed the role of genome regulation in driving appropriate morphology (Davidson et al. 2002). These discoveries bring about questions regarding the role of genome regulation in evolution (Hoekstra and Coyne 2007; Carroll 2008). As animal genomes share a lot of similarity in protein coding genes, one theory of evolution suggests that complexity in morphology was driven by complexity of genome regulation. Interestingly, transcription factor domains are found outside of metazoans in a unicellular ameboid (Sebé-Pedrós et al. 2011). Furthermore, a comparison of gene regulation in a sponge (Amphimedon queenslandica), ctenophore (Mnemiopsis leidyi), and placozoan (Trichoplax adhaerens) found that the placozoan and sponge had very specific promoter sequence motifs, whereas the ctenophore showed evidence of distal regulatory elements (Sebé-Pedrós et al. 2018). Studies such as these have demonstrated that the landscape for gene regulation was present before the divergence of eumetazoa (Sebé-Pedrós et al. 2011, 2018; Schwaiger et al. 2014; Gaiti et al. 2017).
Regeneration of whole structures occurs in a few animal species. The extent to which the genes and gene regulatory networks driving regeneration vary across species remains largely unexplored. In vertebrates, a comparison between a salamander (Axolotl) and a freshwater fish (Polypterus) capable of limb and fin regeneration, respectively, found 194 common regeneration-specific genes (Darnet et al. 2019). These results demonstrated that in the case of these species the same genetic program coded for structure regeneration. However, the mechanisms underlying regeneration are very different between vertebrates and invertebrates (Tanaka and Reddien 2011). Recently, it was discovered that an early growth response (EGR) motif varied in chromatin accessibility during regeneration of the acoel Hofstenia miamia. By comparing our results of gene regulation and motif-binding during regeneration to that of Hofstenia, we can determine which regenerative programs were present before the divergence of bilaterians. Although we did not find an enrichment for EGR motifs, we found peaks near two of the proposed ten gene targets (nlk-like and mtss1-like) (Gehrke et al. 2019).
One of the transcription factor motifs enriched in a dynamic ATAC-Seq analysis during head regeneration in Hydra was Forkhead box protein M1 (FoxM1) (fig. 5A). Interestingly, two motifs that were variably accessible during the regeneration of Hofstenia and a planaria Schmidtea mediterranea, were Fox and Jun/Fos (Gehrke et al. 2019). These findings suggest an early role of Fox transcription factors in regeneration of basal species. Furthermore, although the Fos motif is not enriched as dynamic in Hydra, we found evidence of open chromatin near a gene encoding a Fos protein and we found dynamic expression of a gene encoding a cFos transcription factor (fig. 3B). Of the 194 genes identified as regeneration-specific in a fish and salamander comparison, one of those genes was FosL2 (Gehrke et al. 2015). cFos also plays a role in regenerating glial cells in axolotl and regenerating liver cells in mice (Morello et al. 1990; Sabin et al. 2019). These results imply that although other developmental pathways play a significant role during regeneration, such as Wnt, EGR, and HOX (Nakamura et al. 2011; Srivastava et al. 2014; Gehrke et al. 2015, 2019), dynamic expression of Fos is common during regeneration of bilaterians and outgroups.
Our results support the findings of a recent study comparing Hydra head and foot regeneration (Cazet et al. 2021). Cazet et al. also used ATAC-Seq and RNA-Seq to determine the dynamics of open chromatin and gene expression changes during early injury response and regeneration in Hydra. They found no significant differences in chromatic accessibility and gene expression early in regeneration of the Hydra head and foot (Cazet et al. 2021). Some genes that were previously thought to be head-specific were actually upregulated early in head and foot regeneration and decreased later in foot regeneration. Some of these genes included Wnt3, Wnt9/10C, Wnt7, and brachury1. Similar to our results, Cazet et al. (2021) found a significant difference in FoxM1, Fos, and Sox2 accessibility and expression during Hydra regeneration. Although the function of FoxM1 in Hydra has not been previously described, we and Cazet et al. find dynamic accessibility of this transcription factor during regeneration suggesting a role in injury response and tissue regeneration. Cazet et al. suggest a level of conservation of Wnt signaling for regeneration in Hydra and bilaterians that should be further explored in addition to the transcription factors that we found significant in both studies.
In our study, we cannot determine which of our data sets (ATAC-seq or histone mark ChIP-seq) is more predictive of enhancers due to lack of a gold standard enhancer set in Hydra that could be used to evaluate our data sets. In mouse, chromatin accessibility (such as DNase-seq and ATAC-seq) and H3K27ac ChIP-seq peaks were shown to be more consistent predictors of enhancers than H3K4me1/2/3 peaks (Fu et al. 2018). ChIP-seq studies in Amphimedon queenslandica and Nematostella found that H3K4me3 was enriched following the TSS and found H3K27ac peaks in active enhancer-like regions (Schwaiger et al. 2014; Gaiti et al. 2017). Here, we integrated our ATAC-seq and histone mark ChIP-seq data sets to locate the regulatory elements in the Hydra genome. We report 27,137 candidate regulatory elements, including 3,018 candidate enhancer-like elements in the Hydra genome, A subset of the identified regulatory elements are dynamically remodeled during head regeneration. More elements lose accessibility along regeneration time course. We observed the presence of three open elements near the Wnt3 locus: a promoter element that gains accessibility during regeneration and two upstream nonpromoter open elements. Similarly, 12,983 predicted Hydra genes had at least one nonpromoter regulatory element associated with them, whereas 2,170 genes had only promoter elements. Thus, 15,153 of the total 33,820 predicted Hydra genes had at least one regulatory element open and detected in our analysis. Similar to what was previously found in Nematostella, despite identifying enhancer-like elements in Hydra, the CTCF gene is missing (using BLAST search of the annotated genes) (Heger et al. 2012). The Hydra genome was also missing zinc finger protein 143 (ZFN143), but we found a Yin Yang 1 (YY1)-associated factor and a YY1 repressor (Rao et al. 2014). An important future question is to probe the mode of physical interaction of enhancers and promoters in the cnidarian genomes in the absence of CTCF-mediated DNA looping. Additionally, in this study, we focused on histone marks associated with active regulatory elements. Future studies on the role of repressive histone marks in gene regulation during important developmental processes, such as head regeneration, can provide further insight.
Materials and Methods
RNA-Seq Methods and Materials
Hydra Culture
Hydra vulgaris HM strain polyps were used for the isolation of RNA. They were fed freshly hatched Artemia salina nauplii twice per week and cultured as described previously (Smith et al. 1999). Animals were starved for at least 1 day before any tissue manipulation and RNA isolation was carried out.
Experimental Design and Tissue Manipulation
For each sample, 1-day starved asexual Hydra polyps were selected. For regeneration, one animal per sample (with two biological replicates) was bisected at the region 1 (R1) and region 2 (R2) border (fig. 1B) and allowed to undergo head regeneration for a specific period of time (0, 2, 4, 6, 12, 24, or 48 h). Then the R2–R3 region of the animal (only one animal per biological replicate) was isolated for RNA extraction. For the budding experiment, the head region of buds from animals at various stages of budding (S1, S3, S4, S5, S6, S7, S8, or S10) (Otto and Campbell 1977) was bisected and used for total RNA extraction (fig. 1C). Tissues from tentacles, budding zone, BC, hypostome, and foot were harvested for RNA extraction (fig. 1A).
Total RNA Extraction
Each isolated tissue was dissolved in Qiagen RNeasy buffer RLT (with 2-betamercaptoethanol added) within 3 min of isolation. The dissolved tissue was immediately used for total RNA isolation using Qiagen RNeasy kit according to manufacturer’s protocol. The total RNA for each sample was treated with DNase from TURBO DNA-free kit to remove any genomic DNA contamination. RNA quality was checked with Agilent Bioanalyzer and samples with RIN scores ≥9 were used for RNA-seq library preparation.
Illumina Library Preparation
Multiplexed RNA-seq libraries were built using the Smart-seq2 protocol (Picelli et al. 2014) with slight modifications. Briefly, mRNA from total RNA in each sample was converted to full-length cDNA using poly-dT primer and reverse transcriptase. cDNA was amplified using appropriate number of PCR cycles based on the initial amount of total RNA as recommended by the Smart-seq2 protocol. About 20-ng full-length cDNA for each sample was converted to sequencing library by tagmentation with the Illumina Nextera kit. Eight cycles of PCR were used for library amplification. Libraries were multiplexed and sequenced as 43 bp Illumina paired-end reads.
GO Term Annotation of Genes
We used the genome sequence and Augustus predicted gene models from Hydra 2.0 Genome Project (https://research.nhgri.nih.gov/hydra/). The reference transcriptome was annotated with GO terms using Blast2GO (Conesa et al. 2005). First, a BLAST search was done for all the transcripts against NCBI’s nonredundant NR database. The transcripts were then annotated with the GO terms associated with the BLAST hits using the “Mapping” and “Annotation” functions of Blast2GO. The GO terms were expanded using the InterProScan and Annex mapping utilities of Blast2GO.
Gene Expression Analysis
Adapter sequences and low-quality base pairs from the paired-ends reads were trimmed using Trimmomatic v. 0.35 (Bolger et al. 2014) using the following parameters: “PE [read1.fastq] [read2.fastq] pe_read1.fastq.gz se_read1.fastq.gz pe_read2.fastq.gz se_read2.fastq.gz ILLUMINACLIP:NexteraPE-PE.fa:2:30:8:4:true LEADING:20 TRAILING:20 SLIDINGWINDOW:4:17 MINLEN:30.” Trimmed paired-end reads for each sample were mapped to the reference transcriptome (Augustus predicted gene models from Hydra 2.0 Genome Project) using Bowtie v. 1.2 (Langmead et al. 2009) with the following parameters: “-X 2000 -a -m 200 -S –seedlen 25 -n 2 -v 3.” Gene expression levels and read counts were obtained using RSEM v. 1.2.31 (Li and Dewey 2011) with the following parameters: “–paired-end –num-threads 8 –calc-ci.” Batch effects were removed from gene expression levels (TPM) using “ComBat” function from sva package v. 3.18 (Leek et al. 2012) in R v. 3.2.3. The transcripts per millions (TPM) values were then smooth quantile normalized using qsmooth package (Hicks et al. 2018) in R. For time series analysis, raw read counts for genes were converted to counts per million (CPM) and TMM normalized using edgeR. Batch effects were removed from CPM values using “ComBat.”
Time-series analysis of budding and head regeneration time courses was done using maSigPro v. 1.42.0 (Nueda et al. 2014) and R v. 3.2.3 using the maSigPro functions “p.vector” and “T.fit” with a significance level of 0.01 to find clusters of DE genes and their temporal dynamics.
The heatmap of DE genes (fig. 2) was generated in R using the Heatplus package (Ploner 2020). The TPM values of the DE genes were log2 transformed and converted to z scores for clustering and generating heatmap. Annotations on the heatmaps were done in Adobe illustrator (Adobe Inc.; https://adobe.com/products/illustrator). Correlation plots for all RNA-seq, ATAC-seq, and ChIP-seq replicates were done using the corrplot package in R (supplementary figs. S3, S5, and S6, Supplementary Material online).
GO Analysis
Each maSigPro cluster of DE genes (fig. 3C) was analyzed for GO enrichment using the “Fisher’s exact test” function of Blast2GO. The GO enrichment analysis was performed using the entire transcriptome as the reference set. FDR of 5% was used as the significance threshold.
Hydra Body Map Differential Expression Analysis
To identify genes and functions unique to the different body parts of Hydra, we did a differential expression analysis and GO term annotation of genes upregulated in Hydra tentacles, hypostome, BC, budding zone, and foot. We identified DE genes by doing ten pairwise comparisons between two different tissues in edgeR (Robinson et al. 2010; McCarthy et al. 2012) (supplementary table S1, Supplementary Material online). For each comparison, we filtered for genes having >1 counts per million per two replicates, normalized between samples using TMM normalization (Robinson and Oshlack 2010), and did a false discovery rate correction using the Benjamini–Hochberg procedure. DE genes were those which had an FDR >0.05 and log-fold change (logFC) >2. We merged results of each pairwise comparison to identify genes uniquely upregulated in each of the five tissues (supplementary table S1, Supplementary Material online). Upregulated genes were annotated with potential functions using Blast2GO (Conesa et al. 2005; Conesa and Götz 2008; Götz et al. 2008). Genes were enriched for functions using Fisher’s exact test in Blast2GO using FDR of 5%.
ATAC-Seq and ChIP-Seq Methods and Materials
Hydra Culture
Hydra vulgaris HM strain polyps were used for the isolation of RNA. They were fed freshly hatched Artemia salina nauplii twice per week and cultured as described previously (Smith et al. 1999). Animals were starved for at least 1 day before any tissue manipulation, nuclei isolation, or crosslinking.
Experimental Design and Tissue Manipulation
For chromatin profiling experiments using ATAC-seq, the Hydra polyps were first incubated in a cocktail of four antibiotics for one week with feeding, followed by one week of recovery in sterile medium according to the protocol by Fraune et al. (2015). This was done to remove commensal bacteria from the Hydra polyps before Tn5 tagmentation during ATAC-seq and avoid contamination from tagmented bacterial DNA.
For each sample, 1-day starved asexual Hydra polyps were selected. For regeneration, 20 animals per sample (with two biological replicates) were bisected at the region 1 (R1) and region 2 (R2) border (fig. 1B) and allowed to undergo head regeneration for a specific period of time (0, 2, 4, 6, 12, 24, or 48 h). Then the R2 regions of the animals of a sample were isolated for nuclei isolation and tagmentation (ATAC-seq) or crosslinking and immunoprecipitation. The following tissues were collected for the body map samples: ten whole animals; foot, budding zone, BC, hypostome, tentacles, and head (hypostome + tentacles) tissues from 20 animals; regenerating R2 tissues from 20 animals were collected for ATAC-seq and ChIP-seq each.
Chromatin Profiling Using ATAC-Seq
Nuclei from tissues described in the previous section were isolated using the following protocol based on Endl et al. (1999). Briefly, Hydra tissues were washed in ice-cold PBS once. The tissues were homogenized in 1 ml of dissociation medium (3.6 mM KCl, 6 mM CaCl2, 1.2 mM MgSO4, 6 mM sodium citrate, 6 mM sodium pyruvate, 6 mM glucose, 12.5 mM TES, stored in 4 °C) in a tissue homogenizer. The solution of homogenized tissue was transferred to an eppendorf tube and centrifuged at 500 × g for 5 min. The supernatant was removed. The cells were resuspended in 50 μl of cold cell lysis buffer (10 mM Tris–HCl, pH 7.4, 10 mM NaCl, 3 mM MgCl2, stored in 4 °C) + 0.2% IGEPAL. The sample was immediately spun down at 90 g for 8 min. The supernatant was transferred to a fresh Eppendorf tube and spun down at 500 g for 12 min. The supernatant was removed and the nuclei pellet resuspended in 50 μl ice-cold PBS to remove mitochondrial DNA. The sample was spun down at 500 g for 12 min to collect the nuclei for tagmentation. The chromatin in the nuclei pellet was tagmented using 1 μl of Tn5 enzyme and sequencing libraries prepared according to the protocol in Buenrostro et al. (2013) with the following modification: DNA fragments in the final sequencing library were size selected for 100–500 bp on a 2% agarose gel. Sequencing library qualities were assessed using a Bioanalyzer and the libraries were sequenced as 43-bp paired-end reads on an Illumina NextSeq 500. Each sample was performed with two biological replicates.
Immunoprecipitation Followed by Sequencing Using ChIP-Seq
ChIP-seq libraries were prepared using the ChIPmentation protocol v.1.14 of Schmidl et al. (2015). Briefly, tissues described in the section Experimental Design and Tissue Manipulation were crosslinked in 1% formaldehyde. The crosslinked chromatin samples were sonicated using A Qsonica sonicator using the following settings: 50%, total 15 min, 30 s on, and 30 s off. The chromatin samples were sonicated to an average size range of 200–700 bp. The following antibodies were used for immunoprecipitation: H3K4me3 Rabbit mAb (Cell Signaling Technology, Cat. No. 9751), H3K4me2 Rabbit pAb (Millipore-Sigma, Cat. No. 07030), and H3K27ac Rabbit pAb (Active Motif, Cat. No. 39133). Dynabeads M-280 sheep antirabbit IgG beads (Thermo Fisher Scientific, Cat. No. 11203D) were used for immunoprecipitation. The sequencing libraries were prepared according to protocol. Sequencing library qualities were assessed on Bioanalyzer and the libraries were sequenced as 43-bp paired-end reads on an Illumina NextSeq 500. Each experiment was performed with two biological replicates.
ATAC-Seq Data Analysis
Adapter sequences and low-quality base pairs from the paired-ends reads were trimmed using Trimmomatic v. 0.35 (Bolger et al. 2014) using the parameters described in Gene Expression Analysis section. The trimmed paired-end reads were first mapped to Hydra mitochondrial DNA sequences to filter the mitochondrial reads. The unmapped reads were mapped to the genome sequence from Hydra 2.0 Genome Project (https://research.nhgri.nih.gov/hydra/) using Bowtie v1.2 (Langmead et al. 2009) with the following parameters: “-X 2000 -v 3 -m 3 -k 1 –best.” Duplicate reads were removed using “rmdup” from Samtools v. 1.7 (Li et al. 2009). Peaks were called using Homer v. 4.9 (Heinz et al. 2010) with the following parameters: “-size 500 -minDist 50 -fdr 0.01 -style factor.” Overlapping peaks between the two replicates of each sample were kept for downstream analysis. The peaks from all samples were merged using Bedtools v.2.23.0 (Quinlan and Hall 2010). The read coverage of peaks for each sample was obtained using “coverageBed” function of Bedtools. The read counts for each sample were normalized for efficiency (number of reads within peaks divided by total number of mapped reads) and sequencing depth. DA peaks were determined using edgeR’s GLM function (Robinson et al. 2010) at the significance level of 5% FDR and minimum 2-fold change. Signal densities at the peaks were plotted using Deeptools (Ramírez et al. 2014). The peak sequences in each DA cluster were scanned for transcription factor-binding motifs using “findMotifsGenome.pl” from Homer v. 4.9 (Heinz et al. 2010). Hydra genes were associated with the ATAC-seq peaks using “annotatePeaks.pl” from Homer.
ChIP-Seq Data Analysis
Adapter sequences and low-quality base pairs from the paired-ends reads were trimmed using Trimmomatic v. 0.35 (Bolger et al. 2014) using the parameters described in Gene Expression Analysis section. The trimmed paired-end reads were mapped to the genome sequence from Hydra 2.0 Genome Project (https://research.nhgri.nih.gov/hydra/) using Bowtie v. 1.2 (Langmead et al. 2009) with the following parameters: “-X 2000 -v 3 -m 3 -k 1 –best.” Duplicate reads were removed using “rmdup” from Samtools v. 1.7 (Li et al. 2009). The histone mark read coverages at ATAC-seq peaks were obtained using “coverageBed” function of Bedtools. The read counts for each sample were normalized for efficiency and sequencing depth. Signal densities of the histone marks at the ATAC-seq peaks were plotted using Deeptools (Ramírez et al. 2014). To calculate and visualize ChIP-seq correlation, we used data from Hydra whole body across all ChIP-seq experiments and calculated read coverage using “bedtools bamtobed -i input.bam | \ bedtools coverage -a ATACseq.peaks.bed -b - \ > output.coverage.”
Supplementary Material
Supplementary data are available at Genome Biology and Evolution online.
Acknowledgments
We would like to thank Rob Steele for input in Hydra handling and experimental design. We also thank Travis Moreland, Anh-Dao Nguyen, and Andy Baxevanis at the National Human Genome Research Institute of the National Institutes of Health for making these RNA-seq, ChIP-seq, and ATAC-seq data publicly available through the Hydra 2.0 Web Portal (https://research.nhgri.nih.gov/hydra/, last accessed September 29, 2021). This work was supported in part by a George E. Hewitt Foundation for Medical Research felllowship to A.M.M.
Data Availability
The raw and processed sequencing data reported in this manuscript are deposited in GEO under the main accession number GSE127280. The subseries accession numbers for RNA-seq, ATAC-seq, and ChIP-seq data sets are GSE127279, GSE127277, and GSE127278, respectively.
Literature Cited
Author notes
Rabi Murad and Aide Macias-Muñoz contributed equally to this work.
