A Study on Optimization of CBM Water Drainage by Well-Test Deconvolution in the Early Development Stage
by
 ,
,
Dapeng Gao
1,2,* ,
,
Yuewu Liu
1,2,*,
Zhidong Guo
3,
Jun Han
3,
Jingde Lin
3,
Huijun Fang
3,
Hailing Ma
1,* and
Sang-Bing Tsai
4,* 1
Institute of Mechanics, Chinese Academy of Sciences, Beijing 100190, China
2
School of Engineering Science, University of Chinese Academy of Sciences, Beijing 100049, China
3
PetroChina Coalbed Methane Company Limited, Beijing 100028, China
4
Zhongshan Institute, University of Electronic Science and Technology of China, Zhongshan 528400, China
*
Authors to whom correspondence should be addressed.
Water 2018, 10(7), 929; https://doi.org/10.3390/w10070929
Submission received: 29 May 2018
/
Revised: 27 June 2018
/
Accepted: 10 July 2018
/
Published: 13 July 2018
(This article belongs to the Section Hydrology)
Abstract
:Different from the conventional gas reservoir, coalbed methane is developed mainly by water drainage, which leads methane desorption after reservoir pressure drop. Water drainage at a reasonable speed in the early development stage is the key for enhancing later gas performance. Therefore, the investigation radius, which reflects the pressure drop region scale, is studied by deconvolution well-test to find the reasonable water drainage speed in the early period. First, the early production data (well-bottom pressure and water rate) are processed by deconvolution algorithm, and then the pressure data under unit rate is obtained to invert the comprehensive reservoir permeability and investigation radius. This deconvolution method can save the cost of the conventional well-test, and avoid reservoir damage caused by frequent well shut-off. The feasibility of the deconvolution test method is verified by comparing its interpretation results with those of the conventional pressure drop/build-up test. For a field application, the 29 wells’ comprehensive permeability are inverted by the deconvolution well-test using early water production data of Hancheng block. Furthermore, their investigation radius and pressure drawdown gradient are calculated, and the performance optimization is determined by relationship analysis between working fluid level and steady gas production rate. We find that well-bottom pressure and reservoir pressure should decrease steadily in the early development stage, with the working fluid level declining less than 1 m/d (1 m per day) in wellbore, and the pressure drawdown gradient declining less than 2.8 MPa/100 m.
1. Introduction
Different from the conventional gas reservoirs, the coalbed methane (CBM) reservoir is developed mainly by dewatering, which leads to methane desorption after reservoir depressurizing [1]. When the pressure decreases to the critical desorption pressure, the methane will desorb from the coalbed matrix. The whole production process contains several stages, and the effective flow permeability is very different in each different stage [2]. Especially the water/gas rate, bottom hole pressure (BHP) and casing pressure change variously. Due to a lack of reasonable production strategies, the performance of CBM wells is quite imbalanced. The key problems are how to control the pressure drawdown of CBM wells at different production stages, as well as how to improve the performance. Pressure drawdown is the differential displacement pressure which helps to drive methane from a reservoir into the wellbore. Surface chokes and dewatering limits are conducive to controlling working fluid level (WFL) and the pressure drawdown, which can be effectively utilized to produce methane and avoid the damage caused by coal powder.
The stress variation after hydraulic fracturing is analyzed in the coalbed, and the influencing factors of gas performance are studied [3]. Afterward, the model of multi-well pressure drawdown funnel is constructed at the initial gas production stage based on radial flow theory and the superposition method. In this model, the governing factors are identified [4]. The performances of CBM wells are analyzed in Fanzhuang and Hancheng blocks with high and medium coal ranks, and perforate thickness, perforate layers, drainage technologies, stimulated measures are considered [5]. Also, the production modes and controlling factors are studied by statistical analysis of field production data [6]. Then the progressive production systems of multi-layer coalbed methane are explored [7].
The gas production mechanisms and pressure control system are researched by desorbing flow experiments [8]. The desorbed area and pressure drawdown funnel are calculated by finite element numerical methods [9]. Using multiple numerical methods, the development process of the CBM is simulated, with the main factors influencing the performance analyzed from in situ stress field, regional geological tectonic features and sedimentary environment. However, these studies above are mainly focused on CBM production data analysis, flow experiments and numerical modeling, and are also restricted to qualitative controlling strategies of performance optimization. Reservoir permeability changing at different stages is neglected, and there is a lack of more profound interpretation and information mining for the production data. Especially, quantified pressure drawdown and flow rate controlling strategies have not been well studied. Recently, the steady problems of well-test deconvolution methods are solved [10,11,12]; hence, the dynamic data of practical production can be used for well-test interpretation. Well-test is one of the main techniques used in the oil and gas industry to assess well performance and characterize reservoirs. Well-test measures the dynamic reservoir behavior in response to changing flow conditions at the well. The dynamic response of the well pressure to a change in rate is dependent on reservoir and well properties [13]. Hence, studying the dynamic pressure behavior in response to an appropriately designed sequence of well rate changes provides a way to evaluate some of these properties. This technique historically has been used for evaluation of formation permeability, large-scale reservoir heterogeneities, boundaries, reservoir connectivity and well productivity [14].
Cheng et al. (2005) [15] presented a deconvolution technique based on a fast Fourier transform algorithm. With the technique, we can deconvolve “noisy” pressure and rate data from drawdown and buildup tests dominated by wellbore storage. The wellbore-storage coefficient can be variable in the general case. In cases with no rate measurements, we use a “blind” deconvolution method to restore the pressure response free of wellbore-storage effects. Permanent downhole measurements provide “well test” data in abundance, but their behaviour often reflects the erratic environment of everyday well operations rather than the more sterile conditions typical of a traditional well test. Consequently, processing and interpretation demand an increased level of sophistication. The present effort combines a TLS approach with regularization based on a discrete wavelet transform [16]. Another robust algorithm for the pressure/rate deconvolution problem, described by Duhamel’s convolution integral, which is a first-kind linear Volterra integral equation, has been developed by Pimonov (2009) [17]. Onur and Kuchuk (2012) [18] presented a new deconvolution method that removed the dependency of the deconvolved constant rate drawdown responses on the initial reservoir pressure. It is well known that the late-time periods in particular of the deconvolved responses from the recent pressure rate deconvolution methods are dependent on the initial reservoir pressure. A small error in the initial reservoir pressure could make a significant difference in the late time periods of the deconvolved responses that can lead to an incorrect interpretation model, particularly misinterpretation of the boundaries. The method presented above is based on pressure derivative data rather than pressure data that are used in all published deconvolution algorithms [19,20,21]. Using pressure derivative data in deconvolution leads to a nonlinear least-squares objective function that is different from those used in the earlier deconvolution methods and eliminates the dependency of the deconvolved responses on the initial reservoir pressure.
As a consequence, an improved well-test deconvolution method is applied in this paper, and then the investigation radius and pressure drawdown gradient (PDG, i.e., the ratio of BHP drawdown with investigation radius) can be calculated by the reservoir parameters interpreted at every stage. Combined with production data of the Hancheng CBM block, the reasonable limits of WFL decline velocity and reservoir PDG are given.
2. The Division of Production Stages
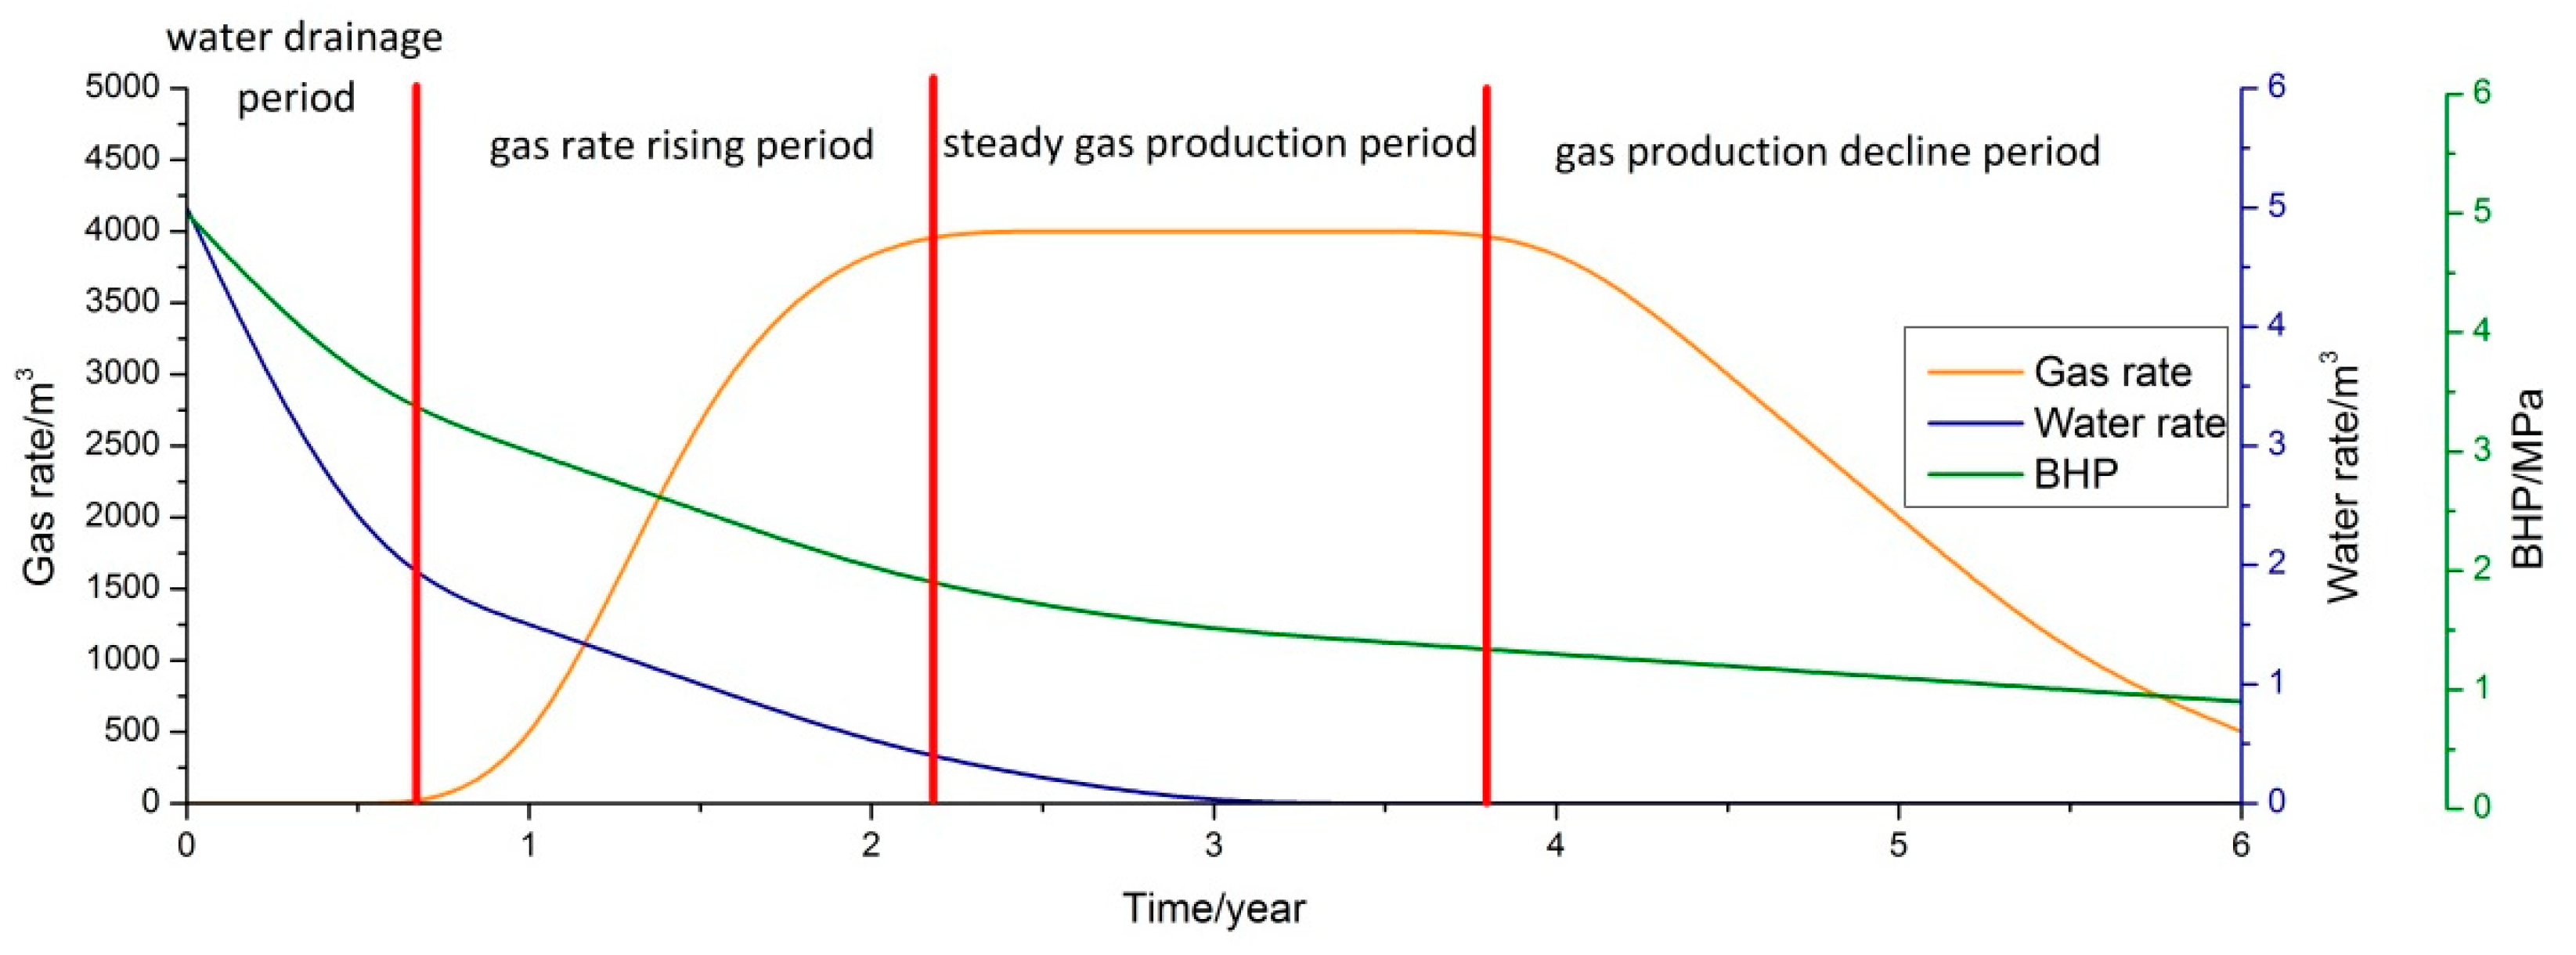
Due to the specificity of CBM, methane desorption and water drainage should be considered. Thus, the whole production process is divided into four stages: water drainage stage, gas rate rising stage, steady gas production stage and gas rate decline stage [22,23]. As shown in Figure 1, CBM wells only produce water in the initial water drainage stage for 0.5–1.5 year, with high water rate and remarkable fluctuation. Therefore, the WFL and BHP decline very quickly. When the coalbed reservoir pressure around one CBM well falls to the critical desorption pressure, it means the process enters the gas rate rising stage. CBM wells begin to produce gas, during which the gas rate may increase first and then decline; the drawdown of WFL and BHP becomes slower than the initial stage; the gas/water rates show a steady trend at the end of this stage. Then it comes to the steady gas production stage, in which the water rate becomes very low, and the WFL and BHP keep steady or have little drawdown sometimes. If the pressure drawdown funnel and desorption area develop to a large enough extent, it will lead to a long time stabilized production. When the gas rate declines continuously, the production turns into the decline stage, in which the pressure drawdown funnel and desorption area do not enlarge anymore.
3. Deconvolution of Well-Test for CBM Wells
The water rate cannot keep constant during the whole process of the well-test. Therefore, for the well-test data, the measured BHP corresponds to the variable production rate during the whole time. However, it is well known that the reservoir models for the well-test analysis commonly have the inner boundary conditions with a constant water/gas rate. To conquer the inconsistency, in reality, a pressure build-up testing at the well shut-in stage has been widely applied in reservoir engineering. Nevertheless, the investigation radius is short just for the shut-in stage although the well-test interpretation for the pressure buildup data can help to offer reliable results due to the less production rate measurement uncertainties. To make use of the well-test data corresponding to the variable production rate at the whole production time, the deconvolution well-test is introduced by researchers. Wellbore pressure transient response under constant unit water/gas rate can be given by deconvolution, and there will be less error caused by incomplete production data. So this paper proposes the well-test deconvolution method for CBM wells, and the investigation radius can be calculated by the comprehensive permeability inverted.
3.1. Improvement of Deconvolution Algorithm
Assuming that the coalbed is incompressible, and the porosity, permeability and formation compressibility do not change over time; the coalbed is horizontal and isothermal with equal thickness, and there does not exist gas-water two-phase quality exchange. The effects of gravity and capillary force are ignorable. According to the pressure and production data of CBM wells, the original pressure can be regarded as convolution, and the rate is a function to construct the convolution equation, as shown in Equation (1). The other function in this convolution equation can be obtained by deconvolution, and then the well-test interpretation diagnosis curve (pressure and its derivation double logarithmic curve) can be given.
where p is the wellbore pressure corresponding to variable production rate, t is the time, q is the variable production rate, τ is a variable for the integral, u is the convolution pressure mark.
Previous deconvolution algorithms based on B-splines are much easier to be understood and programmed for academic researchers and engineers. However, due to the use of a linear regularization, their stability is weaker than that of the commonly used von Schroeter et al.’s deconvolution algorithm [11,12] in which a nonlinear regularization is used; the linear regularization can make the deconvolution algorithms less tolerant to data errors. Good stability for the deconvolution algorithms is very important in order to make deconvolution a viable tool for well-test analysis. To improve the stability of the deconvolution algorithms based on B-splines, a nonlinear regularization by minimizing the curvature of pressure derivative response, as used in von Schroeter et al.’s algorithm [11,12], is appended instead of the linear regularization [24]. A spline function can be represented by the linear combination of B-spline functions. If the knots are set, the generation of B-splines is easy due to their intrinsic recurrence relation. The knots are distributed logarithmically, as follows [25]:
where b is the base; ti is the knot; i is the index for the knots. In order to display the characteristic reservoir behavior, the number of knots should be in the order of at least 2–6 knots per log cycle, as Ilk et al.
Higher degree B-splines are generated recursively, as follows [24]:
where k = 1, 2, … is the order of the B-spline.
For fixed unit productivity, the derivative of the wellbore pressure function corresponds , it can also be regarded as a weighted summation of 2-order B-splines:
where ci is the undetermined weight coefficient; u is the number of undetermined coefficients.
The objective is to determine the values of ci by using the measured wellbore pressure and corresponding production rate data.
Substituting Equation (5) into Equation (1) we have:
By using the measured wellbore pressure and variable production rate data for the deconvolution, from Equation (6), we can obtain the over-determined linear system as follows [25]:
where X is the mn × u sensitivity matrix; C is the u-vector of undetermined coefficients ci; and ΔP is the mn-vector of measured wellbore pressure drop pini-pjk; The elements of the sensitivity matrix are as follows:
As in Ilk et al.’s deconvolution algorithm [25], for the over-determined linear system, the following two conditions are appended for each spline interval:
Then the over-determined linear system which incorporates the appended regularization can be written as follows:
where Xr is the kn × u matrix; kn = 2. The linear systems of Equations (11) and (12) can be solved together by the least square method [26] to determine the value of C. Eventually, according to Equation (5), the derivative of wellbore pressure corresponding to the constant unit production rate can be reconstructed. The log-log typical curves for well-test also need the wellbore pressure pu, which can be deduced by the integration of both sides of Equation (5), as follows:
When the value of C is determined, the transient wellbore pressure pu and derivative of wellbore pressure can be obtained by Equations (5) and (13), respectively; the data of transient wellbore pressure pu and its derivative corresponding to the constant unit production rate can be output for well-test analysis.
3.2. Well-Test Analysis System
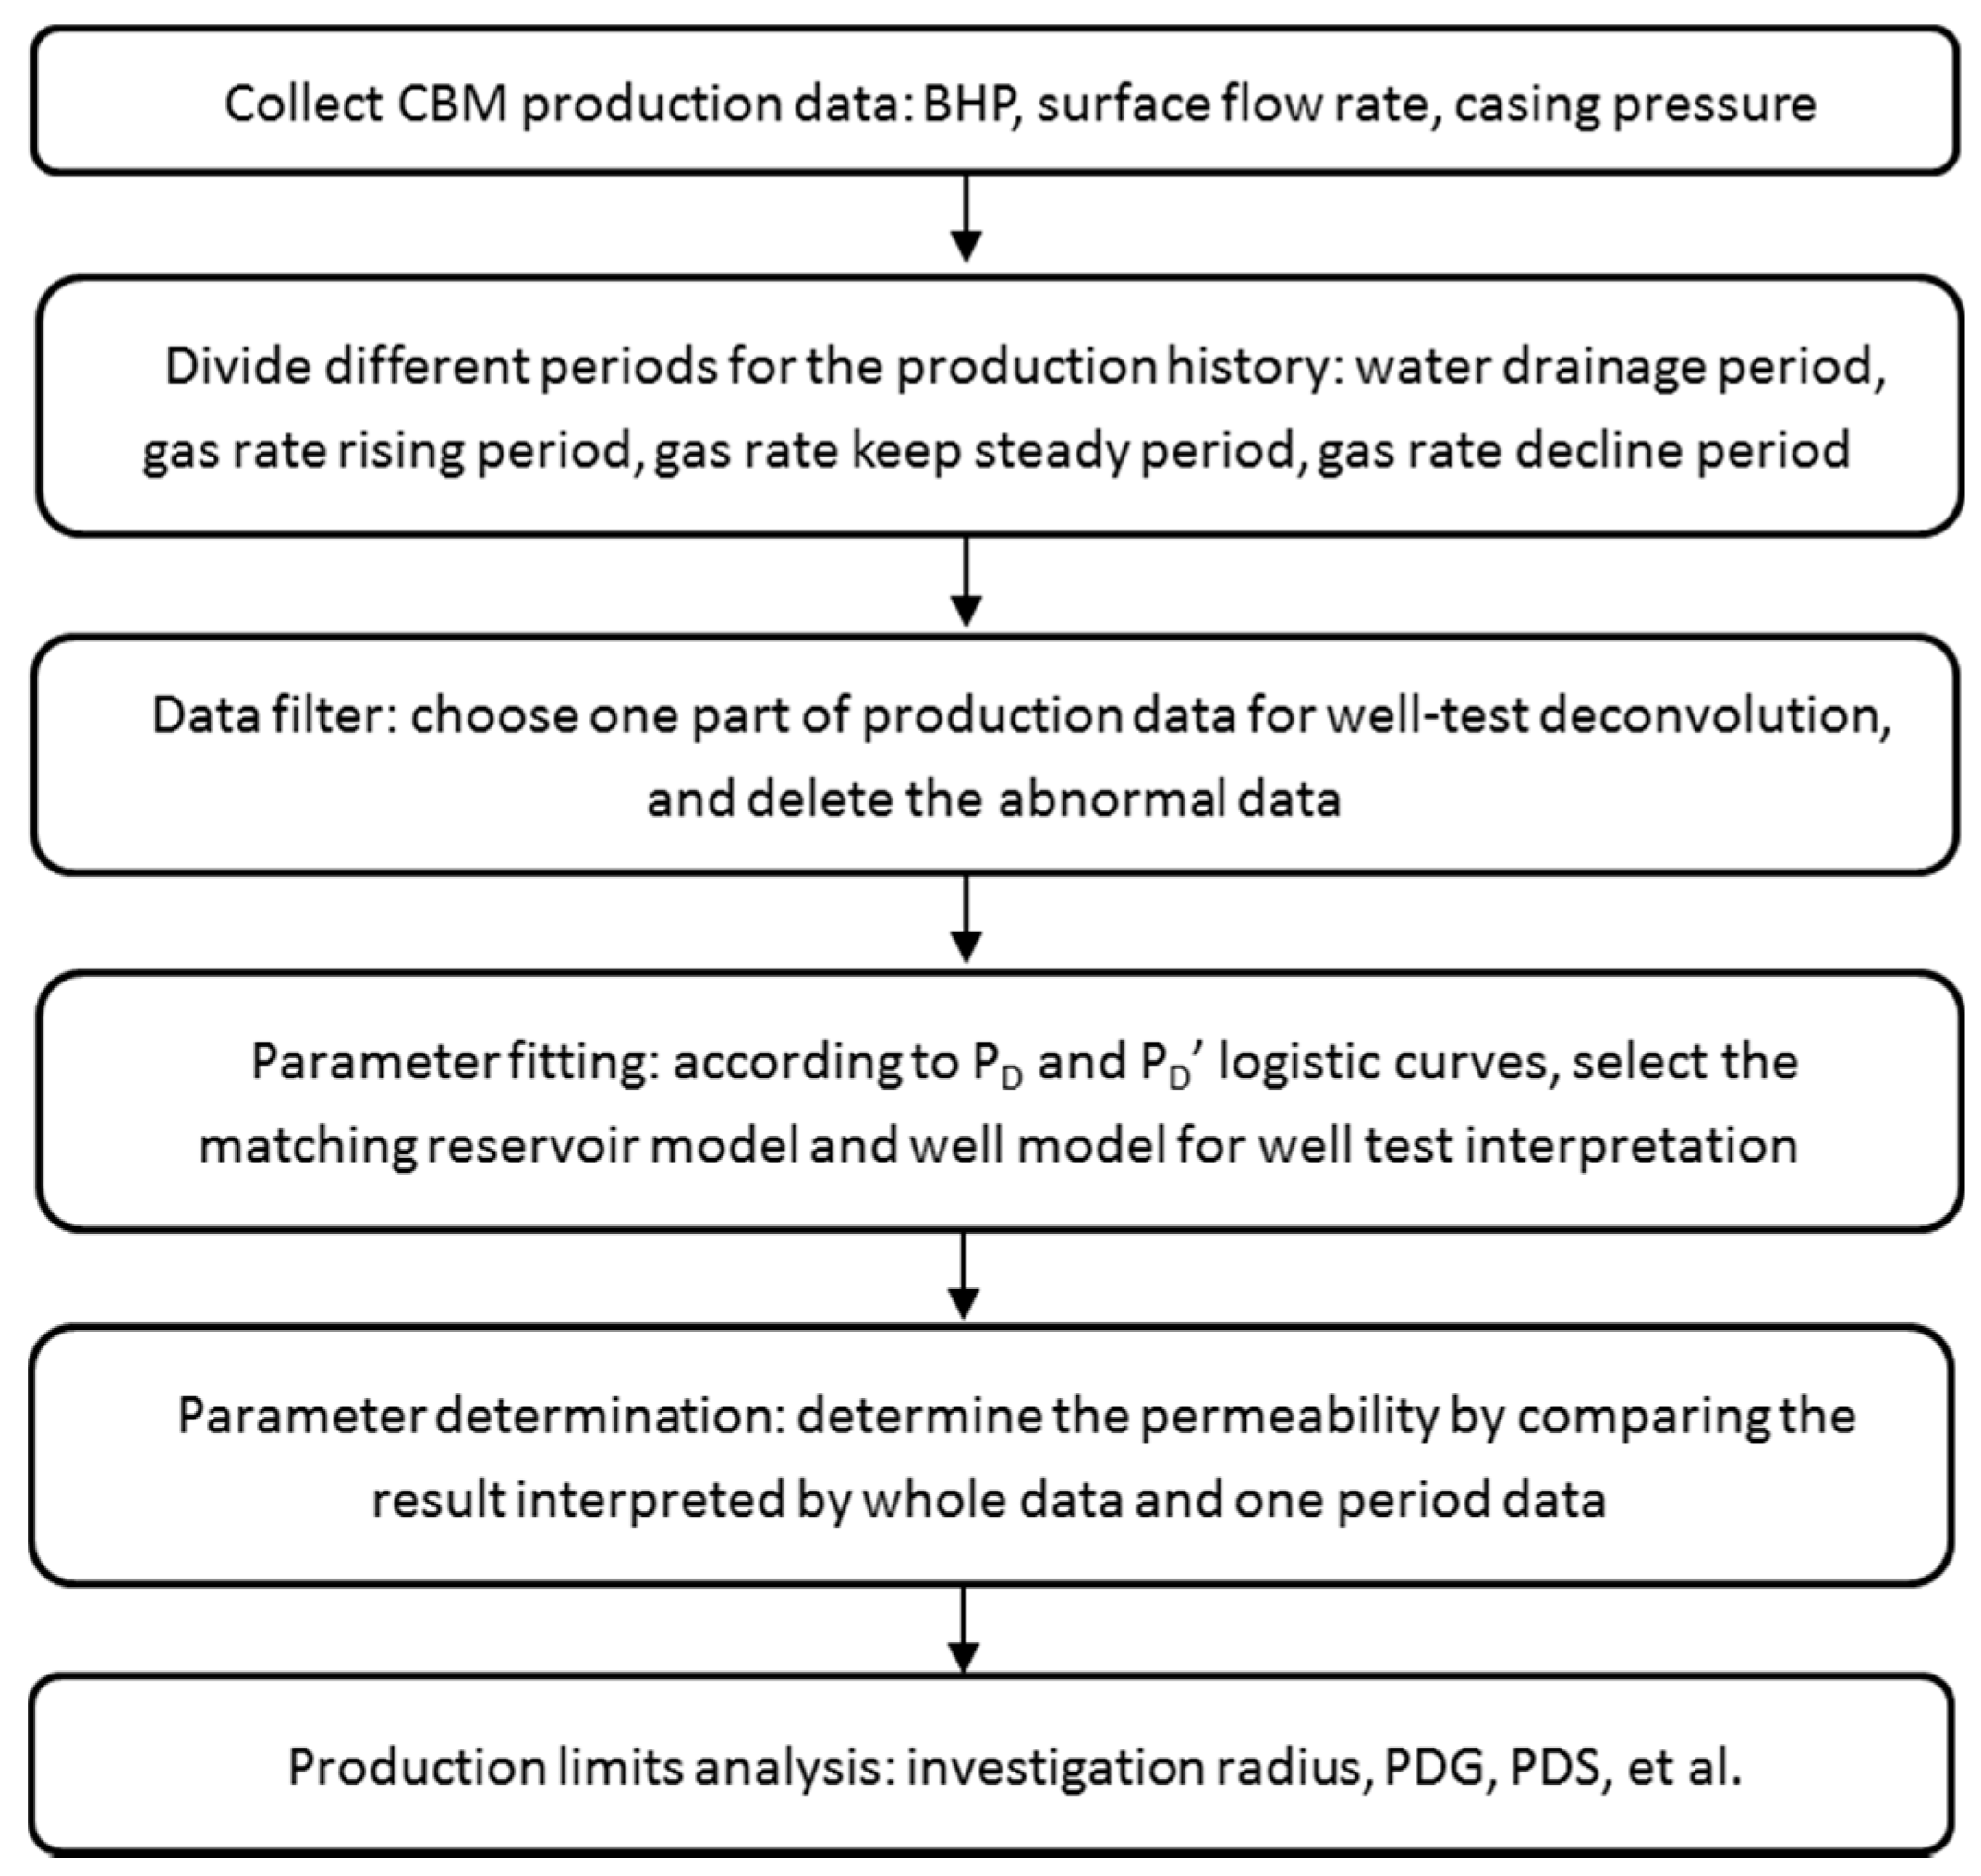
The flow in the coalbed reservoir is quite different at different production stages. The water drainage stage is single water phase flow stage. The gas production increasing stage is gas and water two phase flow stage. The water phase permeability interpreted could be used to calculate the comprehensive permeability under average water saturation. When the CBM well produces gas steadily, this stage could be regarded as single-phase gas flow stage. The well-test interpretation and analysis contain these steps as shown in Figure 2. (A) Data collecting: We should collect and analyze the production data (BHP, surface gas/water flow rate) needed by well-test deconvolution. (B) The division of production stages: water drainage stage, gas rate rising stage, steady gas production stage, gas production decline stage. (C) Data filter: One part of production data is chosen for well-test deconvolution. The criteria used for data filtering is shown as follows: (1) The monitored BHP data should be greater than 0.1 atm; (2) when the production rate does not change significantly, the daily BHP relative change should be less than 50% compared with the adjacent daily BHP. On one side the whole reorganized production data can be used for deconvolution, and on the other side we can select shorter stage data with pressure drop or build-up according to the production data. (D) Parameter fitting: According to the pressure and its derivative logistic curves, the matching reservoir model and well model are selected for well-test interpretation. (E) Parameter determination: The permeability is determined by comparing the results interpreted with whole data and part data, and the adjoining well and reservoir geological characteristic are considered. (F) Performance optimization (production limits analysis): Some parameters corresponding to performance optimization are calculated and analyzed, such as investigation radius represented the pressure drop funnel range, and pressure drawdown speed (PDS) and PDG.
The investigation radius can be calculated by Equation (14) [27].
where r is investigation radius, K is the permeability, Δt is the duration time of each stage, Ct is the comprehensive compressive parameter, ϕ is porosity, and u is the average fluid viscosity.
In order to analyze the pressure drop status around the well, PDG is used to represent the pressure drop in the unit distance. If the PDG is quite high, that means the wellbore pressure drop is so quick that the investigation radius is also quite short, and the reservoir area influenced by pressure drop is also minimal, it is not helpful to get excellent performance.
In coal-bed methane (CBM) reservoirs, gas is mainly stored in a matrix as the adsorbed gas and the cleats are commonly saturated with water. To produce the adsorbed gas, the cleat pressure should be reduced to critical desorption pressure by dewatering first. But how to dewater more efficiently is a difficult issue. Apparently a low dewatering rate is uneconomical due to the excessive development times required. But from the field experiences, a high dewatering rate will bring more problems such as coal break, stress sensitivity and two-phase flow in earliest stage, which will reduce the productivity, or sometimes make the well abandoned. Literatures have studied much about the effect of coal break and stress sensitivity [28,29]. However, there is no discussion about the relationship between gas performance and dewatering rate.
High dewatering rate is companied with high pressure drawdown which will cause gas desorption near wellbore area and simultaneously cause two-phase flow. Two-phase flow has a significant negative effect on pressure propagation, which controls the investigation distance or drainage area in the early stage, and therefore affects the overall productivity. Since the purpose of dewatering is to maximize the drainage area and maximize the depressurization for whole reservoir, the dewatering rate should be controlled to ensure well-bottom hole flowing pressure (BHFP) is larger than critical desorption pressure in order to avoid the occurrence of two-phase flow in the dewatering stage [30].
3.3. Method Validation
Taking H3-1 and H3-2 two wells in Hancheng field as examples, H3-1 used a permanent down-hole pressure gauge (DPG) to measure the real-time BHP; because of frequent well shut-down in the night, there are multiple periodic pressure drop and build-up process presented in the BHP test data. For economic reasons, there is no permanent DPG installed in the bottom hole during the earlier dewatering stage of H3-2 well. Some months later, a memory DPG is installed in the bottom hole to measure the transient pressure build-up during well shut-in. As is well-known, conventional well-test normally contains a pressure drop well-test and pressure build-up well-test. To verify the improved deconvolution algorithm, we compared interpretation results between the conventional well-test (i.e., the pressure drop of H3-1 and pressure build-up of H3-2) and the deconvolution well-test presented (i.e., process the daily BHP of H3-1 and H3-2 by the improvement of deconvolution algorithm), both of these two kinds of well-test data are interpreted by the vertical well and water flow model in Saphir 4.50.
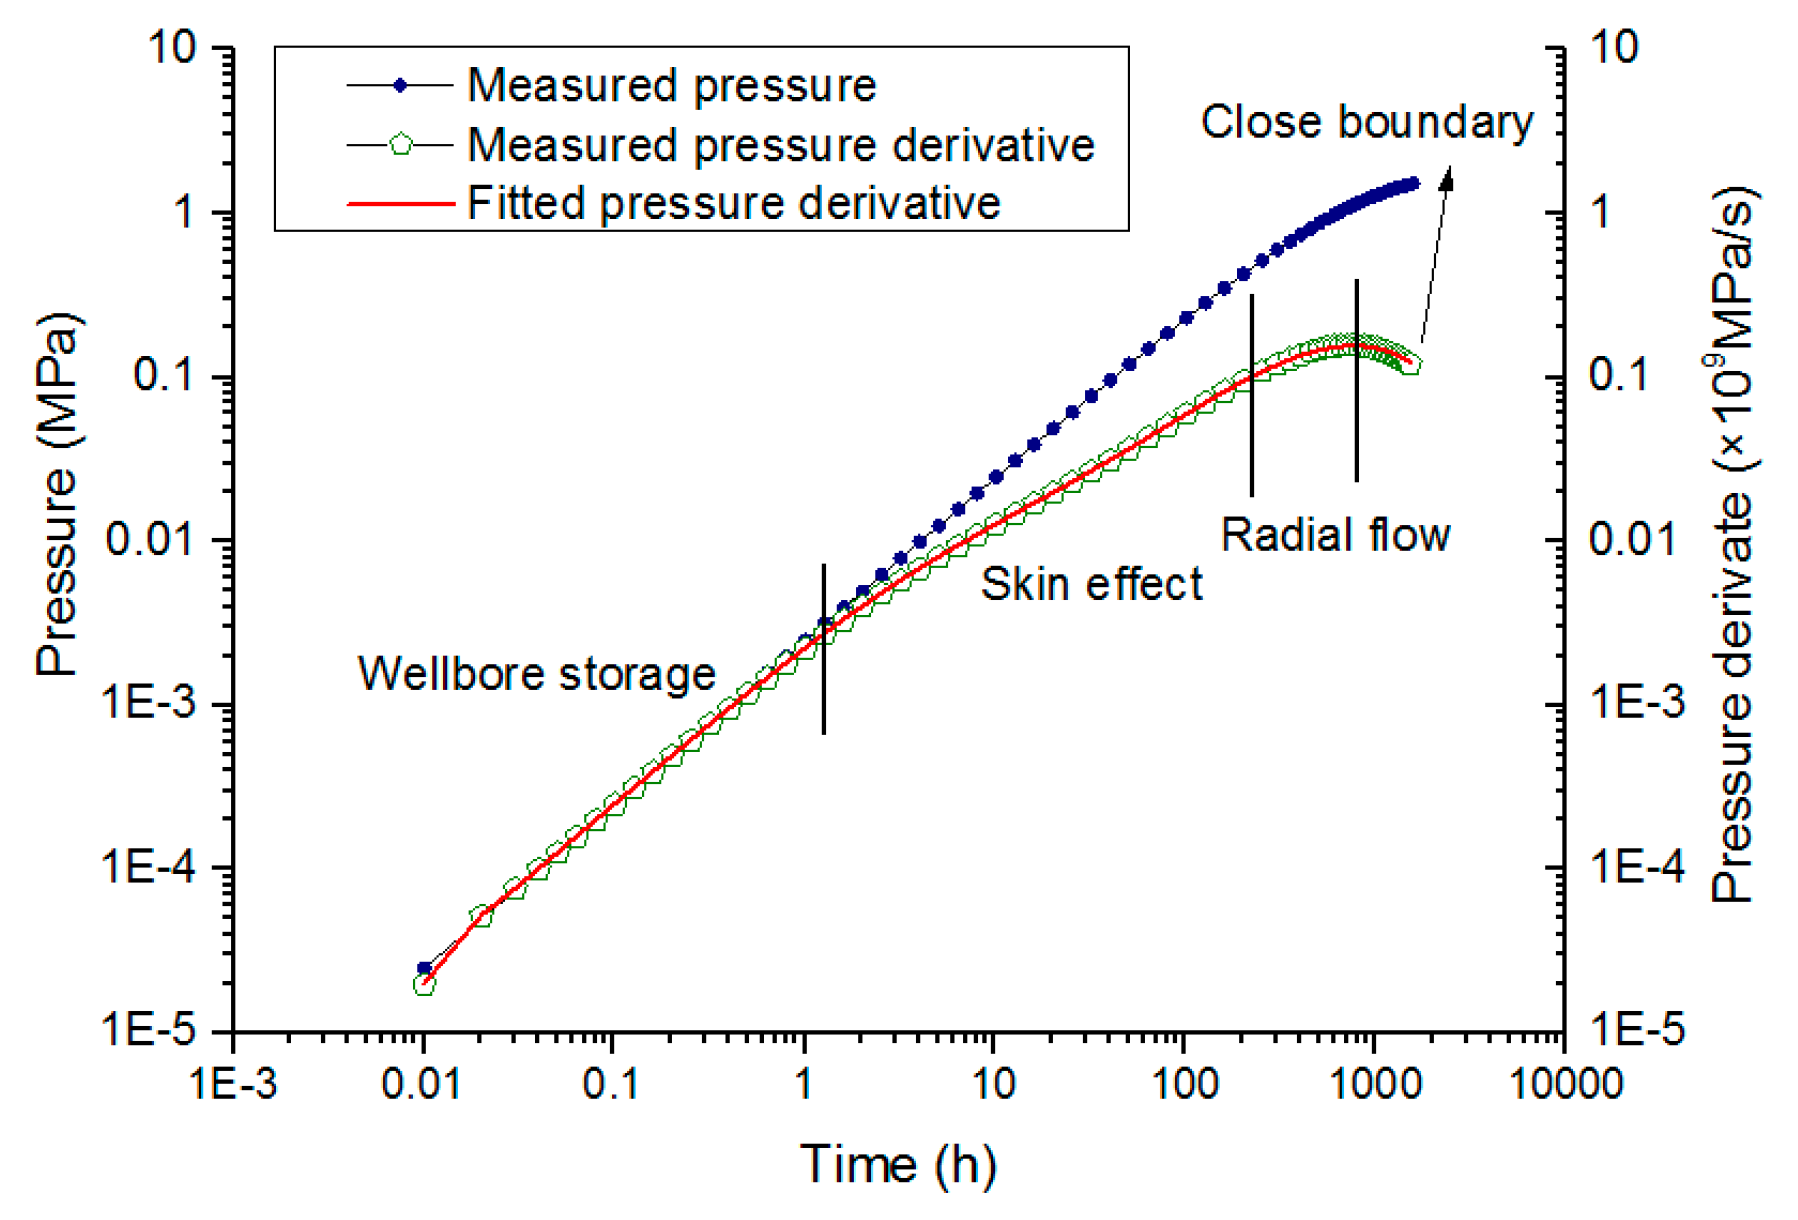
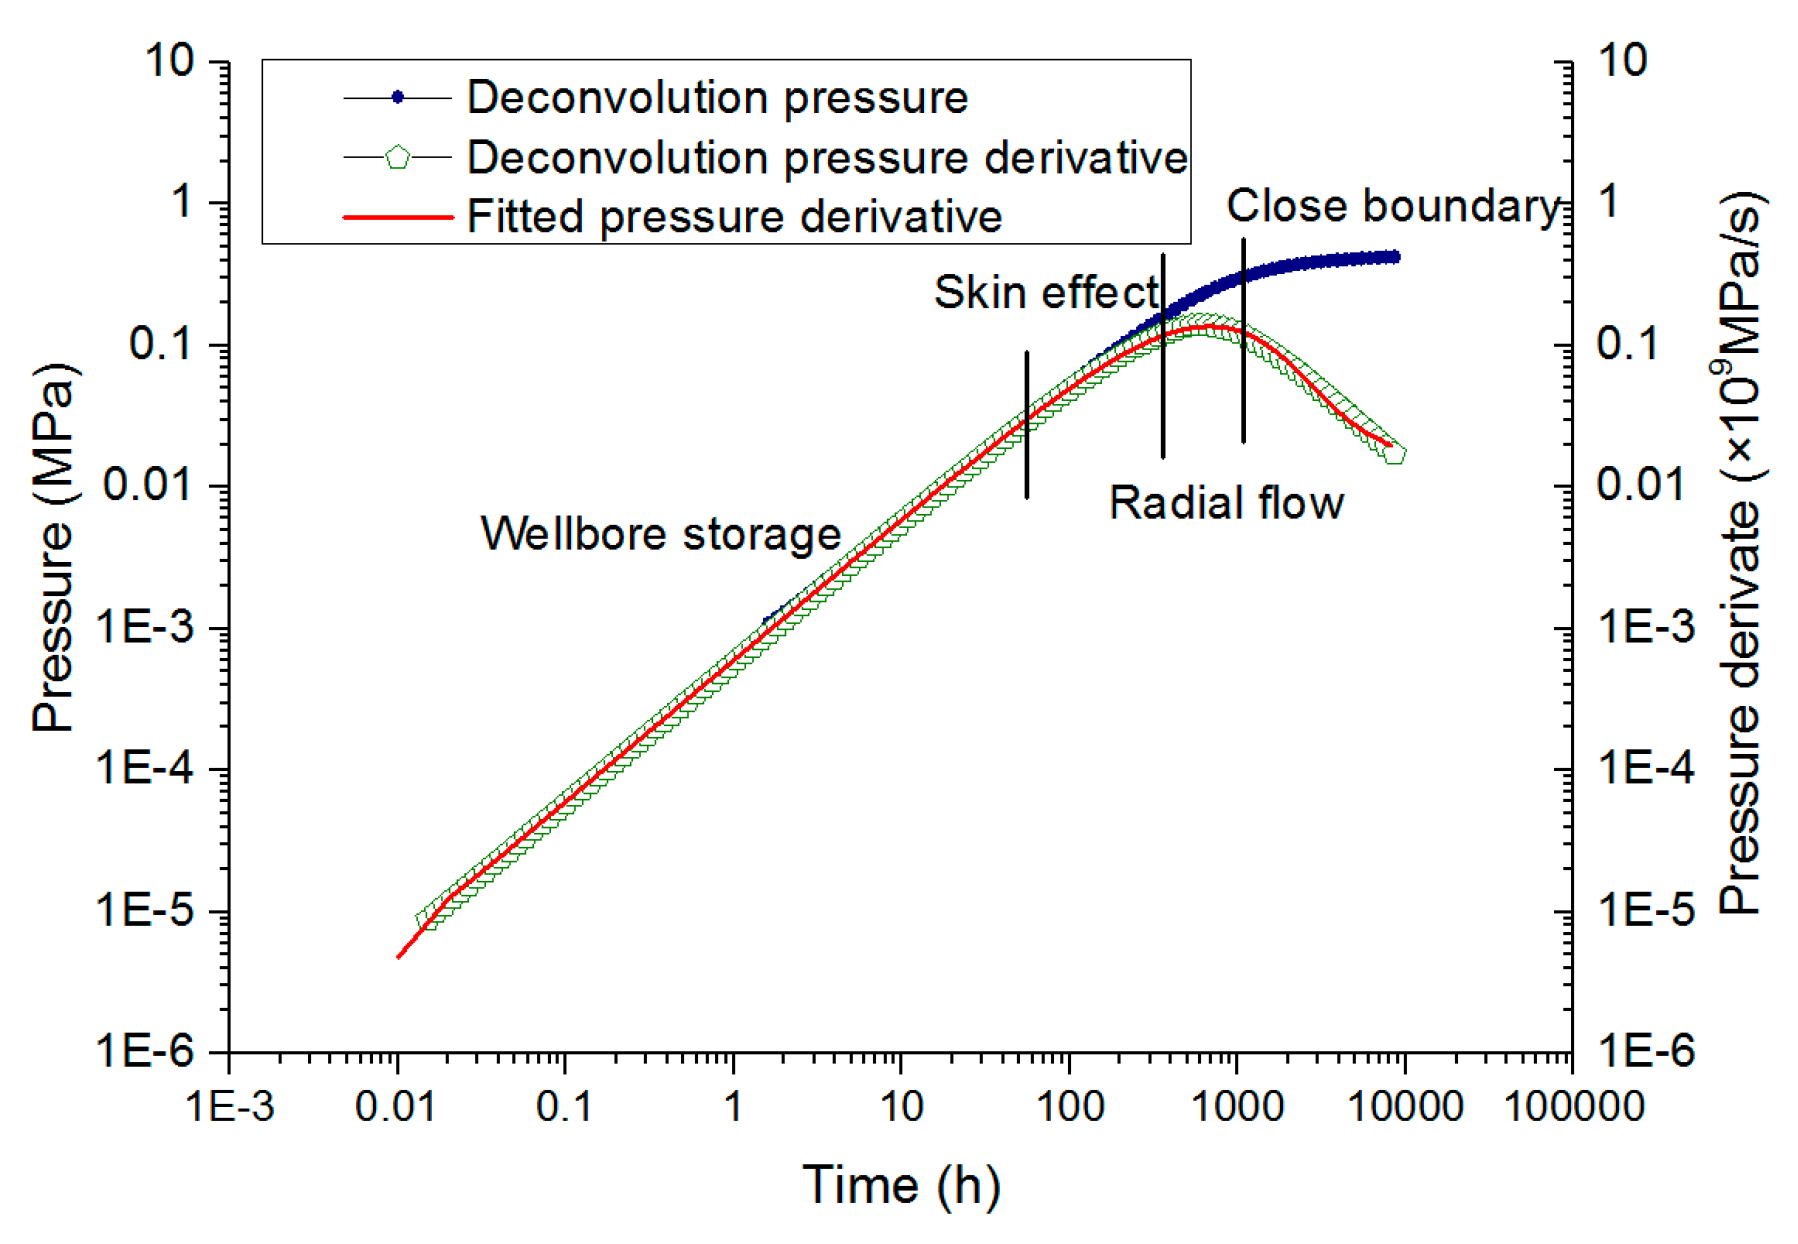
Firstly, one standard segment of H3-1 pressure drop data is chosen for conventional well-test interpretation. The pressure and its derivate double logarithmic curves, and the fitted pressure derivate curve interpreted by water flow model are shown in Figure 3. Then, H3-1 multi-segment pressure build-up data collected in the night is used for deconvolution well-test interpretation. The pressure and its derivate processed by the improvement of the deconvolution algorithm, and the fitted pressure derivate interpreted by water flow model, are shown in Figure 4. Finally, we compared the results obtained by the deconvolution well-test and conventional well-test methods, and the relative errors of different parameter are shown in Table 1.
For H3-2, the measured pressure build-up of H3-2 by DPG is interpreted by conventional well-test methods. The pressure and its derivate, and the fitted pressure derivate interpreted by water flow model are shown in Figure 5. Afterward, daily water production rate and BHP data of H3-2 well are used for deconvolution well-test interpretation. The pressure and its derivate, and the fitted pressure derivate interpreted by water flow model are shown in Figure 6. Finally, we compared the results obtained by the deconvolution well-test and conventional well-test methods, and the relative errors of different parameter are shown in Table 1. Generally, these two cases prove that the deconvolution well-test given in this paper is adaptable for CBM wells.
The real-time BHP of H3-1 is measured by the permanent DPG, so the precise pressure drop data can be used for well-test interpretation directly, while the pressure build-up data can be processed by deconvolution algorithm for well-test interpretation. The relative errors between the pressure drop well-test and deconvolution well-test are shown in the Table 1, and relative errors of the initial pressure (0%), permeability (1.0%), investigation radius (1.1%) are quite small. The daily BHP of H3-2 is calculated through the dynamic fluid level in the wellbore, because of no permanent DPG installed in the bottom hole. Moreover, the daily BHP data of H3-2 is processed by a deconvolution algorithm, and the deconvolution well-test interpretation result is similar with the pressure build-up test result, the relative errors of the initial pressure (0.2%) and permeability (1.1%) are quite small, but its investigation radius is much longer than pressure build-up well-test, as shown in Table 1. Hence, the permeability and initial reservoir pressure can be interpreted by deconvolution well-test, which provides a way to analyze dewatering and gas performance.
4. Field Application—A Case of Hancheng Block
The Hancheng CBM field in Ordos basin main contains late Paleozoic Carboniferous-Permian coal bed, production layers are the Nos. 3, 5, 11 three coal layers, the buried depth is 400–1000 m, a single layer thickness is 1.5–10 m, formation pressure coefficient is 0.6–0.8, the gas content is 3.51–14.13 m3/t. Its main characteristic is low pressure, low permeability and high gas content. Up to September 2017, more than 800 CBM Wells were put into production in the field, and these wells mainly underwent the water drainage stage and gas rate rising stage, some wells have entered steady gas production stage. The production characteristics are high water rate, long dewatering stage, and the stable production stage is quite long [6]. Twenty-nine vertical CBM Wells were selected to analyze the production limits in Hancheng CBM field. Based on the single well production stages division and reorganization of production data, the comprehensive permeability of dewatering stage was deduced by deconvolution well-test, and then investigation radius and PDG were calculated for every stage. Finally, the reasonable production limits were determined by statistical analysis.
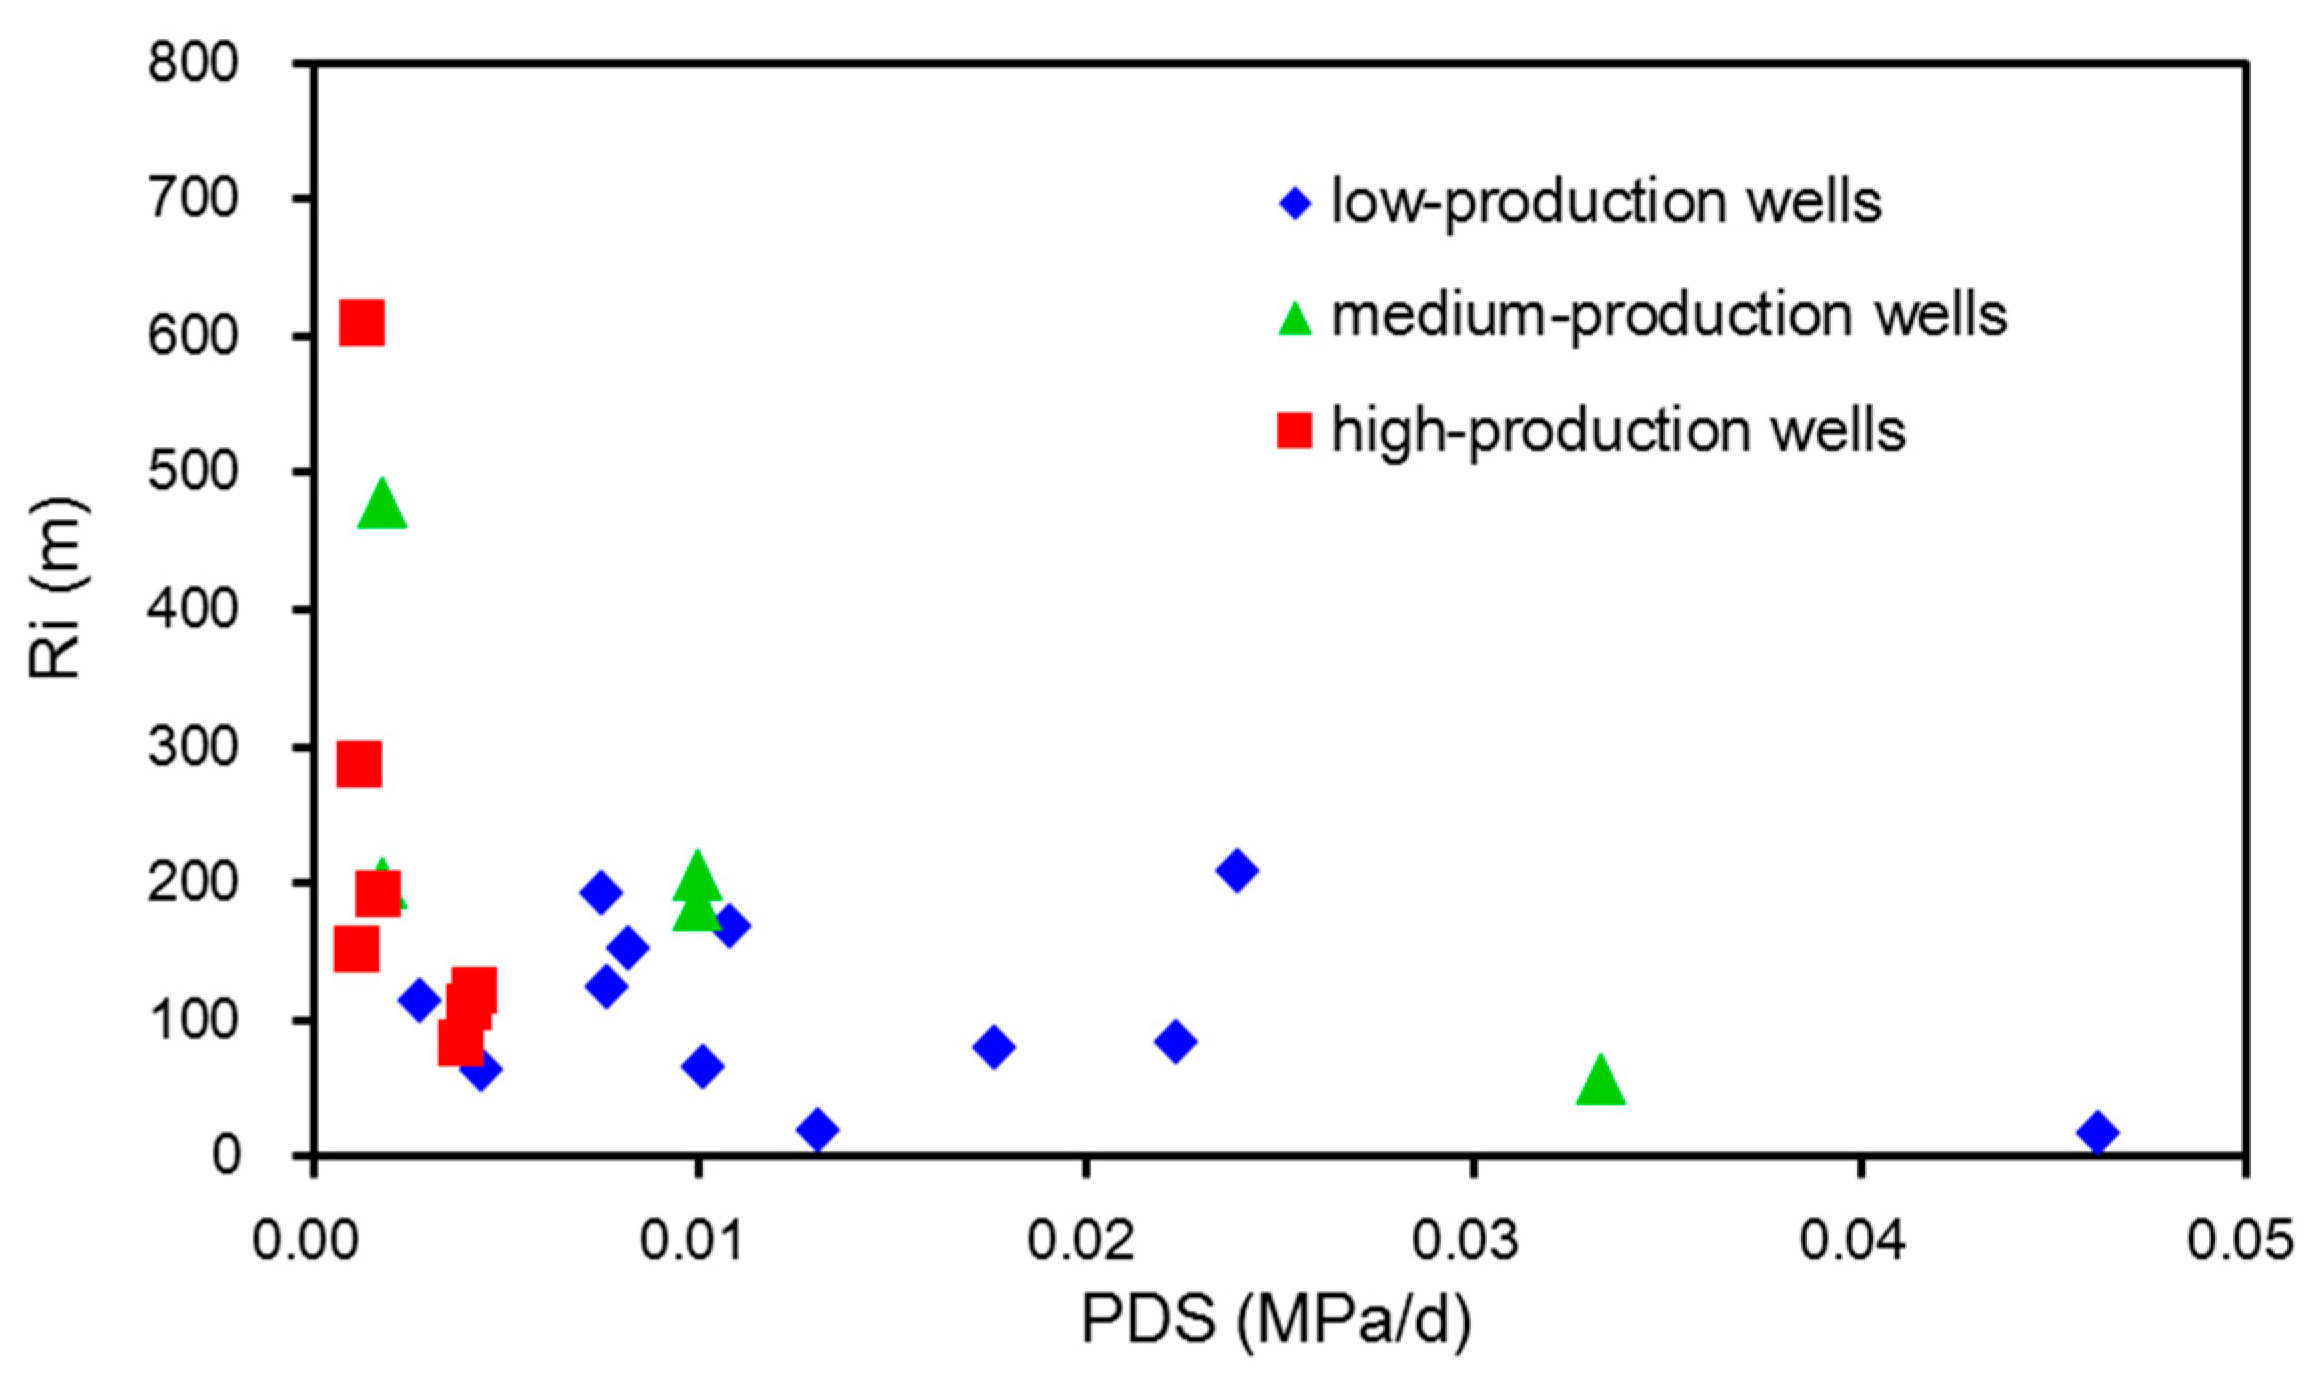
The comprehensive permeability interpreted by deconvolution of well-test in the water drainage stage can reflect the coalbed permeating flow in the early stage. As shown in Figure 7, the steady gas rate gradually decreases with the PDS increasing in the later stage. The average pressure drop velocity of high production wells is 0.002 MPa/d, average PDS of middle production wells is 0.01 MPa/d, average PDS of low production wells is 0.017 MPa/d. Therefore, in order to help the well achieve better performance, the PVD should be controlled under 0.01 MPa/d in the first stage. That also means the WFL drop should be less than 1 m/d. As shown in Figure 8, investigation radius decreases gradually with the increasing of PDS in the water drainage stage. When PDS is less than 0.01 MPa/d, the investigation radius will be longer than 100 m; it provides advantages for forming larger desorbing area.
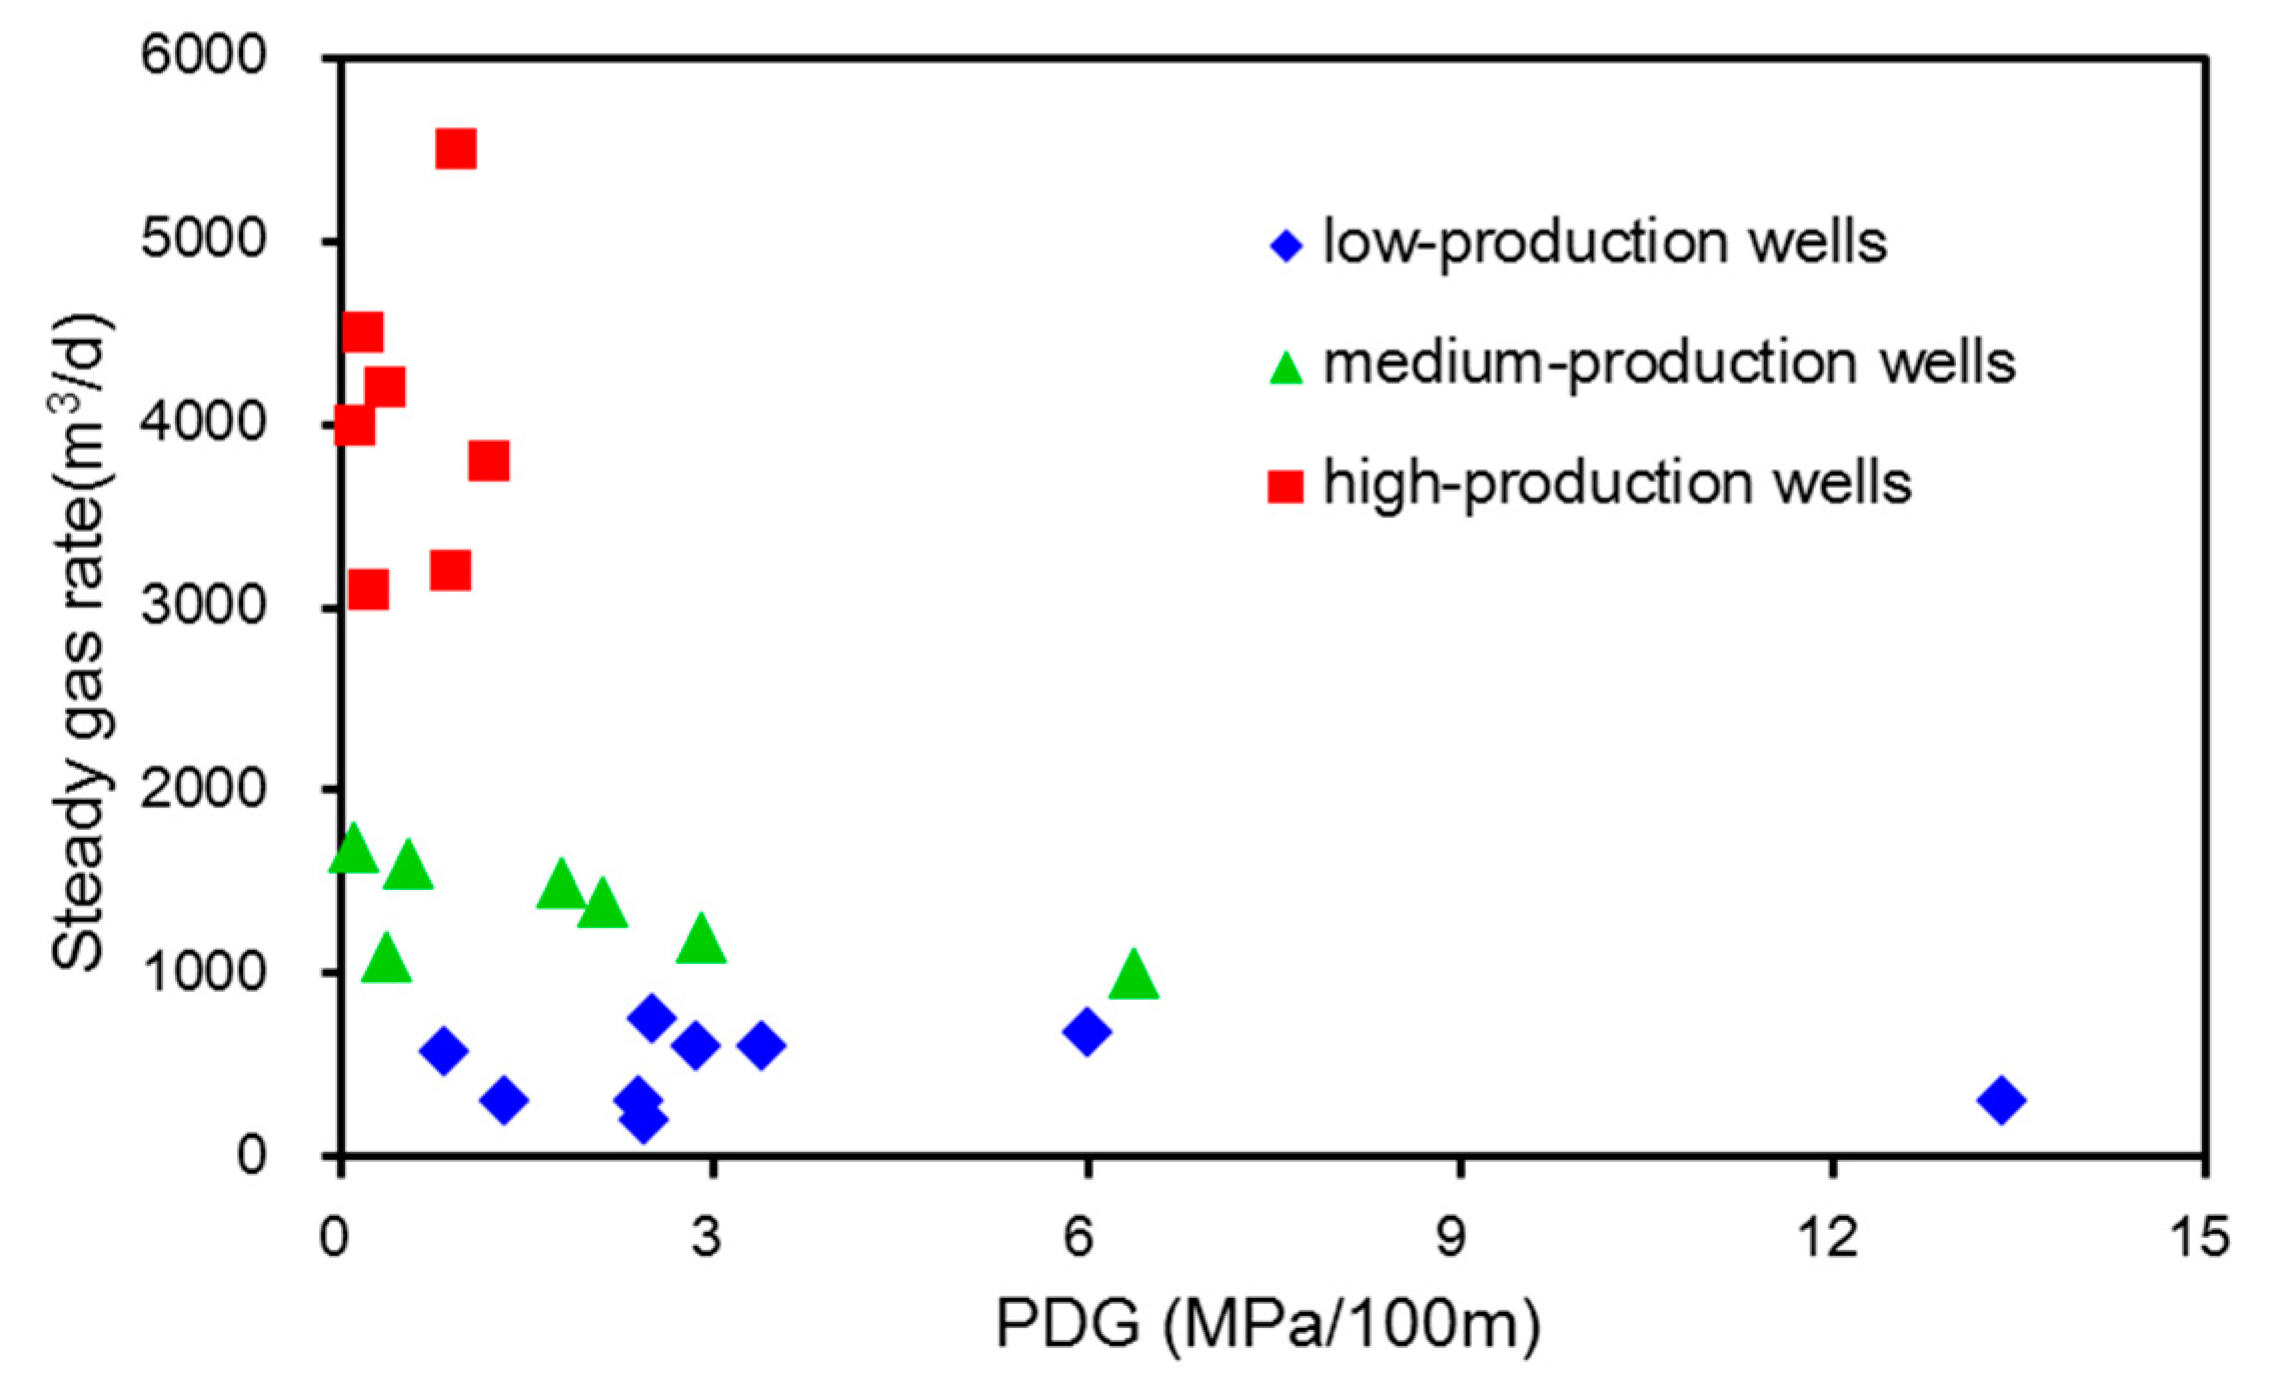
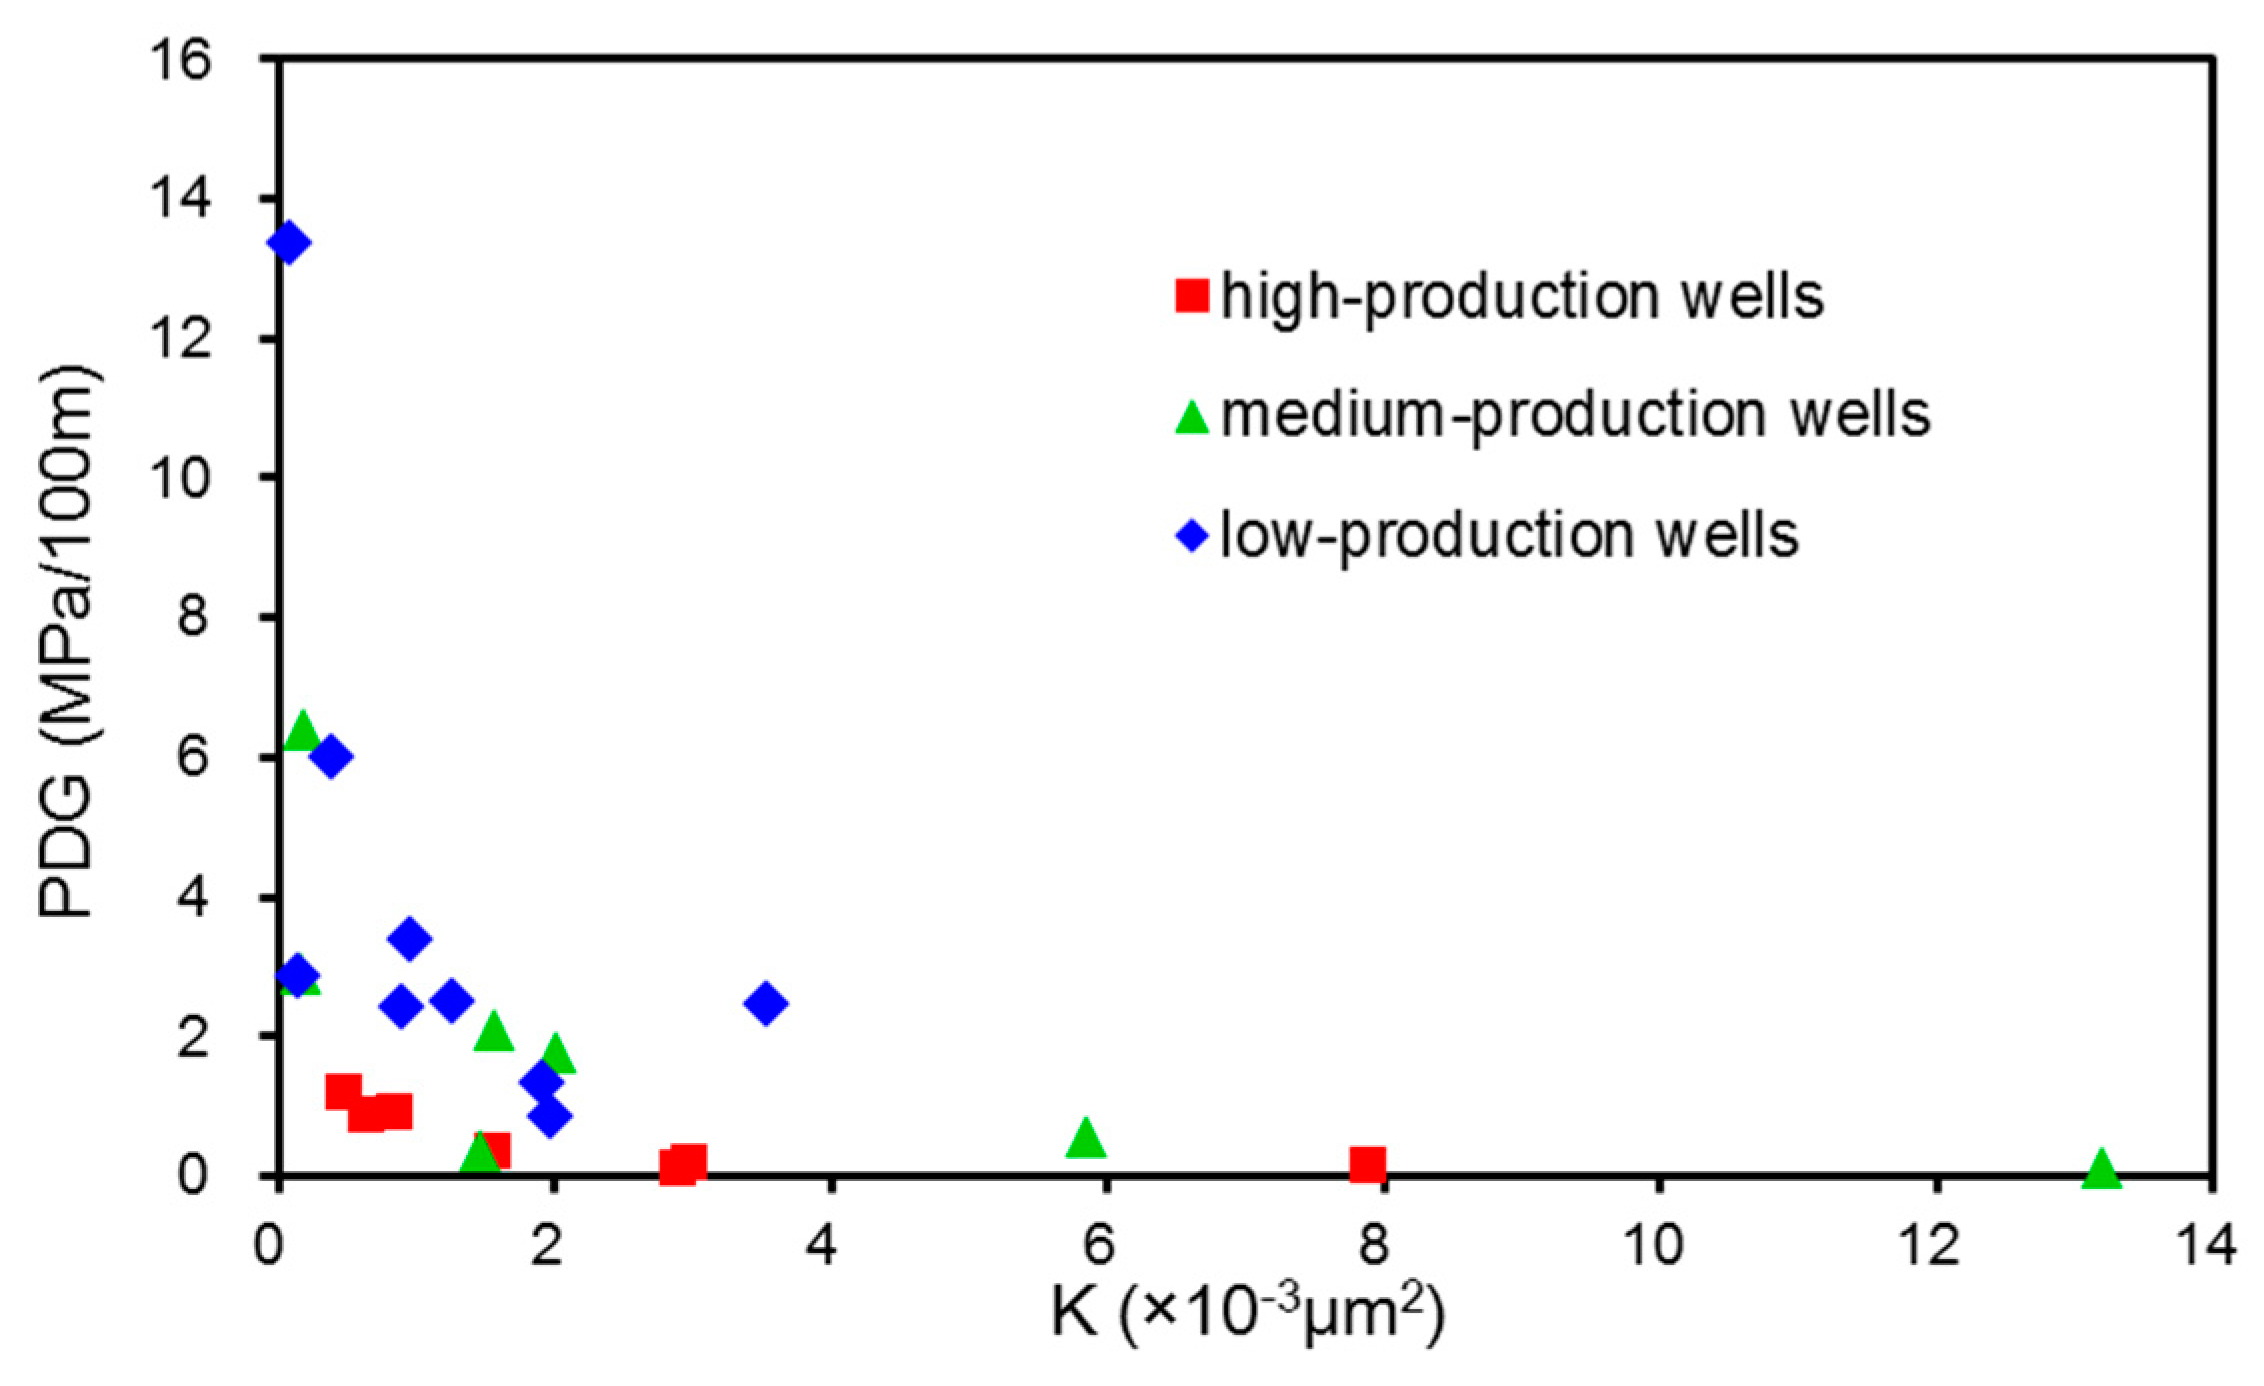
As shown in Figure 9, the steady gas production rate decreases in the later stages with the PDG increasing in the water drainage stage. When the PDG is less than 2.8 MPa/100 m, the steady gas rate will be higher than 1000 m3/d. When the PDG is less than 0.3 MPa/100 m, the steady gas rate will be higher than 3000 m3/d. As shown in Figure 10, the PDG is influenced by the permeability obviously, and the investigation radius become longer with the increase of permeability, so the PDG decreases sharply. When the permeability is higher than 0.5 × 10⁻³ μm2, the PDG can be smaller than 2.8 MPa/100 m.
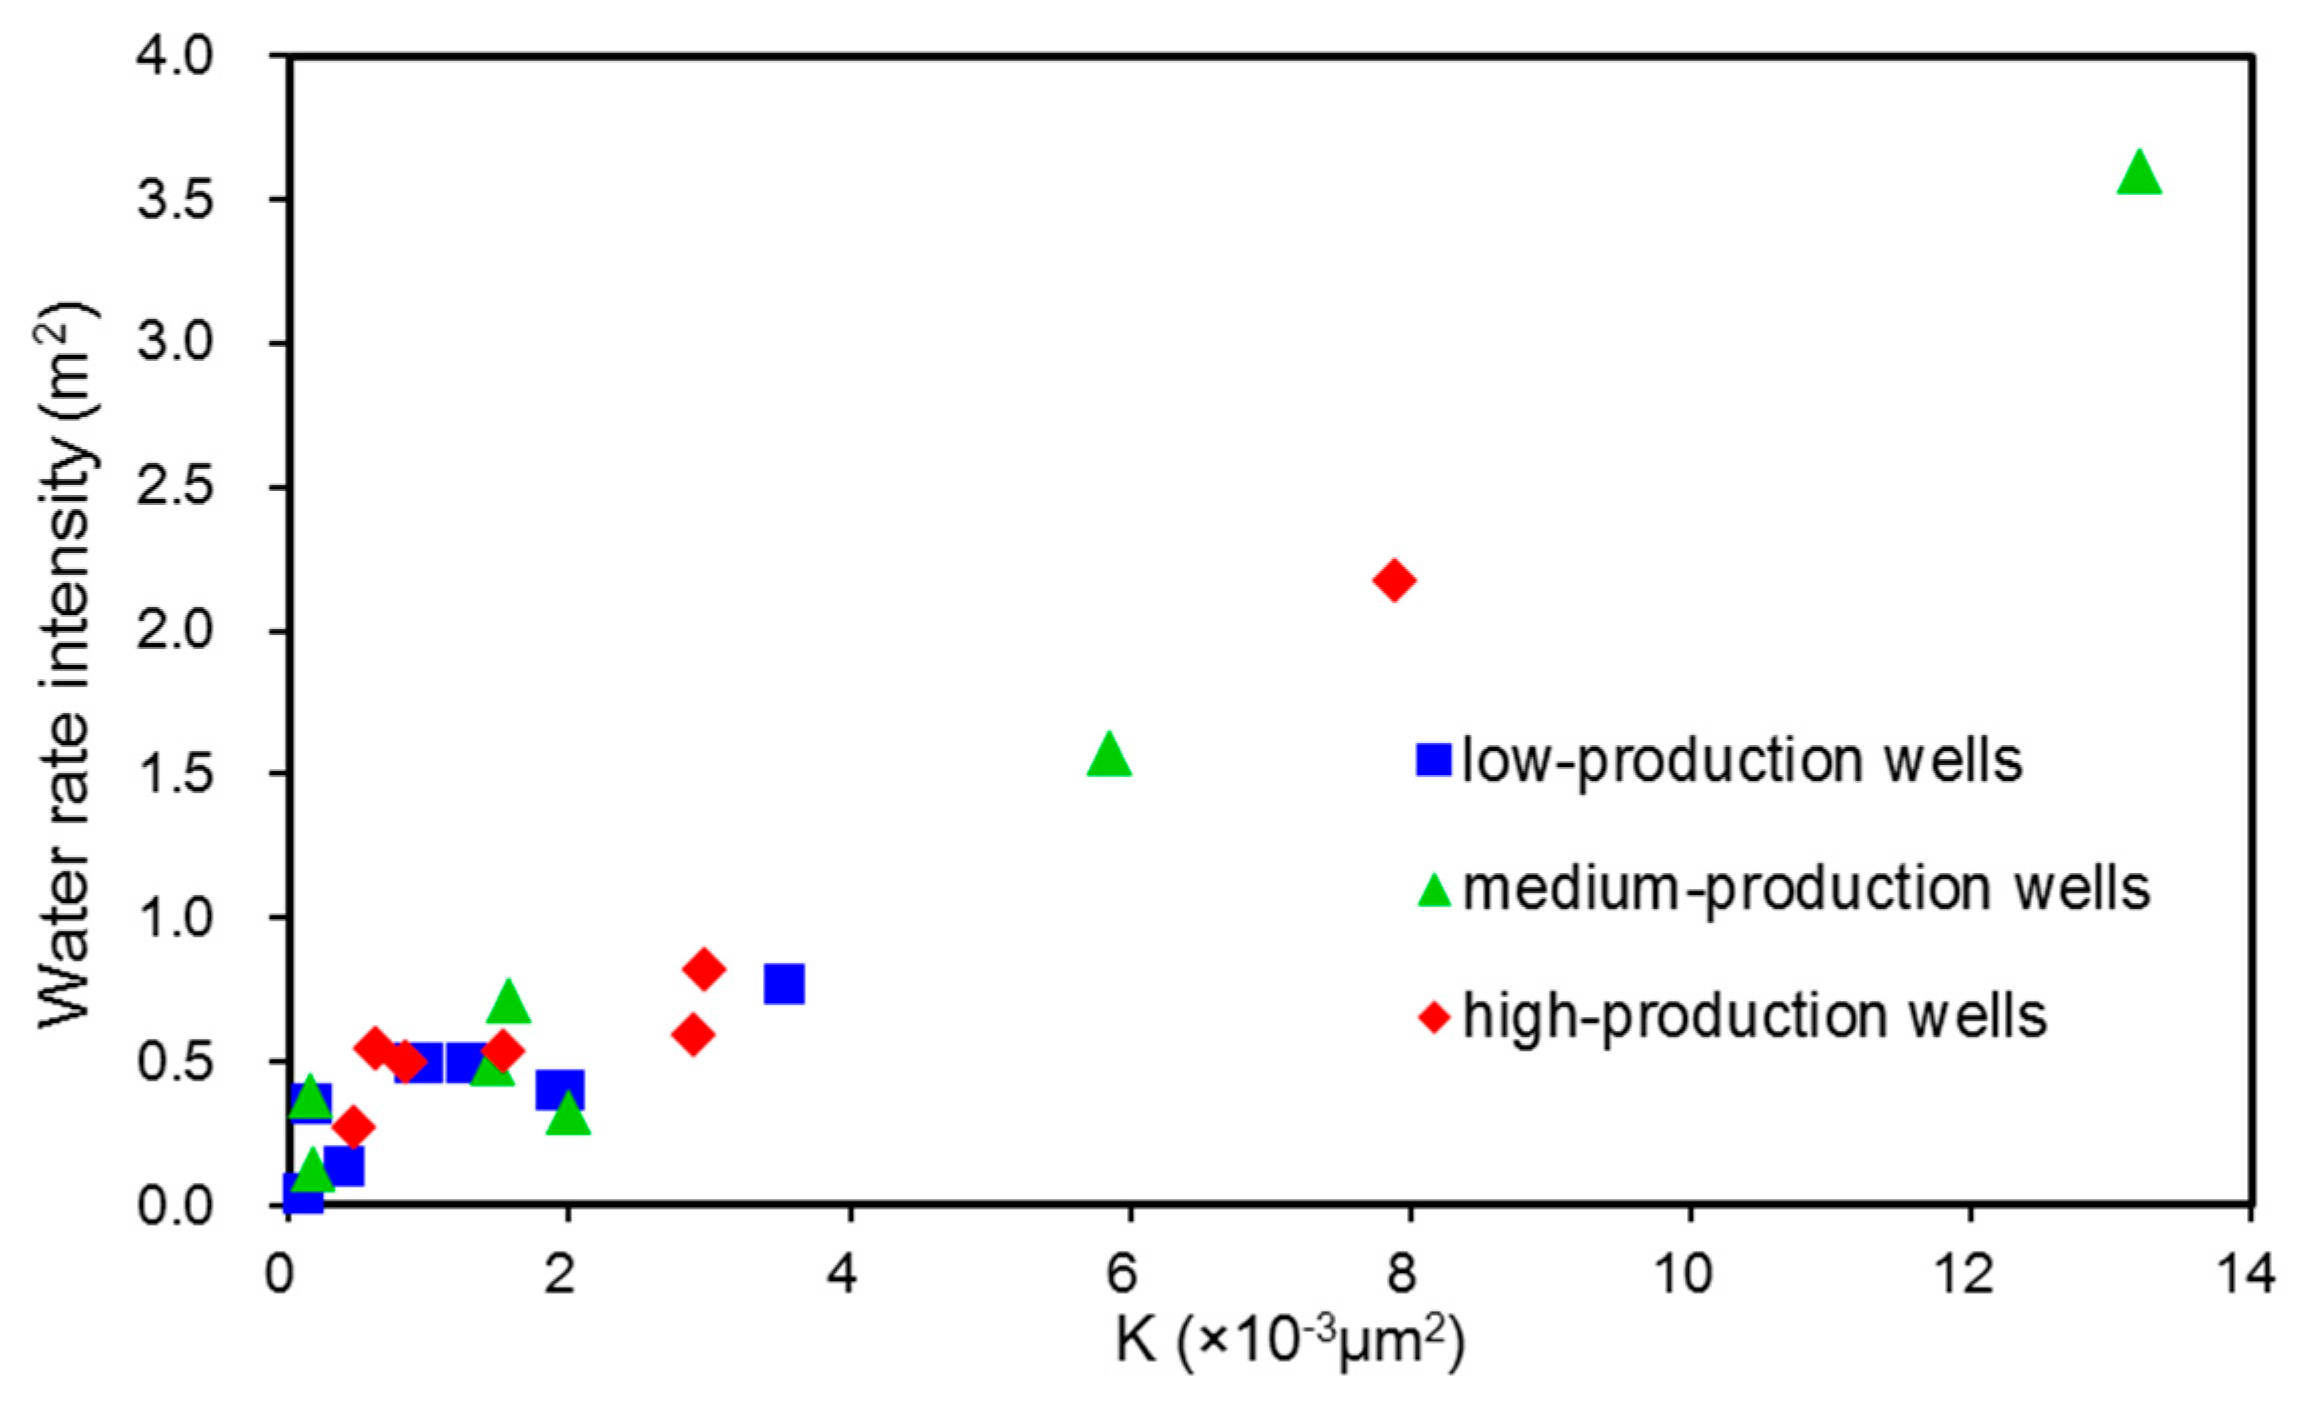
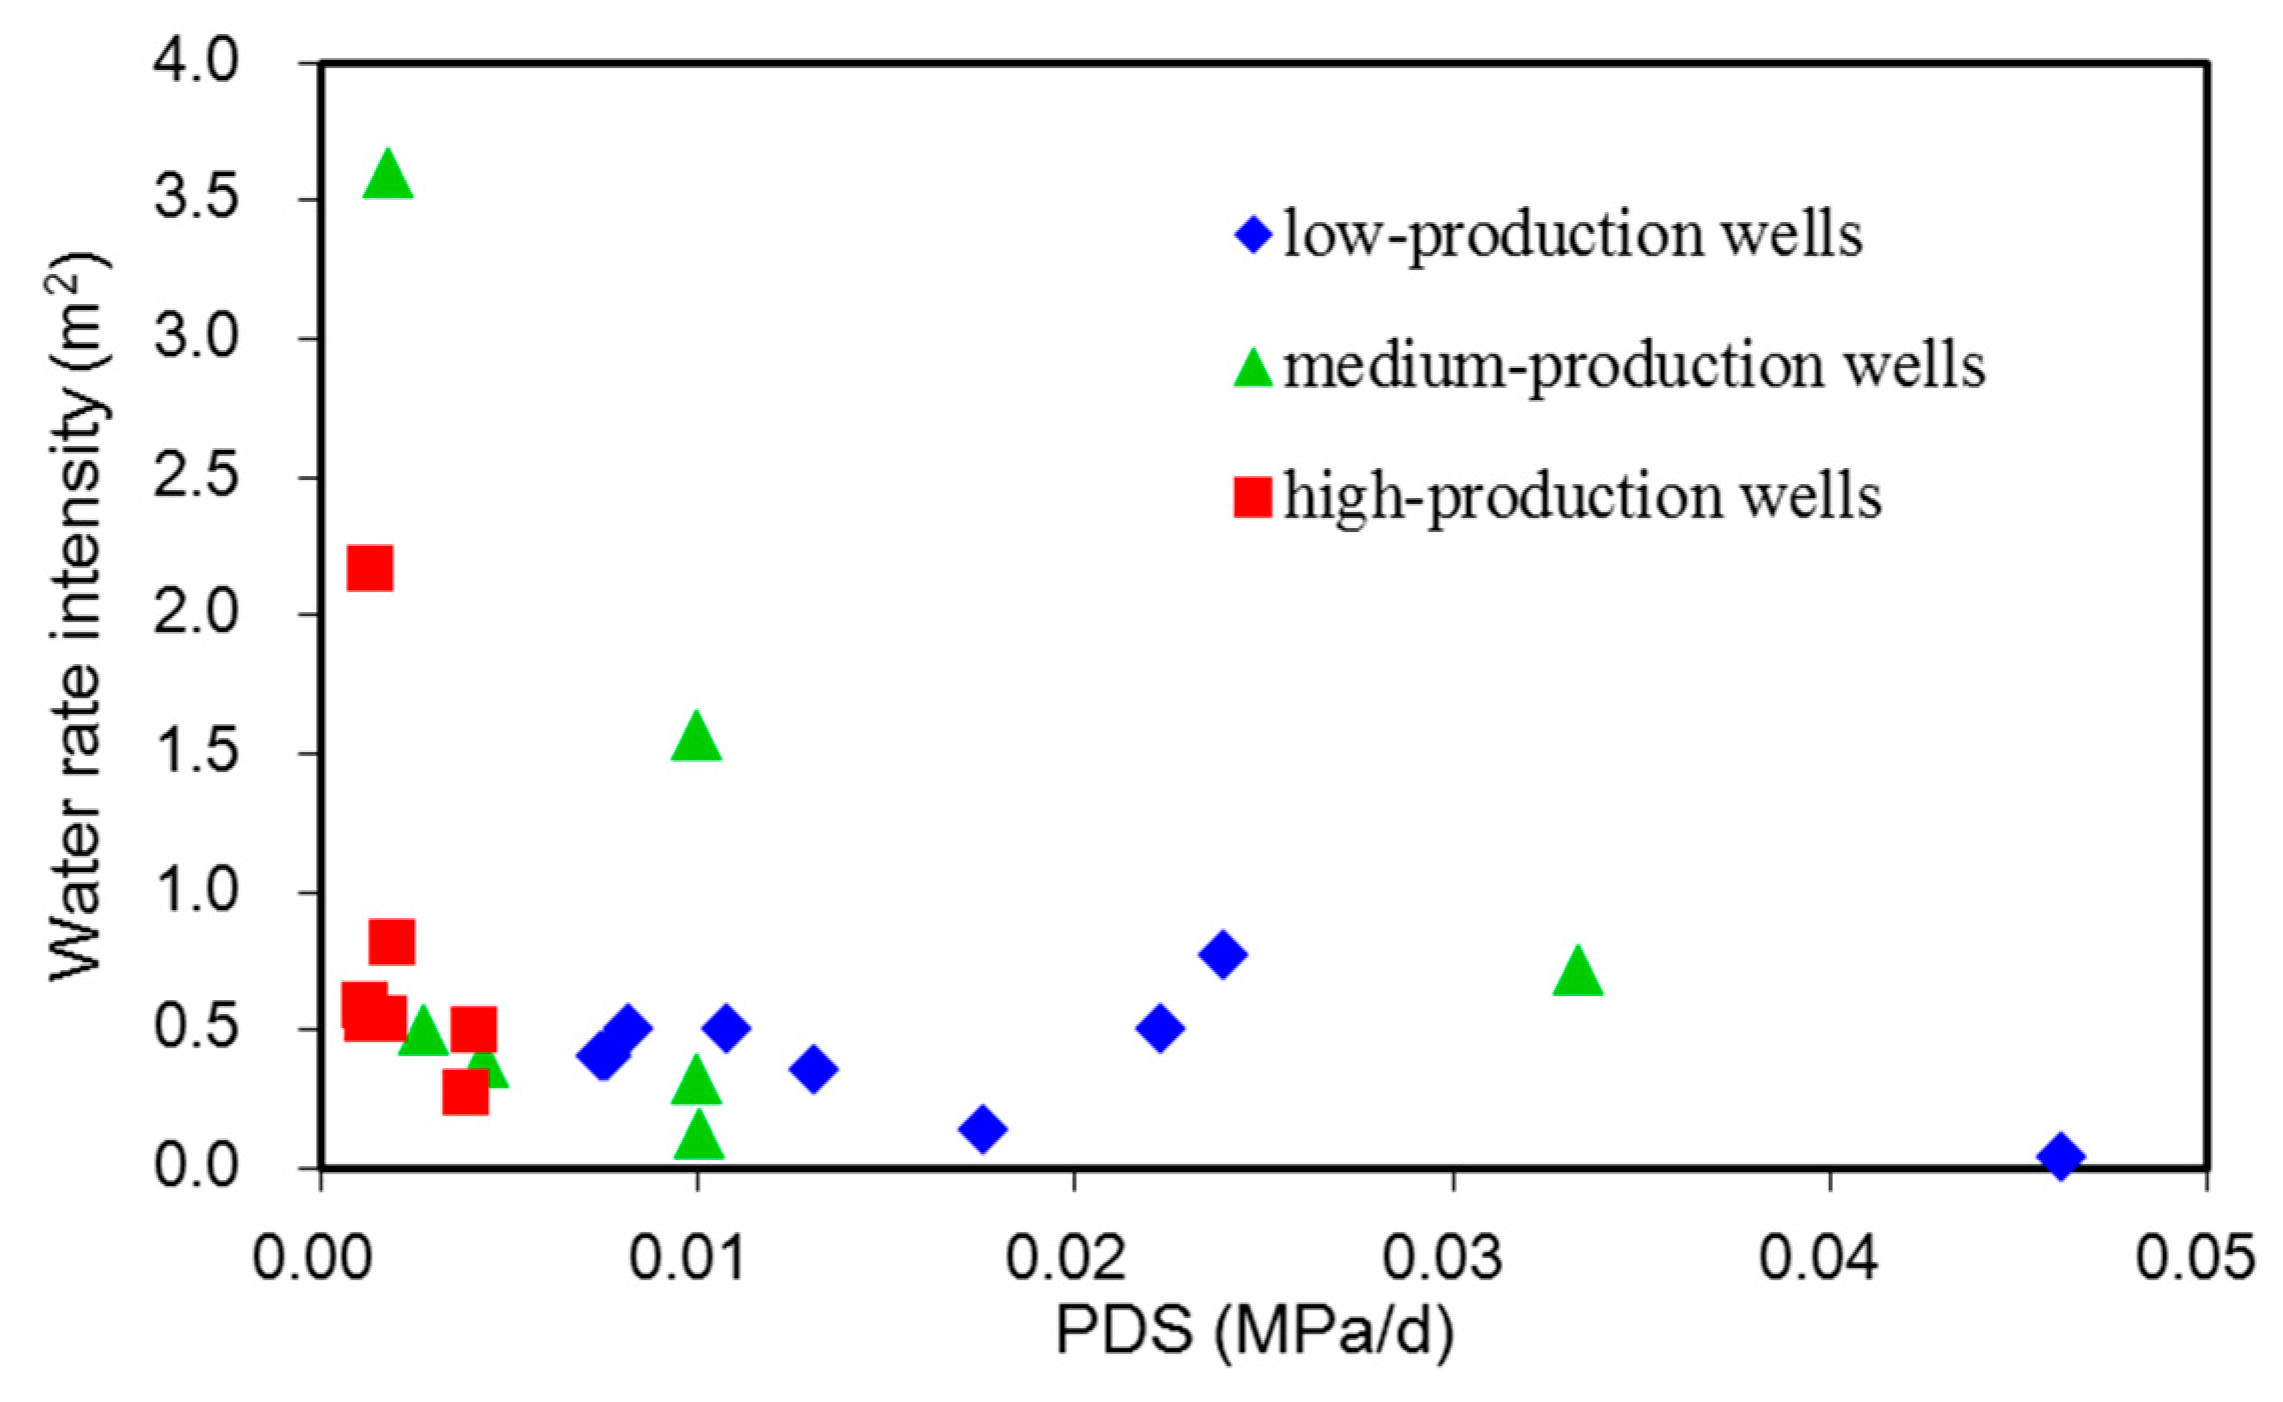
As shown in Figure 11, the permeability has a strong linear relationship with the water rate intensity (WPI, the ratio of water rate and coal bed thickness). The WPI increases with the permeability increasing. When the permeability is higher than 0.5 × 10⁻³ μm2, WPI will be bigger than 0.3 m3/m. As shown in Figure 12, if the WPI is bigger than 0.3 m3/m, the wellbore’s PDS will be smaller than 0.01 MPa/d, which also illustrates that the falling range of WFL should be smaller than 1m. Generally, keeping a slower water drainage rate is necessary for the first stage.
5. Conclusions
Due to the methane desorption and water drainage of CBM, the whole development process is divided into 4 stages: water drainage stage, gas rate rising stage, steady gas production stage and gas rate decline stage. These different production stages can also be divided by dynamic production characteristics of the CBM well. In order to optimize the performance of CBM wells in different development stages, BHP and the water rate of various stages are reorganized by a deconvolution algorithm, and then the pressure data under unit rate is obtained to invert the comprehensive reservoir permeability. This deconvolution method can save the cost of the well-test, and avoid reservoir damage caused by frequently switching well. By comparing the interpretation results of the deconvolution test method and the conventional pressure drop/build up well-test method, the feasibility of the proposed method is verified. However, it is mainly suitable for vertical wells and is not suitable for horizontal wells. For gas-water two-phase flow and desorption, equivalent treatment is required.
The deconvolution well-test method based on dynamic production data reorganization is applied for Hancheng 29 wells. Investigation radius and pressure drawdown gradient are calculated by stage duration time, comprehensive compression coefficient and permeability. Finally, based on the statistical analysis of production data and production indices of 29 wells in Hancheng CBM field, the water drainage optimizations are determined as follows: Reservoir pressure should decrease stably, with WFL decline less than 1 m/d and PDG less than 2.8 MPa/100 m.
Author Contributions
Writing: D.G., Y.L.; Providing case and idea: Z.G., J.H., J.L., H.F.; Revising: H.M., S.-B.T.
Funding
The study was supported by National Natural Science Foundation of China (11702300) and PetroChina Innovation Foundation (2017D-5007-0208).
Acknowledgments
The study was supported by National Natural Science Foundation of China (11702300), PetroChina Innovation Foundation (2017D-5007-0208) and the Key Laboratory of Fluid-Solid Coupling System Mechanics, Chinese Academy of Sciences.
Conflicts of Interest
The authors declare no conflict of interest.
References
- Li, X.F.; Pu, Y.C.; Sun, C.Y.; Ren, W.N.; Li, Y.Y.; Zhang, Y.Q.; Li, J.; Zang, J.L.; Hu, A.M.; Wen, S.M.; et al. Recognition of absorption/desorption theory in coalbed methane reservoir and shale gas reservoir. Acta Pet. Sin. 2014, 35, 1113–1129. (In Chinese) [Google Scholar]
- Han, G.P.; Ling, K.G.; Zhang, H. Smart de-watering and production system through real-time water level surveillance for Coal-Bed Methane wells. J. Nat. Gas Sci. Eng. 2016, 31, 769–778. [Google Scholar] [CrossRef]
- Li, J.H.; Su, X.B.; Lin, X.Y.; Guo, H.Y. Relationship between discharge rate and productivity of coalbed methane wells. J. China Coal Soc. 2009, 34, 376–380. [Google Scholar]
- Liu, S.Q.; Sang, S.X.; Li, M.X.; Liu, H.H.; Wang, L.L. Control factors of coalbed methane well desorption cone under drainage well network in southern Qinshui basin. J. China Univ. Min. Technol. 2012, 41, 943–950. [Google Scholar]
- Kang, Y.Y.; Shao, X.J.; Wang, C.F. Production characteristics and affecting factors of high-mid rank coalbed methane wells: Taking Fanzhuang and Hancheng mining areas as examples. Petrol. Explor. Dev. 2012, 39, 728–732. [Google Scholar] [CrossRef]
- Shao, X.J.; Wang, C.F.; Tang, D.Z.; Sun, Y.B.; Xu, H. Productivity mode and control factors of coalbed methane wells: A case from Hancheng region. J. China Coal Soc. 2013, 38, 271–276. [Google Scholar]
- Fu, X.H.; Ge, Y.Y.; Liang, W.Q.; Li, S. Pressure control and fluid effect of progressive drainage of multiple superposed CBM systems. Nat. Gas Ind. 2013, 33, 35–39. (In Chinese) [Google Scholar]
- Zhang, S.A.; Cao, L.H.; Du, C.X. Study on CBM production mechanism and control theory of bottom-hole pressure and coal fines during CBM well production. J. China Coal Soc. 2014, 39, 1927–1931. [Google Scholar]
- Wan, Y.Z.; Liu, Y.W.; Ouyang, W.P.; Liu, W.C.; Han, G.F. Desorption area and pressure-drop region of wells in a homogeneous coalbed. J. Nat. Gas Sci. Eng. 2016, 28, 1–14. [Google Scholar] [CrossRef] [Green Version]
- Von Schroeter, T.; Gringarten, A.C. Superposition principle and reciprocity for pressure transient analysis of data from interfering wells. SPE J. 2009, 14, 488–495. [Google Scholar] [CrossRef]
- Von Schroeter, T.; Hollaender, F.; Gringarten, A.C. Analysis of well test data from permanent downhole gauges by deconvolution. In Proceedings of the SPE Annual Technical Conference and Exhibition, San Antonio, TX, USA, 29 September–2 October 2002. [Google Scholar]
- Von Schroeter, T.; Hollaender, F.; Gringarten, A.C. Deconvolution of well-test data as a nonlinear total least-squares problem. SPE J. 2009, 9, 375–390. [Google Scholar] [CrossRef]
- Setiawan, A.; Hird, K.; Bennett, C.O. Enhancement of Vorwata Field reservoir model by integration of pressure transient analysis with real-time downhole pressure data. In Proceedings of the SPE Asia Pacific Oil and Gas Conference and Exhibition, Jakarta, Indonesia, 20–22 September 2011. [Google Scholar]
- Gringarten, A.C. From straight lines to deconvolution: The evolution of the state of the art in well test analysis. SPE Reserv. Eval. Eng. 2008, 11, 41–62. [Google Scholar] [CrossRef]
- Cheng, Y.; Lee, W.J.; Mcvay, D.A. Fast-fourier-transform-based deconvolution for interpretation of pressure transient test data dominated by wellbore storage. SPE Reserv. Eval. Eng. 2005, 8, 224–239. [Google Scholar] [CrossRef]
- Saevareid, O. Wavelet based regularization of the well test deconvolution problem. In Proceedings of the 10th European Conference on the Mathematics of Oil Recovery, Amsterdam, The Netherlands, 4–7 September 2006. [Google Scholar]
- Pimonov, E.A.; Onur, M.; Kuchuk, F.J. A new robust algorithm for solution of pressure/rate deconvolution problem. J. Inverse Ill-posed Probl. 2009, 17, 611–627. [Google Scholar] [CrossRef]
- Onur, M.; Kuchuk, F.J. A new deconvolution technique based on pressure-derivative data for pressure-transient-test interpretation. SPE J. 2012, 17, 307–320. [Google Scholar] [CrossRef]
- Vasin, V.; Skorik, G.; Pimonov, E.; Kuchuk, F. New regularization algorithms for solving the deconvolution problem in well test data interpretation. Appl. Math. 2010, 1, 387–399. [Google Scholar] [CrossRef]
- Skorik, G.G.; Vasin, V.V.; Kuchuk, F. A new technique for solving pressure-rate deconvolution problem in pressure transient testing. J. Eng. Math. 2016, 101, 1–12. [Google Scholar] [CrossRef]
- Conislla, J.W.Q.; Quinones, V.A.H.; Quispe, D. Numerical transient-testing deconvolution as a reservoir-modeling tool for gas fields in early development phase. In Proceedings of the SPE Latin American and Caribbean Petroleum Engineering Conference, Lima, Peru, 1–3 December 2010. [Google Scholar]
- Moore, T.A. Coalbed methane: A review. Int. J. Coal Geol. 2015, 101, 36–81. [Google Scholar] [CrossRef]
- Salmachi, A.; Yarmohammadtooski, Z. Production data analysis of coalbed methane wells to estimate the time required to reach to peak of gas production. Int. J. Coal Geol. 2015, 141, 33–41. [Google Scholar] [CrossRef]
- Liu, W.C.; Liu, Y.W.; Zhu, W.Y.; Sun, H.D. A stability-improved efficient deconvolution algorithm based on B-splines by appending a nonlinear regularization. J. Petrol. Sci. Eng. 2018, 164, 400–416. [Google Scholar] [CrossRef]
- Ilk, D.; Valko, P.P.; Blasingame, T.A. Deconvolution of Variable-Rate Reservoir Performance Data Using B-Splines. In Proceedings of the SPE Annual Technical Conference and Exhibition, Dallas, TX, USA, 9–12 October 2005. [Google Scholar]
- Burden, R.L.; Faires, J.D. Numerical Analysis. In Interpolation & Polynomial Approximation Cubic Spline Interpolation III, 9th ed.; Cengage Learning: Boston, MA, USA, 2010. [Google Scholar]
- Liu, N.Q. A new definition of investigation radius. Well Test. 2006, 15, 42–43. (In Chinese) [Google Scholar]
- Akhondzadeh, H.; Keshavarz, A.; Sayyafzadeh, M.; Kalantariasl, A. Investigating the relative impact of key reservoir parameters on performance of coalbed methane reservoirs by an efficient statistical approach. J. Nat. Gas Sci. Eng. 2018, 53, 416–428. [Google Scholar] [CrossRef]
- Sun, Z.; Shi, J.; Wang, K.; Miao, Y.; Zhang, T.; Li, X.F. The gas-water two phase flow behavior in low-permeability CBM reservoirs with multiple mechanisms coupling. J. Nat. Gas Sci. Eng. 2018, 52, 82–83. [Google Scholar] [CrossRef]
- Xu, B.X.; Li, X.F.; Ren, W.N.; Chen, D.; Bai, Y.H. Dewatering rate optimization for coal-bed methane well based on the characteristics of pressure propagation. Fuel 2016, 188, 11–18. [Google Scholar] [CrossRef]
Figure 1.
The division of production stages of CBM wells.

Figure 2.
Procedure for CBM production dynamic analysis.

Figure 3.
H3-1 pressure drop well-test double logarithmic curves.

Figure 4.
H3-1 deconvolution well-test double logarithmic curves.

Figure 5.
H3-2 pressure build-up double logarithmic curves.

Figure 6.
H3-1 deconvolution well-test double logarithmic curve.

Figure 7.
The relation between PDS and steady gas rate in water drainage stage.

Figure 8.
The relation between PDS and investigation radius (Ri) in water drainage stage.

Figure 9.
The relation between PDG and steady gas rate in water drainage stage.

Figure 10.
The relation between PDG and permeability in water drainage stage.

Figure 11.
The relation between water rate intensity and permeability in water drainage stage.

Figure 12.
The relation between water rate intensity and PDS in water drainage stage.


Table 1.
The interpretation results of conventional well-test and deconvolution well-test.
| Well | Well-Test Analysis Method | Initial Pressure | Permeability | Skin Factor | Wellbore Storage Factor | Investigation Radius | |||||
|---|---|---|---|---|---|---|---|---|---|---|---|
| Fitted Value/MPa | Relative Error | Fitted Value/10−3 μm2 | Relative Error | Fitted Value | Relative Error | Fitted Value/m3·MPa−1 | Relative Error | Fitted Value/m | Relative Error | ||
| H3-1 | Pressure drop well-test | 0.302 | - | 9.38 | - | −6.65 | - | 4.58 | - | 348 | - |
| Deconvolution well-test | 0.302 | 0% | 9.3 | 1.0% | −6.79 | 2.1% | 4.34 | 5.5% | 352 | 1.1% | |
| H3-2 | Pressure build-up well-test | 5.24 | - | 3.54 | - | 1.1 | - | 34.7 | - | 929 | - |
| Deconvolution well-test | 5.25 | 0.2% | 3.5 | 1.1% | 0.79 | 28% | 33.6 | 3.2% | 1000 | 7.1% | |
© 2018 by the authors. Licensee MDPI, Basel, Switzerland. This article is an open access article distributed under the terms and conditions of the Creative Commons Attribution (CC BY) license (http://creativecommons.org/licenses/by/4.0/).
Share and Cite
MDPI and ACS Style
Gao, D.; Liu, Y.; Guo, Z.; Han, J.; Lin, J.; Fang, H.; Ma, H.; Tsai, S.-B. A Study on Optimization of CBM Water Drainage by Well-Test Deconvolution in the Early Development Stage. Water 2018, 10, 929. https://doi.org/10.3390/w10070929
AMA Style
Gao D, Liu Y, Guo Z, Han J, Lin J, Fang H, Ma H, Tsai S-B. A Study on Optimization of CBM Water Drainage by Well-Test Deconvolution in the Early Development Stage. Water. 2018; 10(7):929. https://doi.org/10.3390/w10070929
Chicago/Turabian StyleGao, Dapeng, Yuewu Liu, Zhidong Guo, Jun Han, Jingde Lin, Huijun Fang, Hailing Ma, and Sang-Bing Tsai. 2018. "A Study on Optimization of CBM Water Drainage by Well-Test Deconvolution in the Early Development Stage" Water 10, no. 7: 929. https://doi.org/10.3390/w10070929
Note that from the first issue of 2016, this journal uses article numbers instead of page numbers. See further details here.