Article

Optimal Operation of the Eastern Nile System Using Genetic Algorithm, and Benefits Distribution of Water Resources Development

by
Reem F. Digna
1,2,*,
Mario E. Castro-Gama
1,3,
Pieter Van der Zaag
1,4,
Yasir A. Mohamed
1,4,5,
Gerald Corzo
1 and
Stefan Uhlenbrook
1,4,6
1
IHE Delft Institute for Water Education, 2611 AX Delft, The Netherlands
2
Civil Engineering Department, University of Khartoum, 11111 Khartoum, Sudan
3
KWR Watercycle Research Institute, 3433 PE Nieuwegein, The Netherlands
4
Water Management Department, Delft University of Technology, 2628 CN Delft, The Netherlands
5
Hydraulic Research Centre, 21111 Wad Medani, Sudan
6
The United Nations Educational, Scientific and Cultural Organization (UNESCO), World Water Assessment Programme, 06134 PG Perugia, Italy
*
Author to whom correspondence should be addressed.
Water 2018, 10(7), 921; https://doi.org/10.3390/w10070921
Submission received: 24 May 2018 / Revised: 2 July 2018 / Accepted: 7 July 2018 / Published: 11 July 2018
(This article belongs to the Section Water, Agriculture and Aquaculture)

Abstract

:
The Eastern Nile Basin is facing a number of transboundary issues, including water resources development, and the associated impacts. The Nile Basin, particularly the Eastern Nile Sub-basin, is considered as one of a few international river systems of potential conflicts between riparian countries. The Eastern Nile is characterized by the high dependency of downstream countries on river water generated in upstream countries, with limited or no contribution to the runoff itself. The aim of this paper is to analyze optimal scenarios for water resources management in the Eastern Nile with regard to hydropower generation and irrigation development. A hydro-economic optimization model based on Genetic Algorithm has been used to determine the maximum benefits for two scenarios: (i) non-cooperative management of hydraulic infrastructure by the riparian countries (status quo), and (ii) cooperative water resources management among the riparian countries. The hydro-economic model is developed using a Genetic Algorithm and deterministic optimization approach covering all hydraulic infrastructures in the Eastern Nile, existing and planned, including the Grand Ethiopian Renaissance Dam (GERD). The results show that cooperative management yields an increase in hydro-energy returns for all countries compared to the status quo, with a very high increase in Ethiopian’s returns, as expected. Non-cooperative system management would negatively impact the hydro-energy of Egypt compared to the cooperative management (reduced by 11%), without a significant increase of hydro-energy for Ethiopia. For Sudan, the results show that hydropower generation benefits from the presence of GERD, in both management scenarios. Non-cooperative management of the system, along with the internal trade-off between irrigation and hydropower facilities, would negatively impact irrigation supply in Sudan. The findings support the argument of positive impact of GERD development on the three Eastern Nile riparian countries, Ethiopia, Sudan and Egypt, provided that the three countries agree to manage the system cooperatively.

1. Introduction

Optimal operation of multiple reservoir systems has been a subject of research by many authors, for different water issues in different locations [1,2,3,4,5]. The case of the Eastern Nile Basin is politically significant, being a transboundary basin shared by four countries: Ethiopia, South Sudan, Sudan and Egypt, and covers more than one half of the Nile Basin [6]. The basin is endowed with a large potential of hydropower and food production that can be generated from cooperative water resources development and management. Full cooperation is, however, not self-evident [7].
The Nile Basin, and in particular the Eastern Nile Sub-basin, is considered as one of a few international river systems with potential water conflicts between riparian countries [8,9]. In common with other international rivers, current tensions in the Eastern Nile Sub-basin and the whole Nile Basin are triggered by water availability that is insufficient to satisfy the water needs of all planned development projects. Each of the basin countries is unilaterally developing water resources projects to meet the increasing demand for energy and economic growth [10,11,12]. Unilateral management limits the potential benefits of joint cooperation, which can be extended beyond shared water system management [13,14]. The unique feature of the tensions in the Eastern Nile Basin is that downstream countries have a high dependency on the water generated in upstream countries [9].
Water resources system analysis, which focuses on management strategies for sustainable and optimal use of water resources, can play an important role in conflict resolution by means of understanding conflicts and cooperation options [15]. Water resources system analysis, in particular, multi-reservoir system optimization, has been given much attention by scholars in academia and system operational firms [16,17,18]. The advances and improvements of optimization algorithms have enhanced the confidence of policy makers in the search for sustainable system management. However, reservoir system optimization needs more attention as it is a location-specific and depends on the scale of the analysis [16].
The literature suggests various conflict resolution techniques applied to shared water courses. These techniques use multi-criteria decision-making approaches based on methods, such as conventional optimization from operation research, to more advanced ones, such as game theory. Madani [19] argued that game theory results differ from those of optimization methods in such a way that, in game theory, each party tends to maximize his benefits. This is in contrary to optimization, which assumes cooperation towards maximizing the whole system benefits. Nash equilibrium solutions can be applied in game theory to maximize the benefits of non-cooperation conditions between players. In the Nile Basin, game theory is applied to study various levels of cooperation and non-cooperation among the states of the basin [9,20,21].
In the context of system analysis, the Eastern Nile River system, with its many reservoirs, can be defined as having multiple objectives, predominantly for hydropower and irrigation, constrained by conflictive objectives, and high upstream–downstream interdependencies [22]. Many scholars have applied different system optimization techniques to study the Eastern Nile River system, addressing the allocation of water from existing and planned dams among different users and riparian countries under different management options. These methods include mathematically based (conventional optimization) techniques, such as Linear Programming (LP) [23,24], Nonlinear Programming (NLP) [12,24,25,26,27,28,29], Dynamic Programming (DP) [10,30,31,32], and computational intelligence techniques [33]. Digna et al. [22] provided a comprehensive review on diverse Nile River Basin models and simulation techniques. The findings of these studies showed some discrepancies and common agreement on the impact of development of water resources infrastructures upstream in the Eastern Nile Basin on downstream hydropower generation and irrigation water supply. The results showed a common agreement that water availability for irrigation might increase and hydropower generation may not be affected or reduce slightly, while there is discrepancy on quantifying these impacts.
There are, however, some limitations of the application of conventional optimization techniques, in particular when they are used in a complex multi-reservoir system having hydropower generation as one of its main objectives. Linear optimization techniques are efficient for large-scale systems with high-dimensional variables, but require all relations among variables in constraints and objectives to be linear [34,35,36]. Though, it is not applicable for system analysis with inclusion of hydropower generation, without linearization and/or simplifications. Nonlinear Programming is effective for handling nonlinearity; however, it requires that all relations must be differentiable, which might not always be applicable for complex problems that have non-concave, non-convex, discontinuous and non-differentiable functions. Dynamic programming can handle nonlinearity in objective functions and constraints and continuity of the functions. However, dimensionality or handling multiple state variables is one of the dynamic programming limitations. The number of discrete combinations of state variables increases exponentially as the number of state variables increases. Evolutionary computation approaches, such as Genetic Algorithm (GA), overcome the limitations of conventional optimization techniques in reservoir system analysis, and deal with nonlinear, discontinuous, non-convex and multi-functions [37]. GA has been successfully applied worldwide for reservoir optimization [38]. GA has been found to be superior among other conventional methods in that it can get global or near global optimal solutions because of its search concept of population of solutions [39]. GA uses the operators for initialization, fitness, crossover and mutation to generate a multiple Pareto-optimal solution in one run for a multi-objective optimization problem. GA can save computation time when used for large-scale problems due to its parallel processing nature, in addition to the possibility of using the same computer code for different problems. However, GA is not appropriate for highly constrained problems because of the big portion of infeasible solutions, which may result in the population [40]. Despite its robustness, evolutionary computation algorithms have not yet been applied in the complex Eastern Nile system.
The aim of this paper is to analyze optimal scenarios for water resources management in the Eastern Nile with regard to hydropower generation and irrigation development. A hydro-economic optimization model based on GA is developed to determine the maximum benefits for two scenarios: (i) non-cooperative management of hydraulic infrastructures by the riparian countries, and (ii) cooperative water resources management among the riparian countries.
Application of GA in water resources problems is not new; however, specifically in a complex system, such as the Eastern Nile Basin, to the best of our knowledge, most approaches used before are single-objective oriented or based on diverse operation research methods. Such a deterministic optimization approach allows for the simultaneous inclusion of all hydro-dams and irrigation schemes, existing and planned without simplification, such as handling over-year storage. A deterministic approach is recommended for complex systems, where large numbers of variables can be analyzed without simplifications [41].

2. Materials and Methods
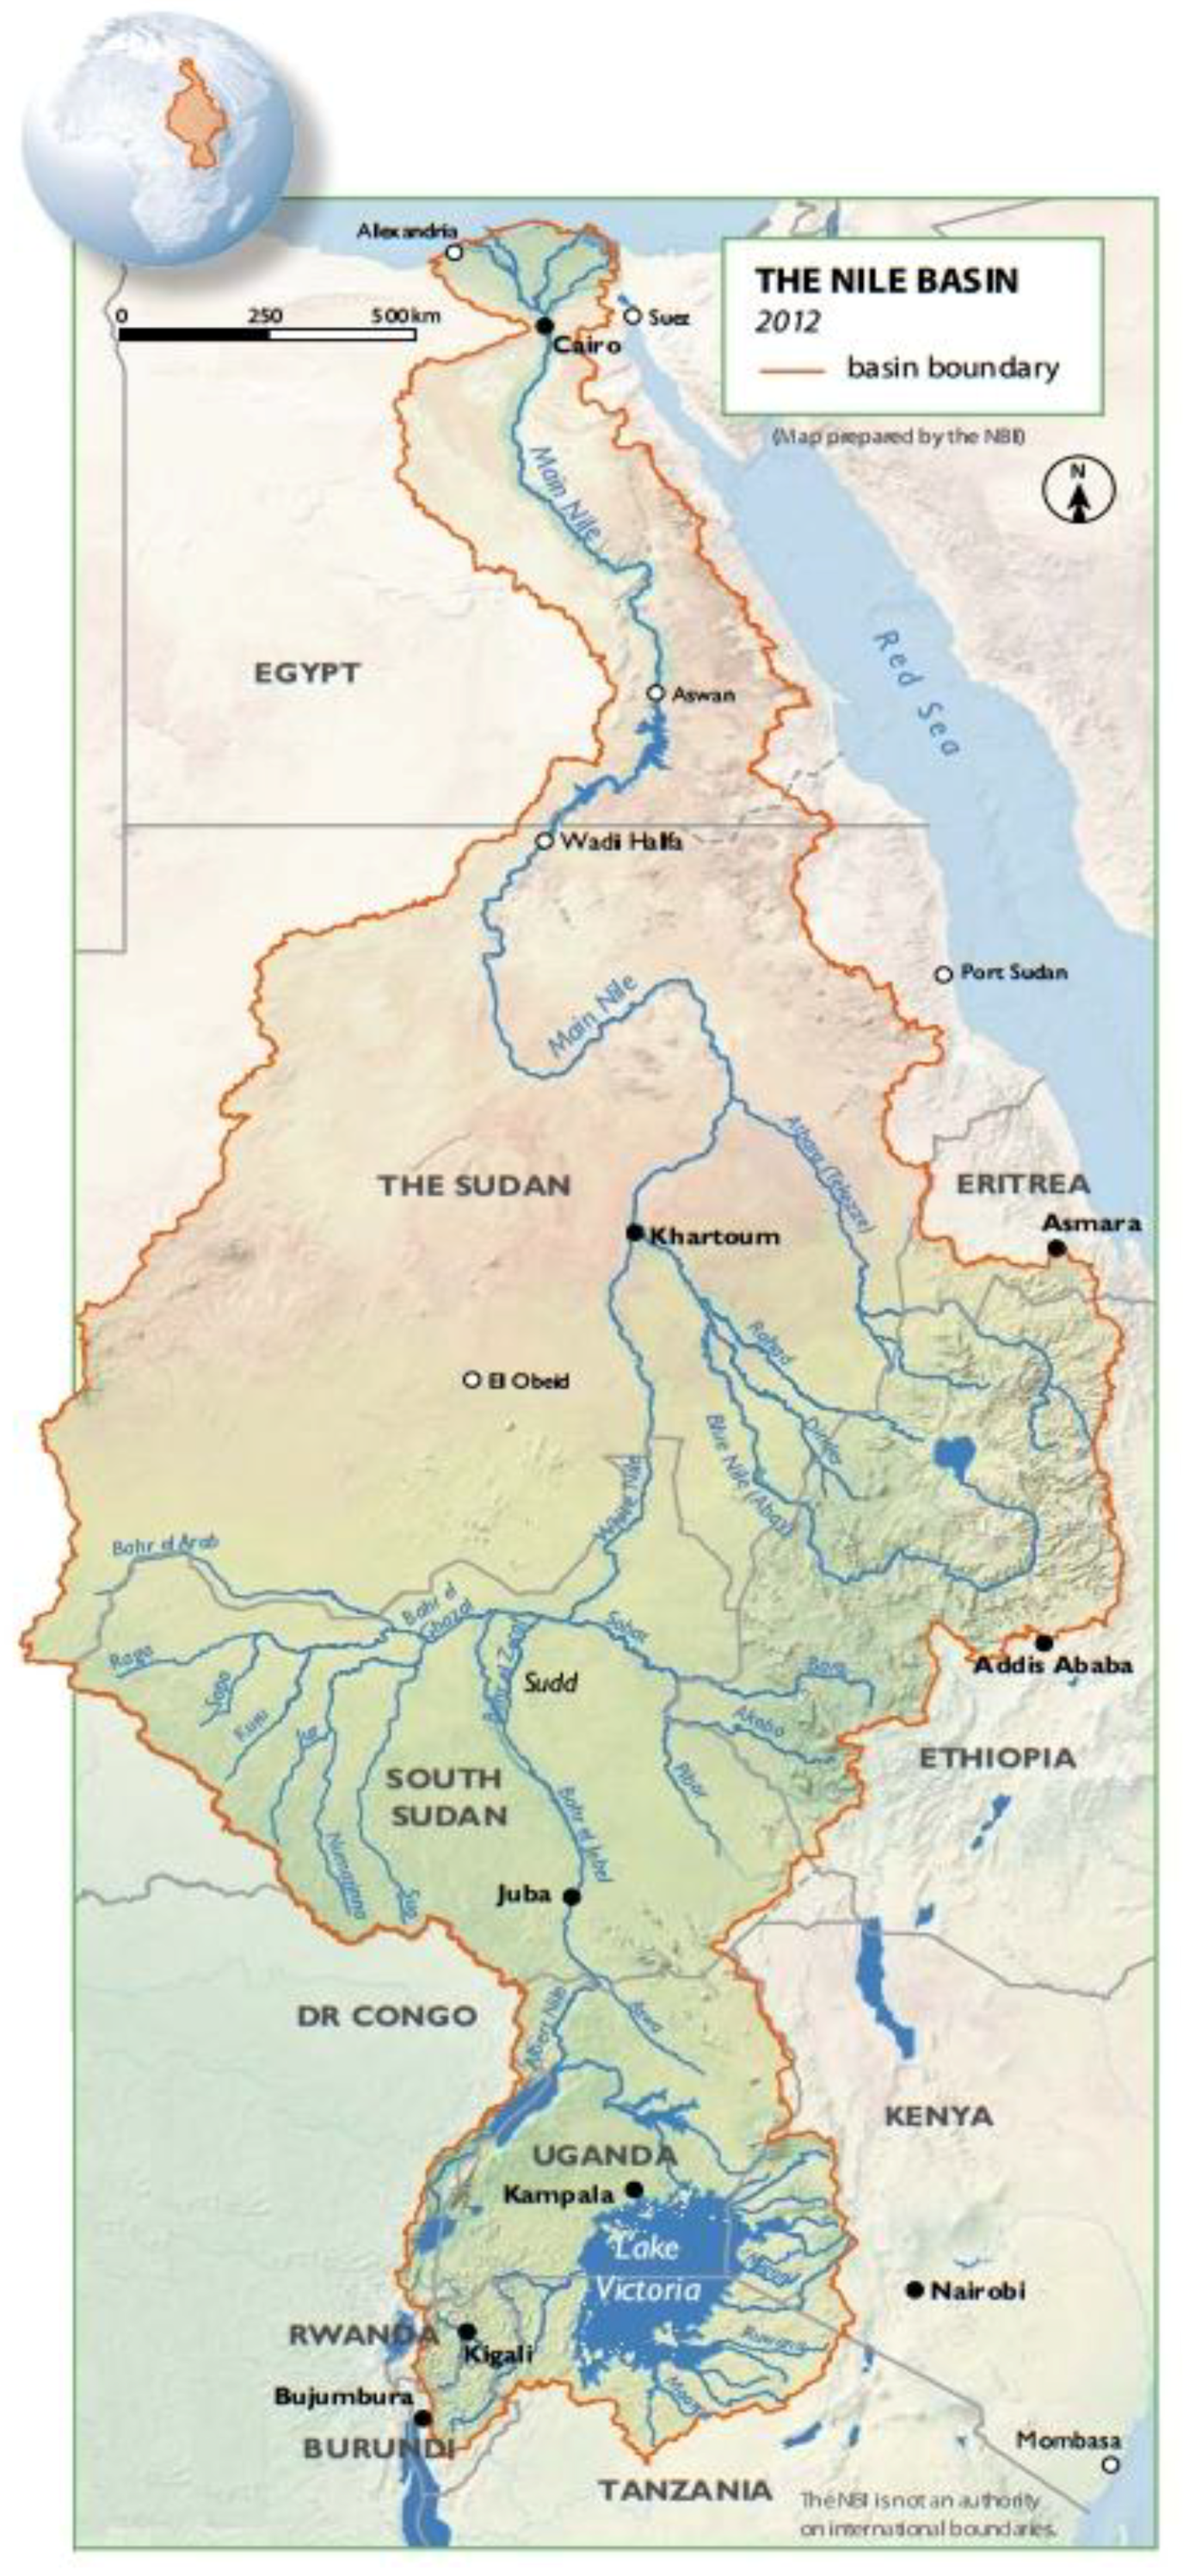
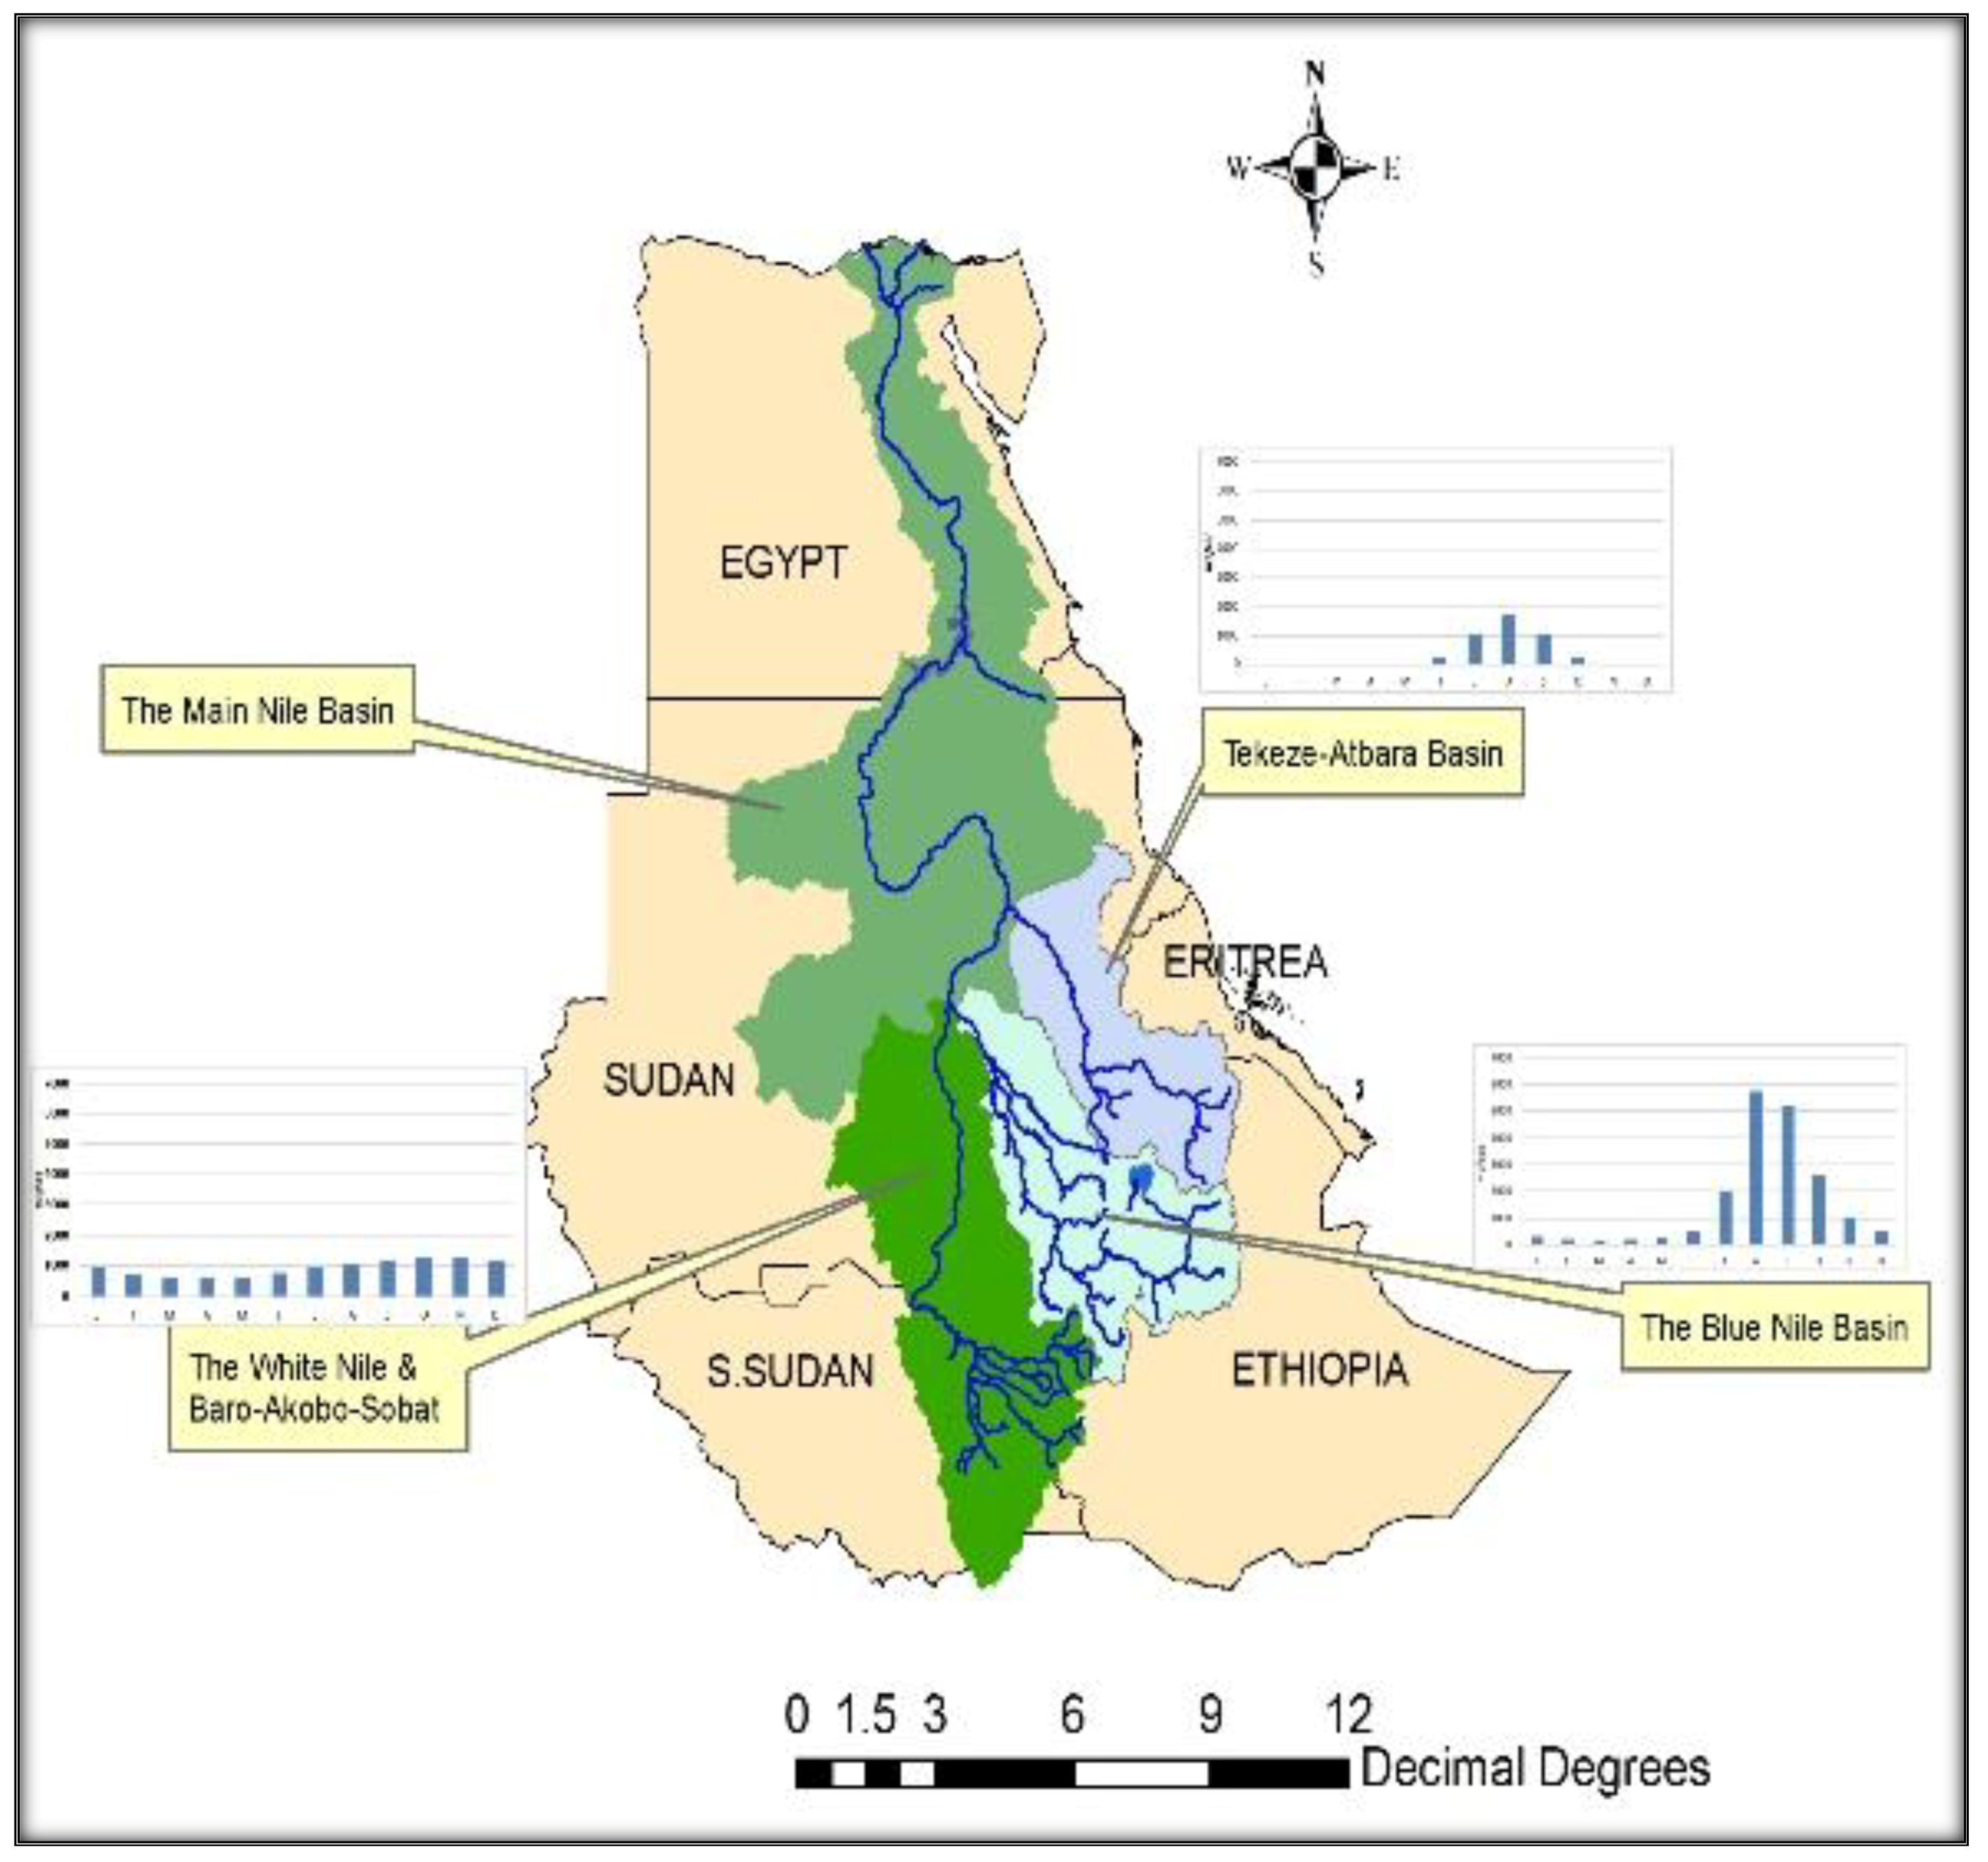
2.1. Study Area

The Eastern Nile Basin with an area of about 1,738,000 km2 is the major sub-basin of the Nile, spanning four countries: South Sudan, Ethiopia, Sudan and Egypt (Figure 1). The main rivers of the basin are the Blue Nile, White Nile, and Main Nile. The Blue Nile originates from the Lake Tana in the Highlands of Ethiopia. The White Nile flows from the Highlands of Uganda through South Sudan and meets the Blue Nile in Sudan to form the Main Nile River that flows northward to Mediterranean Sea through Egypt. The topography of the basin shows a big drop in elevation along the course of the rivers, from more than 4000 m.a.s.l. (meters above the sea level) at the headwaters to the sea level at Nile Delta in Egypt. The climate of the basin varies significantly; it encompasses five climate zones that vary from tropical, to subtropical, arid, semi-arid and Mediterranean zones. The basin accumulates runoffs of four sub-basins: Blue Nile (56%), Atbara (15%), White Nile-Albert (14%) and Sobat (15%), contributing more than 85% of the total annual flow of the Nile estimate as 84.0 × 10⁹ m3 measured at the Aswan High Dam (AHD). The remaining 15% is generated from the Equatorial Lakes region. The flows of the basin’s rivers (Blue Nile, Atbara and Sobat) are characterized by seasonal and inter-annual variability, making the basin vulnerable to floods and droughts. More than 80% of the basin runoff occurs during the flood season (July–October). Figure 2 shows the seasonal contribution of each river basin.
The large gradients in elevation along the course of the basins’ rivers provide a huge potential of hydropower generation, which is not yet fully utilized. The development of more reservoirs would allow the regulation of the river flow to alleviate the impact of floods and droughts. Controlling seasonal and inter-annual variability of the flow, however, poses serious challenges with respect to the management of the water resources in the basin. In Ethiopia, three control structures have been developed along the main stem of the Blue Nile: Chara Chara weir to control Lake Tana outflow and two run-of-river hydropower projects (537 MW), and one dam on the Tekeze River—Tekeze Dam (300 MW) [10] (Figure 3 and Table A1 in Appendix A). In Sudan, five dams are online: two dams (Roseires and Sennar) on the Blue Nile River for irrigation purposes with small hydropower capacities, Khashm Algirba Dam and Upper Atbara Dam complex at Atbara River, Jebel Aulia Dam on the White Nile to provide water for irrigation schemes around the reservoir, and Merowe Dam at the Main Nile with 1250-MW installed capacity and a potential irrigation area of 380,000 ha. In Egypt, there are six hydropower infrastructures along the Main Nile (Table 1), namely the Aswan High Dam, being the major dam in the basin, Old Aswan Dam, which is operated as a run-of-river plant, the Esna run-of-river plant and three barrages: Assyut, Delta and Naga Hammadi that divert Nile water to collectively irrigate 1.315 million ha [42].

2.2. The Eastern Nile Optimization Model (ENOM)

To assess the distribution of benefits between the riparian countries from the optimal operation of the system under both cooperative and non-cooperative management, a deterministic hydro-economic optimization model for the Eastern Nile Basin (ENOM) was developed. Hydro-economic models economically interpret the impact of water resources development and hydrological changes on the related water system and riparian states [28,44]. The model had two components: (i) an optimization model, and (ii) a river basin simulation model. Figure 4 illustrates the conceptual framework of the ENOM. Both optimization and river basin simulation models were coded in MATLAB. The optimization model used a GA to optimize the water releases from reservoirs for hydropower generation and irrigation.
The ENOM was formulated to maximize the aggregated net benefits associated with water allocation for hydropower generation (f(1)) and irrigated agriculture (f(2)) by identifying optimal turbine release and irrigation withdrawal RIRt at each time step (t) over time horizon (T). The optimization problem was written as following.

2.2.1. Decision Variables

Decision variables (RIRt) represent each reservoir releases through the turbines (Rj) and abstracts for irrigation (IRi) at each time step (t). RIRt is a vector of the following form:
[RIRt] = [R1,1 R2,1, …, RT,1; R1,j R2,j, …, RT,j; …; R1,J R2,J, …, RT,J; R1,1 R2,1, …, RT,1; R1,i R2,i, …, RT,i; …; R1,I R2,I, …, RT,I]
The total number of decision variables (nvar) is equal to:
n v a r =   T ( J + I )

2.2.2. Objective Function

The objective (F) is to find the combined reservoir releases and abstraction from reservoirs (RIRt) that leads to maximize the returns from hydropower generation (f(1)) and irrigation projects (f(2)) of the whole system during the time horizon (T). The objective function can be written as:
F ( S t   ,   I t   , R t ) = R I R t m a x { f ( 1 ) ,   f ( 2 ) }
f ( 1 ) =   P e   t ,   j T , J H P t ,   j
H P t , j =   C τ t , j   η t , j H t , j n e t   R t , j
f ( 2 ) =   P w   t , i T ,   I I R t ,   i
where:
SymbolUnitDescription
HPt,jMWh/monthTotal generated energy from Reservoir (j) at time (t)
PeUS$/MWhThe economic benefit of generated energy
CN/m3Constant represents specific gravity and unit conversion
τ t , j hours/monthNumber of hours in period (t)
η t , j -Turbine efficiency
H t , j n e t mTurbine Net Head of reservoir (j) at time (t)
R t , j m3/monthRelease from reservoir (j) at time (t)
P w US$/m3The economic benefit of withdrawal water for irrigation
I R t ,   i m3/monthWithdrawn water for irrigation (i) at time (t)
S t m3/monthStorage state variable at time (t)
I t m3/monthInflow state variables at time (t)
R t m3/monthRelease state variables at time (t)
TmonthPlanning time horizon
J-Total number of dams in the system
I-Total number of irrigation schemes in the system

2.2.3. Constraints

The objective function is subject to the following constraints:
Energy generation constraints:
H P t , j     H P t , j m a x
Q t , j m i n r t , j     Q t , j m a x
Reservoir storage limits:
  S j m i n S ( t , j )   S j m a x
Irrigation withdrawal limits:
I R t , i m i n I R t , i I R t , i m a x
I R t , i m i n = ( A i C W t , i ) , I R t , i m a x = ( A i C W t , i )
0 1
Continuity (mass conservation) constraints:
S t + 1 , j = S t , j +   I t , j   + C j , k   R ( R t , j +   S p t , j ) +   C j , z   I R ( I R t , i ) e t , j
e t , j = A o j   E v t , j   + A t j   E v t , j     ( S t + 1 , j +   S t , j ) / 2
S p t , j = S t + 1 , j S j m a x i f   S t + 1 , j > S j m a x Otherwise , S p t , j = 0
End-storage constraint:
j ,   S T , j D j
Non-negativity constraints:
R t , j ,   S t , j ,   I R t ,   i ,   H P t , j   0
Additional constraint for Sudan’s irrigation withdrawal from the Nile Agreement (1959), which identifies Sudan’s share of the total Nile runoff:
y = 1 Y i s u = 1 I s u I R i s u , t   18.50 × 10 9 [ m 3 / year ]
where:
SymbolUnitDescription
H P t , j m a x MWh/monthMaximum hydropower energy could be generated from reservoir (j) at time (t)
Q t , j m i n m3/monthMinimum turbine discharge of reservoir (j) at time (t)
Q t , j m a x m3/monthMaximum turbine discharge of reservoir (j) at time (t)
S t , j m3/monthStorage state variable of reservoir (j) at time (t)
S j m i n m3Minimum storage volume of reservoir (j)
S j m a x m3Maximum storage volume of reservoir (j)
D j m3Target end storage of reservoir (j) at time (T)
I R t , i m i n m3Minimum water withdrawn for irrigation (i) at time (t)
I R t , i m a x m3Maximum water withdrawn for irrigation (i) at time (t)
A i m2Irrigated area of scheme (i)
C W t , i m/monthCrop water requirement of irrigation scheme (i) at time (t)
-Coefficient representing supply/demand ratio
S t + 1 , j m3/monthStorage state variable of reservoir (j) at time (t + 1)
I t , j m3/monthInflow state variables at reservoir site (j) at time (t)
S p t , j m3/monthSpillage of reservoir (j) at time (t)
e t , j m3/monthEvaporation loss of reservoir (j) at time (t)
A o j m2Surface area of reservoir (j) at the dead storage level
A t j m2/m3The area per unit storage of reservoir (j)
C j , k   R -Reservoir system connectivity matrix = −1 when abstraction, +1, receives water from upstream reservoir [reservoir (j) receives water from reservoir (K)]
C j , z   I R -Irrigation system connectivity matrix = −1 when abstraction, +1, receives return water from upstream irrigation [reservoir (j) receives water from irrigation (i)]
Two functions are performed in the optimization model of the ENOM; computing the fitness values (objective function) for each set of decision variables, and generating reservoir releases (decision variables) for hydropower and irrigation. First, parameters of GA operators are selected, such as population size and creation functions (constrained and unconstrained), numbers of generations, selection, mutation and cross over methods, and termination criteria. The GA generates sets of populations. At each generation, sets of decision variables (releases) forming a population are randomly generated between upper and lower bounds based on Equations (6) and (8–10). The fitness values are then computed for each set of decision variables (Equations (1), (2) and (4)) and ranked; the sets with high scores are kept for the next generation. Releases are used in the river basin simulation model to compute reservoir storages, water levels and generated energy, based on Equations (3), (11–13) and (Figure 4). The termination criteria are checked following evaluation of fitness values; the model stops if the criteria are satisfied, otherwise, the next generation continues with new generated sets of decision variables and those carried from the previous generation with high scores. The process continues evolving towards optimal solution till the termination criteria are satisfied.
To overcome the GA limitations on handling the highly constrained system, the nonlinear constraints are satisfied in different ways to transform the constrained optimization into the unconstrained one. The computation of reservoir storage in the river basin simulation module is based on the continuity equation; therefore, continuity constraint is satisfied. Storage and end-storage constraints are included into the objective function in form of penalty functions. The deviation from the minimum and maximum storage and end-storage are penalized by square differences from constraints limits as:
t , j T ,   J c 1 ( min ( 0 ,   ( S j m i n S t , j ) ) ) 2 ,
t , j T ,   J c 2 ( min ( 0 ,   ( S t , j S j m a x ) ) ) 2 ,
j   J c 3 ( min ( 0 ,   ( D j S T , j ) ) ) 2
where c1, c2, c3 are constants, representing the weight of the penalty terms in the objective function.
The ENOM runs on a monthly time step. ENOM allows assessing different system management and water availability conditions. The model can optimize the whole system as one unit or per country to represent the cooperative and non-cooperative system management condition. It also has an extended module to simulate sedimentation in reservoirs using the trap efficiency method. All reservoirs on the stem of the main rivers of the basin were modeled; those developed on the small tributaries were not considered. The simulation network (Figure 3) includes 20 existing and planned dams: 6 dams on the Blue Nile reach (4 planned dams on the Ethiopian Blue Nile reach and 2 existing dams on the Sudanese part), 1 dam on the White Nile in Sudan, 6 dams on the Tekeze–Atbara River (4 dams in the Ethiopian part and 2 dams in the Sudanese part of the river), 7 dams on the Main Nile (6 in the Sudanese part and 1 in the Egyptian part), and 21 irrigated agriculture schemes representing existing and planned developments in Sudan and Ethiopia. The total water storage capacity of the system is approximately 341 × 109 m3 to irrigate an area of approximately 3 million ha (Figure 3). The downstream boundary of the simulation network is AHD. Irrigation demands of the downstream AHD are assumed as 55.5 × 10⁹ m3/year [45], equivalent to Egypt water demand according to the 1959 agreement between Egypt and Sudan, due to data limitations.
For the purpose of this study, the model was run at a monthly time step, and included only 9 reservoirs and 14 irrigation schemes, representing the existing system as well as the Grand Ethiopian Renaissance dam (GERD) in Ethiopia, which is under construction (Table 1). The analysis covered system optimization to satisfy the demands of the main users in the basin, irrigation and hydropower; it did not cover other impacts of system optimization on reservoir sedimentation, environmental criteria or flood control. The ENOM was not intended for real-time or operational purposes. The operation we attempted to optimize was mid-to-long term operation. For planning purposes, the monthly time step was quite fair, especially in case of over-year storage reservoirs.
The data used in the simulation model were obtained from Digna et al. [46]. The key input data were the physical characteristics of dams, stream flows, evaporation from reservoirs, and irrigation water demands. The data were primarily collected from the Ministry of Water Resources and Electricity of Sudan, ENTRO’s Eastern Nile Simulation Model (ENSM) [42], periodical reports published by the Ministry of Agriculture of Sudan [47], Nile Valley Plan [48], and Roseires Heightening Report [49].

2.3. Scenario Development

Seven scenarios were investigated in this study. All scenarios considered the GERD reservoir to be fully developed and operational; the transient stage of filling the dam was not included in the analysis. The Eastern Nile system in Sudan was assumed to be constrained by the 1959 Agreement in all scenarios, which limits water withdrawals in Sudan to 18.5 × 10⁹ m3/year measured at the AHD. Each scenario was characterized by the criteria of water availability and management. Water management criteria here referred to cooperative and non-cooperative management of the system (two scenarios). Non-cooperative management means optimizing the system of each country to maximize its benefits. The first scenario (S1) is the status quo scenario, of which results have been taken from Digna et al. [46], who used the RIBASIM river basin simulation model to simulate the existing system and management conditions of the Eastern Nile Basin. The simulated network in the (S1) represent the existing system in 2015 before the start of operating Settit Dam on Tekeze–Atbara River. Settit Dam has become operational since 2016; therefore, it is considered as an existing dam and irrigates 16,800 ha (Table 1). The second scenario (S2) represents the Eastern Nile system under cooperative management. The third scenario (S3) corresponds to non-cooperative management of the system. Each of water management scenarios was investigated under three water availability conditions, namely dry, normal and wet hydrological conditions (seven scenarios in total: three hydrologic conditions scenarios × two management scenarios and one status quo). The RIBASIM model developed by Digna et al. [46] is not an economic model, and therefore, partial comparison is conducted using the common parameters, such as generated energy, irrigation supply/demand ratios and evaporation losses.

2.4. Hydrological Conditions Considered

A monthly flow time series of 103 years of the Tekeze–Atbara, Blue Nile and White Nile [42] were analyzed to estimate 7-year periods of dry, normal and wet conditions. Ninety-six periods were generated from 103 years by taking every consecutive 7 years as one period (e.g., period-1 = year 1 to 7, period-2 = year 2 to 8, etc.). The average annual flow of every month in each period was compared with the average in 103 years of each river to define the dry, normal and average conditions (Figure 5). A 7-year time period was chosen to deal with the multi-year storage capacity of the system. The results (Figure 5) showed that the dry, normal, and wet periods of the Blue Nile and Tekeze–Atbara River occurred in 1980–1986, 1917–1923 and 1954–1960, respectively. The White Nile followed a different pattern: the dry, normal and wet periods occurred in 1920–1926, 1910–1916 and 1963–1969, respectively. Since most of Nile water is generated in the Blue Nile, and the major water resources developments will take place in Blue Nile, Tekeze–Atbara and Main Nile rivers, the hydrological periods corresponding to the Blue Nile and Atbara Rivers were considered in the analysis. The model was run on a monthly basis for each hydrologic condition (1980–1986, 1917–1923, and 1954–1960) to assess the sensitivity of optimal reservoir operation to hydrological variability. It is worth mentioning that the annual average of the monthly flow affects the operation of reservoirs because of the inter-annual variability of the Nile River, which is evident [50,51]. The effect varies with the capacity of reservoir: the effect will be small, or there will be no effect in case of over-year-storage reservoirs and large in case of annual-storage reservoirs. We considered, however, the annual average monthly flows to identify the periods of dry, normal and wet conditions, because most small reservoirs in the system are controlled by the two large over-year storages as they are positioned between the upstream GERD and the downstream AHD.

2.5. Model Parameters and Assumptions

A planning horizon of 7 years (T = 84 months) was used to consider the over-year storage capacity of the Eastern Nile system. The planned infrastructure considered in this study was the GERD.
The large infrastructure developments in Ethiopia were assumed to be operated mainly for hydropower. It was assumed that there would not be large irrigation developments on the main stem of the Blue Nile, and only the Tana–Beles irrigation scheme existing in the upstream GERD was considered. No predefined hydro-energy demand was assumed to estimate the hydropower benefits.
The irrigation demand varies between the upstream and the downstream according to the crop water requirement (CWR), which depends on the cropping pattern (crop factors Kc), and reference evapotranspiration (ETo). CWRs have been estimated based on FAO data [42]. Figure A1 in the Appendix A shows the regional variation of ETo, indicating lower CWR in the upper basins and higher CWR in the downstream Main Nile River Basin. The parameter ( ) representing the supply reliability (supply/demand) is used to constrain the maximum and minimum volume of water withdrawn for irrigation. The maximum withdrawal water corresponds to supply equal to demand ( = 1 ), while the minimum amount corresponds to the maximum acceptable water stress for crops, Here, was assumed to be 0.8.
The net price of hydropower generation and water released for irrigation were considered as 0.08 USD/kWh and 0.05 USD/m3, respectively, and were assumed identical throughout the basin. The water value impacts the optimization decision as more water goes, where the highest return can be achieved within certain boundary conditions and constraints. The water return varies between water users and countries; therefore, an economic analysis is required to estimate the water price. Such analysis is beyond the focus of the study; therefore, the economic returns were assumed the same for all countries. Similar assumptions have been made by Goor et al. [10] and Whittington et al. [52]. These values are consistent with international experience [10]. Jeuland et al. [28] used 0.07 and 0.1 USD/kWh for hydropower price without and with power trade between countries, respectively. In our study, the energy transmission and initial infrastructure cost were not included as part of the hydropower generation.

3. Results

The section starts with the results of the economic return from hydro-energy and irrigation of the Eastern Nile system, at the basin level, considering average (normal) hydrologic conditions, i.e., from 1917 to 1923 (water availability) and cooperation and non-cooperation between countries in managing the system. Then, a comparison of various system indicators at the country level under non-cooperative management of the system will be conducted. The section ends with the discussion on the sensitivity of the results to dry and wet hydrologic conditions. Only the sensitivity of the Ethiopian system is discussed here, because Ethiopia contributes more than 85% of the Eastern Nile water yield.

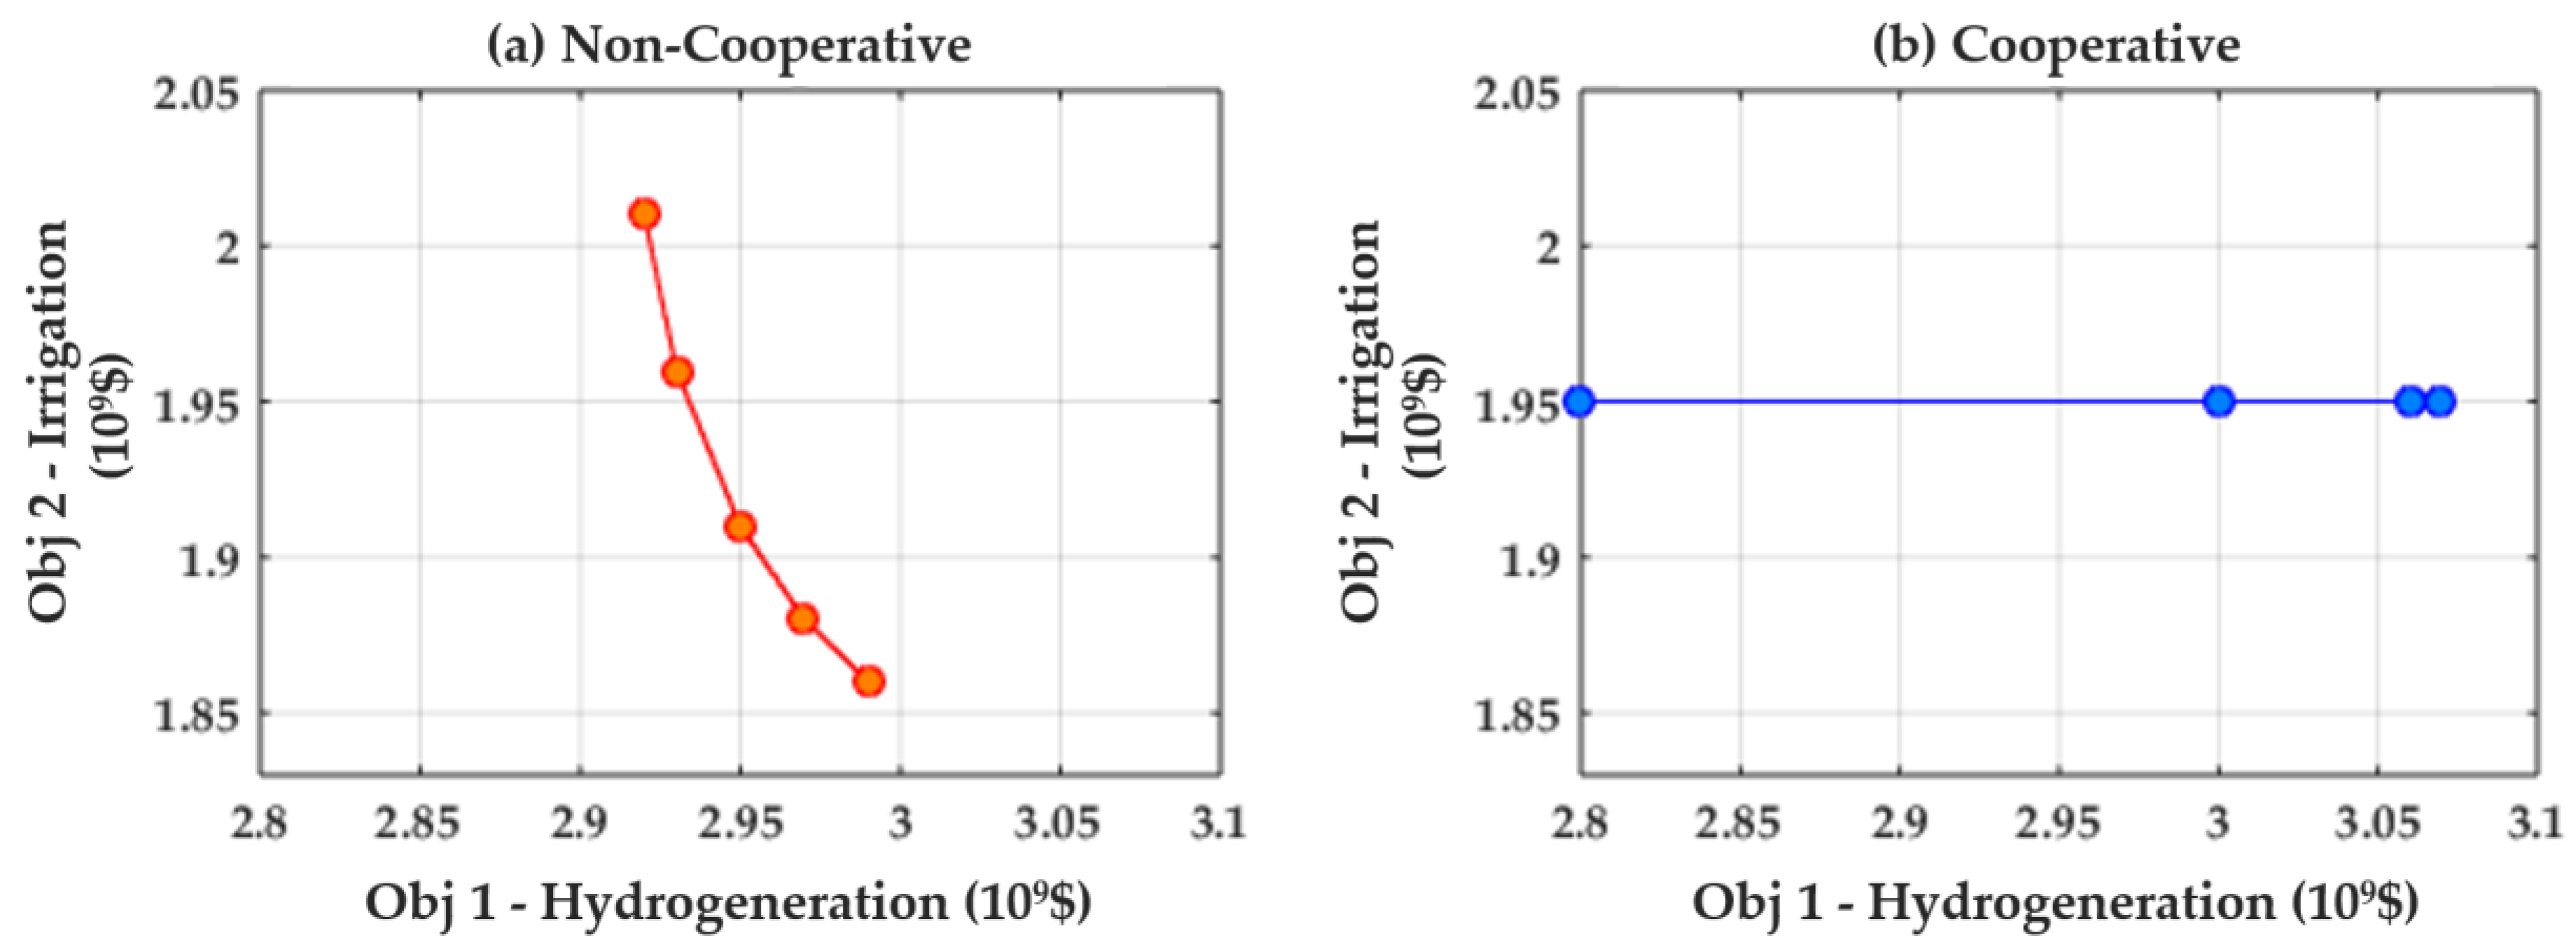
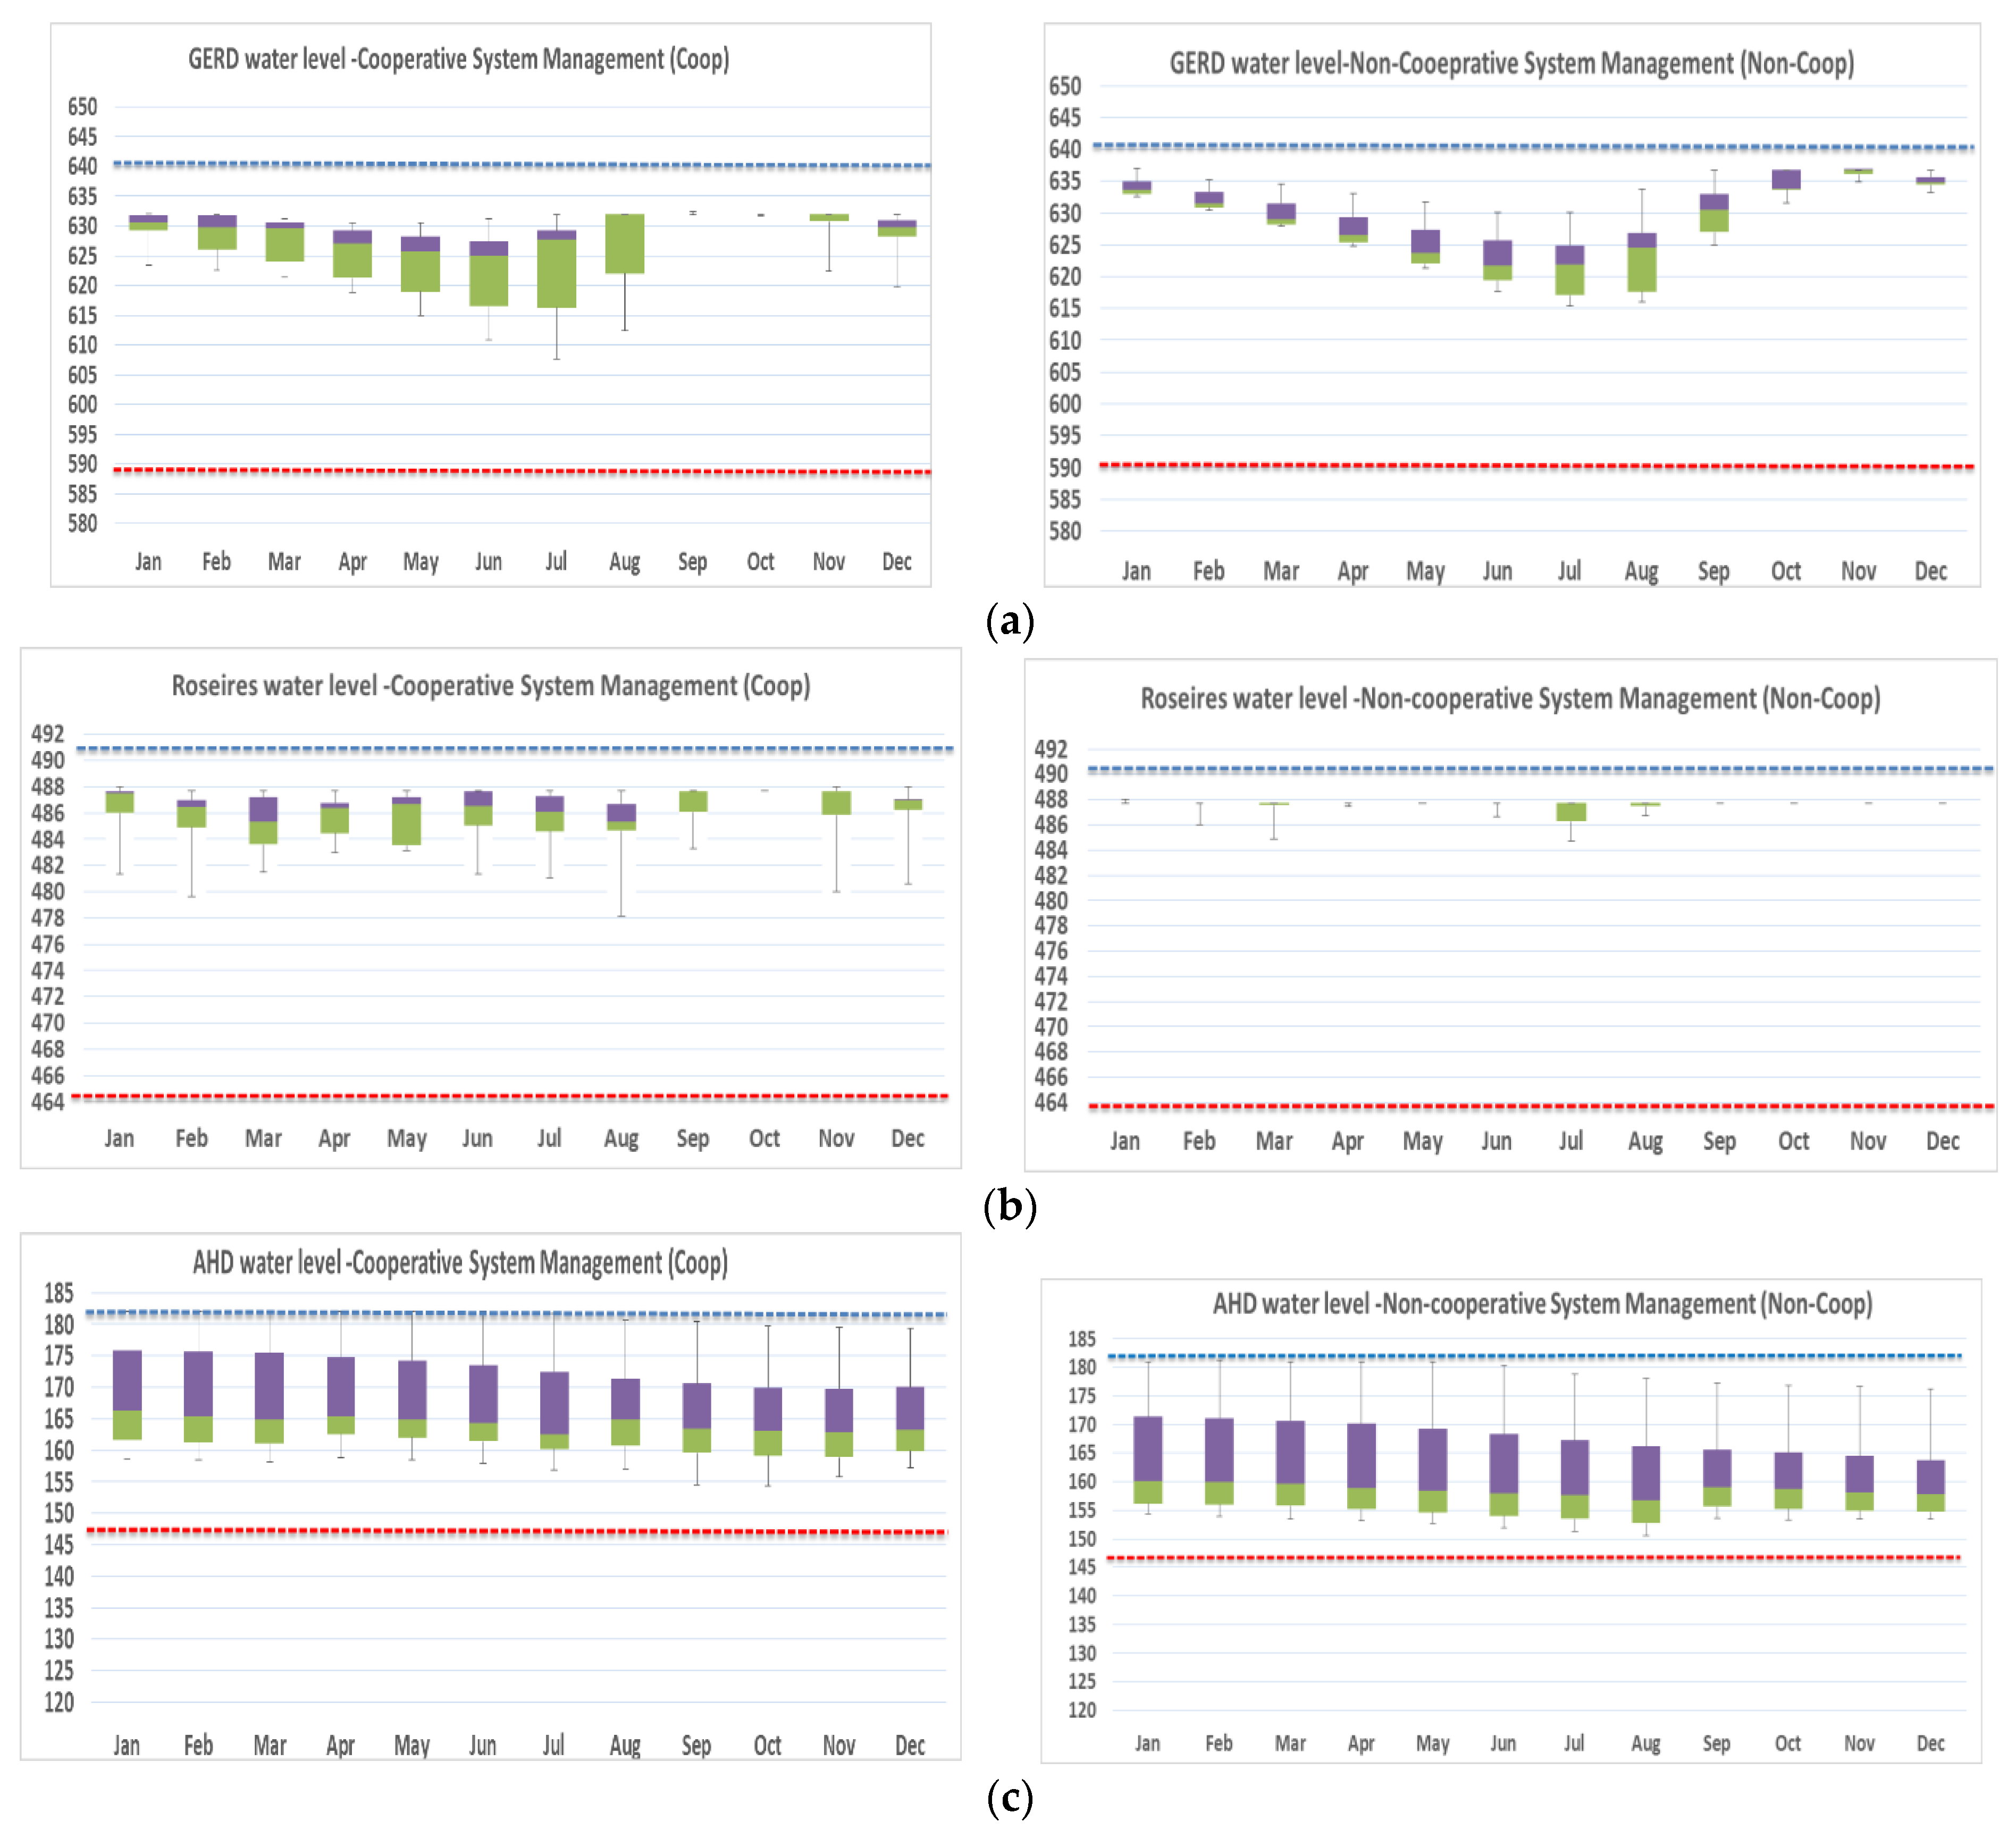
3.1. Cooperative versus Non-Cooperative System Management

In the cooperative system management scenario, the Eastern Nile was optimized as one system and generates system-wide economic returns. In the non-cooperative management scenario, the system within each country was optimized separately, without concern for downstream demands; releases from the optimal system state in the upstream country were used as regulated inflows for optimizing the downstream country’s system. Both irrigation and hydropower objectives had the same weight, and therefore, were optimized simultaneously as a Bi-Objective optimization.
Figure 6 depicts the trade-off between average annual benefits of irrigation and hydro-energy at the basin level, under the two different system management conditions and under normal hydrological conditions, which were plotted for the minimum, 25th percentile, median, 75th percentile and maximum return values of hydro-energy and irrigation, taken from the population of the optimal Pareto set. The results showed that, in case of non-cooperative management, the average irrigation benefits would have a relatively wider margin (1.85 to 2.01 × 10⁹ $/year) compared to the hydro-energy benefits (2.91 to 2.98 × 10⁹ $/year), indicating the sensitivity of irrigation to the management condition. Reduction in the hydro-annual generation return by 1.0 × 10⁶ $/year would increase the irrigation return by 2.3 × 10⁶ $/year. The average annual hydro-energy benefits could increase from 2.8 to 3.1 × 10⁹ $/year without any change in irrigation benefits (1.95 × 10⁹ $/year) under the cooperative system management. The countries where irrigation is dominant would be negatively impacted by the non-cooperative management. In line with findings of Whittington et al. [12], the results showed that the total returns collected from hydro-energy and irrigation are almost equal in both system management scenarios; however, the distribution of this return vary significantly between irrigation and hydro-energy and thus between countries. This is because the upstream country (Ethiopia) has mainly hydropower potential while the downstream countries have both hydropower (HP) and irrigation potential (Sudan and Egypt). Table 2 shows the average total annual return of each country from both hydro-energy and irrigation for both management scenarios and average hydrologic conditions. The results showed that non-cooperative management would have insignificant impacts on the total annual returns for Ethiopia and Sudan, while it would reduce the total returns for Egypt by 7%. Results showed the limited negative impact of the GERD development under the non-cooperative scenario, because the GERD is a non-consumptive water user and our scenarios did not consider possible future additional water abstraction projects in Ethiopia and Sudan. The over-year storage capacity of AHD and its capability to be operated at a lower water level can further reduce these impacts. Our results support the findings of Jeuland et al. [28], which showed that non-cooperative management would reduce the total return for Egypt by 9% compared to cooperative management.
With the GERD in place, hydropower generation would unsurprisingly increase enormously in Ethiopia (Table 3). Hydropower generation in Sudan would benefit from the presence of GERD, in both management scenarios. Interestingly, Egypt would benefit from the GERD in the cooperative management scenario, as its hydropower generation from the AHD would increase by 8.7% and 12.6% compared to the status quo and the non-cooperative scenario, respectively. The large hydro-generation capacity of AHD and its location at the most downstream of the system would encourage the system to release more water towards the AHD for maximizing the hydro-energy generation of the whole system.
Irrigation supply reliability is generally sensitive to the management scenario chosen, with all three countries benefiting from cooperative management (Table 3). In this scenario, both Ethiopia and Egypt are not affected by the GERD, while Sudan sees an irrigation supply reliability decrease from 99% to 86%. This reduction is attributed to the irrigation scheme developed with Settit Dam and the presence of the trade-off between irrigation schemes and downstream hydro-demand of Merowe and AHD.
Total evaporation from reservoirs in the Eastern Nile system, in the cooperative management scenario, would decrease by about 10% with the GERD in full operation (a saving of approximately 1.9 × 10⁹ m3/year). The increase in evaporation from GERD would be less than compensated by a decrease in evaporation from existing reservoirs in Sudan and Egypt. Non-cooperation would increase evaporation rates in Sudan and decrease such rates in Egypt.
Figure 7 depicts box- and whisker-plots of monthly water levels of the GERD, Roseires and AHD reservoirs for the cooperative and non-cooperative management scenarios. The lower and upper dash lines indicate the minimum and maximum operation levels, respectively.
Typical to hydro-electric reservoirs constructed on highly seasonal rivers, the monthly water level of GERD under both cooperative and non-cooperative management scenarios (Figure 7a) would drop (drawdown) during the dry seasons and raise (refill) during the wet season (July–October). Water levels would fluctuate more in the cooperative management scenario.
Figure 7b depicts water levels of Roseires reservoir. The current drawdown-refill cycle (not shown) would disappear with the GERD in place, for both cooperative and non-cooperative scenarios. Interestingly, water level fluctuations would become minimal in case of non-cooperative management.
Under the cooperative management scenario, water levels of the AHD would remain between 154 and 182 m.a.s.l., while these would reduce by 4 m when the system is managed non-cooperatively (Figure 7c). Yet, the minimum operation levels of both management scenarios would still be higher than the current minimum operation level (not shown). The drawdown-refill cycle of AHD would experience a slight shift from the normal seasonal pattern of the Nile River with the GERD in place, indicated by lower water levels in November and December.

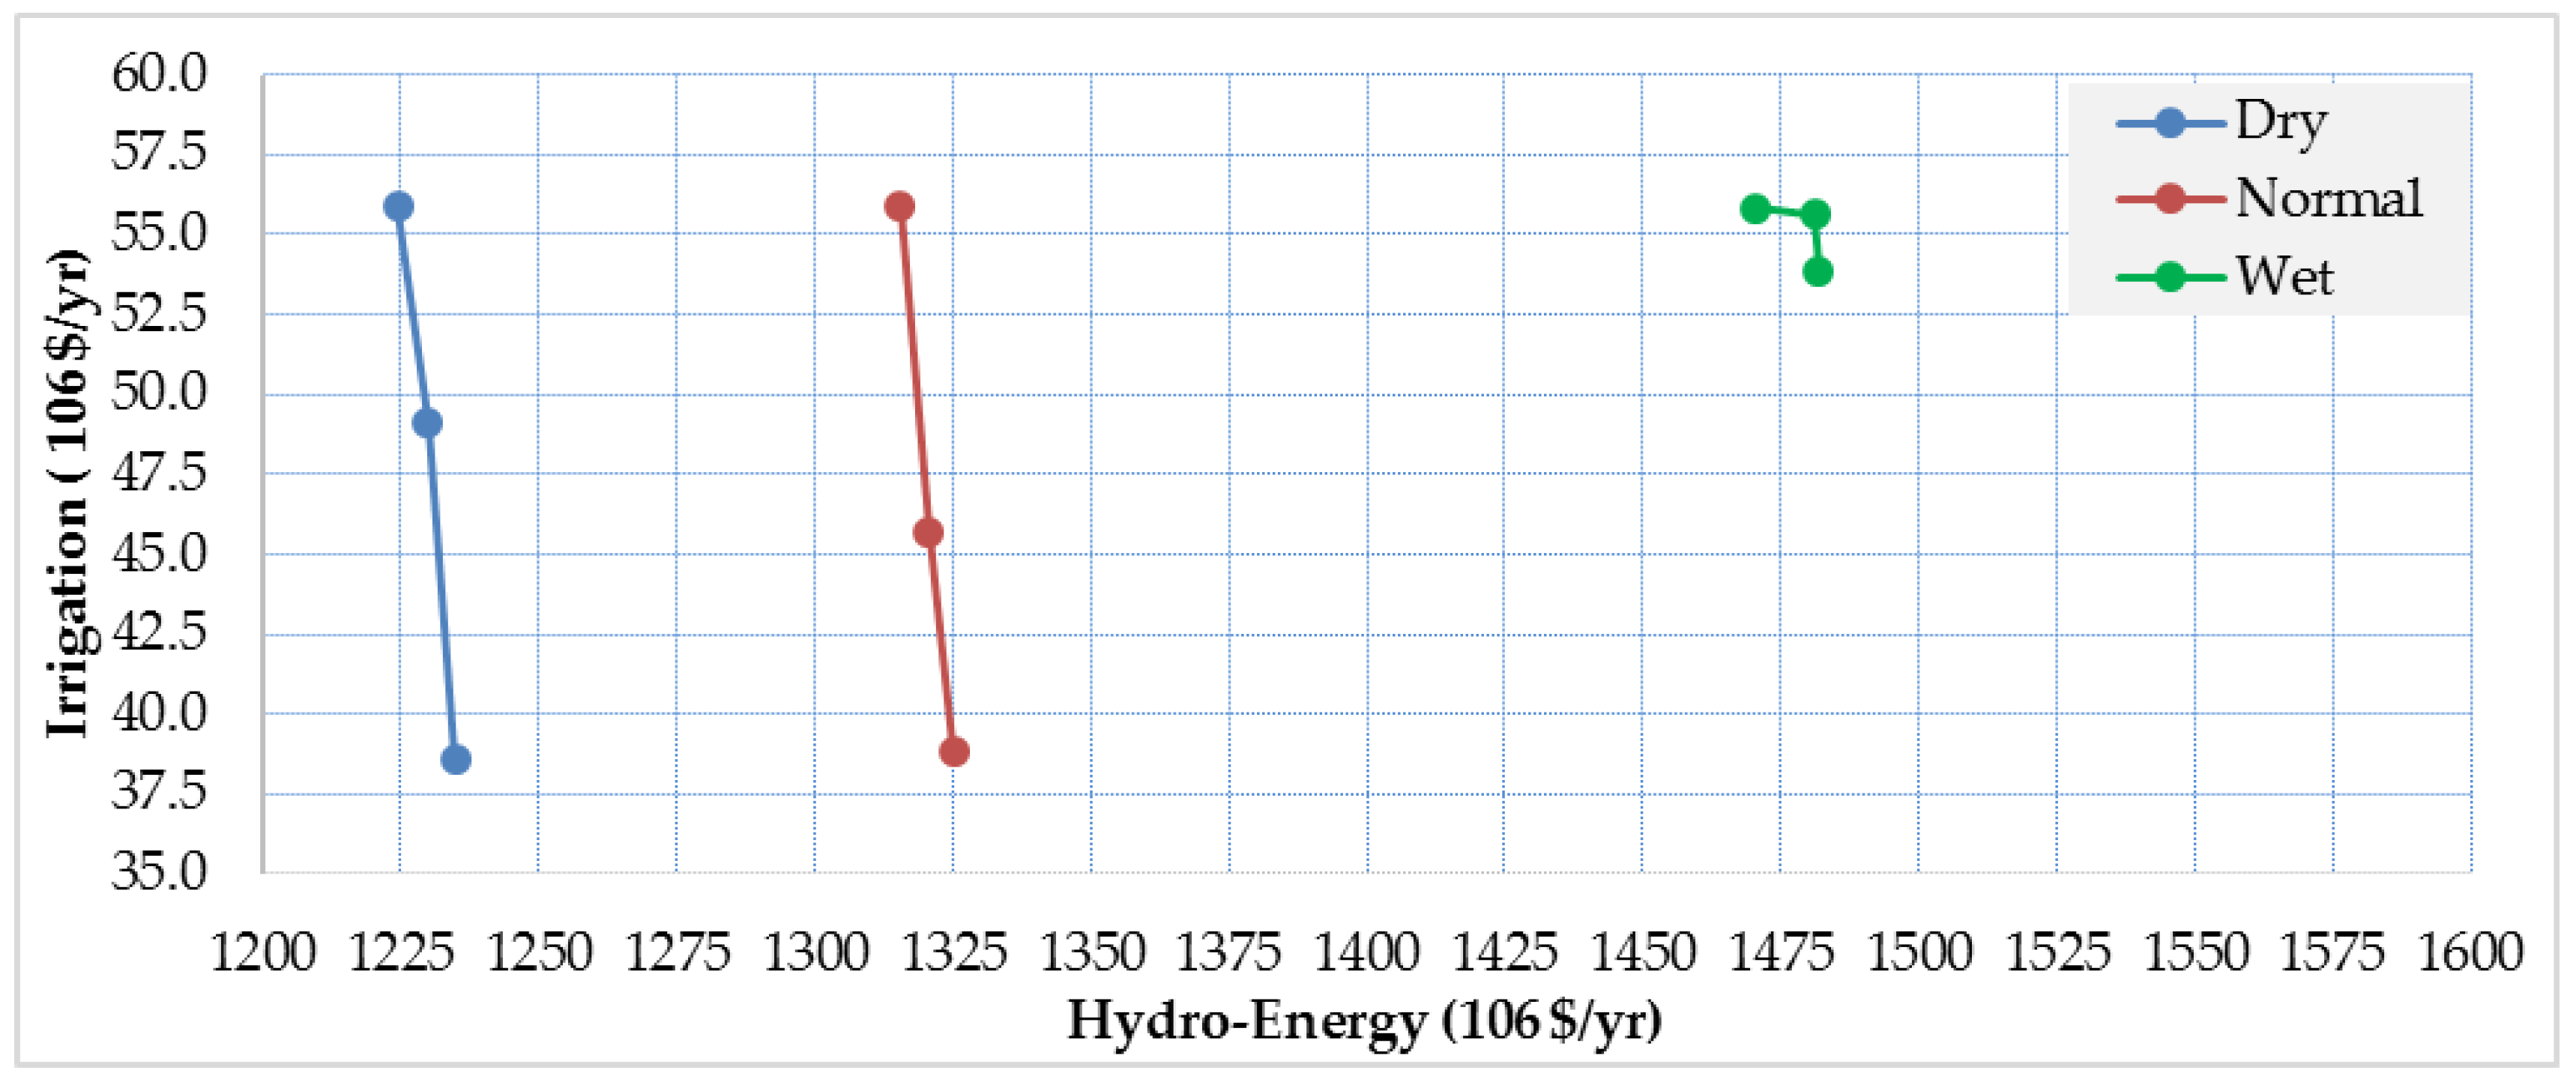
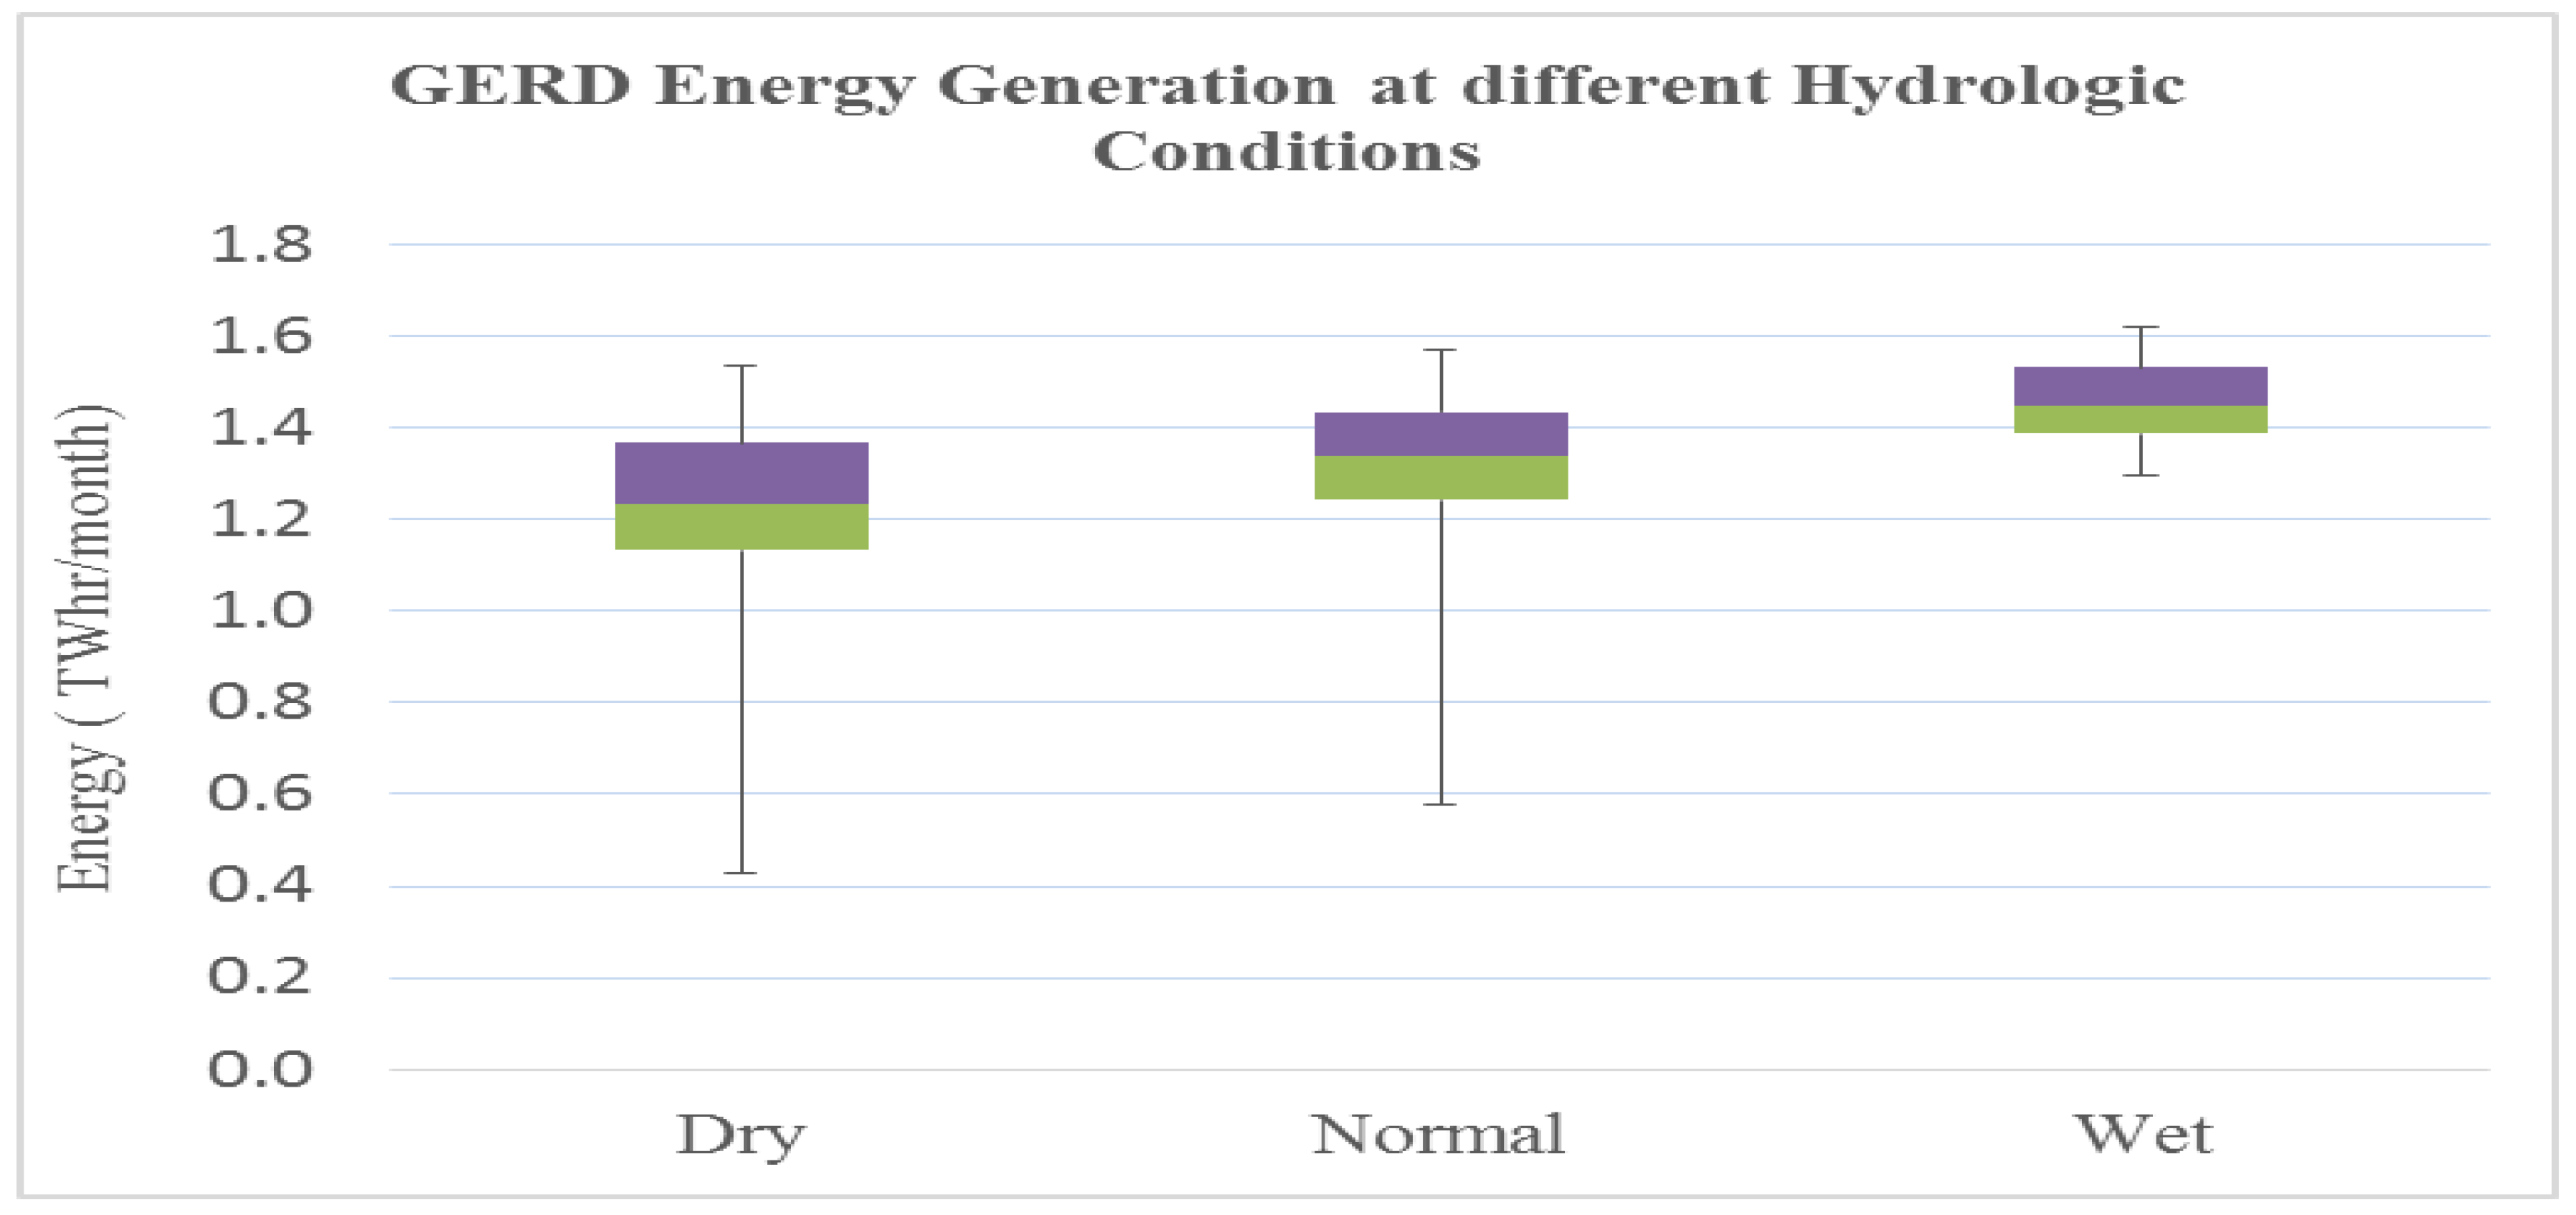
3.2. Hydrologic Sensitivity

The Eastern Nile was optimized for different hydrologic conditions to assess its hydrologic sensitivity. Here, we only presented the results for Ethiopia’s hydrologic sensitivity for the non-cooperative management scenario, which represent the unfavorable condition for the downstream countries. Figure 8 displays the edges of the optimal Pareto set of two objective functions, which are hydropower generation and irrigation of the upstream GERD for the three hydrologic conditions; dry, normal and wet. The results showed that the variation (between min and max) of energy returns is slightly higher in wet conditions. The average returns from energy varies from 1.23 × 10⁹ $/year for dry, 1.33 × 10⁹ $/year for normal hydrologic conditions, and 1.49 × 10⁹ $/year for wet conditions, indicating that energy generation is sensitive to the hydrologic condition, as expected. The variation of the irrigation return is high under dry and normal conditions, but low under wet conditions, because there would be sufficient water to satisfy irrigation demands.
Figure 9 and Table 4 show monthly water levels and releases for the three hydrologic conditions. The change of hydrologic conditions would not significantly change the monthly operating rules of GERD, and the minimum level is about 19 m higher than the designed minimum operation level (590 m.a.s.l.). GERD would have the capability to release the same average volume of water during dry and normal conditions (Table 4), with the minimum and maximum water releases ranging from 1.2–4 × 10⁹ m3/month, while under wet conditions, releases would remain constant at their maximum. The ranges of the monthly firm energy generation of GERD under dry, normal and wet conditions (Figure 10) would be 0.43–1.54, 0.58–1.57, and 1.30–1.62 TWh/month, respectively. Compared to the average (normal) hydrologic conditions, dry conditions would reduce annual average electricity generation from 16.10 to 14.8 TWh/year, a reduction of 8.1%, while wet conditions would increase electricity generation by 7.9%.

4. Discussion

The results showed there is no trade-off between hydro-energy and irrigation at the basin level when they are managed cooperatively (a 260 million $/year increase in hydro-generation would reduce irrigation returns by only 1 million $/year). A clear trade-off is shown in case of non-cooperative system management, and 70 million $/year increase in hydro-generation would result in a 155 million $/year reduction of irrigation returns (Figure 6). Irrigation is more sensitive to the non-cooperative management scenario than hydro-energy, because the majority of irrigation lies in downstream countries, Sudan and Egypt. The results encourage the riparian countries to cooperate, as the benefit would be more than of pursuing non-cooperation option.
The findings support earlier studies that reported the positive impact of GERD development on the three Eastern Nile riparian (i.e., Ethiopia, Sudan and Egypt), if the three countries agreed to manage the Eastern Nile system cooperatively. The hydro-energy returns of all three countries would increase compared to the status quo, with Ethiopia witnessing the highest increase, as expected. Irrigation returns of Ethiopia and Egypt would remain as the status quo (100%), while Sudan would experience a reduction in the irrigation returns (−13%). Additionally, the return of the whole basin would gain because total evaporation losses from reservoirs will decrease due to the GERD, in particular because of the reduced storage at the AHD.
Non-cooperative system management would negatively impact the hydro-energy of Egypt over the cooperative management scenario (11%), without significant increase in Ethiopian hydro-energy. Sudan hydro-generation is less sensitivity (less than 2%) to system management scenario because of its limited hydro-generation capacity as indicated before. Irrigation in all countries showed a high sensitivity to the management scenario, significantly reducing the supply–demand ratio from 12% to 17% in all countries in the non-cooperation scenario. Along with the non-cooperative management, the reduction in irrigation supply is attributed to the presence of a trade-off between hydrogenation and irrigation within each of the two countries of Ethiopia and Sudan. This is because in both countries, hydropower dams are located downstream of the irrigation schemes.
The paper showed the sensitivity of the Eastern Nile system to changing hydrologic conditions by focusing on Ethiopia. The GERD would reduce the average monthly flow to the downstream under normal conditions to nearly 87% of the historical runoff of the Blue Nile at the location of GERD. However, the downstream countries, in particular Sudan, are hardly impacted, not even under dry conditions because of GERD’s capability to regulate the flow and release almost the same volume under dry and normal conditions. Under wet conditions, the GERD would release the same volumes, on average, as the historic runoff.
The results showed the capability of the ENOM to optimize the Eastern Nile Basin. The model can be used for similar basins; however, new objective functions need to be specifically addressed in other rivers with such transboundary implications. The model does not include flow routing, and therefore, cannot handle flood management. The study has not covered other impacts of GERD, such as on sediment management, recession agriculture, and other environmental impacts. The economic value of water in transboundary rivers is very dynamic and varies according to the type (consumptive and non-consumptive) and location (upstream and downstream) of users. The hydropower and irrigation economic returns are, however, assumed the same for the three countries; as such, in depth analysis, the water value at the macro-economic scale is beyond the scope of the study. Kahsay [53] assessed the impact of GERD on the economy of the Eastern Nile countries using a combined hydro-economic optimization model to determine the optimal water allocation, and computable general equilibrium (CGE) to simulate the impact of optimization decisions on the economy of the countries.

5. Conclusions

This article provided a quantitative analysis of the distribution of benefits resulting from the optimal operation of the Eastern Nile system, following the development of the largest hydropower generation infrastructure in the basin, the GERD. A deterministic hydro-economic optimization model for the Eastern Nile Basin, the ENOM, was developed using the GA. The analysis presented a comparison between two extreme system management scenarios, the cooperative and non-cooperative management. In the cooperative management, basin-wide system optimization was carried out, assuming full cooperation between countries to manage the whole Eastern Nile system as one entity. Non-cooperative system management considered optimizing the system within each country without taking into consideration downstream demands. Water withdrawals from the Eastern Nile system within Sudan was constrained in both management scenarios by the 1959 Nile Water Agreement. Sensitivity of the system to water availability was also analyzed. The study concluded that, in case of the Eastern Nile reservoir system managed cooperatively, the basin countries could benefit from the GERD in terms of hydropower generation and maintain regulated flow, without significant change in irrigation supply. One surprising finding is that non-cooperative management would negatively affect the irrigation sector in Ethiopia and Sudan in comparison with cooperative management; this can be explained by the geographic locations of large hydropower dams in the downstream of irrigation areas within these countries.

Author Contributions

The study is part of a PhD research conducted by R.F.D., under supervision of P.v.d.Z., Y.A.M. and S.U. The study concept and methodology was proposed by R.F.D. and approved by the supervisors. R.F.D. conducted data preparation, model setup, code writing, results analysis and writing of the first draft of the article. M.E.C.-G. contributed to the model setup. M.E.C.-G., and G.C. provided computers facilities and software. P.v.d.Z. contributed to the writing and editing of the paper. All authors reviewed the article.

Funding

This research was funded by the Netherlands Fellowship Program (NUFFIC); grant number CF7446/2011.

Acknowledgments

The authors would like to acknowledge the SURFSARA (https://www.surf.nl/en) and its high-performance computing facilities, where part of the simulations and optimizations were performed within the project e-infra170076.

Conflicts of Interest

The authors declare no conflicts of interest. The funding sponsors had no role in the design of the study, nor in the collection, analyses, or interpretation of data, in the writing of the manuscript, nor in the decision to publish the results.

Appendix A

Figure A1. The monthly reference evapo-transpiration (ET0) at different locations in the Eastern Nile Basin. Source: Digna et al., 2018.
Water 10 00921 g0a1
Table A1. Major reservoirs, hydropower plants and irrigation projects in the Eastern Nile. Sources: Verhoeven, (2011); Goor, (2010); ENTRO, (2007); Van der Krogt and Ogink, (2013).
CountryRiver/Project NameStatusHydropower Capacity in 2017 (Potential Capacity) (MW)Reservoir Capacity in 2017 (Potential Capacity) (m3)Irrigation Area in 2017 (Potential Irrigated Area) (ha)
EthiopiaTekeze
Tekeze VOperating since 20093009.3 × 10945,000
Lake Tana tributaries
Tana–Beles River TransferOperating since 20104609.1 × 109 (volume of water from Lake Tana for power production)140,000
Abbay (Blue Nile)
Tis Abbay IOperating since 196411.4 50,000
Tis Abbay IIOperating since 200168–85
GERDUnder construction(6450)(74 × 109)
Baro River and tributaries
Sor, tributary of GebaOperating since 19905
Alwero Irrigation Project, Alwero riverOperating since 1995N/A 74,600
BaroI and II, Baro RiverProposed under ENSAP, NBI(850–896)
Geba I and II, Geba RiverProposed under ENSAP, NBI(254–366)
Birbir A and BProposed, feasibility studies ongoing(467–508)
TamsProposed, feasibility studies ongoing(1000)
SudanAtbara and tributaries
Khashm ElgirbaOperating since 19647
(12.5)
1.3 × 109206,600
Rumela and Burdana Complex Dam in Settit RiverOperating since 20163202.7 × 109(300,000)
Blue Nile
Roseires DamOperating since 1966; Dam heightening completed in 2013100
(275)
2.2 × 10⁹
3.7 × 10⁹
Sennar DamOperating since 1925; Rehabilitation—ongoing15
(45)
0.6 × 10⁹
(0.9 × 10⁹)
870,700
White Nile
Jebel Aulia, White NileOperated since 1937
Rehabilitated in 2005
30.4–353.5 × 109152,300
Main Nile
Merowe, 4th Cataract, NileOperating since 20091250
(2000)
12.5 × 109380,000
EgyptMain Nile
High Aswan DamOperating2100162 × 109
Old Aswan DamOperating500
EsnaOperating90
AssyutOperating(32) 690,000
DeltaOperating---- 305,000
Naga HammadiOperating64 320,000

References

  1. Chow, V.T.; Cortes-Rivera, G. Application of Dddp in Water Resources Planning; University of Illinois at Urbana-Champaign: Urbana, IL, USA, 1974. [Google Scholar]
  2. Kougias, I.P.; Theodossiou, N.P. Application of the harmony search optimization algorithm for the solution of the multiple dam system scheduling. Optim. Eng. 2013, 14, 331–344. [Google Scholar] [CrossRef]
  3. Larson, R.E. State Increment Dynamic Programming; Elsevier Applied Science: London, UK, 1968. [Google Scholar]
  4. Murray, D.M.; Yakowitz, S.J. Constrained differential dynamic programming and its application to multireservoir control. Water Resour. Res. 1979, 15, 1017–1027. [Google Scholar] [CrossRef]
  5. Wardlaw, R.; Sharif, M. Evaluation of genetic algorithms for optimal reservoir system operation. J. Water Resour. Plan. Manag. 1999, 125, 25–33. [Google Scholar] [CrossRef]
  6. Sadoff, C.W.; Grey, D. Beyond the river: The benefits of cooperation on international rivers. Water Policy 2002, 4, 389–403. [Google Scholar] [CrossRef]
  7. Salman, S.M.A. The grand ethiopian renaissance dam: The road to the declaration of principles and the khartoum document. Water Int. 2016, 41, 512–527. [Google Scholar] [CrossRef]
  8. Samaan, M.M. The Win-Win-Win Scenario in the Blue Nile’s Hydropolitical Game: Application on the Grand Ethiopian Renaissance Dam; GESIS-Leibniz-Institut für Sozialwissenschaften: Mannheim, Germany, 2014. [Google Scholar]
  9. Wu, X.; Whittington, D. Incentive compatibility and conflict resolution in international river basins: A case study of the nile basin. Water Resour. Res. 2006, 42, W02417. [Google Scholar] [CrossRef]
  10. Goor, Q.; Halleux, C.; Mohamed, Y.; Tilmant, A. Optimal operation of a multipurpose multireservoir system in the eastern nile river basin. Hydrol. Earth Syst. Sci. 2010, 14, 1895–1908. [Google Scholar] [CrossRef]
  11. Jeuland, M. Planning Water Resources Development in an Uncertain Climate Future: A Hydro-Economic Simulation Framework Applied to the Case of the Blue Nile; The University of North Carolina at Chapel Hill: Ann Arbor, MI, USA, 2010. [Google Scholar]
  12. Whittington, D.; Wu, X.; Sadoff, C. Water resources management in the nile basin: The economic value of cooperation. Water Policy 2005, 7, 227–252. [Google Scholar] [CrossRef]
  13. Cascão, A.E. Changing power relations in the nile river basin: Unilateralism vs. Cooperation. Water Alternat. 2009, 2, 245–268. [Google Scholar]
  14. McCartney, M.P.; Menker Girma, M. Evaluating the downstream implications of planned water resource development in the Ethiopian portion of the blue nile river. Water Int. 2012, 37, 362–379. [Google Scholar] [CrossRef]
  15. Mirchi, A.; Waktins, D., Jr.; Madani, K. Modeling for Watershed Planning, Management, and Decision Making. Watersheds: Management, Restoration, and Environmental Impact; Nova Science Publishers: New York, NY, USA, 2010. [Google Scholar]
  16. Brown, C.M.; Lund, J.R.; Cai, X.; Reed, P.M.; Zagona, E.A.; Ostfeld, A.; Hall, J.; Characklis, G.W.; Yu, W.; Brekke, L. The future of water resources systems analysis: Toward a scientific framework for sustainable water management. Water Resour. Res. 2015, 51, 6110–6124. [Google Scholar] [CrossRef] [Green Version]
  17. Wurbs, R.A. Reservoir-system simulation and optimization models. J. Water Resour. Plan. Manag. 1993, 119, 455–472. [Google Scholar] [CrossRef]
  18. Yeh, W.W.G. Reservoir management and operations models: A state-of-the-art review. Water Resour. Res. 1985, 21, 1797–1818. [Google Scholar] [CrossRef]
  19. Madani, K. Game theory and water resources. J. Hydrol. 2010, 381, 225–238. [Google Scholar] [CrossRef]
  20. Dinar, A.; Nigatu, G.S. Distributional considerations of international water resources under externality: The case of Ethiopia, Sudan and Egypt on the blue nile. Water Resour. Econ. 2013, 2–3, 1–16. [Google Scholar] [CrossRef]
  21. Elimam, L.; Rheinheimer, D.; Connell, C.; Madani, K. In An ancient struggle: A game theory approach to resolving the nile conflict. In Proceeding of the 2008 World Environmental and Water Resources Congress; American Society of Civil Engineers: Honolulu, HI, USA, 2008; pp. 1–10. [Google Scholar]
  22. Digna, R.F.; Mohamed, Y.A.; van der Zaag, P.; Uhlenbrook, S.; Corzo, G.A. Nile river basin modelling for water resources management—A literature review. Int. J. River Basin Manag. 2017, 15, 39–52. [Google Scholar] [CrossRef]
  23. Georgakakos, A.P. Decision Support Systems for Integrated Water Resources Management with an Application to the Nile Basin; Topics on System Analysis and Integrated Water Resource Management; Elsevier: Amsterdam, The Netherlands, 2007. [Google Scholar]
  24. Guariso, G.; Whittington, D. Implications of ethiopian water development for Egypt and Sudan. Int. J. Water Resour. Dev. 1987, 3, 105–114. [Google Scholar] [CrossRef]
  25. Block, P.; Strzepek, K. Economic analysis of large-scale upstream river basin development on the blue nile in Ethiopia considering transient conditions, climate variability, and climate change. J. Water Resour. Plan. Manag. 2010, 136, 156–166. [Google Scholar] [CrossRef]
  26. Block, P.J.S.; Balaji, K.R. Integrated management of blue nile basin in ethiopia under climate variability and change hydropower and irrigation modeling. In IFPRI Discussion Papers; International Food Policy Research Institute (IFPRI): Washington, DC, USA, 2007. [Google Scholar]
  27. Guariso, G.; Haynes, K.E.; Whittington, D.; Younis, M. A real-time management model for the aswan high dam with policy implications. Geograph. Anal. 1981, 13, 355–372. [Google Scholar] [CrossRef]
  28. Jeuland, M.; Wu, X.; Whittington, D. Infrastructure development and the economics of cooperation in the eastern nile. Water Int. 2017, 42, 121–141. [Google Scholar] [CrossRef]
  29. Satti, S.; Zaitchik, B.; Siddiqui, S. The question of Sudan: A hydroeconomic optimization model for the sudanese nile. Hydrol. Earth Syst. Sci. Discuss. 2014, 11, 11565–11603. [Google Scholar] [CrossRef]
  30. Arjoon, D.; Mohamed, Y.; Goor, Q.; Tilmant, A. Hydro-economic risk assessment in the eastern nile river basin. Water Resour. Econ. 2014, 8, 16–31. [Google Scholar] [CrossRef]
  31. Habteyes, B.G.; Hasseen El-bardisy, H.A.E.; Amer, S.A.; Schneider, V.R.; Ward, F.A. Mutually beneficial and sustainable management of Ethiopian and Egyptian dams in the nile basin. J. Hydrol. 2015, 529, 1235–1246. [Google Scholar] [CrossRef]
  32. Lee, Y.; Yoon, T.; Shah, F. Optimal watershed management for reservoir sustainability: An economic appraisal. J. Water Resour. Plan. Manag. 2012, 139, 129–138. [Google Scholar] [CrossRef]
  33. Hassaballah, K.; Jonoski, A.; Popescu, I.; Solomatine, D. Model-based optimization of downstream impact during filling of a new reservoir: Case study of mandaya/roseires reservoirs on the blue nile river. Water Resour. Manag. 2012, 26, 273–293. [Google Scholar] [CrossRef]
  34. Li, F.; Shoemaker, C.; Wei, J.; Fu, X. Estimating maximal annual energy given heterogeneous hydropower generating units with application to the three gorges system. J. Water Resour. Plan. Manag. 2013, 139, 265–276. [Google Scholar] [CrossRef]
  35. Loucks, D.P.; Van Beek, E. Water Resources Systems Planning and Management an Introduction to Methods, Models, and Applications; United Nations Educational, Sceintific and Cultural Organization: Paris, France, 2005. [Google Scholar]
  36. Rani, D.; Moreira, M. Simulation–optimization modeling: A survey and potential application in reservoir systems operation. Water Resour. Manag. 2010, 24, 1107–1138. [Google Scholar] [CrossRef]
  37. Nicklow, J.; Reed, P.; Savic, D.; Dessalegne, T.; Harrell, L.; Chan-Hilton, A.; Karamouz, M.; Minsker, B.; Ostfeld, A.; Singh, A.; et al. State of the art for genetic algorithms and beyond in water resources planning and management. J. Water Resour. Plan. Manag. 2010, 136, 412–432. [Google Scholar] [CrossRef]
  38. Rashid, M.U.; Shakir, A.S.; Khan, N.M.; Latif, A.; Qureshi, M.M. Optimization of multiple reservoirs operation with consideration to sediment evacuation. Water Resour. Manag. 2015, 29, 2429–2450. [Google Scholar] [CrossRef]
  39. Momtahen, S.; Dariane, A. Direct search approaches using genetic algorithms for optimization of water reservoir operating policies. J. Water Resour. Plan. Manag. 2007, 133, 202–209. [Google Scholar] [CrossRef]
  40. Hakimi-Asiabar, M.; Ghodsypour, S.H.; Kerachian, R. Deriving operating policies for multi-objective reservoir systems: Application of self-learning genetic algorithm. Appl. Soft Comput. 2010, 10, 1151–1163. [Google Scholar] [CrossRef]
  41. Philbrick, C.R.; Kitanidis, P.K. Limitations of deterministic optimization applied to reservoir operations. J. Water Resour. Plan. Manag. 1999, 125, 135–142. [Google Scholar] [CrossRef]
  42. Van der Krogt, W.N.M.; Ogink, I.H.J.M. Development of the Eastern Nile Water Simulation Model, Main Report; Deltares: Delft, The Netherlands, 2013. [Google Scholar]
  43. NBI. The State of the River Nile Basin 2012; Nile Basin Initiative: Entebbe, Uganda, 2012. [Google Scholar]
  44. Harou, J.J.; Pulido-Velazquez, M.; Rosenberg, D.E.; Medellín-Azuara, J.; Lund, J.R.; Howitt, R.E. Hydro-economic models: Concepts, design, applications, and future prospects. J. Hydrol. 2009, 375, 627–643. [Google Scholar] [CrossRef] [Green Version]
  45. Oven-Thompson, K.; Alercon, L.; Marks, D.H. Agricultural vs. Hydropower tradeoffs in the operation of the high aswan dam. Water Resour. Res. 1982, 18, 1605–1613. [Google Scholar] [CrossRef]
  46. Digna, R.F.; Mohamed, Y.A.; Zaag, P.V.D.; Uhlenbrook, S.; Krogt, W.V.D.; Corzo, G. Impact of water resources development on water availability for hydropower production and irrigated agriculture of the eastern nile basin. J. Water Resour. Plan. Manag. 2018, 144, 05018007. [Google Scholar] [CrossRef]
  47. Ministry-of-Agriculture. Timeseries of Area Planted, Harvested, Production & Yield Data of the Main Food & Oil Crops by Production Centers & Type of Irrigation; Ministry of Agriculture: Khartoum, Sudan, 2013.
  48. Morrice, H.A.W.; Allan, W.N. Report on the Nile Valley Plan. Volume(1); Ministry of Water Resources and Electricity: Khartoum, Sudan, 1958.
  49. McLellan, M.A. Updating of the Feasibility Study for the Heightening of Roseires Dam; Final Report; SIR Alexander Gibb & Partners: Westminster, UK, 1987. [Google Scholar]
  50. Eltahir, E.A.B. El niño and the natural variability in the flow of the nile river. Water Resour. Res. 1996, 32, 131–137. [Google Scholar] [CrossRef]
  51. Siam, M.S.; Eltahir, E.A.B. Explaining and forecasting interannual variability in the flow of the nile river. Hydrol. Earth Syst. Sci. 2015, 19, 1181–1192. [Google Scholar] [CrossRef]
  52. Whittington, D. Visions of nile basin development. Water Policy 2004, 6, 1–24. [Google Scholar] [CrossRef]
  53. Kahsay, T.N. Towards Sustainable Water Resources Management in the Nile River Basin. A Global Computable General Equilibrium Analysis; University of Amsterdam: Amsterdam, The Netherlands, 2017. [Google Scholar]
Figure 1. The Nile River Basin (NBI [43]).
Water 10 00921 g001
Figure 2. The seasonal contribution of sub-basins.
Water 10 00921 g002
Figure 3. The Eastern Nile River system.
Water 10 00921 g003
LTLTana_Charachara(E) R11Atbr_smalIrr_Ir(E)-Angereb River RR2BN_TanaBeless_Hp(E)I11WN_WNPrjcts-sonds(E)
R1BNile_Karadobi_Hp(P) R12Atb_Metama_Hp(P) I1BN_BelesUpprLowr(E) I12WN_WNileSuger(P)
R2BNile_BekoAbo Hp(P) R13Atb_Settit_IrHp(P) I2BN_UpSennar(E) I13MN_Atbara(E)
R3BNile_Mendaya_Hp(P) R14Atb_KGirba_IrHp(E) I3BN_GeziraMenagil(E) I14Atb_smallscale(E)
R4BNile_GERD Hp(P) R15MNile_Sheriq_Hp(E) I4BN_Kenana(K1-K4) (P) I15Atb_Hummera(P)
R5BN_Roseires_IrHp(E) R16MNile_Mograt_Hp(P) I5BN_Rahad-2(P) I16Atb_Metema(P)
R6BNile_Sennar_IrHp(E) R17MNile_Merowe_IrHp(E) I6BN_USennarRahad-I(E) I17Atb_Settit(P)
R7WNile_JAulia_IrHp(E) R18MNile_Kajabar_Hp(P) I7BN_GinaidBNpumps(E) I18Atb_NewHalfa(E)
R8MNile_Sbloga_IrHp(P) R19MNile_Dal_Hp(P) I8WN_Malakal-Melut(P) I19Atb_UpperAtbara(P)
R9Atb_TK5_Hp(E) R20MNile_AHD_Hp(E) I9WN_Kenana-I(E) I20MN_PumpScheme(E)
R10Atb_Humera_IrHp(P) RR1BN_TissAbbay_Hp(E)I10WN_AsalyaSuger(E) I21MN_Merowe(E)
Figure 4. Conceptual framework of Eastern Nile Optimization Model (ENOM).
Water 10 00921 g004
Figure 5. Consecutive dry, normal and wet periods with average flow of Tekeze–Atbara River, the Blue and White Nile, estimated from 103-year monthly flow data (e.g., January = month 1).
Water 10 00921 g005
Figure 6. Trade-off between annual hydro-generation and irrigation benefits. Optimal Pareto Front of two objective functions over the optimization period for: (a) non-cooperative system management (Non-Coop), and (b) cooperative system management (Coop) of the Eastern Nile Basin, under normal hydrologic conditions.
Water 10 00921 g006
Figure 7. Boxplot of the monthly water level of GERD (a), Roseires (b), and AHD (c) for both cooperative (Coop) and non-cooperative (Non-Coop) Eastern Nile system optimization, under normal hydrological conditions.
Water 10 00921 g007
Figure 8. Optimal Pareto Front of two objective functions for Ethiopia’s part of the Eastern Nile system for three hydrologic conditions (dry, normal and wet) for the non-cooperative management scenario.
Water 10 00921 g008
Figure 9. Monthly water levels of the GERD for three hydrologic conditions over the entire 7-year period considered.
Water 10 00921 g009
Figure 10. Monthly energy generation of the GERD at three hydrologic conditions.
Water 10 00921 g010
Table 1. Eastern Nile hydropower and irrigation systems included in the analysis.
Name (Country)RiverHydropower Capacity (MW)Lateral Irrigation
Name Irrigated Area (ha)
GERD (Ethiopia)Blue Nile5250Beles138,720
Roseires (Sudan)Blue Nile280Upper Sennar131,040
Rahad126,000
Sennar (Sudan)Blue Nile15Gezira & Managil880,000
Ginaid60,060
Jabel Aulia (Sudan)Nile28.8Kenana37,800
Asalya 23,520
WN Sugar63,000
WNProjects214,200
TK5 (Ethiopia)Tekeze–Atbara300-------------------
Settit (Sudan)Tekeze–Atbara320Upper Atbara168,000
Khasm Elgirba (Sudan)Tekeze–Atbara10.6New Halfa168,420
Merowe (Sudan)Main Nile1250Main Nile230,706
Aswan High Dam (Egypt)Main Nile2100------------------
Table 2. Summary of financial returns comparing cooperative and non-cooperative management scenarios.
EthiopiaSudanEgypt
Coop.Non-Coop.Coop.Non-Coop.Coop.Non-Coop.
Average annual returns from combined hydropower and irrigation (Million $/year)136313721676166319741827
Table 3. Summary of key performance criteria comparing the status quo (without the GERD) with the cooperative and non-cooperative management scenarios.
EthiopiaSudanEgypt
Status quoCoop.Non-Coop.Status quoCoop.Non-Coop.Status quoCoop.Non-Coop.
Annual energy generation (TWh/year)1.3816.416.87.69.559.3911.512.511.1
Irrigation supply reliability (supply/demand) (%)10010087.598.985.581.510010087.8
Annual reservoir evaporation rate (109 m3/year)0.2052.802.825.265.987.6613.308.076.94
Table 4. Monthly water levels and releases of the GERD.
Water Level (m.a.s.l.)Water Releases (109 m3/month)
DryNormalWetDryNormalWet
Minimum6106156141.191.644.00
Average6296306293.473.614.00
Maximum6406406404.004.004.00

