Article

An Integrated Water-Saving and Quality-Guarantee Uncertain Programming Approach for the Optimal Irrigation Scheduling of Seed Maize in Arid Regions

1
Center for Agricultural Water Research in China, College of Water Resources and Civil Engineering, China Agricultural University, Beijing 100083, China
2
Key Laboratory of Agricultural Water Resources, The Center for Agricultural Resources Research, Institute of Genetics and Developmental Biology, The Chinese Academy of Sciences, Shijiazhuang 050021, China
*
Author to whom correspondence should be addressed.
Water 2018, 10(7), 908; https://doi.org/10.3390/w10070908
Submission received: 22 May 2018 / Revised: 30 June 2018 / Accepted: 2 July 2018 / Published: 9 July 2018
(This article belongs to the Special Issue Data-Driven Methods for Agricultural Water Management)

Abstract

:
With population growth and water scarcity, efficient crop production has drawn attention worldwide. In the Hexi Corridor, the largest production base of maize seed in China, it is desired to develop efficient irrigation strategies for seed maize. Considering the double criteria of yield and seed quality, an integrated water-saving and quality-guarantee uncertain programming approach (IWQUP) was developed in this study to help with agricultural sustainable development. The IWQUP combined deficit irrigation theory, soil-water balance, and multiple uncertainties. The water-flowering model (WFM) and kernel weight prediction model with water production functions were used to reflect the relationship among water consumption, crop yield, and seed quality. Meanwhile, to deal with the widespread existence of uncertainties in nature and the decision-making process, interval programming and fuzzy programming were integrated within the framework of IWQUP, along with the use of the genetic algorithm and Monte Carlo simulation. The results showed that when the climatic condition is moist, decision-makers may use a low tolerance level in order to reduce the water waste, enhance the water use efficiency, and guarantee a relatively high seed quality. When the climate is harsh, a high tolerance level to water use constraints is recommended in order to guarantee yield. In addition, optimistic decision-makers could choose a relatively high tolerance level, but in moist years they should be careful in order to avoid water waste. The established model was compared with three other models to represent its practicability for offering decision-makers various references under different scenarios.

1. Introduction

With climate change, population growth, and environmental pollution, fresh water has become increasingly scarce across the world [1,2]. As one of the most important industries and one of the largest water-consuming sectors, agriculture requires more efficient crop production with less water consumption to guarantee its sustainable development and food security [3,4,5]. This is a challenge for agricultural water resources management, especially in arid areas with low precipitation and high evaporation rates, such as the Hexi Corridor in northwestern China. In these areas, irrigation is the main activity used to improve crop production [6,7]. Due to sufficient light and heat resources, the Hexi Corridor produces the largest amount of maize seed in China, accounting for about 60% of the country’s total yield [8,9]. Therefore, there is an urgent need to develop an efficient irrigation strategy for seed maize in northwestern China.
The agricultural water use in arid regions has been reported in many previous studies. Among these studies, deficit irrigation (DI) has proved to be a sustainable irrigation strategy based on crop water production function (WPF) [10]. WPF can reflect not only the relationship between crop yield and evapotranspiration (ET), but also the sensitivities of crop growth to water at different stages. According to WPF, water supply is usually given priority to drought-sensitive growth stages to enhance water use efficiency, while it is limited in drought-tolerant growth stages [11,12,13,14]. Meanwhile, since seed maize is cultivated to obtain hybrid maize seeds, the seed quality is a critical factor for farmers, even more important than yield once the yield has reached a certain level. In some recent studies, the response of seed quality to water was also investigated. Westgate [15] showed the effect of water deficit on the endosperm and embryo of maize during grain fill. Borrás and Westgate [16] found the relationship between maize kernel sink capacity and moisture content. Wang et al. [17] investigated the response of flowering characteristics and yield components of maize to water deficit. Lizaso et al. developed a flowering model to simulate the kernel number based on the flowering characteristics [18]. Besides the kernel number, kernel weight is also an important criterion to evaluate seed quality. Borrás and Otegui [19] established a linear model to reflect the response of kernel weight to the source-sink ratio. Then a hyperbolic model was adopted to improve the simulation of the kernel weight [20]. Wang [21] further integrated the flowering model and kernel weight prediction model with WPF. Although these previous efforts are encouraging, there is still a lack of integrated irrigation plans that can not only guarantee yield and seed quality, but also reduce water consumption simultaneously.
Optimization models have been used as an efficient method to generate sustainable irrigation strategies and support irrigation water resources management [22,23,24,25,26,27,28,29,30,31,32]. Recent studies in this area have mainly focused on three aspects. (1) Hydrological process, for example, soil-water balance, was integrated within the optimization models to make irrigation planning more suitable and practical for local natural conditions. (2) Cropping mechanism such as ET simulation was considered to obtain more accurate crop water consumption. (3) Uncertainty programming and prediction models were investigated due to the complexity of the agricultural system. In order to consider both of the former two aspects, a simulation model is needed, thus making the optimization model nonlinear and difficult to be solved by traditional methods. The use of simulation models could also be limited by the available data. In addition, the model would be very generic and lack practicability if it only considered the last aspect above. Although these three aspects are all important for making practical irrigation strategies, few studies have attempted to integrate all of the aforementioned aspects into a framework. It is expected that an optimization approach that fully considers all three aspects could be developed to solve irrigation problems.
Therefore, this study aims to develop an integrated water-saving and quality-guarantee uncertain programming (IWQUP) approach for seed maize irrigation strategies to improve the efficient use of limited water resources in an arid area, combining deficit irrigation theory, soil-water balance, and multiple uncertainties. The water-flowering model (WFM) and kernel weight prediction model with WPFs are used to reflect the relationship among water consumption, crop yield, and seed quality. Meanwhile, to deal with the widespread existence of uncertainties in nature and the decision-making process, interval programming and fuzzy programming will be integrated within the framework of IWQUP, along with the use of the genetic algorithm and Monte Carlo simulation. The developed IWQUP will be applied in a case study of the Hexi Corridor, northwest China, to obtain optimum irrigation planning with the consideration of both seed maize yield and seed quality.

2. Methodology

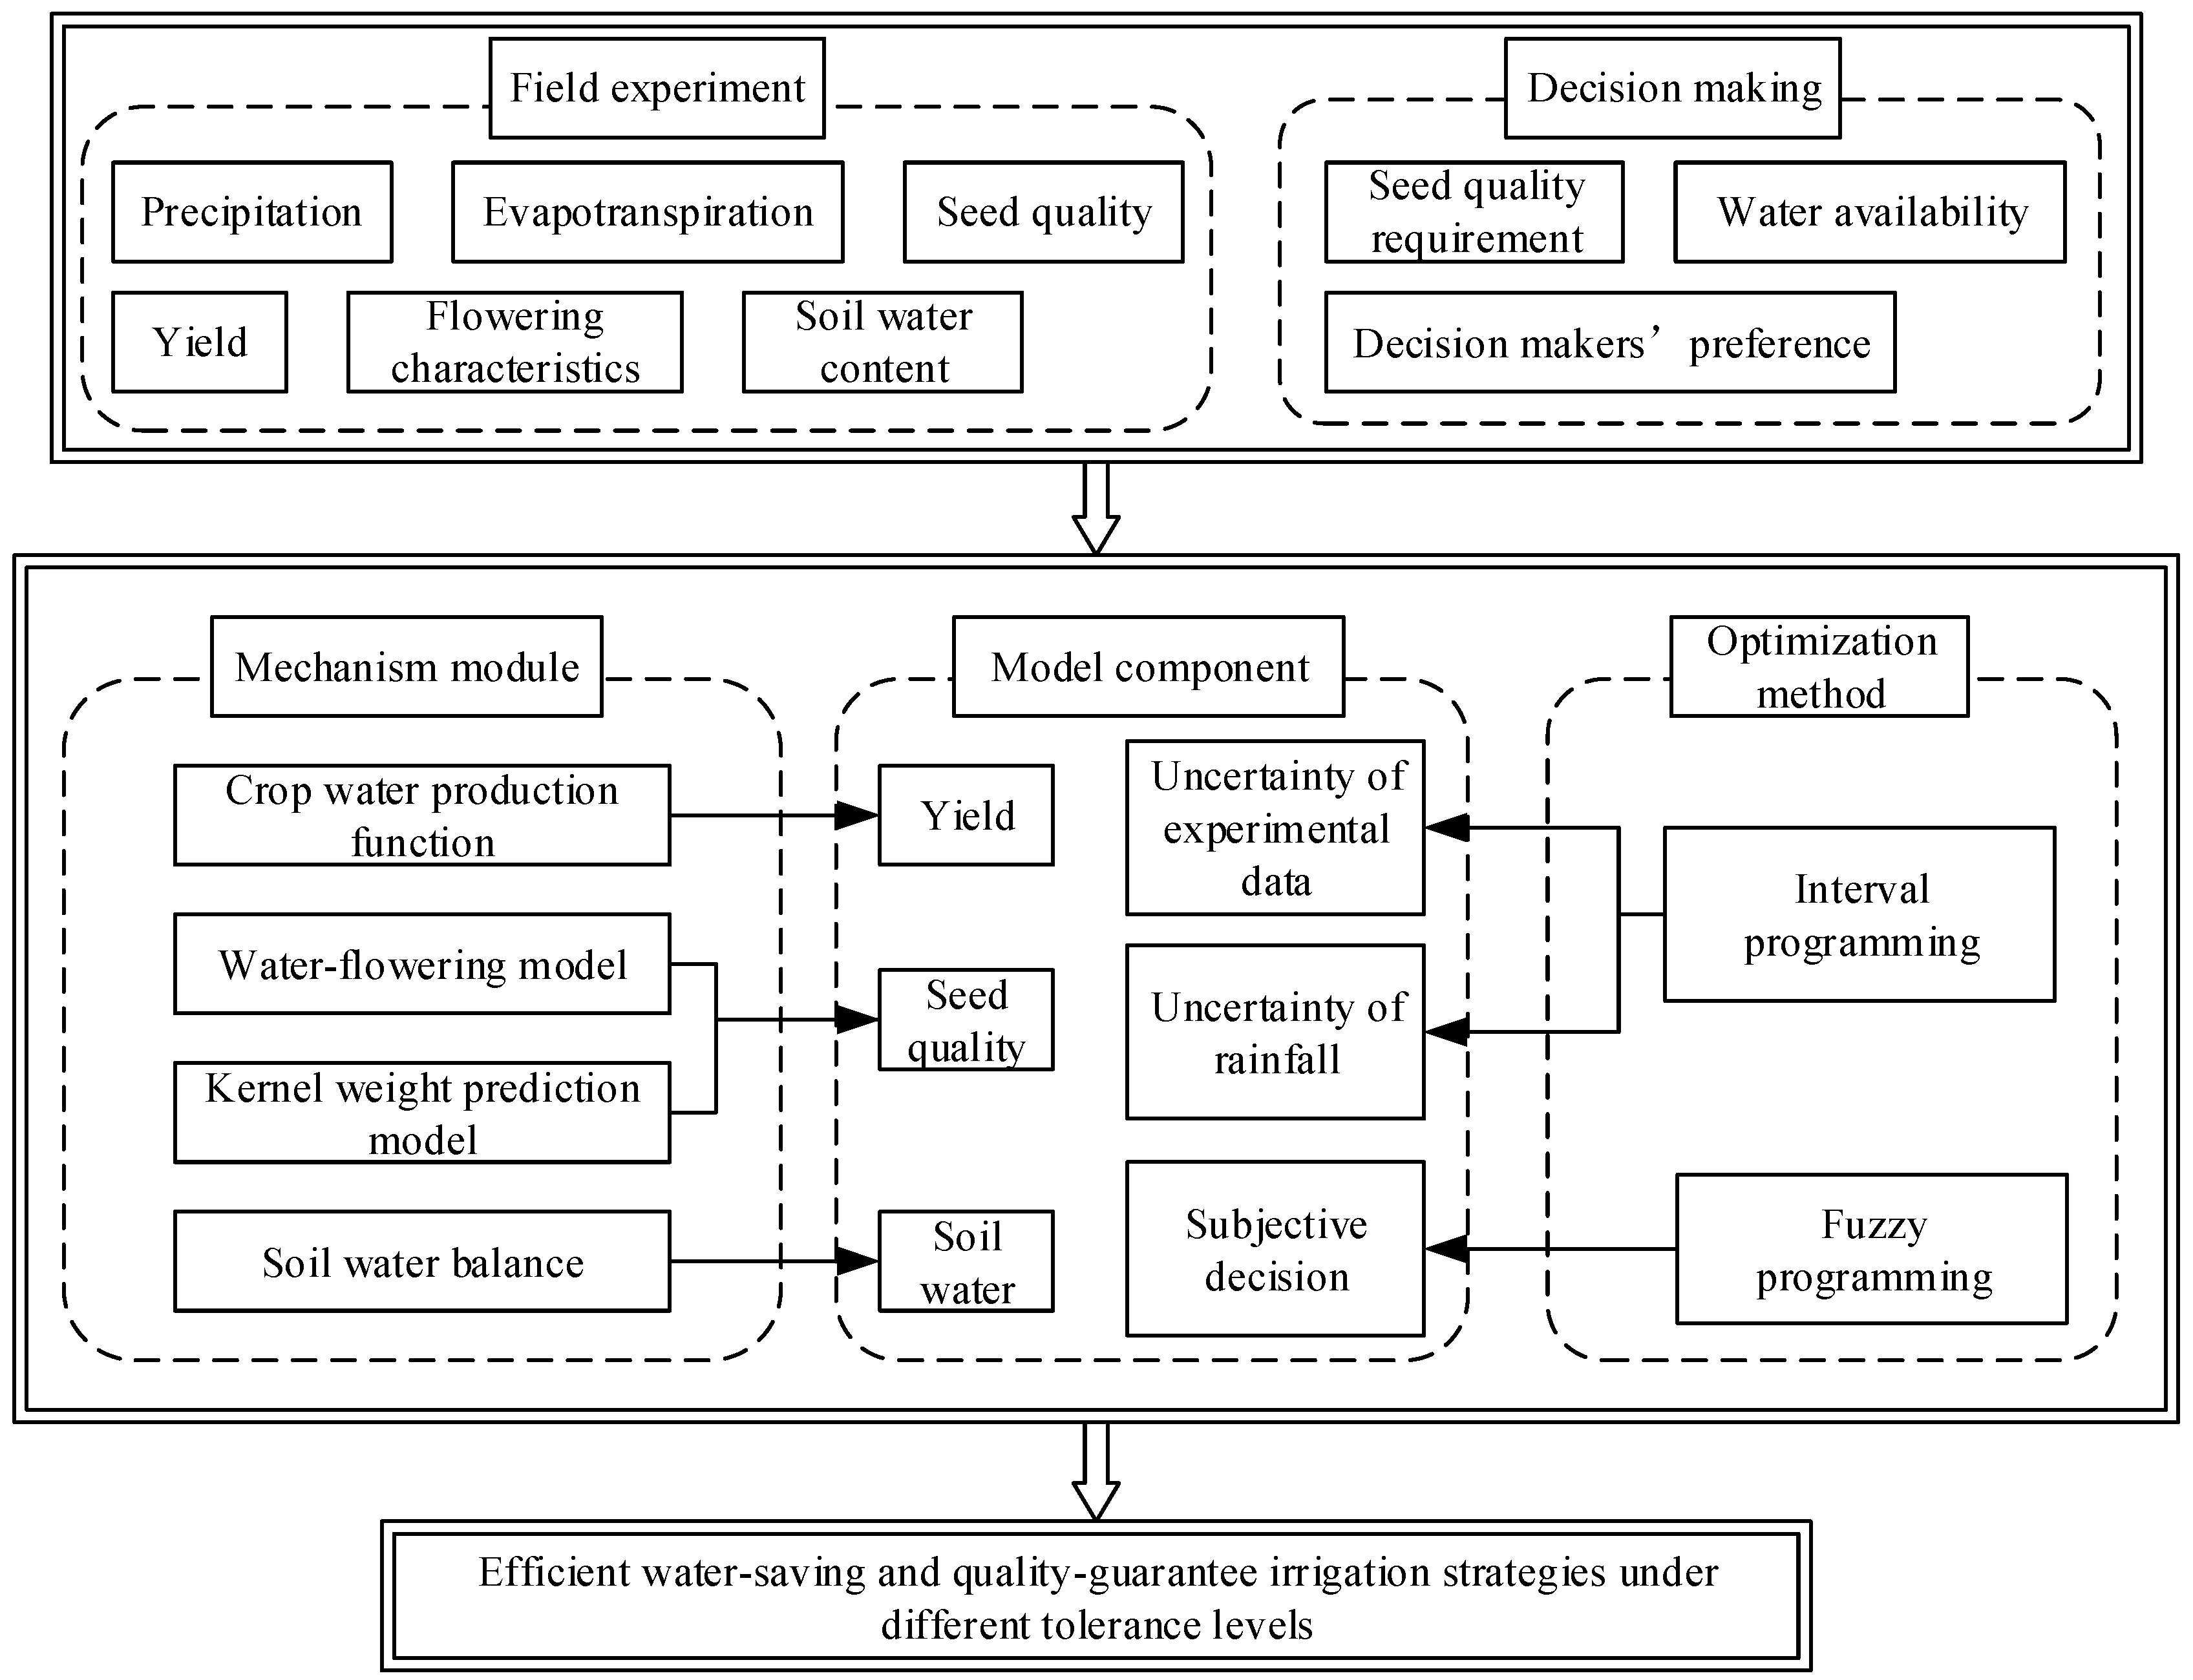
2.1. Framework of IWQUP

The proposed IWQUP includes four major parts. The first three parts were developed using the water-flowering model, kernel weight prediction model, and fuzzy programming, while the last one presented the optimization of irrigation scheduling. The framework of IWQUP is shown in Figure 1. The related nomenclatures of parameters can be found in Appendix A.

2.2. Water-Flowering Model

The water-flowering model is a simulation model which shows the response of kernel number to crop ET of seed maize during the flowering stage. The model has three modules, including the kernel formulation module, pollination module, and silking module. The details are listed as follows [21].
The kernel formulation module simulates the formation process of kernels in one ear of seed maize, which integrates the pollination process of male parents and the silking process of female parents. The final kernel number per ear is the sum of the kernels per ear formed on each day during the flowering stage.
K N = t K N t
K N t = k s t × C S N t × E A P t F e m a l e p l a n t s
E A P t = 1 e 0.013 ( k n t 1.2 S N X )
The pollination module represents the pollination process of male parents during the flowering stage. This module can simulate the ratio of the exposed silks that can be pollinated, which is decided by the pollen density. The pollen density of male plants on day t of year (PDt) is the sum of the pollen density of each batch of male plants on day t of the year. Generally, there are two batches of male parents.
k s t = { 0.96 × P D t P D min   , 0 < P D t P D min 0.96   , P D t > P D min
P D t = j = 1 T b a t c h P D j t
P D j t = R i n d j t 100 × T P D s h e d d a y s j × M a l e p l a n t s j M a l e p l a n t s
R i n d j t = ( R j S t a r t s h e d t + R j M a x s h e d t 2 ) R j E n d s h e d t
S h e d d d a y s j = T j E n d s h e d ( T j S t a r t s h e d + T j M a x s h e d 2 )
{ R j S t a r t s h e d t = 1 1 + e k j S t a r t s h e d × ( t T j S t a r t s h e d ) R j M a x s h e d t = 1 1 + e k j M a x s h e d × ( t T j M a x s h e d ) R j E n d s h e d t = 1 1 + e k j E n d s h e d × ( t T j E n d s h e d )
The silking module simulates the amount of exposed silks available for pollination, which is determined by the female parents. The accumulative number of exposed silks available for pollination on day t of the year (CSNt) is the sum of the newly exposed silk number and the unpollinated silk number that still possesses viability.
C S N t = S N t + ( 1 k s t 1 ) S N t 1 + + ( 1 k s t 1 ) ( 1 k s t 2 ) ( 1 k s t 3 ) ( 1 k s t 4 ) ( 1 k s t 5 ) S N t 5
S N t = ( r f t × s n 1 + r f ( t 1 ) × s n 2 + r f ( t 2 ) × s n 3 + + r f ( t T + 1 ) × s n T ) × F e m a l p l a n t s
r f t = R f t R f ( t 1 )
R f t = 1 1 + e k f × ( t T f )
s n t = { S N T   , T = 1 S N T S N T 1 , 1 < T T max
S N T = S N X × ( 1 e k e × T )

2.3. Lower Kernel Weight Prediction Model (LKW)

Besides the kernel number, the least kernel weight is also an important factor for seed maize production. In this study, the lower weight prediction model was used to evaluate the seed equality. The relationship between the kernel weight and the source-sink ratio is fitted by hyperbolic curve and the model description is shown as follows [21].
L o w K W = L o w m × S S R + k l o w × L o w 0 S S R + k l o w
S S R = Δ B K N × 10 3
where Lowm, Low0, and klow are the fitting parameters.
In the aforementioned water-flowering and lower kernel weight prediction models, WPFs are used to reflect the response of flowering characteristics and biomass gain to crop evapotranspiration. The parameters such as Tf, kf, ke, SNX, TPD, and △B are expressed in form of Jensen model and TjStartshed, TjMaxshed, TjEndshed, kjStartshed, kjMaxshed, kjEndshed are expressed by linear functions about the relative ET of the vegetation stage, based on Wang [17,21]. The two kinds of expressions are:
Jensen:
F a F m = i = 1 n ( E T a i E T m i ) λ i
Linear function:
F a F m = β E T a V E T m V + C
where Fa represents the actual flowering characteristics and biomass gain, while Fm denotes the flowering characteristics and biomass gain when the water supply is sufficient. ETa is the actual crop evapotranspiration; ETm is maximum ET under sufficient water supply. ETaV and ETmV represent the actual and maximum ET during vegetative stage.

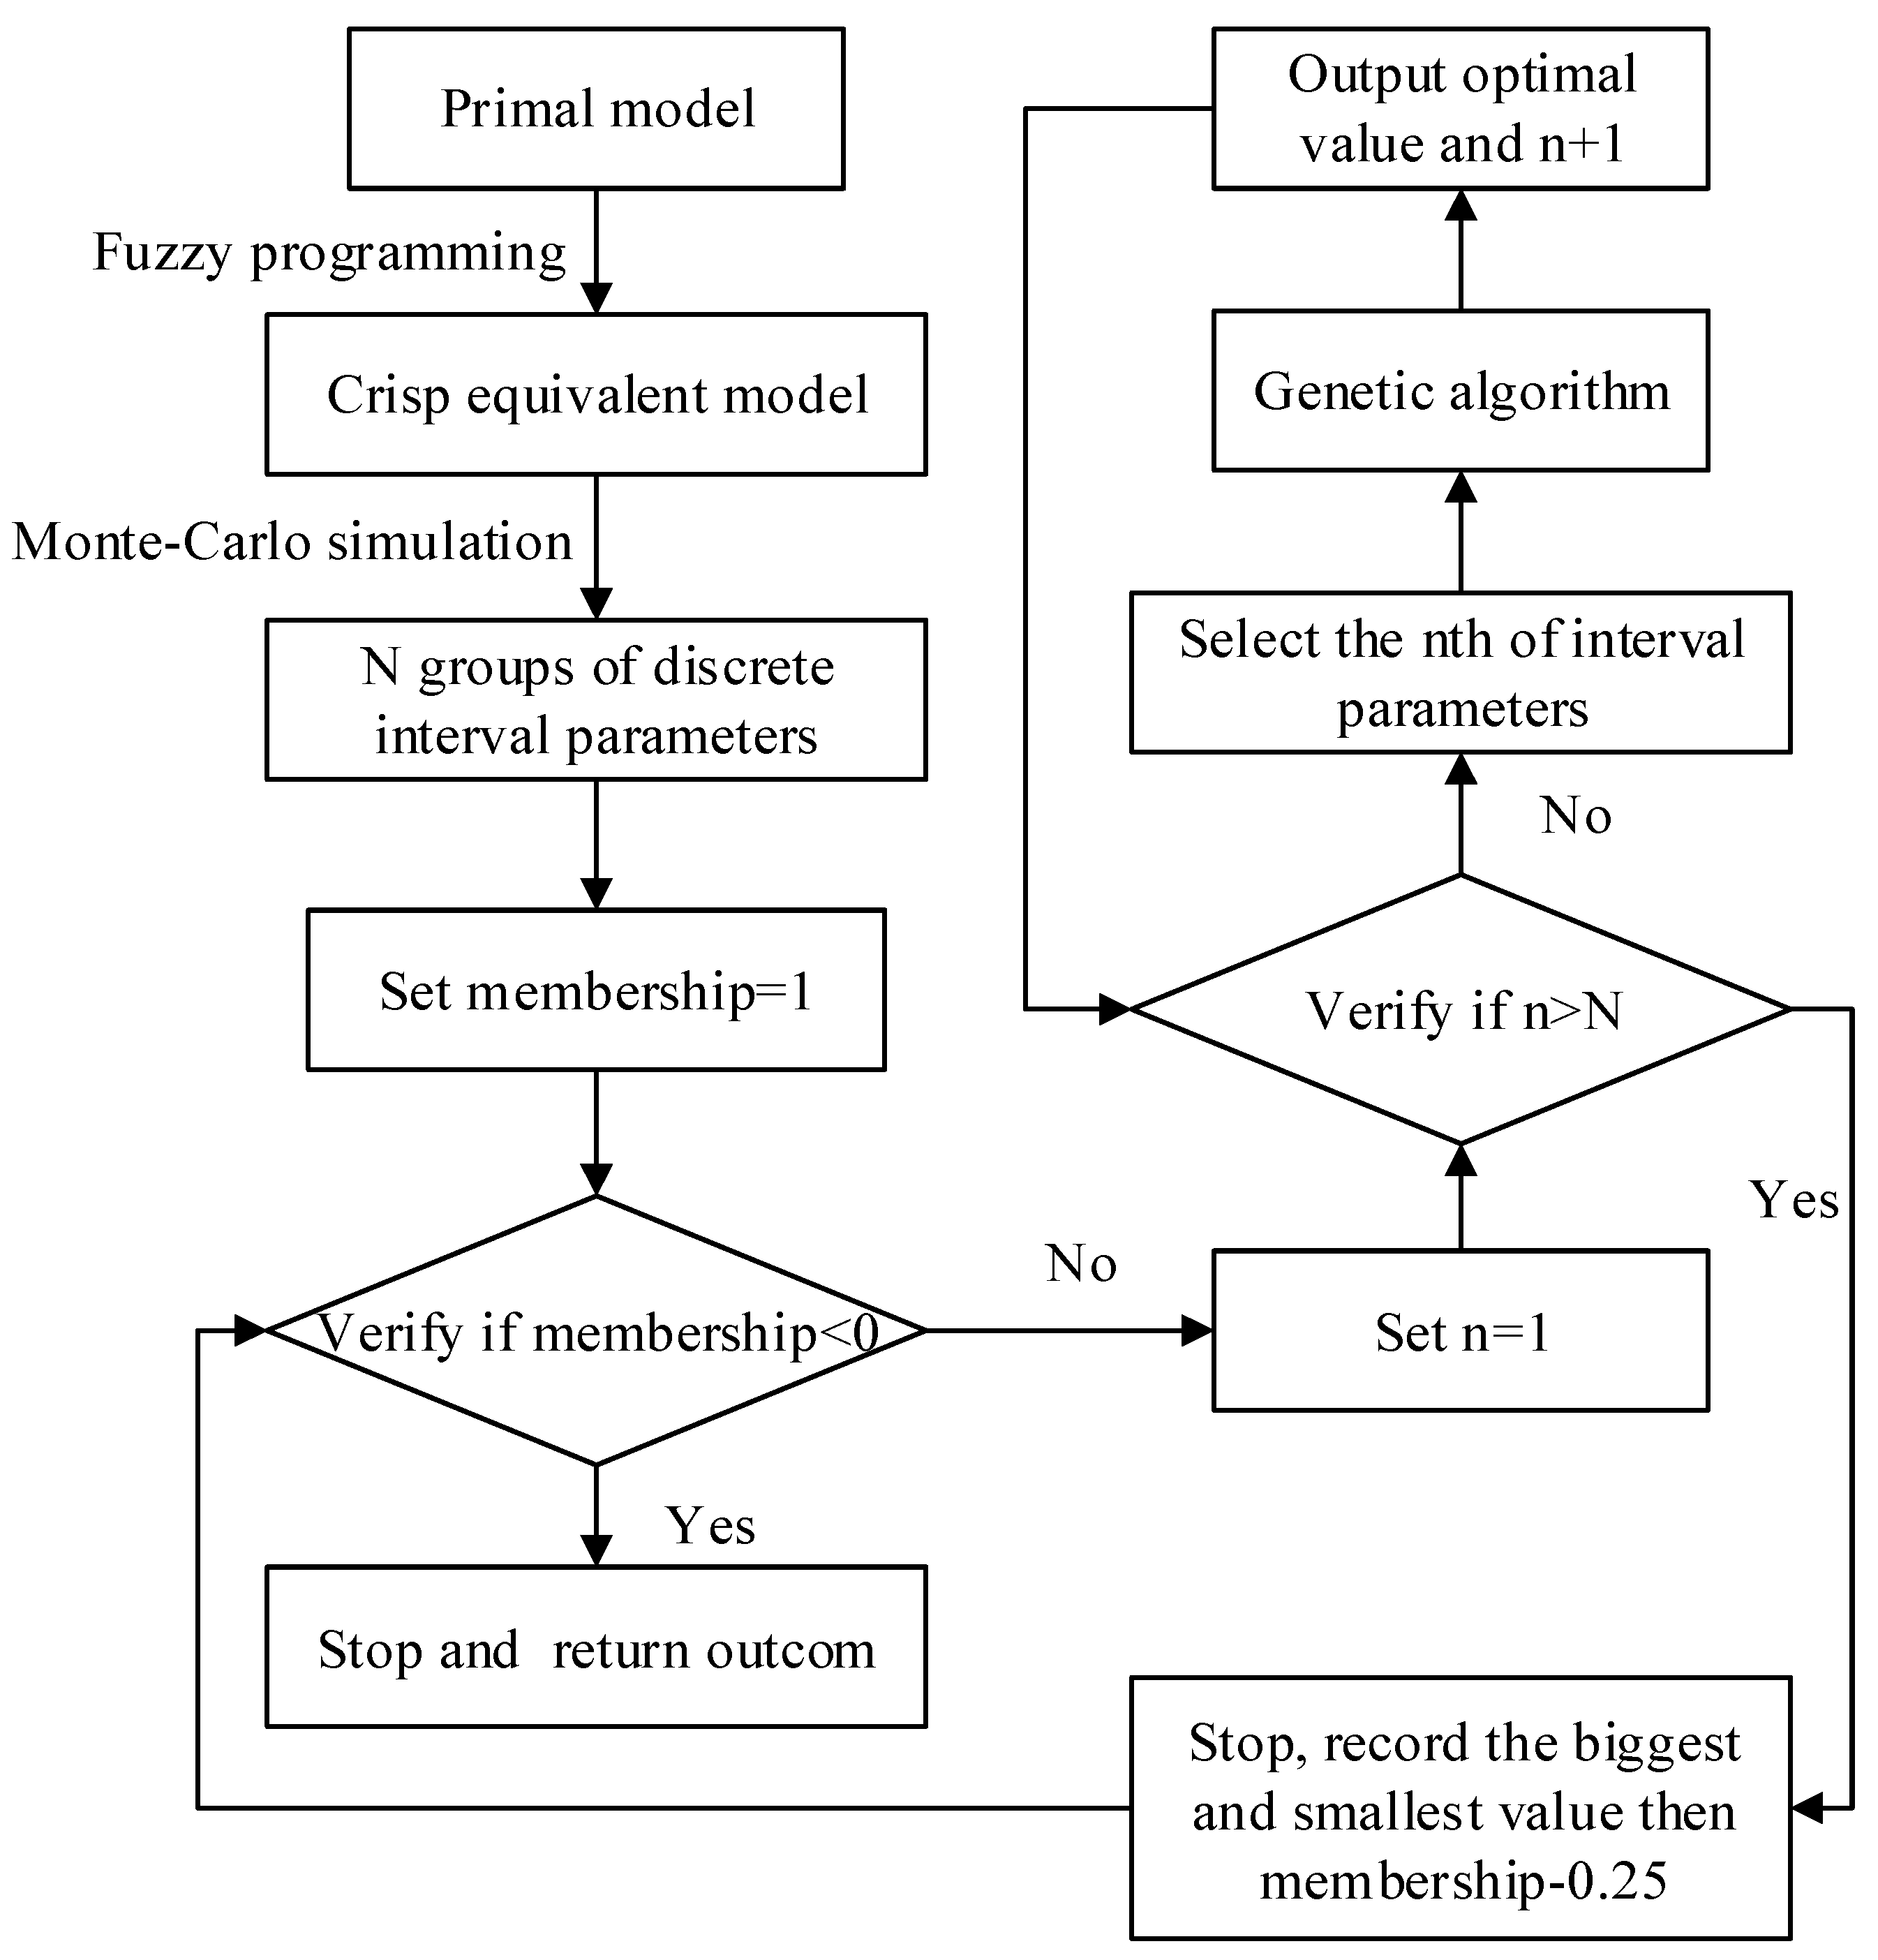
2.4. Fuzzy Programming

In the process of decision-making, some constraints can be flexible, which means decision-makers allow some slack in the constraints to some degree. However, decision-makers will be more reluctant as the slack reaches closer to its limit. When the largest deviation from the constraints is decided, we can quantify the effect of the constraint slack by fuzzy programming. A generalized fuzzy programming can be expressed as:
{ min f ( x ) s . t . g j ( x ) ˜ b j , j = 1 , 2 , , p
In order to solve the aforementioned model using a mathematical method, a linear membership function is assumed as follows:
α j = { 1 g j ( x ) b j b j + d j g j ( x ) d j b j g j ( x ) b j + d j 0 g j ( x ) b j + d j
where d j 0 ( j = 1 p ) is a slack variable, which is defined by the decision-makers. α j is the membership for the j-th constraint. Then, the model can be rewritten as its crisp equivalent:
{ min f ( x ) s . t . α j α T j , j = 1 , 2 , , p
α T j is the acceptable membership of each constraint, which reflects the corresponding tolerance degree of constraint slack according to the decision-makers. The higher the value is, the more compact the constraints will be; the lower the tolerance level of slack for decision-makers, the more conservative the decision will be. Based on different tolerances, the corresponding benefits and risks can be shown to the decision-maker for their references.

2.5. Nonlinear Interval Fuzzy Programming for the Irrigation Scheduling Optimization of Seed Maize

Based on the above approaches, an integrated optimization model was further developed for irrigation scheduling, which can improve the efficient utilization of limited water resources and guarantee seed yield and quality. Considering the widespread uncertainty in the decision-making process, the fuzzy programming was used to quantify the subjective effect of decision-makers. Moreover, the performance of the simulation model highly depends on the available data. In order to reduce the dependence on experimental data and make full use of statistical data, interval programming was adopted to express the vague characteristics of the biggest actual ET and improve the practicality of the optimization model. Besides, due to the variable nature of the meteorological factor, precipitation was also recognized as an interval number. The model is described as follows.
The objective of the optimization model is to maximize the potential yield of seed maize.
max Y i e l d ± = Y max i = 1 n ( E T i ± E T max i ± ) λ i
where Yield is the total actual yield of seed maize, t hm−2; Ymax is the maximum potential yield under sufficient water supply, t hm−2; ETi is actual evapotranspiration of seed maize in the i-th growth stage, mm; ETmax i is the maximum potential evapotranspiration under sufficient water supply in the i-th growth stage, mm; λ i is the sensitivity coefficient of the Jensen model in the i-th growth stage; i is the number of growth stages for seed maize; and i = 1, 2, 3, 4, 5 represents the establishment, vegetative, flowering, yield-formation, and ripening stages, respectively.
Subject to:
(1)
Kernel number per ear constraint:
K N ± ˜ K N min
where KN is the actual kernel number per ear, kernel ear−1; KNmin is the least kernel number per ear allowed by famers, kernel ear−1.
(2)
Lower bound of kernel weight constraint:
L o w K W ± ˜ L o w K W min
where LowKW is the actual lower bound of kernel weight, mg kernel−1; LowKWmin is the least lower bound of kernel weight allowed by farmers, mg kernel−1.
(3)
Irrigation water resources availability:
i = 1 n I W i ± ˜ W A
where IWi is the amount of irrigation water resources for the i-th growth stage, mm; WA is the available irrigation water resources, mm.
(4)
Soil-water balance constraint:
S W i + 1 ± = S W i ± + E P i ± + I W i ± E T i ±
1000 H i θ W P S W i ± 1000 H i θ F C
where SWi is the soil water content during the i-th growth stage, mm; EPi is the effective rainfall during the i-th growth stage, mm; Hi is the planned moisture layer of soil during the i-th growth stage, m; θ W P is the soil wilting point; θ F C is the field capacity.
(5)
Crop actual ET constraint:
0 E T i ± E T max i ±
The model is characterized as having high complexity and multiple uncertainties. In order to solve the model, Monte Carlo simulation and fuzzy equivalence are integrated within the genetic algorithm. The solving process is described in detail in Figure 2.

3. Results and Discussion

3.1. Study Area

The study area is located in the Hexi Corridor, northwest China (92°44′–104°14′ E and 37°15′–42°49′ N). The local climate features typical arid characteristics including low precipitation (50–150 mm/year) and high evaporation (1500–2500 mm/year) [9,33,34]. The seed maize has five growth stages, including establishment, vegetative, flowering, yield-formation, and ripening. The coefficients of the Jensen model for yield, flowering characteristics, and biomass gain are listed in Table 1. The coefficients of the day and the rate of pollination are shown in Table 2. Other initial parameters are as follows. (1) On the first day of the flowering stage, EAPt = 1. (2) The pollen density threshold is PDmin = 100 grains cm−2 day−1. (3) The silking duration of an individual ear is Tmax = 10. (4) The period of pollen viability is 6 days. According to the statistical data of precipitation, the hydrological years can be divided into high, medium, and low rainfall categories. Table 3 shows the upper and lower bounds of ETm and EP in different hydrological years. The water availability WA, KNmin, LowKWmin and their slack values in each hydrological year are shown in Table 4. When the climate of a year is relative mild, the groundwater exploitation is restricted to help restore the groundwater aquifer in this region. Otherwise, the groundwater is used as a supplement for agricultural irrigation. The initial soil moisture was set as 75% of its field capacity [21]. According to field experiment by Wang [21], the maximum potential yield of seed maize under sufficient water supply, Ymax, was set as 5.82 t/hm2. Due to the lack of statistical data about seed quality, KNmin and LowKWmin were selected according to farming experience. The tolerance degree was divided into five levels, with 1 to 5 representing absolute strict, relative strict, general strict, relative loose, and absolute loose levels, corresponding to the five memberships of 1, 0.75, 0.5, 0.25, and 0, respectively. The higher the membership is, the lower the tolerance degree of constraint slack for the decision-makers will be.

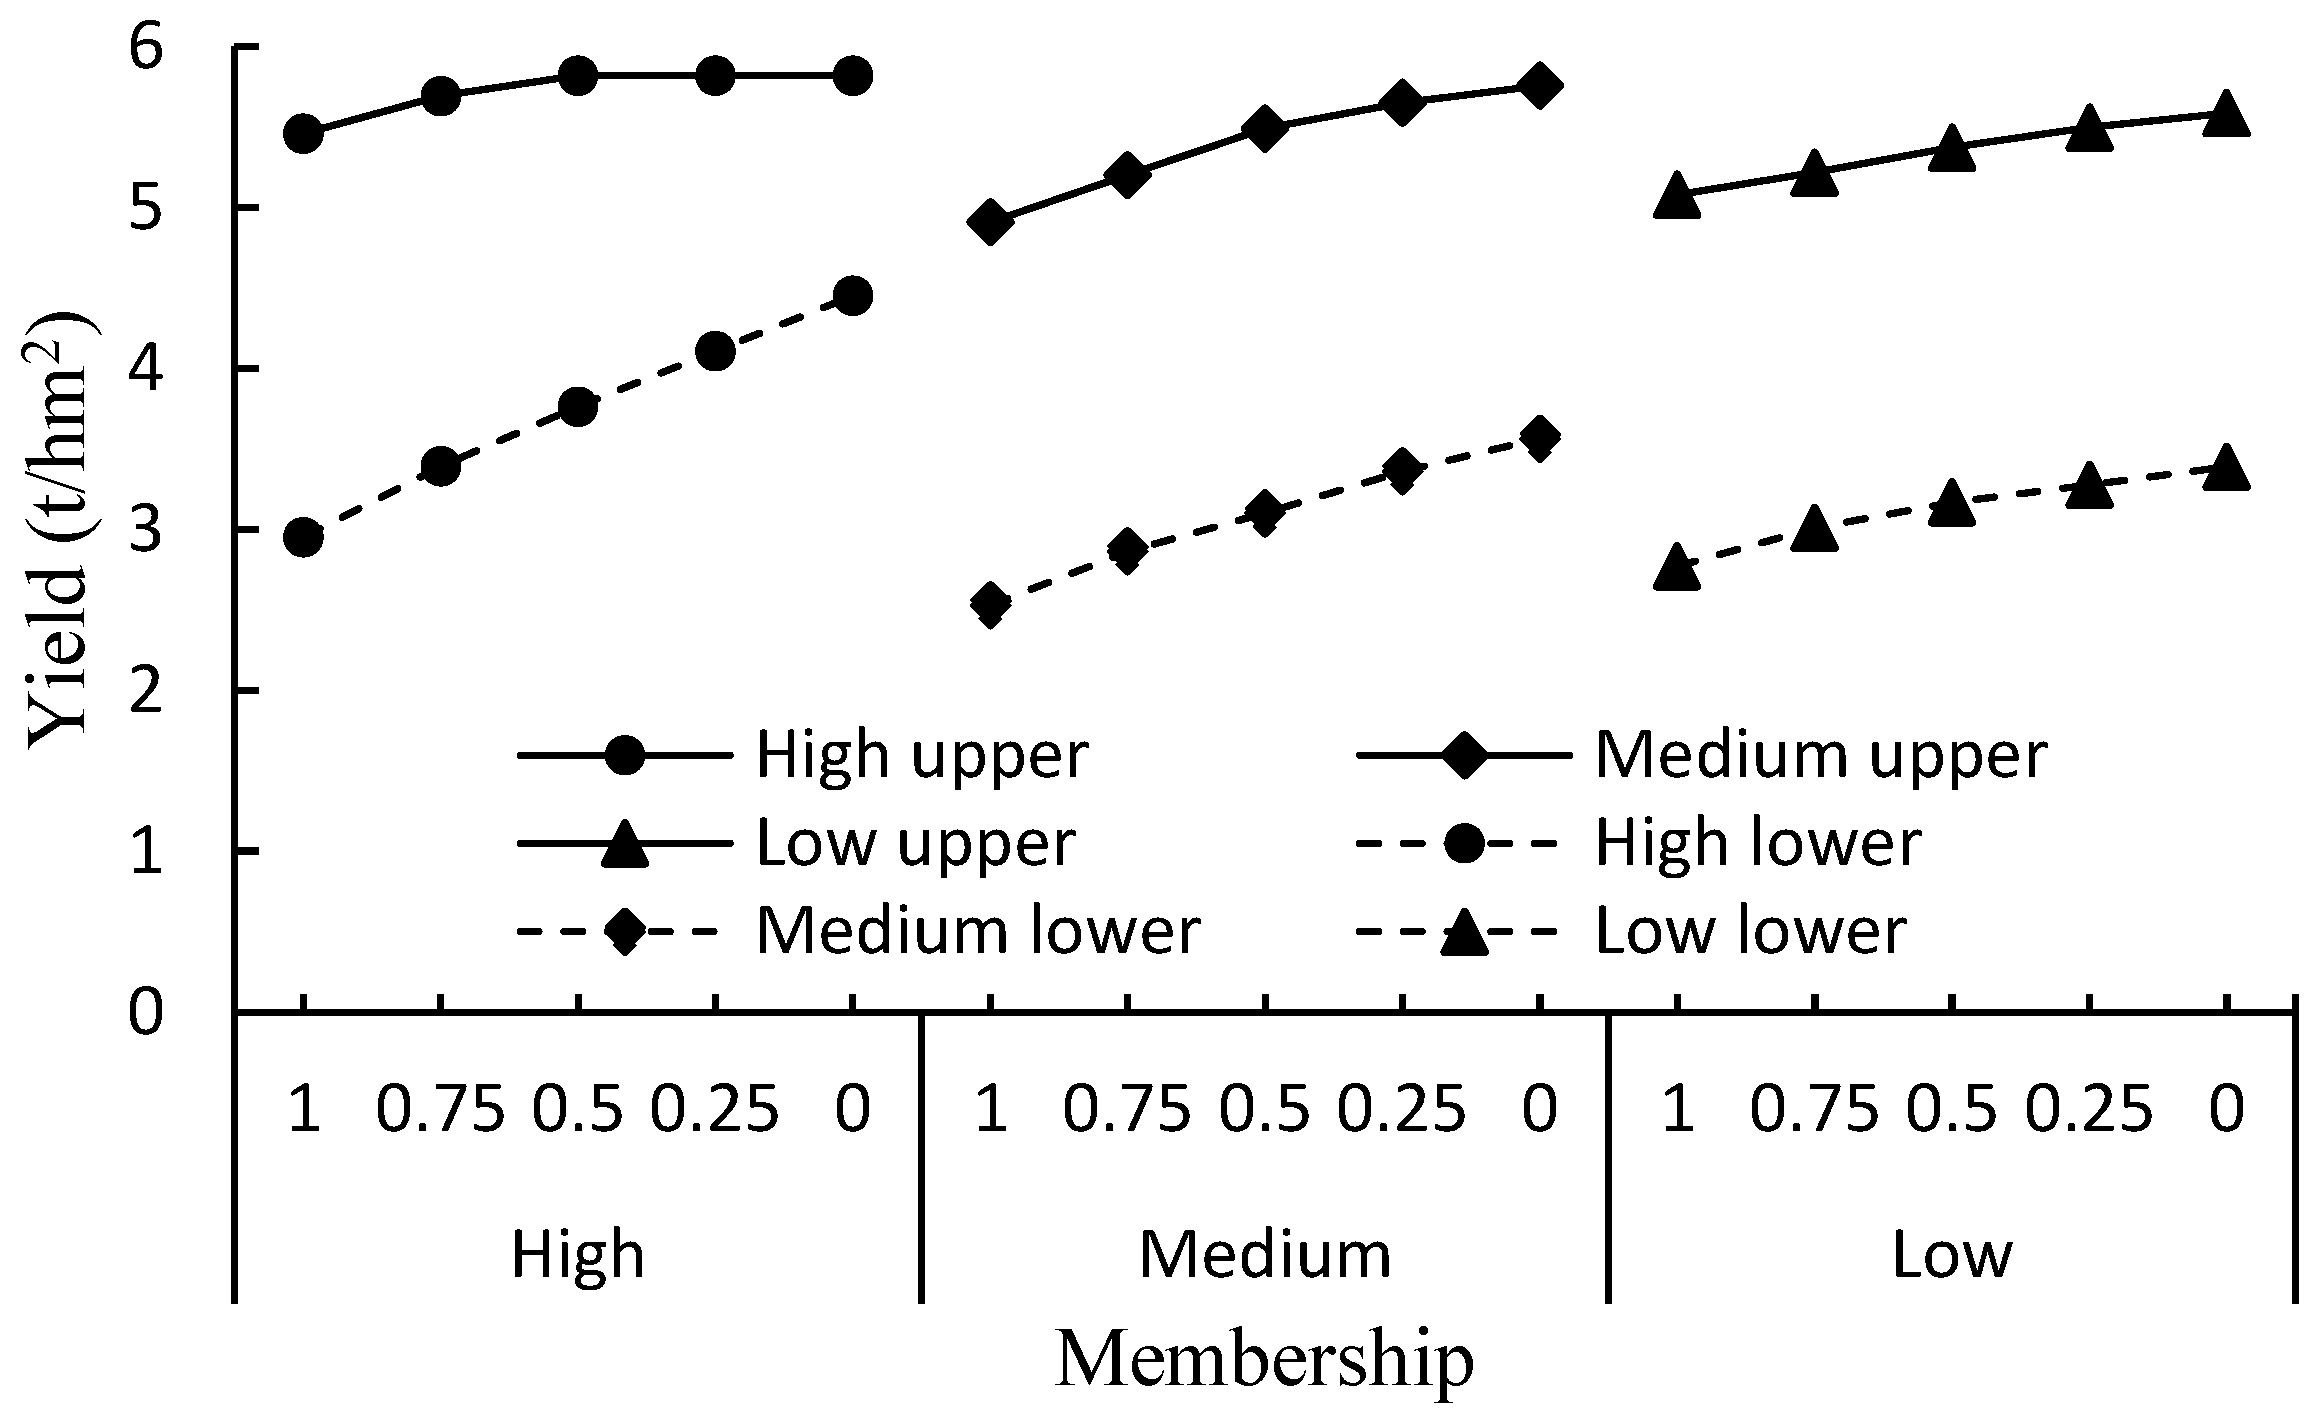
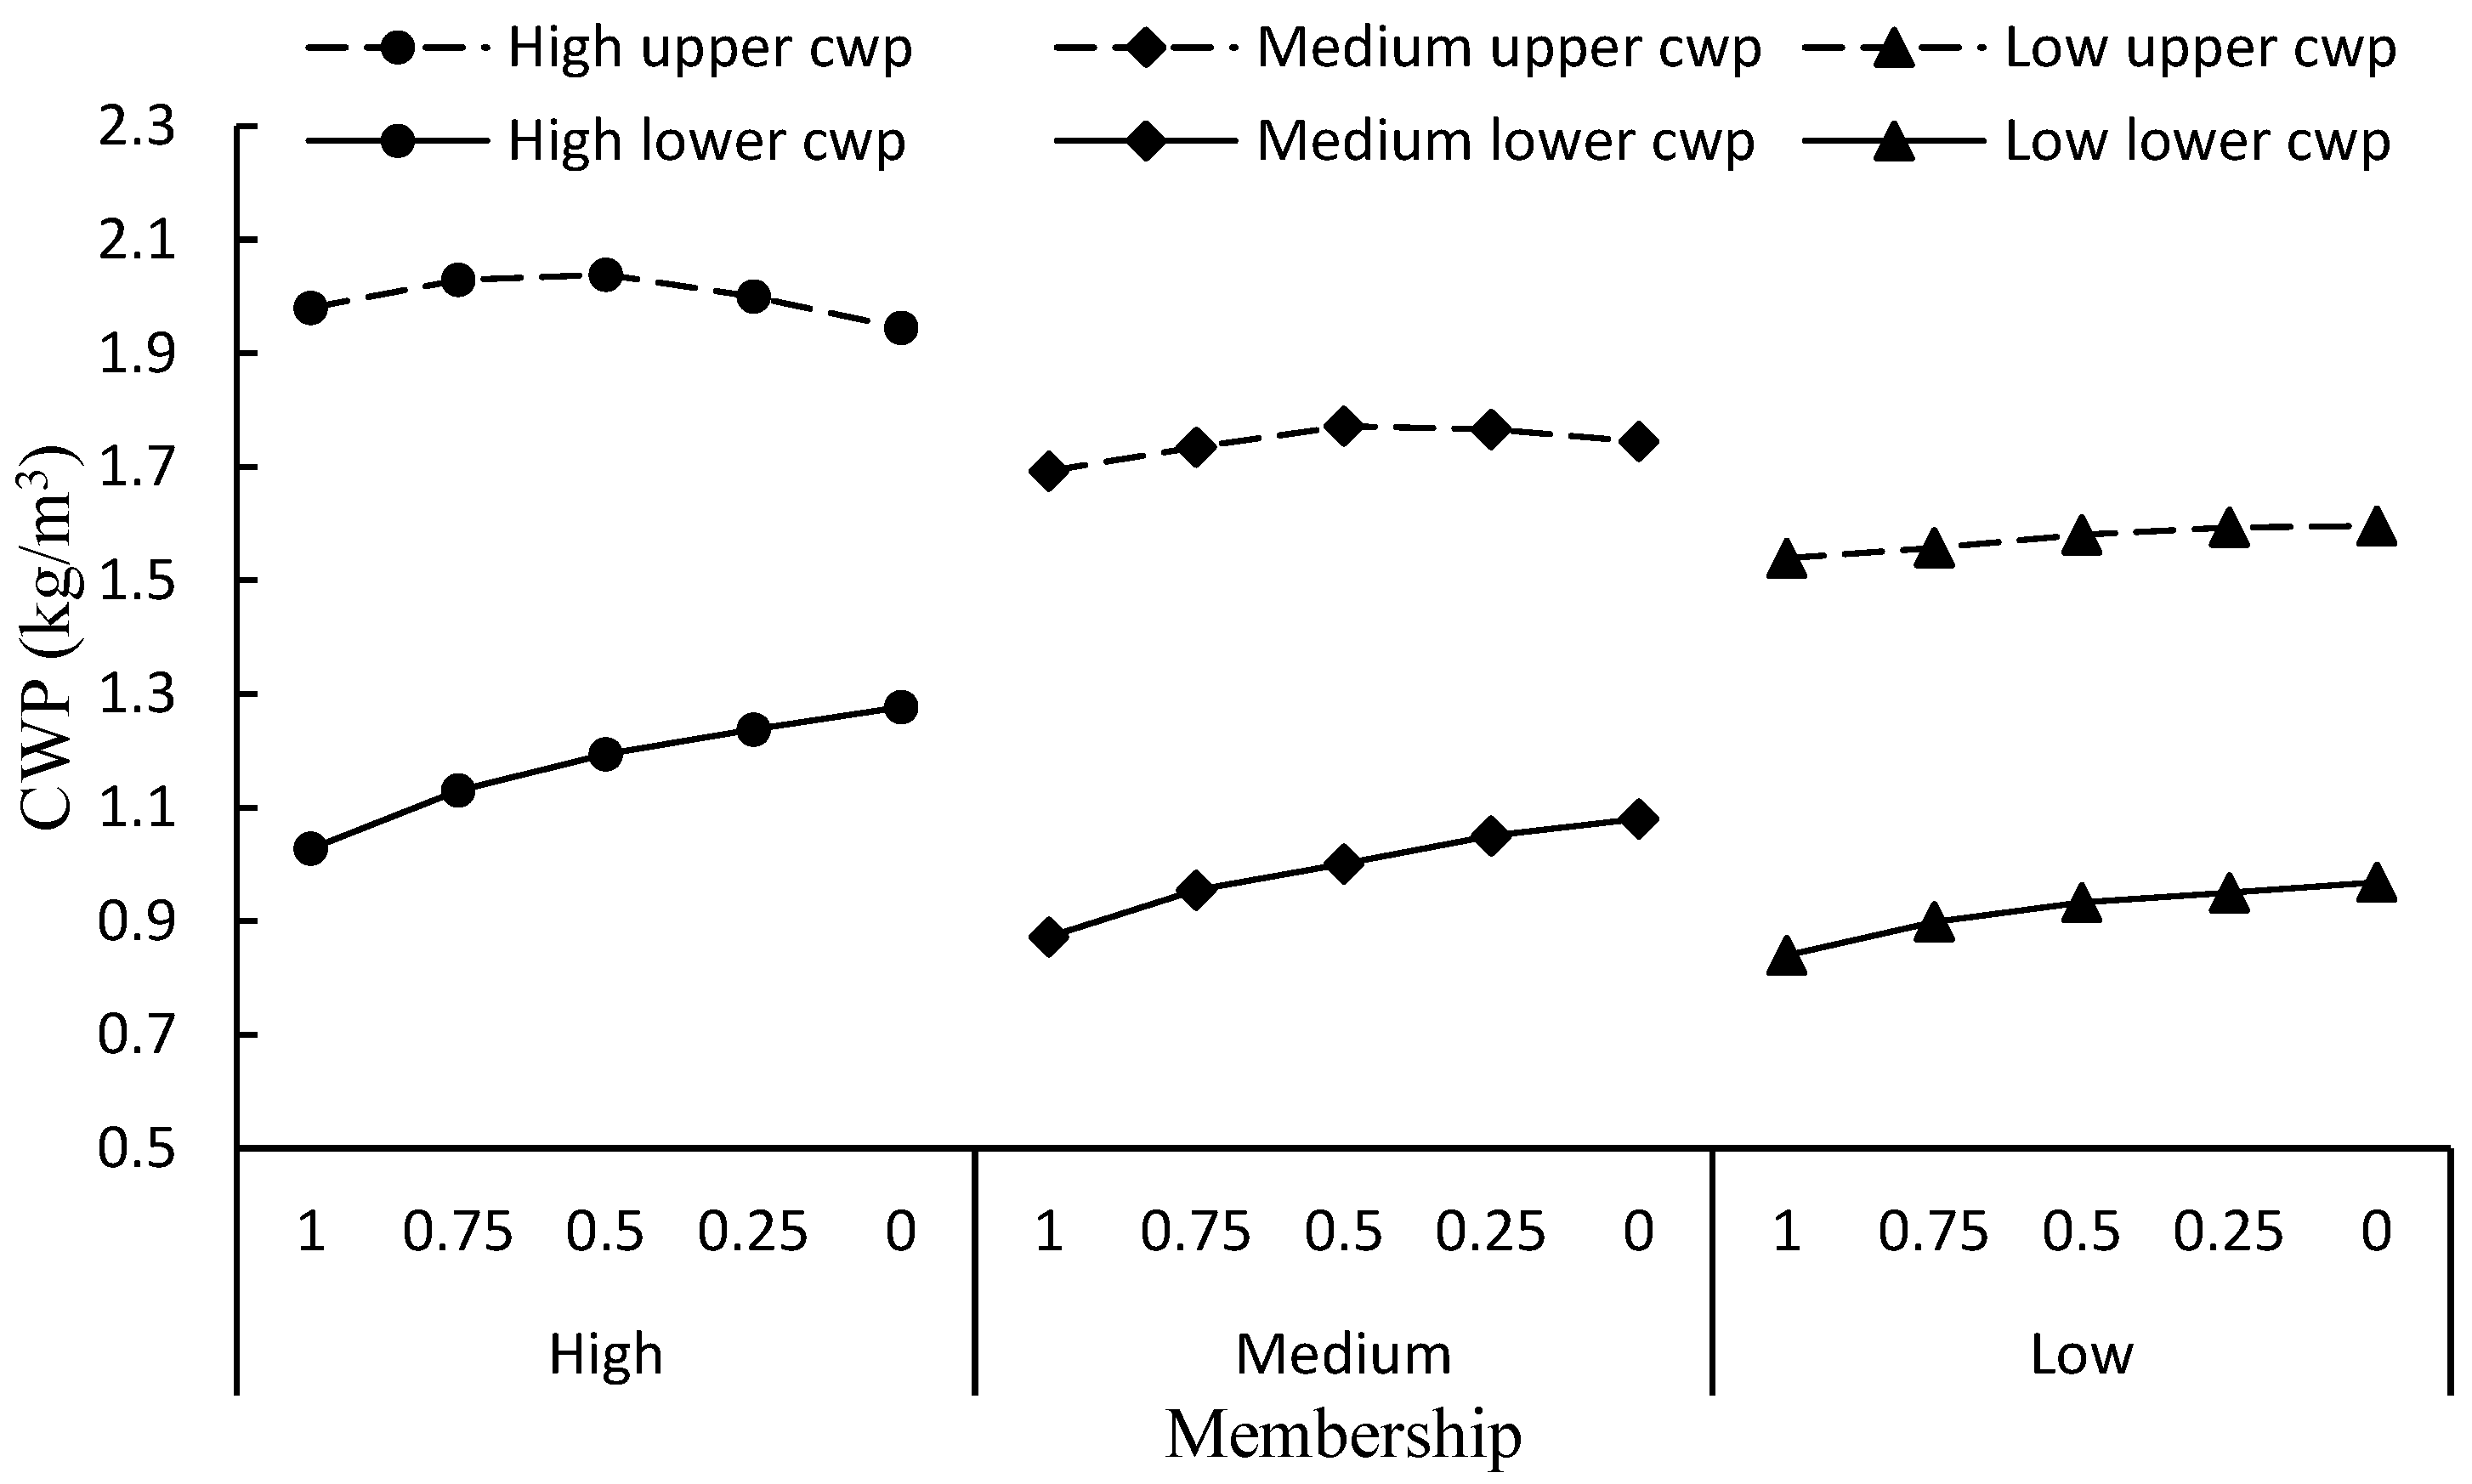
3.2. The Optimal Irrigation Strategies

The allocation of irrigation water resources during different growth stages were investigated under different tolerance levels to support irrigation scheduling. The upper and lower bounds of irrigation water allocation of different growth stages are shown in Table 5. The results showed that the allocated water in the vegetative, flowering, and yield-formation stages constituted a large part of the total water consumption. When there was high soil water content and low evapotranspiration, the water demand of the establishment stage was relatively low, even though the crop sensitivity of this stage can be high, which can also be reflected in the coefficients of the Jensen model. The precipitation in the high hydrological year was ample. As the conditions became drier, the water consumption of the establishment stage increased. The low water amount allocated to the irrigation of the ripening stage was mainly attributed to the low crop sensitivity. Generally, with the increase of tolerance levels, there would be enhanced water availability and a correspondingly increased amount of allocated water.
The optimal maximum yields under different tolerance levels in various hydrological years are shown in Figure 3. As the membership declined, the attainable yield increased in each hydrological year. Such a decrease of membership indicated that the tolerance level of decision-makers increased, with higher water availability and a lower requirement of seed quality. Meanwhile, the attainable yield of the high hydrological year was greater than those for other two years. This was associated with the largest quantity of agricultural water resources. When the membership was 0.5, the highest optimal yield could reach 5.82 t/hm2, suggesting that the available agricultural water resources could fully meet the demand for sufficient irrigation. With the further decrease of membership, the obtained yield would not change any more. The highest tolerance level of the upper bound in high hydrological year was 3, and the waste of water would occur if a higher tolerance level was set. However, the lower bound of the high hydrological year increased constantly with the change of the tolerance level. When the growing conditions were poor in a high hydrological year, the tolerance level could exceed 3 in order to attain a higher yield. In medium- and low-level hydrological years, due to the harsh climate conditions, the limited water resources could not fully meet the water requirements and deficit irrigation was therefore always employed. As a result, the yield increased with the decrease of membership.
Figure 4 shows the corresponding crop irrigation water productivity (CWP) under different memberships. Among the three types of hydrological years, the high-level year exhibited the highest CWP. For the high-level year, the upper bound exhibited an increasing trend followed by a decrease. The upper bound of CWP reached its peak of 2.04 kg/m3 when the membership was 0.5. With the decrease of the membership, the CWP began to decrease because the irrigation was sufficient for the highest potential yield and the surplus water would be wasted. A similar trend could also be seen in upper bound of the medium hydrological year, with the highest CWP of 1.77 kg/m3 at membership 0.5, even though it was still in a water-deficit state. Thus, there are two choices for decision-makers. If water use efficiency is preferred over yield, tolerance level 3 can be selected in decision-making. If yield is preferred over water use efficiency, the highest tolerance level can be selected. Due to the large water consumption, the CWP in the low hydrological year was lowest, although it could increase as the membership decreased. In addition, due to the severe water deficiency, the yield of the lower bounds in all three hydrological years suffered a significant declination compared with the highest potential yield, Ymax, leading to a constant increase of the CWP with the increase of available water.

3.3. The Advantages of the Proposed Model

In order to further demonstrate the practicability of the developed model, IWQUP was compared with three other types of models. Based on previous studies in irrigation water allocation, interval programming was selected as a popular uncertain programming method [29,30,31]. Firstly, in order to reflect the subjective influence of decision-makers on the irrigation water resources allocation, an interval programming considering seed quality was adopted. This interval programming could be same as IWQUP when the membership of IWQUP is 1. To explore the effect of seed quality simulation on irrigation scheduling, an interval programming without consideration of seed quality or the subjective effect of decision-makers was used for comparison. Finally, a certain optimization model without consideration of seed quality or any uncertainty was compared. The two latter models can be described by the following models (8) and (9). The parameters of model (9) are listed in Table 6.
{ max Y i e l d = Y max i = 1 n ( E T i ± E T max i ± ) λ i s . t . i = 1 n I W i ± W A S W i + 1 ± = S W i ± + E P i ± + I W i ± E T i ± 1000 H i θ W P S W i ± 1000 H i θ F C 0 E T i ± E T max i ±
{ max Y i e l d = Y max i = 1 n ( E T i E T max i ) λ i s . t . i = 1 n I W i W A S W i + 1 = S W i + E P i + I W i E T i 1000 H i θ W P S W i 1000 H i θ F C 0 E T i E T max i
The results of the yield from models (7) (membership = 1), (8), and (9) are shown in Figure 5. The results of KN and LowKW from these three models are shown in Table 7. Compared with the results when considering the subjective effect of decision-makers, the strategies derived from interval programming with seed quality were relatively conservative. With the strict obedience to the constraints of water availability and seed quality, the obtained strategy lacked reference value to situations in which decision-makers were optimistic. Meanwhile, since decision-making is a process with much subjectivity involved, decision-making only based on the least risk is not an ideal solution in most circumstances. Therefore, by taking into account the subjective influence to different degrees, the established model in this study can increase the diversity of decision alternatives. Moreover, when ignoring the seed quality, there would be a slight increase in the lower bound of the optimal yield, while the upper bound of the yield would exhibit no significant change (Figure 5). When the available water amount was relatively large, the seed quality could meet the demand automatically. However, when the available water was seriously scarce, the seed quality constraints would ensure the water resources to guarantee quality first and thus the yield would be affected. In reality, high-seed quality is important for farmers as well, due to its high benefit, especially for seed crops. From Table 7, the great reduction of seed weight resulting from models (8) and (9) can be seen. Although the yield may increase to some extent, the seed quality could not be guaranteed and the corresponding irrigation scheduling would not be acceptable by decision-makers. The results from model (9) showed that the obtained yield was within the bounds of models (7) and (8); therefore, the results of model (7) were reasonable. However, there was only one strategy from model (9) that corresponded to one group value of ETm and EP. The value of ETm and EP would be quite different among different years, even within the same hydrological level. As such, model (9) cannot provide decision-makers with reliable irrigation strategies in the long term. Therefore, the developed model in this paper is more suitable compared to the other three types of models.

3.4. Implications for Irrigation Scheduling and Water Resources Management

The results of this study provide many implications for irrigation scheduling and water resources management. When the climatic condition is moist, decision-makers may use a low tolerance level in order to reduce water waste, enhance water use efficiency, and guarantee a relatively high seed quality. When the climate is harsh, a high tolerance level to water use constraints is recommended in order to obtain more water to guarantee yield. Besides, the tolerance level to seed quality should also increase and decision-makers need to adjust water allocation among different growth stages reasonably in order to attain the highest yield. Moreover, when the climate is extremely dry, more measures should be taken to increase agricultural water supply, such as increasing groundwater exploitation and water diversion. When determining irrigation scheduling for seed maize, the water required in the vegetative, flowering and yield-formation stages should be satisfied first when climate is relative moist. The water allocated to the ripening stage should be the first to be sacrificed when the water availability decreases.
The established model can provide decision-makers with a reference of irrigation scheduling for seed maize under different hydrological years. The obtained scheduling takes into consideration seed quality, which is another critical criteria for yield assessment. The interval output that involves the optimistic irrigation water allocation under various scenarios will be useful for decision-making. In addition, the tolerance levels are adopted to quantify the subjective influence of decision-makers. When the climatic condition becomes harsh, a high tolerance level may be beneficial, in sacrificing high seed quality to guarantee the total yield. When the climate condition is mild, decision-makers can set a relatively low tolerance level to achieve high seed quality and reduce water waste.

4. Conclusions

With the increasing pressure to conserve water resources, water scarcity has threatened the development of sustainable agricultural practices, especially in arid areas. Seed quality is a critical criterion since seed maize is used to produce future maize crops. This needs to be taken into account when an irrigation schedule is made. In this study, an interval fuzzy programming approach considering seed maize quality and soil-water balance was developed to help achieve efficient irrigation scheduling under limited water resources. Based on the deficit irrigation theory, the response of yield and seed maize quality to crop evapotranspiration using three models (i.e., the crop water production function, water-flowering model, and kernel weight prediction model) was integrated within the optimization model framework. Moreover, considering the uncertainty existing in experimental and meteorological data, the interval programming was used to generate an interval outcome under different hydrological years. Considering the uncertainty arising from the subjective influence of decision-makers, fuzzy programming was used and tolerance levels were determined to quantify the subjective decisions. In order to solve the complicated model, the Monte Carlo method was further applied with the genetic algorithm. The developed model was applied in an arid area located in northwestern China. The results show that the outcomes considering various scenarios will be of great value to decision-making. Meanwhile, the results can help develop appropriate strategies for agricultural water resources management under the conditions of climate change. For example, the decision-makers can improve the tolerance level to guarantee yield. This approach represents a unique contribution to irrigation scheduling in arid areas.

Author Contributions

Conceptualization, S.G.; Methodology, S.G. and J.W.; Software, S.G.; Writing—Original Draft Preparation, S.G. and J.W.; Writing—Review and Editing, F.Z., Y.W. and P.G.; Supervision, P.G.; Funding Acquisition, P.G.

Acknowledgments

This research was supported by the National Key Research and Development Plan (No. 2016YFC0400207), National Natural Science Foundation of China (51621061). The authors are also grateful to the editor and the anonymous reviewers for their insightful comments and suggestions.

Conflicts of Interest

The authors declare no conflict of interest.

Appendix A

Table A1. Nomenclatures for Parameters.
ParameterDescriptionUnit
KNKernel number per earkernels ear−1
KNtKernel number per ear forming on the t-th day of the yearkernels ear−1
tThe day of the yearDOY
kstPercentage of exposed silks that are pollinated on the t-th day of the year
CSNtAccumulative number of exposed silks available for pollination on the t-th day of the yearsilks ha−1
EAPtEfficiency of the kernel set considering the asynchrony within an ear on the t-th day of the year
FemaleplantsNumber of female plants per hectareplants ha−1
SNXTotal number of exposed silks per earsilks ear−1
kntAccumulative kernel number before the t-th day of the yearkernels ear−1
PDtPollen density of male plants on the t-th day of the yeargrains cm−2 day−1
PDminPollen density thresholdgrains cm−2 day−1
PDjtPollen density of the j-th batch of male parents on the t-th day of the yeargrains cm−2 day−1
jBatch number of planted male inbreds
TbatchSum batch number of planted male inbreds
RindtjPercentage of the j-th batch of male parents in the average pollen shed state on the t-th day of the year%
SheddaysjThe average number of days for which the j-th batch of male parents are in the pollen shed stateday
MaleplantsjThe number of the j-th batch of male parents per hectareplants ha−1
TPDTotal pollen density during the flowering stagegrains cm−2
RjStartshedtAccumulative percentage of the j-th batch of male parents that have reached the Startshed state on the t-th day of the year%
RjMaxshedtAccumulative percentage of the j-th batch of male parents that have reached the Maxshed state on the t-th day of the year%
RjEndshedtAccumulative percentage of the j-th batch of male parents that have reached the Endshed state on the t-th day of the year%
TjStartshedThe day on which the j-th batch of male parents reached the Startshed stateDOY
TjMaxshedThe day on which the j-th batch of male parents reached the Maxshed stateDOY
TjEndshedThe day on which the j-th batch of male parents reached the Endshed stateDOY
kjStartshedThe rate at which the j-th batch of male parents reached the Startshed state
kjMaxshedThe rate at which the j-th batch of male parents reached the Maxshed state
kjEndshedThe rate at which the j-th batch of male parents reached the Endshed state
SNtNumber of exposed silks per hectare on the t-th day of the yearsilks ha−1
rftPercentage of female population that started silking on the t-th day of the year%
TThe day after an individual ear begins sikingday
snTNumber of exposed silks on the T-th day after an individual ear begins silkingsilks ear−1
RftAccumulated percentage of female population with exposed silks on the t-th day of the year%
SNTAccumulative silking number on the T-th day after an individual ear begins silkingsilks ear−1
kfSilking rate of the female population
TfSilking time of the female population (day of year)DOY
TmaxDuration of the silking time of an individual earday
keSilking rate of an individual ear
LowKWLower limit of kernel weightmg kernel−1
SSRSource-sink ratiomg kernel−1
BBiomass gain post-floweringg plant−1

References

  1. Zhang, F.; Guo, S.; Ren, C.; Guo, P. Integrated IMO-TSP and AHP Method for Regional Water Allocation under Uncertainty. J. Water Res. Plan. Manag. 2018, 144, 040180256. [Google Scholar] [CrossRef]
  2. Zhang, C.; Guo, P. FLFP: A fuzzy linear fractional programming approach with double-sided fuzziness for optimal irrigation water allocation. Agr. Water Manag. 2018, 199, 105–119. [Google Scholar] [CrossRef]
  3. Yonts, C.D.; Haghverdi, A.; Reichert, D.L.; Irmak, S. Deficit irrigation and surface residue cover effects on dry bean yield, in-season soil water content and irrigation water use efficiency in western Nebraska high plains. Agr. Water Manag. 2018, 199, 138–147. [Google Scholar] [CrossRef]
  4. Díaz, F.J.; Grattan, S.R.; Reyes, J.A.; de la Roza-Delgado, B.; Benes, S.E.; Jiménez, C.; Dorta, M.; Tejedor, M. Using saline soil and marginal quality water to produce alfalfa in arid climates. Agr. Water Manag. 2018, 199, 11–21. [Google Scholar] [CrossRef]
  5. Zhao, J.; Li, M.; Guo, P.; Zhang, C.; Tan, Q. Agricultural Water Productivity Oriented Water Resources Allocation Based on the Coordination of Multiple Factors. Water 2017, 9, 4907. [Google Scholar] [CrossRef]
  6. Fan, Y.; Wang, C.; Nan, Z. Determining water use efficiency of wheat and cotton: A meta-regression analysis. Agr. Water Manag. 2018, 199, 48–60. [Google Scholar] [CrossRef]
  7. Kang, S.; Hao, X.; Du, T.; Tong, L.; Su, X.; Lu, H.; Li, X.; Huo, Z.; Li, S.; Ding, R. Improving agricultural water productivity to ensure food security in China under changing environment: From research to practice. Agr. Water Manag. 2017, 179, 5–17. [Google Scholar] [CrossRef]
  8. Jiang, X.; Kang, S.; Tong, L.; Li, F. Modification of evapotranspiration model based on effective resistance to estimate evapotranspiration of maize for seed production in an arid region of northwest China. J. Hydrol. 2016, 538, 194–207. [Google Scholar] [CrossRef]
  9. Li, X.; Zhang, X.; Niu, J.; Tong, L.; Kang, S.; Du, T.; Li, S.; Ding, R. Irrigation water productivity is more influenced by agronomic practice factors than by climatic factors in Hexi Corridor, Northwest China. Sci. Rep. 2016, 6, 37971. [Google Scholar] [CrossRef] [PubMed] [Green Version]
  10. Costa, J.M.; Ortuno, M.F.; Chaves, M.M. Deficit irrigation as a strategy to save water: Physiology and potential application to horticulture. J. Integr. Plant Biol. 2007, 49, 1421–1434. [Google Scholar] [CrossRef]
  11. Kang, S.; Shi, W.; Zhuang, J. An improved water-use efficiency for maize grown under regulated deficit irrigation. Field Crop. Res. 2000, 67, 207–214. [Google Scholar] [CrossRef]
  12. Fereres, E.; Soriano, M.A. Deficit irrigation for reducing agricultural water use. J. Exp. Bot. 2006, 58, 147–159. [Google Scholar] [CrossRef] [PubMed] [Green Version]
  13. Geerts, S.; Raes, D. Deficit irrigation as an on-farm strategy to maximize crop water productivity in dry areas. Agr. Water Manag. 2009, 96, 1275–1284. [Google Scholar] [CrossRef] [Green Version]
  14. Farré, I.; Faci, J.M. Deficit irrigation in maize for reducing agricultural water use in a Mediterranean environment. Agr. Water Manag. 2009, 96, 383–394. [Google Scholar] [CrossRef]
  15. Westgate, M.E. Water status and development of the maize endosperm and embryo during drought. Crop Sci. 1994, 34, 76–83. [Google Scholar] [CrossRef]
  16. Borras, L.; Westgate, M.E. Predicting maize kernel sink capacity early in development. Field Crop Res. 2006, 95, 223–233. [Google Scholar] [CrossRef]
  17. Wang, J.; Tong, L.; Kang, S.; Li, F.; Zhang, X.; Ding, R.; Du, T.; Li, S. Flowering characteristics and yield of maize inbreds grown for hybrid seed production under deficit irrigation. Crop Sci. 2017, 57, 2238–2250. [Google Scholar] [CrossRef]
  18. Lizaso, J.I.; Westgate, M.E.; Batchelor, W.D.; Fonseca, A. Predicting potential kernel set in maize from simple flowering characteristics. Crop Sci. 2003, 3, 892–903. [Google Scholar] [CrossRef]
  19. Borras, L.; Otegui, M.E. Maize kernel weight response to postflowering source-sink ratio. Crop Sci. 2001, 41, 1816–1822. [Google Scholar] [CrossRef]
  20. Borras, L.; Slafer, G.A.; Otegui, M.E. Seed dry weight response to source-sink manipulations in wheat, maize and soybean: a quantitative reappraisal. Field Crop. Res. 2004, 86, 131–146. [Google Scholar] [CrossRef]
  21. Wang, J. Modelling Flowering Characteristics and Kernel Number and Optimizing Irrigation Scheduling for Improving Water Use efficiency and Regulating Seed Quality in Hybrid Maize Seed Production. Ph.D. Thesis, China Agricultural University, Beijing, China, June 2017. [Google Scholar]
  22. Molinos-Senante, M.; Hernández-Sancho, F.; Mocholí-Arce, M.; Sala-Garrido, R. A management and optimization model for water supply planning in water deficit areas. J. Hydrol. 2014, 515, 139–146. [Google Scholar] [CrossRef]
  23. Li, X.; Huo, Z.; Xu, B. Optimal Allocation Method of Irrigation Water from River and Lake by Considering the Field Water Cycle Process. Water 2017, 9, 911. [Google Scholar] [CrossRef]
  24. Shang, S.; Mao, X. Application of a simulation based optimization model for winter wheat irrigation scheduling in North China. Agr. Water Manag. 2006, 85, 314–322. [Google Scholar] [CrossRef]
  25. Zhang, C.; Guo, P. A generalized fuzzy credibility-constrained linear fractional programming approach for optimal irrigation water allocation under uncertainty. J. Hydrol. 2017, 553, 735–749. [Google Scholar] [CrossRef]
  26. Lorite, I.J.; Ramirez-Cuesta, J.M.; Cruz-Blanco, M.; Santos, C. Using weather forecast data for irrigation scheduling under semi-arid conditions. Irrig. Sci. 2015, 33, 411–427. [Google Scholar] [CrossRef]
  27. Wen, Y.; Shang, S.; Yang, P. Optimization of irrigation scheduling for spring wheat with mulching and limited irrigation water in an arid climate. Agr. Water Manag. 2017, 192, 33–44. [Google Scholar] [CrossRef]
  28. Gonzalez Perea, R.; Camacho Poyato, E.; Montesinos, P.; Rodriguez Diaz, J.A. Optimization of irrigation scheduling using soil water balance and genetic algorithms. Water Resour. Manag. 2016, 30, 2815–2830. [Google Scholar] [CrossRef]
  29. Li, M.; Guo, P.; Singh, V.P. An efficient irrigation water allocation model under uncertainty. Agric. Syst. 2016, 144, 46–57. [Google Scholar] [CrossRef]
  30. Fu, Y.; Li, M.; Guo, P. Optimal allocation of water resources model for different growth stages of crops under uncertainty. J. Irrig. Drain. Eng. 2014, 140, 5014003. [Google Scholar] [CrossRef]
  31. Tong, F.; Guo, P. Simulation and optimization for crop water allocation based on crop water production functions and climate factor under uncertainty. Appl. Math. Model. 2013, 37, 7708–7716. [Google Scholar] [CrossRef]
  32. Mula, J.; Poler, R.; Garcia, J.P. MRP with flexible constraints: A fuzzy mathematical programming approach. Fuzzy Set. Syst. 2006, 157, 74–97. [Google Scholar] [CrossRef]
  33. Su, Y.Z.; Zhao, W.Z.; Su, P.X.; Zhang, Z.H.; Wang, T.; Ram, R. Ecological effects of desertification control and desertified land reclamation in an oasis-desert ecotone in an arid region: A case study in Hexi Corridor, northwest China. Ecol. Eng. 2007, 29, 117–124. [Google Scholar] [CrossRef]
  34. Guan, Q.; Yang, L.; Guan, W.; Wang, F.; Liu, Z.; Xu, C. Assessing vegetation response to climatic variations and human activities: spatiotemporal NDVI variations in the Hexi Corridor and surrounding areas from 2000 to 2010. Theor. Appl. Climatol. 2018. [Google Scholar] [CrossRef]
Figure 1. The framework of the integrated water-saving and quality-guarantee uncertain programming (IWQUP) approach.
Water 10 00908 g001
Figure 2. The algorithm flow chart.
Water 10 00908 g002
Figure 3. The upper and lower bounds of the optimal yield under different memberships in three hydrological years.
Water 10 00908 g003
Figure 4. The upper and lower bounds of crop water productivities under different scenarios.
Water 10 00908 g004
Figure 5. The comparison of yield from models (7), (8), and (9).
Water 10 00908 g005
Table 1. Coefficients of the Jensen model for yield, flowering characteristics, and biomass gain.
Growth StageEstablishmentVegetativeFloweringYield-FormationRipening
Parameter
Yield0.85260.69480.88460.55270.0533
kf 0.43680.3178
Tf −0.0161−0.0253
ke 0.17430.1685
SNX 0.18400.2812
TPD 0.33170.2616
B 0.56050.69441.02770.1036
Table 2. Coefficients of the day and the rate of the j-th batch of male parents which have reached the Startshed, Maxshed, Endshed states (TjStartshed, TjMaxshed, TjEndshed, kjStartshed, kjMaxshed, kjEndshed).
CoefficientβC CoefficientβC
Parameter Parameter
T1Startshed−0.03221.0031k1Startshed0.68160.3138
T1Maxshed−0.02991.0298k1Maxshed0.72570.2482
T1Endshed−0.02321.0226k1Endshed0.53230.4833
T2Startshed−0.02201.0219k2Startshed0.53640.4726
T2Maxshed−0.01961.0192k2Maxshed0.55400.4360
T2Endshed−0.01621.0163k2Endshed0.27910.7002
Table 3. The upper and lower bounds of the maximum potential evapotranspiration under sufficient water supply (ETm) and the efficient rainfall (EP) in different hydrological years (mm).
Growth StageEstablishmentVegetativeFloweringYield-FormationRipening
ETm[35.2,46.7][120.3,147.0][127.2,159.3][103.4,119.5][41.7,57.6]
EPHigh[11.8,13.2][27.2,30.2][21.8,24.2][18.0,20.0][11.3,12.6]
Medium[5.4,6.5][17.1,20.9][11.5,14.1][9.9,12.1][4.1,5.0]
Low[1.4,1.7][8.8,10.7][4.5,5.4][4.6,5.6][0.4,0.5]
Table 4. The water availability (WA), the minimum kernel number (KNmin), and the minimum lower bound of kernel weight (LowKWmin) and their slack values in different hydrological years.
Hydrological YearWA
(mm)
Slack
(mm)
KNmin
(kernel/ear)
Slack
(kernel/ear)
LowKWmin
(mg/kernel)
Slack
(mg/kernel)
High267601602026040
Medium290401402026040
Low330201402026040
Table 5. The results of the optimal irrigation strategy of various growth stages under different tolerance levels and the corresponding memberships in each hydrological year.
Hydrological YearTolerance LevelMem-BershipIW1 (mm)IW2 (mm)IW3 (mm)IW4 (mm)IW5 (mm)
High11[0,9.9][50.3,85.6][88.7,128.5][76.8,100.3][0,8.3]
20.75[0,12.9][64.4,106][97.7,132.9][68,97.3][0,9.1]
30.5[0,17.3][72.3,115.8][100.2,134.6][70.4,100.7][0,15.4]
40.25[0,16.7][76.2,114.2][95.2,135.9][71.1,100.7][0,25.1]
50[0,25.8][78.4,117.2][101.9,136.1][77.5,101.3][0,35.8]
Medium11[0,30.3][52.2,84.9][93.9,126.4][84.1,107.5][2.8,19.3]
20.75[0,29.5][57,96.8][98.8,139.4][77.4,104.6][0,12.4]
30.5[0,29.9][66.5,111.3][106.9,141.3][67.4,101.5][0,12.8]
40.25[0,26.5][68.6,116][108.7,145.8][69.7,99.5][0,12.6]
50[0,24.4][80.9,120.3][111.3,146.7][68.8,106.5][0.2,19.7]
Low11[2.2,24.6][65.0,98.0][103,143.4][88.3,113.3][7.8,25.2]
20.75[2.2,26.2][70.6,109.7][109.3,145.7][81.9,111.2][3.6,22.3]
30.5[2.2,22.5][78.8,116.6][105.3,147.8][71.8,105.3][4,20.7]
40.25[2.3,25.7][76,119.7][115.6,149.9][75.3,106.1][4.6,20.9]
50[2.2,34.9][80.4,125.7][114.5,150.6][74.1,111.2][4.5,17.2]
Table 6. The maximum potential evapotranspiration under sufficient water supply (ETm) and the efficient rainfall (EP) in different hydrological years of model (9).
Growth StageEstablishmentVegetativeFloweringYield-FormationRipening
ETm (mm)41.0133.6143.3111.549.7
EP (mm)High12.528.723.019.012.0
Medium6.019.012.811.04.5
Low1.69.85.05.10.5
Table 7. The results from models (7), (8), and (9).
Hydrological YearKN (kernel/ear)LowKW (mg/kernel)
Model (7) with Membership = 1Model (8)Model (9)Model (7) with Membership = 1Model (8)Model (9)
High[181.7,229][196.7,241.4]212.6[260.2,272.9][210.1,272.7]215.6
Medium[163.8,211][195.7,234.8]213.6[260,266.5][223,261.4]239.1
Low[172.7,231.4][190.9,241.4]215.3[260.1,270][235.5,260.6]243.5

