Snowmelt Water Alters the Regime of Runoff in the Arid Region of Northwest China


1
State Key Laboratory of Desert and Oasis Ecology, Xinjiang Institute of Ecology and Geography, Chinese Academy of Sciences, Urumqi 830011, China
2
State Key Laboratory of Soil Erosion and Dryland Farming on the Loess Plateau, Northwest A & F University, Yangling 712100, China
*
Authors to whom correspondence should be addressed.
Water 2018, 10(7), 902; https://doi.org/10.3390/w10070902
Submission received: 27 April 2018
/
Revised: 3 July 2018
/
Accepted: 3 July 2018
/
Published: 8 July 2018
(This article belongs to the Section Hydrology)
Abstract
:Seasonal snowmelt water from mountainous areas is critical for water supply in arid regions. Snowmelt profoundly affects the parameterization of the Budyko framework, which describes the long-term relationship between precipitation and runoff. This is true in Xinjiang, a representative arid region in Northwest China. However, the effects of snowmelt water on the water balance in this region remain unclear. Based on observed runoff data in 64 catchments of Xinjiang during 2000–2010, we analyzed the effects of meltwater in the local water balance both spatially and temporally through the Budyko curve and redundancy analysis (RDA) methods, and then investigated the influences of changing meltwater on runoff. Inclusion of snowmelt water into the item of the water availability significantly improved the performance of the Budyko equation for predicting runoff. The results of RDA showed that snowmelt water, potential evaporation (PET), and rainfall combined explained 66% of the spatial variations in runoff, while the individual effects of snowmelt water, PET, and rainfall were 19%, 13%, and 1%, respectively, with the interactions among the three variables being 16%. These results suggest that the accelerating changes of meltwater due to climate warming will significantly alter the regimes of runoff in these regions.
1. Introduction
Snow cover and glaciers are some of the most sensitive indicators of climate change [1]. The fractional snow cover has shown a significant declining trend in the northern hemisphere due to global warming [2], and glacier mass losses and glacier retreats have been observed on a global scale [3]. These changes have a long-term impact on the available water resources in arid and semi-arid regions where the dominant water resource is snowmelt- or glacier-melt water, such as the mountainous areas of the Central Asia (CA). CA has the most meltwater-dependent river systems in the world [4], and the river flow is experiencing significant changes in the context of intensified snow or glacier melting [5]. The contributions of snowmelt water to runoff at regional scales deserve our great attention.
Xinjiang (China) lies in the mid-latitude arid regions of CA, which is spatially divided by the Altay Mountains, Tienshan Mountains and Kunlun Mountains, from the north to south. These mountains have the second largest glacier area (43.7%) and the largest glacier mass (47.97%) in China [6], acting as water towers of the arid regions of CA. Rivers originating in these mountains are mainly fed by snowmelt and glacier-melt water. The air temperature in mountainous areas has experienced a sharp increase over the past half-century [7,8], accompanied by accelerated snow and glacier melting as a consequence. Many studies have revealed the significant trend of glacier/snow-cover shrinkage and snowline rising occurring in Tienshan Mountains [9,10,11], and half of its total glacier volumes will be lost by the 2050s [12]. As a result, the surface runoff has shown sustained, increasing trends in recently years [7,8,13,14], such as in Manas River [15] and Aksu River [16], whose meltwater accounts for 25% and 56–85% of their total annual runoff, respectively. Therefore, the amount of snow/glacier meltwater is crucial to the runoffs in Xinjiang, and their changes will affect their downstream water resources both spatially and temporally. It is of great importance to comprehensively investigate the impacts of “warm-wet” climate change [17] on snow/glacier cover and thus local water balance across Xinjiang. A number of studies have addressed the significance of snow/glacier meltwater and its potential effects on runoffs at an individual catchment scale [13,15,18,19], but few have compared the local difference and seasonal changes among different catchments.
There are many methods of estimating the effects of snow and glacier meltwater on runoff (e.g., linear regressions [16,20], the energy balance model [21,22], the temperature-index model [23,24], and the hydrological model [4,25]). The statistical models simplify physical processes so that they are more appropriate in remote catchments with few in situ data, which leads to lower model accuracies and higher uncertainties of the results [26]. The hydrological models based on physical principles require a combination of meteorological, hydrological, and glaciological data, which makes model computing more time-consuming and inefficient [27,28]. Furthermore, these models can rarely be applied to the alpine regions of Xinjiang, where having too few observational data is insufficient. The Budyko framework is a model used to separate the precipitation between actual evaporation (ETa) and runoff as a function of the aridity index (the ratio between potential evaporation and precipitation, PET/P) [29,30]. It has been widely applied to study the effects of different water resources (e.g., effective precipitation [31], snowfall [32], irrigation [33], soil water [34], and groundwater [35]) on runoff in semi-arid and arid regions. Many previous studies made significant progress at incorporating different water resources (other than local precipitation) into the Budyko framework, but the effects of snow and glacier meltwater on runoff remain uninvestigated.
In this study, we improved the parameterization of the Budyko framework by including the effects of meltwater in the item of water availability, and we quantified the contribution of major climatic variables to spatial variations in runoff among 64 headwater catchments of Xinjiang during 2000–2010. Further, we assessed the impacts of climate change on snow cover and runoff at 33 catchments with long-term observations among those 64 catchments for the period 1970–2010. Therefore, the aims of this study are to (1) assess the spatiotemporal contribution of snow and glacier meltwater on runoff in Xinjiang and (2) investigate the effects of climate warming on snow cover, and thus water balance, in this arid region.
2. Materials and Methods
2.1. Study Area
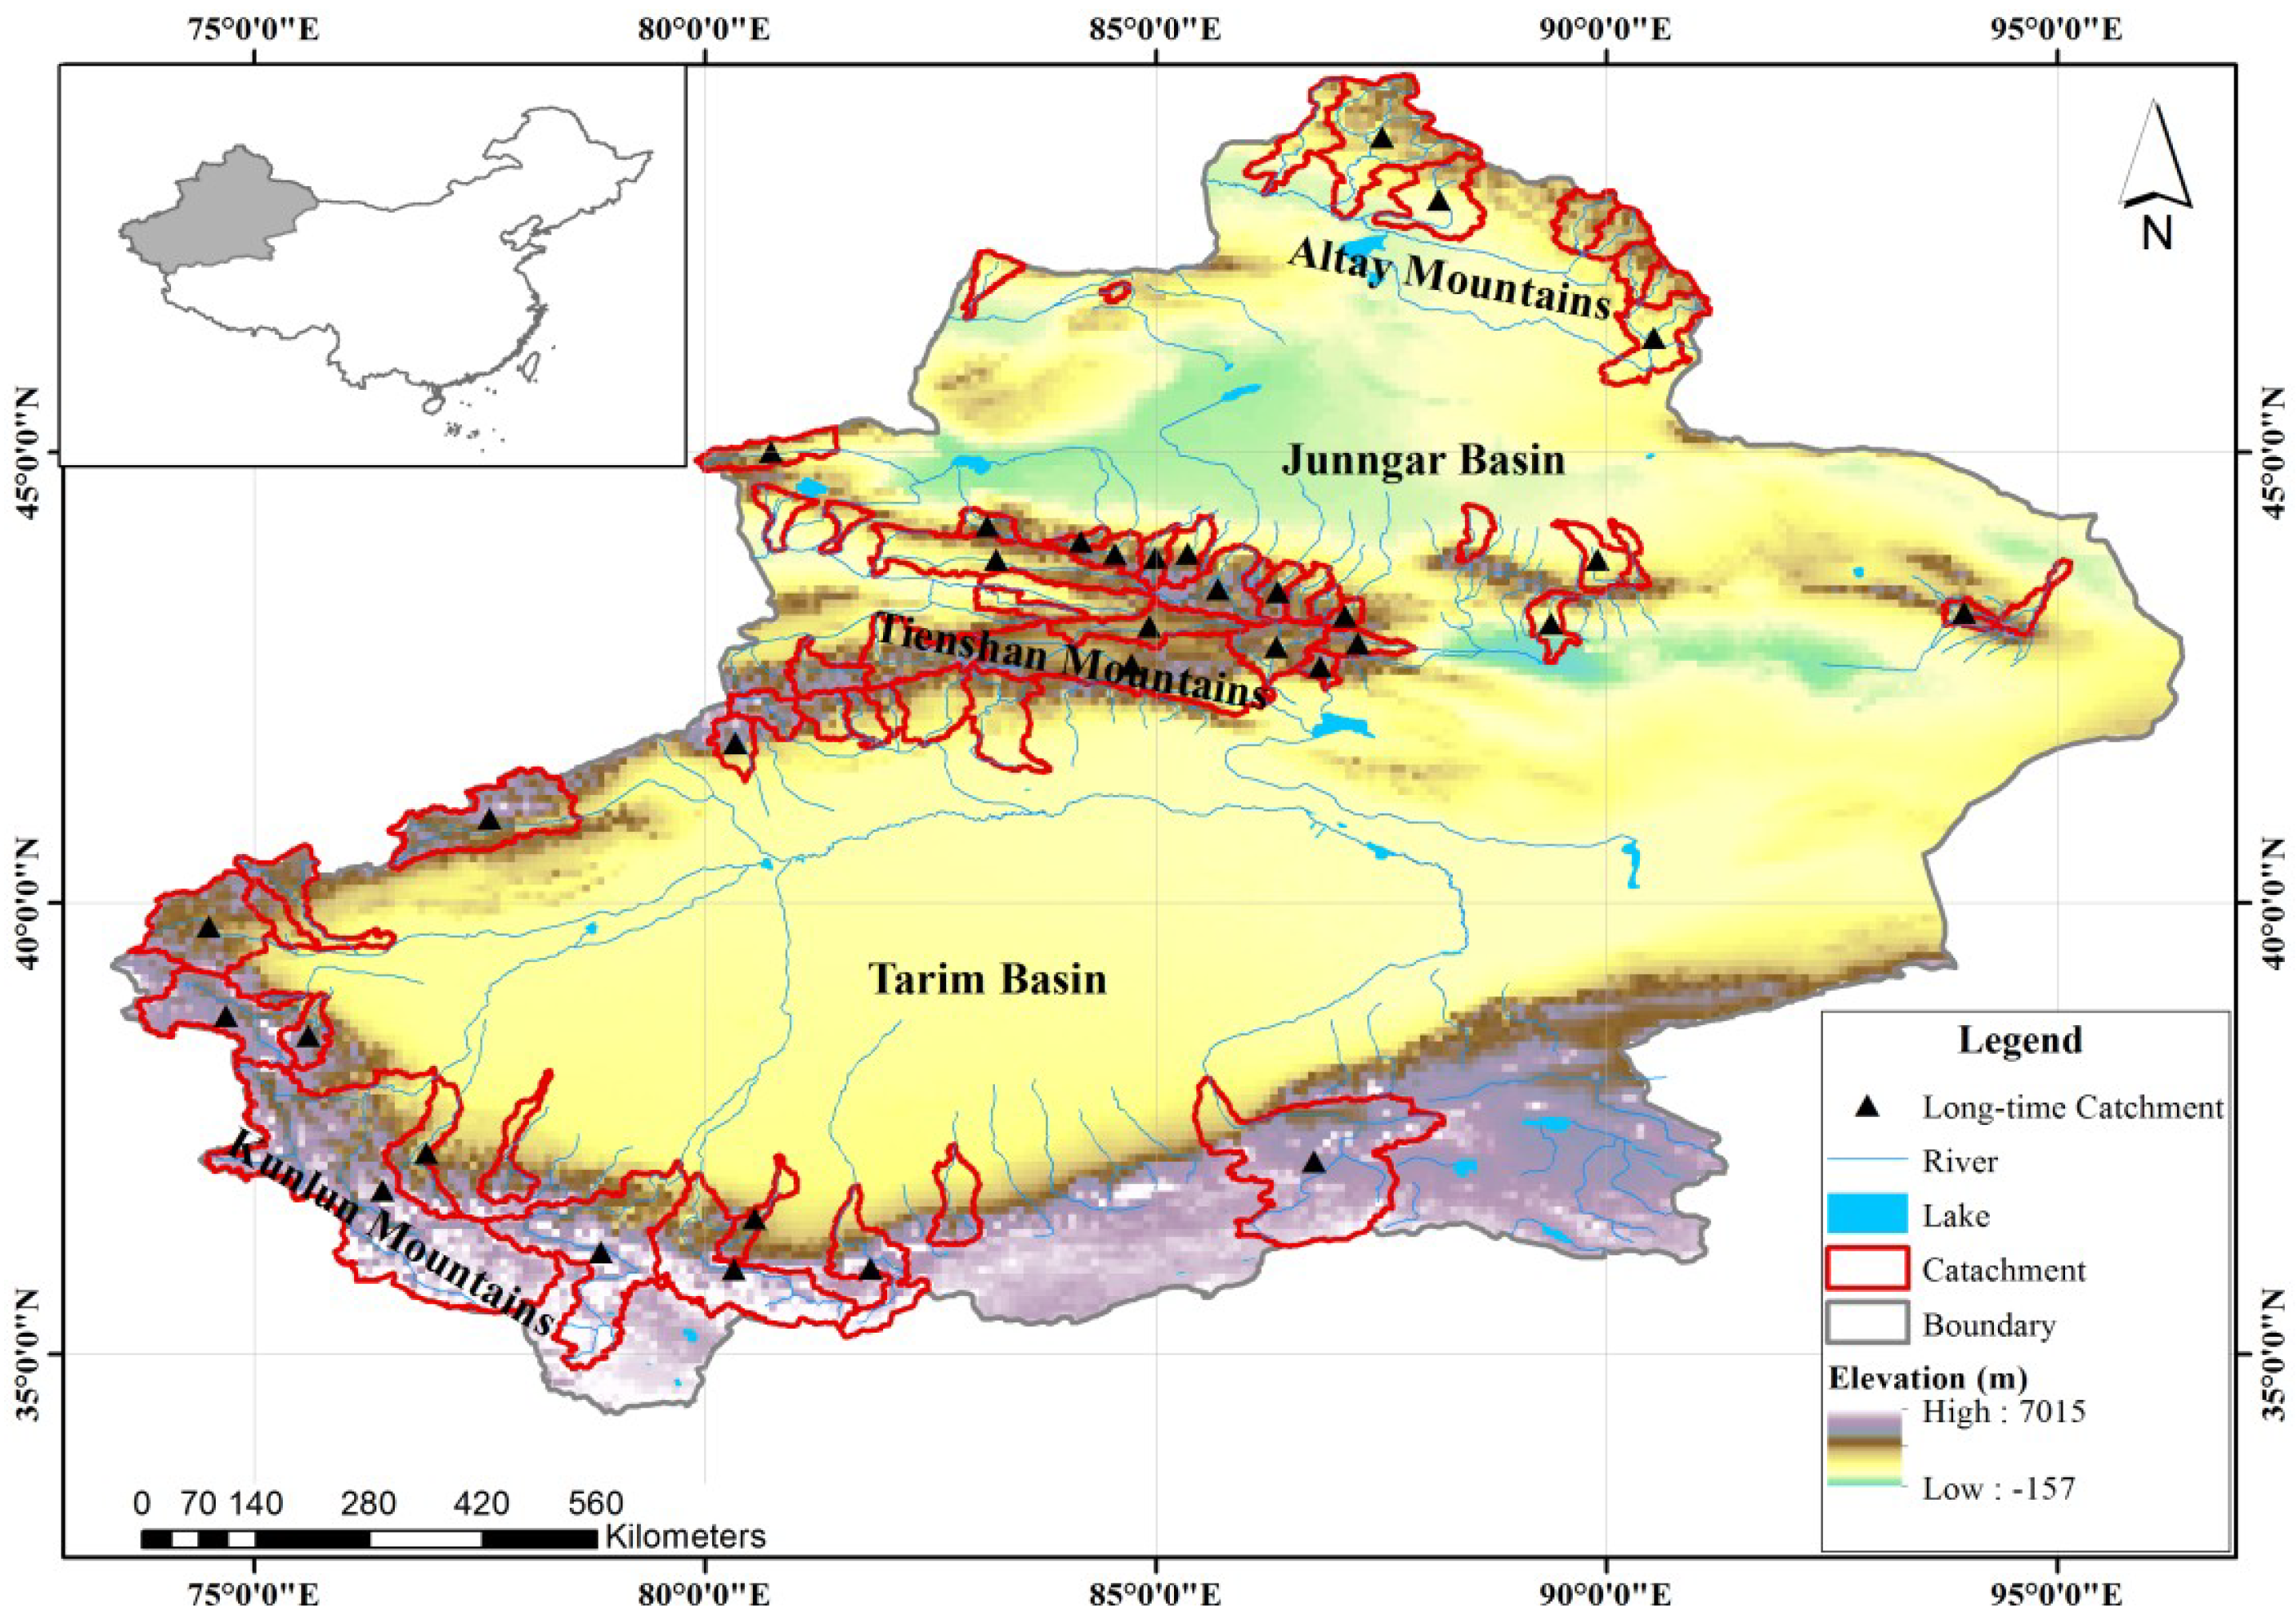
Xinjiang Province is located in northwestern China. Its north edge is the Altay Mountains and the south edge is the Kunlun Mountains. The middle Tienshan Mountains partition the entire area between Junggar Basin and Tarim Basin (Figure 1). Alpine mountains intercept the atmospheric transfer of water vapor, causing about 84% of the total precipitation occurring in the mountainous areas [7]. Due to the low temperature at high altitudes, snowfall is the major form of water resource. The snow and glacier storage in mountain ranges is regarded as a water tower for Xinjiang. Most river systems are recharged by snow and glacier meltwater.
In this study, 64 headwater catchments with few anthropogenic influences in high-altitude regions were selected across Xinjiang (Figure 1). The boundaries of 64 catchments were determined using the digital elevation model (DEM) data at a resolution of 90 m, obtained by the Shuttle Radar Topography Mission (SRTM) of NASA [36]. There are 12 catchments in the Kunlun Mountains, 10 catchments in the Altay Mountains, and 42 catchments in the Tienshan Mountains. The area of these catchments ranges from 298 km2 to 43,343 km2, and the elevation ranges from 1049 m to 4638 m. The annual precipitation varies from 118 mm to 778 mm, and the annual pan evaporation is from 560 mm to 1202 mm. The ratio of annual runoff to precipitation across 64 catchments ranges is from 0.10 to 2.04, with an average value of 0.59.
2.2. Data
Daily meteorological data during 1961–2010 were acquired at 51 base stations from the China Meteorological Administration (CMA), including air temperature, sunshine hours, wind speed, and relative humidity. The observed meteorological data was interpolated into 10 km × 10 km grids based on the meteorological distribution system for high-resolution terrestrial modeling (MicroMet) [37]. The potential evaporation was estimated using the Penman–Monteith equation [38] for each grid cell. The daily grid precipitation data (0.5° × 0.5°) during 1961–2010 was also from the CMA. The precipitation on days with an average daily temperature below 1 °C was taken as snowfall, otherwise as rainfall [39]. The grid precipitation data was statistically downscaled using a multiple linear regression model with five terrain factors (longitude, latitude, elevation, slope, and aspect) as independent variables for individual years [40].
Monthly discharge data for 64 gauges during 2000–2010 were obtained from the Hydrological Bureau of the Ministry of Water Resources of China. Discharge observations at 33 of 64 gauges were from the period 1970–2010 (Table 1). We calculated the annual runoff for each hydrological year from 1 September to 31 August in the subsequent year.
Two satellite-derived snow cover fraction data (SCF) were used. MODIS/Terra Snow Cover 8-Day L3 product (MOD10C2, 500 m × 500 m) during 2000–2010 was downloaded from the National Snow and Ice Data Center (NSIDC) [41]. The long-term SCF data during 1970–2010 was built from Northern Hemisphere EASE-Grid 2.0 Weekly Snow Cover and Sea Ice Extent (Version 4) [42].
2.3. Theory and Method
To investigate the significance of snowmelt water in the water balance in arid regions, we took advantage of the Budyko framework. Further, classification and regression tree (CART) and redundancy analysis (RDA) were employed to identify the critical factors (including rainfall, snowfall, snow meltwater, and PET) determining the spatial variations of runoff (Q).
2.3.1. Budyko Framework
The Budyko framework has various quantitative descriptions. We chose Fu’s equation [43], which has a parameter (ω) to account for catchment properties.
where P is precipitation, ETa is actual evaporation, PET is potential evaporation, and ω is a fitting parameter.
In the improved Budyko framework, the water supply for ETa is the annual sum of rainfall and snow/glacier meltwater (Rain + Qs), and the energy supply to ETa is estimated by mean annual PET. Fu’s equation can be rewritten:
By combining Equations (1) and (2), runoff (Q) was estimated by the following expression:
Equation (3) can be used to calculate the mean annual runoff when mean annual values of rainfall, snowmelt water, and PET are known.
2.3.2. Estimation of Snowmelt Water
Snowmelt water was estimated using Moderate Resolution Imaging Spectroradiometer (MODIS) snow cover data through a temperature-index method, which is based on an assumed relationship between ablation and positive temperature sums [23,44].
where QSi (mm) is snowmelt water in the N time interval, DDF (mm/d/ºC) is degree-day factor, Ti+ (°C) is the sum of positive air temperature of each time interval, Si (km2) is SCF. In this study, the DDF values of snow and ice ablation for basins were assigned values from Zhang, et al. [45], who summarized the spatial distribution of observed DDF from an investigation of major glaciers in Western China.
2.3.3. Statistical Analysis
Linear regression was used to characterize the temporal trends in air temperature, precipitation (rainfall and snowfall), SCF, and runoff in the 33 of 64 catchments, from 1970 to 2010. We also used linear regression to analyze the relationship among climate factors, SCF, and runoff.
2.3.4. Quantifying the Contributions
Classification and regression tree analysis has been widely used to identify the critical factors determining the spatial distribution of soil properties [46], carbon dioxide fluxes [47], and so on. A CART analysis was conducted within the R free software environment (Version 3.4.0) using the ‘rpart’ package. In the CART model, runoff of each basin was used as a response variable and climate variables (rainfall, snowfall, snowmelt water, and PET) were utilized as model inputs.
Redundancy analysis was then conducted to quantify the contributions of critical variables filtered by CART to the response variables. The ”vegan” package in the R software environment was used to perform the partial RDA. All critical factors were initially included in the model setup to calculate the total explanatory power (the proportion of the constrained inertia to the total inertia). Subsequently, each critical factor was alternately parsed out as constraints to analyze the individual and mixed effects. Finally, the fractions of explained variation were drawn by Venn diagram.
3. Results
3.1. The Effects of Snow Meltwater on Water Balance Based on the Budyko Framework
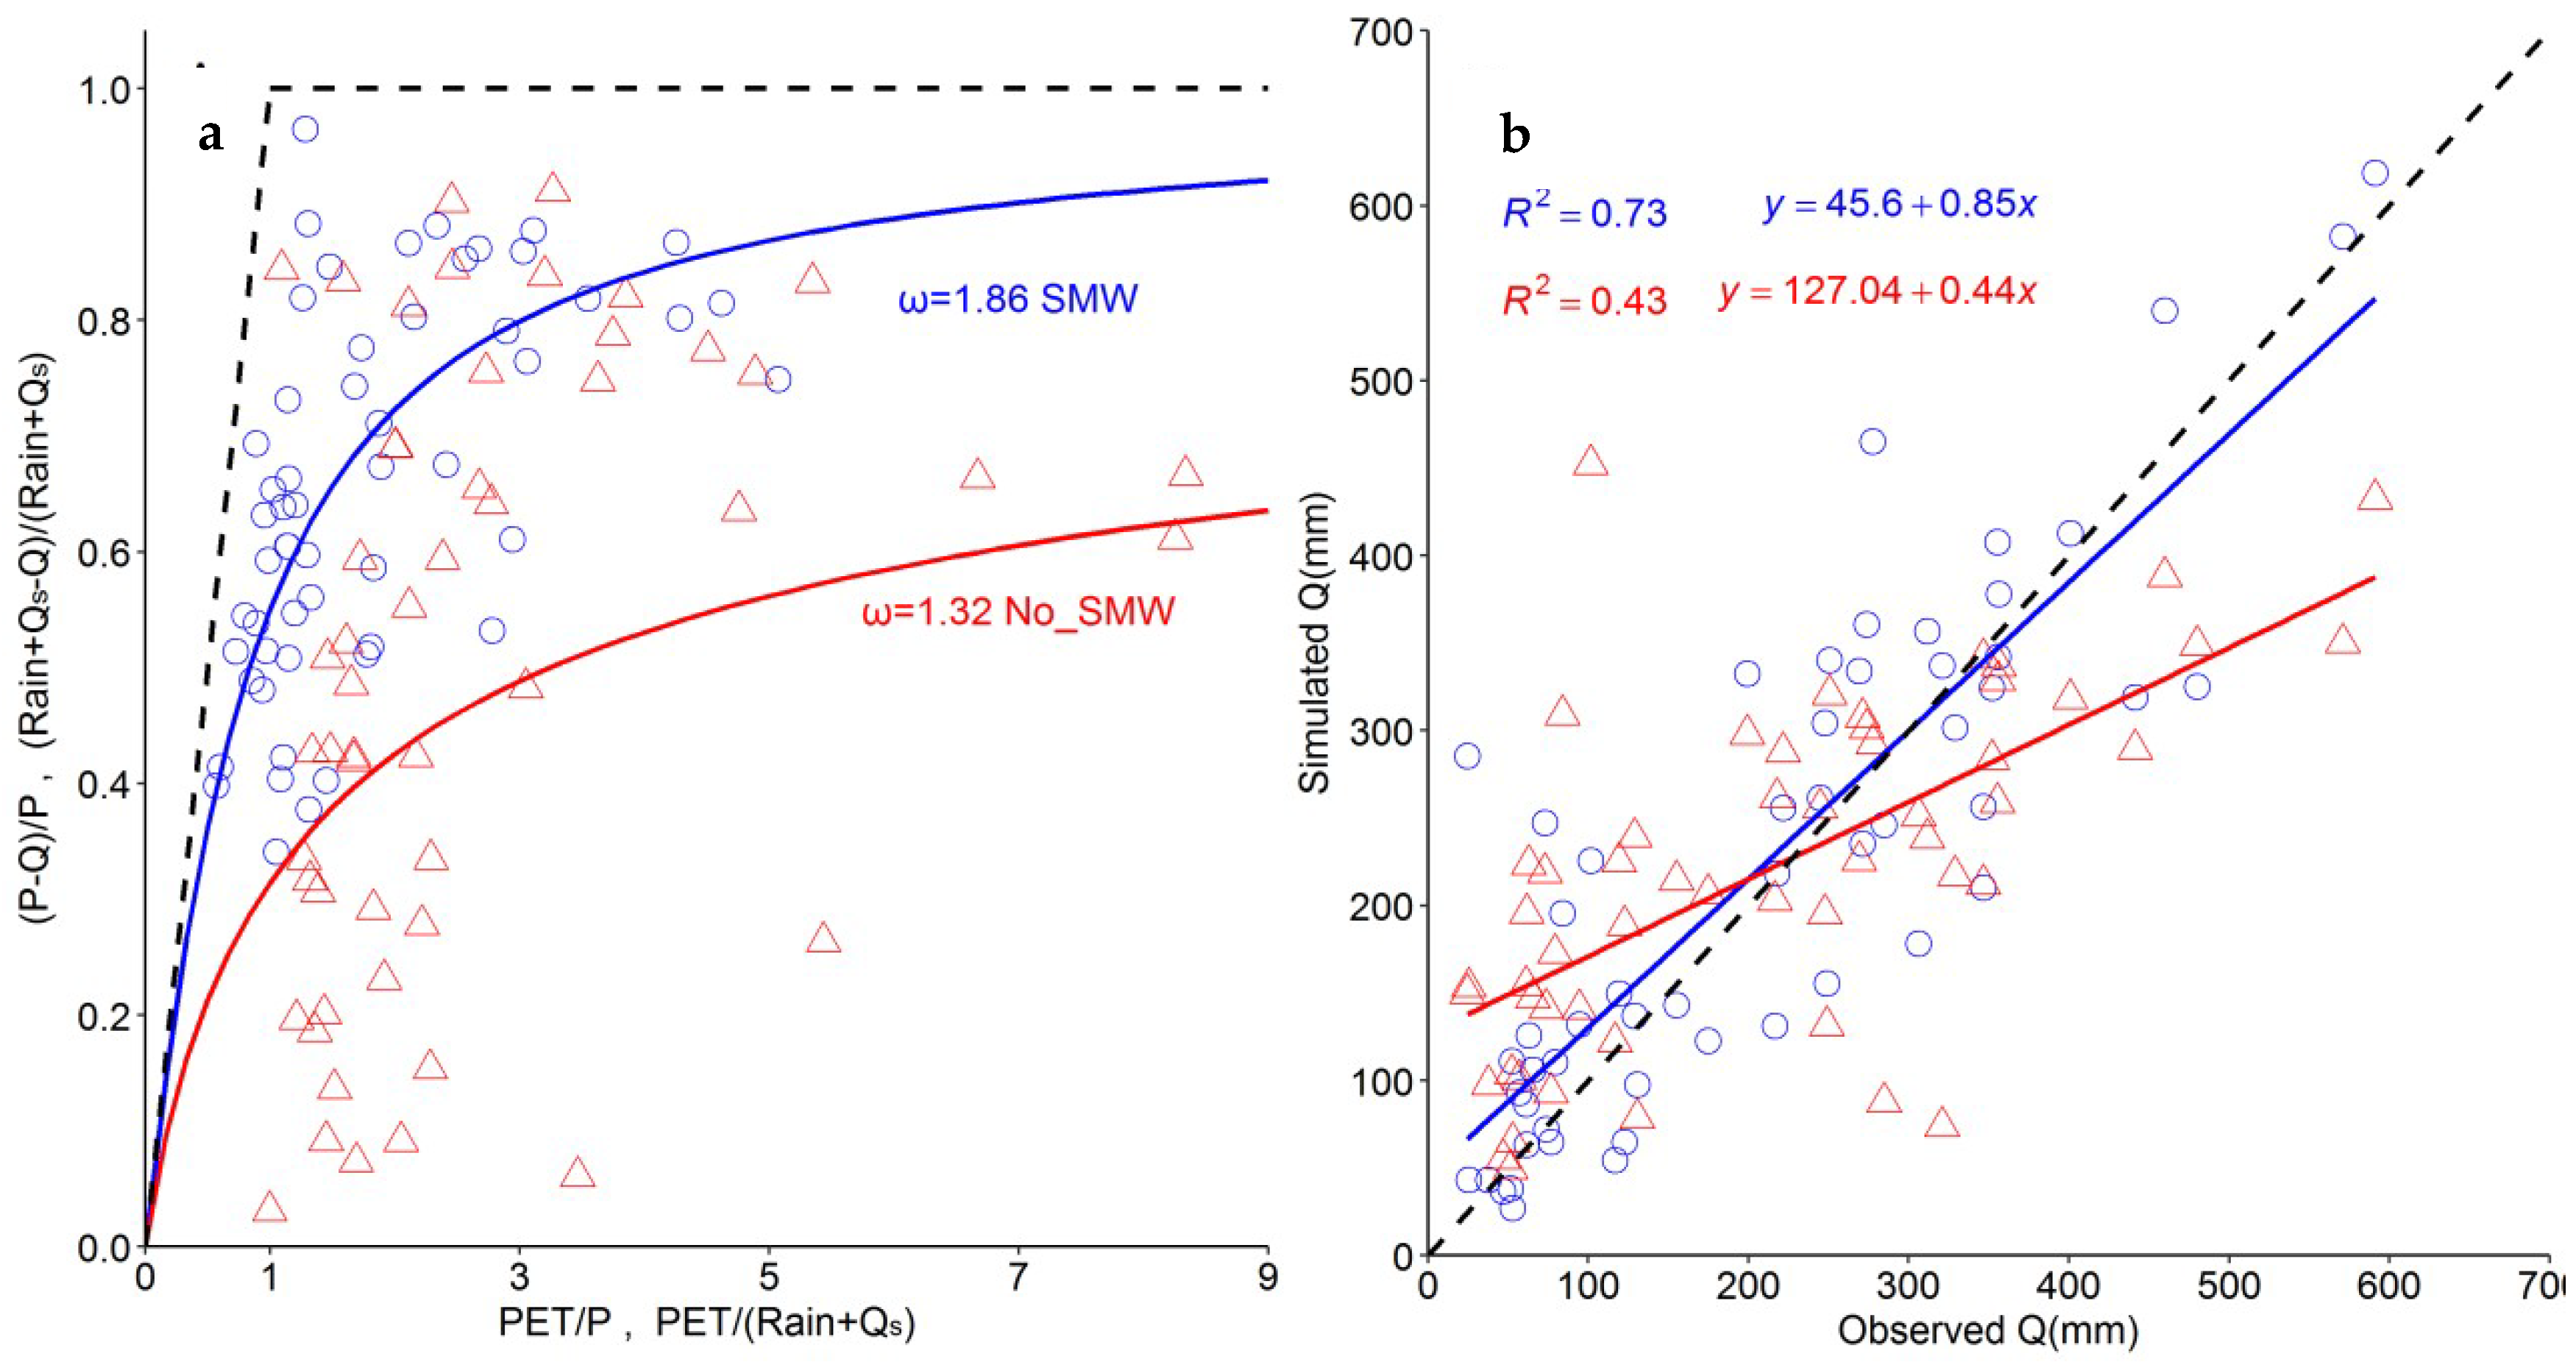
Without considering snow meltwater, ETa was greatly underestimated, as precipitation was the only source of water supply in the original Budyko curve (Figure 2a). In fact, snow meltwater was an important water source for ETa in most upstream basins of Xinjiang. After considering the snow meltwater process, ETa increased with the increases of available water in the improved Budyko curve. The evaporation ratio ((P − Q)/P) in the original Budyko curve was much lower than that ((Rain + Qs − Q)/(Rain + Qs)) in the improved Budyko curve. This indicated that glaciers and snow meltwater can change the partitioning of available water to ETa, and thus play an indispensable role in the local water budget in snowmelt-dominated catchments of Xinjiang.
Figure 2b and Table 2 show the comparison between observed and predicted runoff using optimized parameter ω of 1.32 and 1.86 in the original and improved Budyko equation, respectively. The slope of the original Budyko equation (0.43) was much lower than that of the improved Budyko equation (0.73), showing that the original Budyko equation, which does not consider snow meltwater, severely underestimated the runoff. The average error in predictions of the original Budyko equation was 112.19 mm yr−1, and this error was approximately 52.84% of the annual average stream flow for these catchments (212.33 mm yr−1). By incorporating the snow meltwater into the Budyko equation, the accuracy of modeled stream flow improved to 80.83 mm yr−1 (which is 38.07% of the observed runoff). This illustrated that the Budyko equation including snow meltwater could be used for predicting the actual runoff for upstream catchments of Xinjiang.
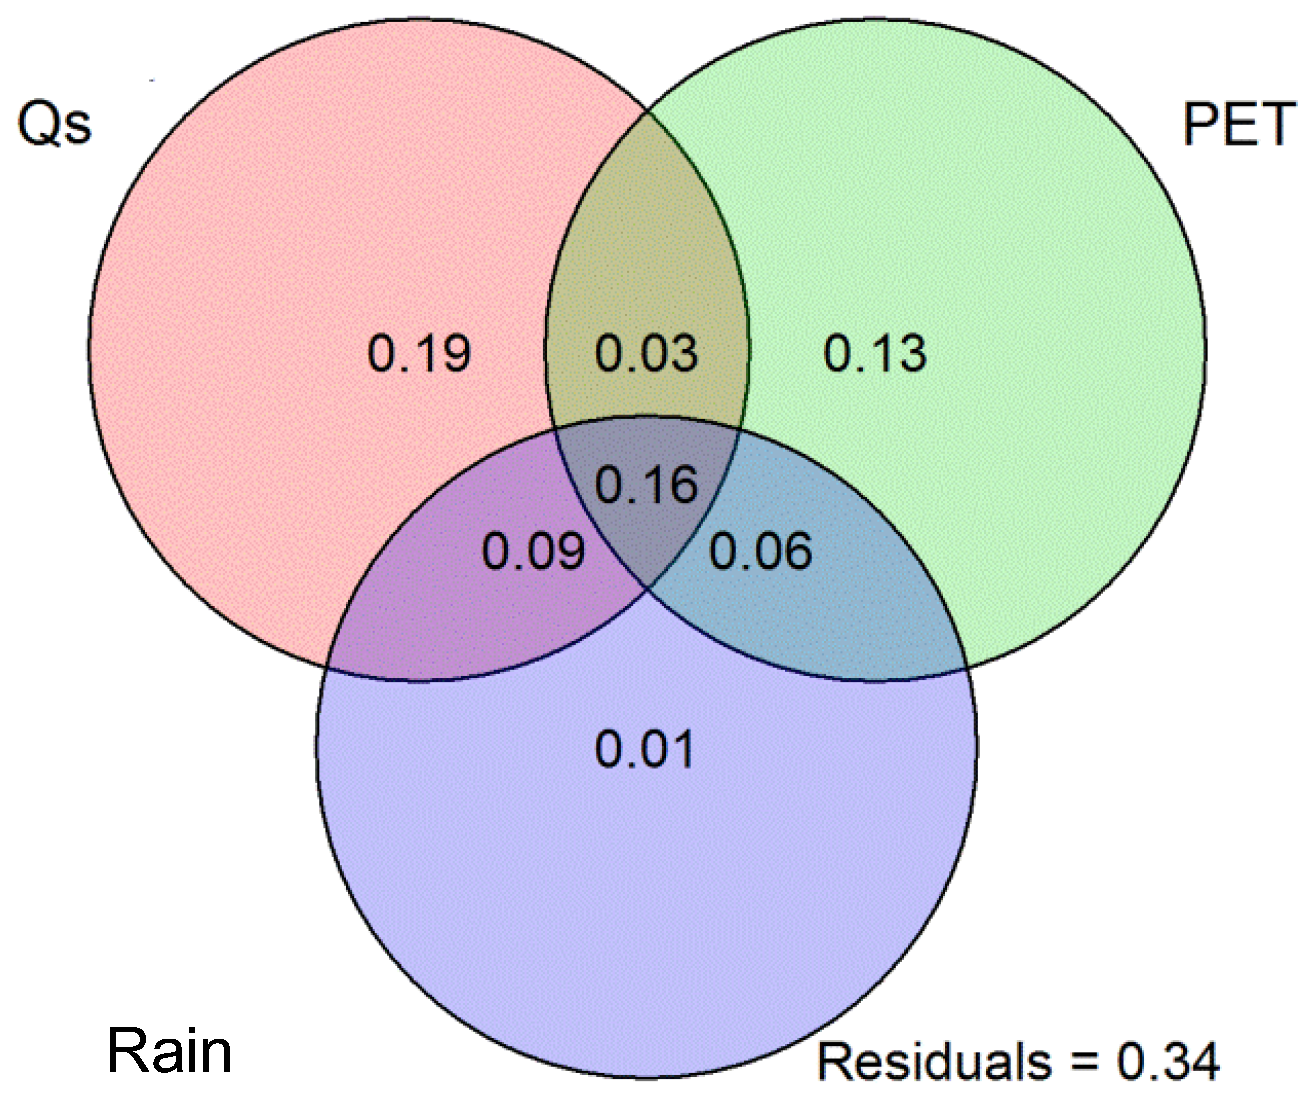
The CART results showed that the snowmelt water and PET factors were the main factors for controlling the distribution of runoff in Xinjiang. Rainfall had a minor effect on the spatial variations in runoff. The results of variation partitioning showed that the snowmelt water, PET, and rainfall combined explained 66% of the spatial variations of runoff (Figure 3). About 34% of the variation remains unexplained. The result of RDA indicated that the spatial variation of runoff can be explained by the pure effects of snowmelt water (19%), PET (13%), rainfall (1.0%), and interactions among the above-mentioned variables (16%). This showed that snowmelt water exhibited a large pure effect on the spatial variations in runoff in the snowmelt-fed catchments of Xinjiang.
3.2. Changes in Runoff and Control of Meteorological Variables during 1970–2010
The changes in air temperature, precipitation (rainfall and snowfall), SCF, and runoff in 33 of 64 catchments during 1970–2010 were analyzed (Figure 4) to investigate effects of climate change on runoff. Air temperature showed a statistically significant increase at 33 catchments in the Tienshan Mountains and Kunlun Mountains (Figure 4a), with a mean warming rate of 0.027 ± 0.006 °C yr−1. Precipitation at most catchments also significantly increased, with an average increasing rate of 1.095 ± 1.092 mm yr−1. There were 14 of 33 catchments presenting a strong increase at a significance level of 0.05. In contrast, only 4 of 33 catchments experienced weak decreasing trends (Figure 4b). The partition of precipitation was sensitive to climate warming. Rainfall showed increasing trends at most of the catchments except the WQ catchment (Table 1). Fifteen of 33 catchments had significantly increased rainfall (p < 0.05); these catchments are distributed in the middle Tienshan and Kunlun Mountains (Figure 4c). Meanwhile, snowfall increased at 16 of 33 the catchments and decreased at the remaining 17 catchments (Figure 4d). A significant increasing trend of snowfall has occurred in the Altay Mountains, whereas decreasing trends of snowfall generally appeared in the Kunlun Mountains. Most catchments showed a decreasing trend of SCF as the climate has warmed. SCF decreased at 26 of the 33 catchments, with 15 being significant with p < 0.05 (Figure 4e). The catchments located in the Kunlun Mountains showed a greater decreasing trend of SCF than those in the other two mountain regions (Figure 4e). The runoff showed a significantly increasing tendency at 16 of 33 watersheds (p < 0.05), but a nonsignificant decreasing trend at 2 of 33 catchments. The catchments in the Tienshan and Altay Mountains showed a greater increasing trend of runoff than those in the Kunlun Mountains (Figure 4f).
3.3. The Relationship between Runoff and Meteorological Variables during 1970–2010
The warming climate has implications for snow cover, such as increased surface energy available to drive evaporation and a decreased proportion of precipitation falling as snow, which also influences runoff. Figure 5a indicates a negative correlation between temperature and SCF at 33 catchments, and 13 of the 33 catchments showed statistical significance (p < 0.05). The decreasing trend of SCF also influences the changes in runoff. There were 11 of 33 catchments that showed a significantly linear correlation between runoff and SCF (p < 0.05) (Figure 5b). A significantly positive correlation existed between runoff and SCF at 4 of 11 catchments, while a negative correlation existed at the other 7 catchments. This implied that climate warming has accelerated meltwater in high mountains and also increased the runoff in some meltwater-fed catchments. The increase in precipitation was associated with an increase in air temperature, and 13 of 33 catchments were at the significance level of 0.05 (Figure 5c). Moreover, a decrease in the annual ratio of snowfall to precipitation (S/P) was observably connected with the increase in air temperature, and 30 of 33 catchments were at the significance level of 0.05 (Figure 5d). The increases in air temperature led to increases in rainfall at most catchments. The increase in annual runoff has a direct association with the increases in annual rainfall, and 19 of 33 catchments expressed a statistical relation (Figure 5e). However, snowfall had a delayed influence on runoff, and 7 of 33 catchments showed a significant relationship between snowfall and runoff (Figure 5f).
4. Discussion
4.1. The Effects of Meltwater on Water Balance Based on the Budyko Framework
The original Budyko framework for steady-state water balance assumes that the potential water supply for ETa is only precipitation, thus it does not depend on both ETa and runoff in a catchment. However, the water supply, mainly originated from the snowmelt water in high mountain regions, is influenced by ETa-runoff processes due to the feedback mechanism. This interdependence between the water supply and ETa significantly reduces the efficiency of using the standard Budyko framework. In the improved Budyko framework of this study, the ω parameter (1.86) was close to that in the inland River Basins of Gansu (1.3–1.8) [48] and upper catchments of cold and semi-arid zones in the Heihe River, Northwest China (1.34–1.69) [31]. The values of the ω parameter in these upstream basins were lower than those in the main water-consuming regions of oasis (1.88–2.27) [31,33]. This indicated that snowmelt water provides more available water for runoff in the dry mountain basins, while more water was consumed as ETa in the downstream basin, largely by agricultural activities.
In this study, the CART results showed that snowmelt water, PET, and rainfall combined explained 66% of the spatial variations in runoff. These values indicated that 34% of the variations were not captured by evaluating the above three factors. The spatial patterns of runoff are likely affected by precipitation characteristics (intensity and frequency), soil texture, vegetation cover and density, and geomorphology [49]. Soil properties, such as water storage capacity and permeability, could also change the partition of precipitation into runoff. For example, Yang et al. [48] found that the regional pattern of annual water balance is closed to the relative infiltration capacity, soil water storage, and mountain slope. Vegetation dynamics, including leaf area, photosynthetic rate, rooting depth, and so on, also influence the ETa, as well as the water balance [50].
4.2. The Effects of Snow and Glacier Meltwater on Runoff
A number of studies have quantified the contribution of meltwater to runoff in snow- and glacier-fed catchments which are in or around our study areas (Table 3). These results, derived from various methods (e.g., water balance, temperature-index model, and hydrological model), showed large variations among different mountain ranges. The contributions of meltwater to runoff reached a peak of over 50% at the glacier-dominated Tarim Basin of South Xinjiang [13,51]. About 25–48% [18,19] or 18–28% [52] of annual runoff at catchments fed by snow and glacier meltwater in the Tienshan Mountains was contributed to by meltwater. In the Altay Mountains of northern Xinjiang, most catchments were covered by snow; therefore, snowmelt in the spring accounted for 21% of annual runoff [53]. This proportion decreased to 8.9% in the Heihe catchment of the South Qilian Mountains [54]. In addition, many researchers have qualitatively addressed the importance of snow and glacier meltwater and the effects of climate change on runoff [26,55]. However, previous researchers usually focused on the temporal variation of runoff at the catchment-scale for long period, but they neglected the spatial variation of runoff at the regional scale. Our studies found that snow and glacier meltwater individually contributed 19% of the spatial variation of runoff in Xinjiang. This implied that catchments with more meltwater generate more runoff in the headwater catchment of arid regions.
5. Conclusions
This research evaluated the effects of snow and glacier meltwater on runoff in Xinjiang. Firstly, we estimated meltwater using MODIS snow-cover data and a temperature-index approach, and then improved the Budyko curve by adding meltwater to the water availability factor. The fitting parameter of the improved Budyko curve (ω = 1.86) was higher than that of the original Budyko curve (ω = 1.32). The results showed that meltwater was an indispensable water supplement of evaporation in the improved Budyko curve, which could better explain the water balance in snow- and glacier-dominated basins. According to the CART and RDA methods, meltwater, PET, and rainfall combined explained 66% of the spatial variations in runoff, with individual effects of 19%, 13%, and 1%. It appeared that catchments with greater volumes of meltwater generated more runoff. Over a long period (1970–2010), the S/P and SCF both experienced downward trends with temperature rises. This implies that, if global warming continues unabated, more snowmelt water will lead to greater runoff in the higher-elevation catchments of Xinjiang.
Author Contributions
Conceptualization, J.B. and J.L.; Methodology, J.B.; Software, R.Z.; Validation, R.Z.; Formal Analysis, H.S.; Writing-Original Draft Preparation, J.B.; Writing-Review & Editing, H.S. and T.L.
Funding
This research was funded by National Key Research and Development Plan of China (2017YFB0504204), The Task 2 of the Key Service Project 5 for the Characteristic Institute of CAS [TSS-2015-014-FW-5-2], Tianshan Innovation Team Project of Science & Technology Department of Xinjiang Uygur Autonomous Region, China (Y744261), Key Laboratory Project of Xinjiang Uygur Autonomous Region, China [2016D03004], Special-Funds of Scientific Research Programs of State Key Laboratory of Soil Erosion and Dryland Farming on the Loess Plateau [A314021403-C4].
Conflicts of Interest
The authors declare no conflict of interest.
References
- Fischer, A. Glaciers and climate change: Interpretation of 50 years of direct mass balance of hintereisferner. Glob. Planet. Chang. 2010, 71, 13–26. [Google Scholar] [CrossRef]
- Intergovernmental Panel on Climate Change (IPCC). Climate Change 2013: The Physical Science Basis; IPCC: Cambridge, UK, 2013; pp. 866–871. [Google Scholar]
- Gardner, A.S.; Moholdt, G.; Cogley, J.G.; Wouters, B.; Arendt, A.A.; Wahr, J.; Berthier, E.; Hock, R.; Pfeffer, W.T.; Kaser, G. A reconciled estimate of glacier contributions to sea level rise: 2003 to 2009. Science 2013, 340, 852–857. [Google Scholar] [CrossRef] [PubMed] [Green Version]
- Immerzeel, W.W.; Pellicciotti, F.; Bierkens, M.F.P. Rising river flows throughout the twenty-first century in two himalayan glacierized watersheds. Nat. Geosci. 2013, 6, 742–745. [Google Scholar] [CrossRef]
- Unger-Shayesteh, K.; Vorogushyn, S.; Farinotti, D.; Gafurov, A.; Duethmann, D.; Mandychev, A.; Merz, B. What do we know about past changes in the water cycle of central Asian headwaters? A review. Glob. Planet. Chang. 2013, 110, 4–25. [Google Scholar] [CrossRef]
- Liu, S.Y.; Yao, X.J.; Guo, W.Q.; Xu, J.L.; Shangguan, D.H.; Wei, J.F.; Bao, W.J.; Wu, L.Z. The contemporary glaciers in China based on the second Chinese glacier inventory. Acta Geogr. Sin. 2015, 7, 3–16. [Google Scholar]
- Ling, H.; Xu, H.; Fu, J. High- and low-flow variations in annual runoff and their response to climate change in the headstreams of the Tarim river, Xinjiang, China. Hydrol. Process. 2013, 27, 975–988. [Google Scholar] [CrossRef]
- Li, Z.; Chen, Y.; Shen, Y.; Liu, Y.; Zhang, S. Analysis of changing pan evaporation in the arid region of northwest China. Water Resour. Res. 2013, 49, 2205–2212. [Google Scholar] [CrossRef]
- Narama, C.; Kaab, A.; Duishonakunov, M.; Abdrakhmatov, K. Spatial variability of recent glacier area changes in the tien shan mountains, central Asia, using corona (similar to 1970), landsat (similar to 2000), and alos (similar to 2007) satellite data. Glob. Planet. Chang. 2010, 71, 42–54. [Google Scholar] [CrossRef]
- Du, W.B.; Li, J.L.; Bao, A.M.; Wang, B.S. Mapping changes in the glaciers of the eastern Tienshan mountains during 1977–2013 using multitemporal remote sensing. J. Appl. Remote Sens. 2014, 8, 084683. [Google Scholar] [CrossRef]
- Chen, Y.; Li, W.; Deng, H.; Fang, G.; Li, Z. Changes in central Asia’s water tower: Past, present and future. Sci. Rep. 2016, 6, 35458. [Google Scholar] [CrossRef] [PubMed]
- Fujita, K. Influence of precipitation seasonality on glacier mass balance and its sensitivity to climate change. Ann. Glaciol. 2008, 48, 88–92. [Google Scholar] [CrossRef]
- Chen, Y.N.; Li, Z.; Fan, Y.T.; Wang, H.J.; Deng, H.J. Progress and prospects of climate change impacts on hydrology in the arid region of northwest China. Environ. Res. 2015, 139, 11–19. [Google Scholar] [CrossRef] [PubMed]
- Li, Z.; Wang, W.; Zhang, M.; Wang, F.; Li, H. Observed changes in streamflow at the headwaters of the Urumqi river, eastern Tianshan, central Asia. Hydrol. Process. 2010, 24, 217–224. [Google Scholar] [CrossRef]
- Zhang, G.; Li, Z.; Wang, W.; Wang, W. Rapid decrease of observed mass balance in the Urumqi glacier no. 1, Tianshan mountains, central Asia. Quat. Int. 2014, 349, 135–141. [Google Scholar] [CrossRef]
- Kure, S.; Jang, S.; Ohara, N.; Kavvas, M.L.; Chen, Z.Q. Hydrologic impact of regional climate change for the snow-fed and glacier-fed river basins in the Republic of Tajikistan: Statistical downscaling of global climate model projections. Hydrol. Process. 2013, 27, 4071–4090. [Google Scholar] [CrossRef]
- Shi, Y.F.; Shen, Y.P.; Kang, E.; Li, D.L.; Ding, Y.J.; Zhang, G.W.; Hu, R.J. Recent and future climate change in northwest China. Clim. Chang. 2007, 80, 379–393. [Google Scholar] [CrossRef]
- Luo, Y.; Arnold, J.; Liu, S.Y.; Wang, X.Y.; Chen, X. Inclusion of glacier processes for distributed hydrological modeling at basin scale with application to a watershed in Tianshan mountains, northwest China. J. Hydrol. 2013, 477, 72–85. [Google Scholar] [CrossRef]
- Sun, M.P.; Li, Z.Q.; Yao, X.J.; Jin, S. Rapid shrinkage and hydrological response of a typical continental glacier in the arid region of northwest China—Taking Urumqi glacier no.1 as an example. Ecohydrology 2013, 6, 909–916. [Google Scholar] [CrossRef]
- Sorg, A.; Bolch, T.; Stoffel, M.; Solomina, O.; Beniston, M. Climate change impacts on glaciers and runoff in Tien Shan (central Asia). Nat. Clim. Chang. 2012, 2, 725–731. [Google Scholar] [CrossRef]
- Aizen, V.; Aizen, E. Hydrological cycles on the north and south peripheries of mountain-glacial basins of central Asia. Hydrol. Process. 1997, 11, 451–469. [Google Scholar] [CrossRef]
- Hock, R.; Holmgren, B. A distributed surface energy-balance model for complex topography and its application to Storglaciaren, Sweden. J. Glaciol. 2005, 51, 25–36. [Google Scholar] [CrossRef]
- Hock, R. Temperature index melt modelling in mountain areas. J. Hydrol. 2003, 282, 104–115. [Google Scholar] [CrossRef] [Green Version]
- Immerzeel, W.W.; van Beek, L.P.; Bierkens, M.F. Climate change will affect the Asian water towers. Science 2010, 328, 1382–1385. [Google Scholar] [CrossRef] [PubMed]
- Khadka, D.; Babel, M.S.; Shrestha, S.; Tripathi, N.K. Climate change impact on glacier and snow melt and runoff in tamakoshi basin in the Hindu Kush Himalayan (HKH) region. J. Hydrol. 2014, 511, 49–60. [Google Scholar] [CrossRef]
- Ragettli, S.; Pellicciotti, F.; Bordoy, R.; Immerzeel, W.W. Sources of uncertainty in modeling the glaciohydrological response of a Karakoram watershed to climate change. Water Resour. Res. 2013, 49, 6048–6066. [Google Scholar] [CrossRef] [Green Version]
- Verbunt, M.; Gurtz, J.; Jasper, K.; Lang, H.; Warmerdam, P.; Zappa, M. The hydrological role of snow and glaciers in alpine river basins and their distributed modeling. J. Hydrol. 2003, 282, 36–55. [Google Scholar] [CrossRef]
- Koboltschnig, G.R.; Schöner, W.; Zappa, M.; Kroisleitner, C.; Holzmann, H. Runoff modelling of the glacierized Alpine Upper Salzach Basin (Austria): Multi-criteria result validation. Hydrol. Process. 2008, 22, 3950–3964. [Google Scholar] [CrossRef]
- Budyko, M.I. Climate and Life; Academic Press: Cambridge, MA, USA, 1974; Volume 18, pp. 1–508. [Google Scholar]
- Zhang, L.; Potter, N.; Hickel, K.; Zhang, Y.Q.; Shao, Q.X. Water balance modeling over variable time scales based on the budyko framework—Model development and testing. J. Hydrol. 2008, 360, 117–131. [Google Scholar] [CrossRef]
- Du, C.; Sun, F.; Yu, J.; Liu, X.; Chen, Y. New interpretation of the role of water balance in an extended budyko hypothesis in arid regions. Hydrol. Earth Syst. Sci. 2016, 20, 393–409. [Google Scholar] [CrossRef]
- Zhang, D.; Cong, Z.; Ni, G.; Yang, D.; Hu, S. Effects of snow ratio on annual runoff within the budyko framework. Hydrol. Earth Syst. Sci. 2015, 19, 1977–1992. [Google Scholar] [CrossRef]
- Han, S.; Hu, H.; Yang, D.; Liu, Q. Irrigation impact on annual water balance of the oases in Tarim basin, northwest China. Hydrol. Process. 2011, 25, 167–174. [Google Scholar] [CrossRef]
- Chen, X.; Alimohammadi, N.; Wang, D. Modeling interannual variability of seasonal evaporation and storage change based on the extended budyko framework. Water Resour. Res. 2013, 49, 6067–6078. [Google Scholar] [CrossRef]
- Wang, T.; Istanbulluoglu, E.; Lenters, J.; Scott, D. On the role of groundwater and soil texture in the regional water balance: An investigation of the Nebraska sand hills, USA. Water Resour. Res. 2009, 45, W10413. [Google Scholar] [CrossRef]
- Rodríguez, E.; Morris, C.S.; Belz, J.E. A global assessment of the srtm performance. Photogramm. Eng. Remote Sens. 2015, 72, 249–260. [Google Scholar]
- Liston, G.E.; Elder, K. A meteorological distribution system for high-resolution terrestrial modeling (micromet). J. Hydrometeorol. 2006, 7, 217–234. [Google Scholar] [CrossRef]
- Allen, R.G.; Pereira, L.S.; Raes, D.; Smith, M. Crop Evapotranspiration: Guidelines for Computing Crop Water Requirements; FAO: Rome, Italy, 1998. [Google Scholar]
- Berghuijs, W.R.; Woods, R.A.; Hrachowitz, M. A precipitation shift from snow towards rain leads to a decrease in streamflow. Nat. Clim. Chang. 2014, 4, 583–586. [Google Scholar] [CrossRef] [Green Version]
- Immerzeel, W.W.; Rutten, M.M.; Droogers, P. Spatial downscaling of TRMM precipitation using vegetative response on the Iberian Peninsula. Remote Sens. Environ. 2009, 113, 362–370. [Google Scholar] [CrossRef]
- Hall, D.K.; Riggs, G.A.; Salomonson, V.V.; Digirolamo, N.E.; Bayr, K.J. Modis snow-cover products. Remote Sens. Environ. 2002, 83, 181–194. [Google Scholar] [CrossRef]
- Robinson, D.A.; Dewey, K.F.; Heim, R.R., Jr. Global snow cover monitoring: An update. Bull. Am. Meteorol. Soc. 1993, 74, 1689–1696. [Google Scholar] [CrossRef]
- Fu, B.P. On the calculation of the evaporation from land surface. Chin. J. Atmos. Sci. 1981, 5, 23–31. [Google Scholar]
- Wang, R.; Yao, Z.; Liu, Z.; Wu, S.; Jiang, L.; Wang, L. Snow cover variability and snowmelt in a high-altitude ungauged catchment. Hydrol. Process. 2015, 29, 3665–3676. [Google Scholar] [CrossRef] [Green Version]
- Zhang, Y.; Liu, S.; Ding, Y. Observed degree-day factors and their spatial variation on glaciers in western China. Ann. Glaciol. 2006, 43, 301–306. [Google Scholar] [CrossRef]
- Qiu, L.; Kai, W.; Long, W.; Ke, W.; Wei, H.; Amable, G.S. A comparative assessment of the influences of human impacts on soil cd concentrations based on stepwise linear regression, classification and regression tree, and random forest models. PLoS ONE 2016, 11, e0151131. [Google Scholar] [CrossRef] [PubMed]
- Chen, Z.; Yu, G.; Ge, J.; Wang, Q.; Zhu, X.; Xu, Z. Roles of climate, vegetation and soil in regulating the spatial variations in ecosystem carbon dioxide fluxes in the northern hemisphere. PLoS ONE 2015, 10, e0125265. [Google Scholar] [CrossRef] [PubMed]
- Yang, D.; Sun, F.; Liu, Z.; Cong, Z.; Ni, G.; Lei, Z. Analyzing spatial and temporal variability of annual water-energy balance in nonhumid regions of China using the budyko hypothesis. Water Resour. Res. 2007, 43, W04426. [Google Scholar] [CrossRef]
- Milly, P.C.D.; Eagleson, P.S. Effects of spatial variability on annual average water balance. Water Resour. Res. 1987, 23, 2135–2143. [Google Scholar] [CrossRef]
- Donohue, R.J.; Roderick, M.L.; Mcvicar, T.R. On the importance of including vegetation dynamics in budyko’s hydrological model. Hydrol. Earth Syst. Sci. Discuss. 2006, 3, 983–995. [Google Scholar] [CrossRef]
- Duethmann, D.; Bolch, T.; Farinotti, D.; Kriegel, D.; Vorogushyn, S.; Merz, B.; Pieczonka, T.; Jiang, T.; Su, B.D.; Guntner, A. Attribution of streamflow trends in snow and glacier melt-dominated catchments of the tarim river, central Asia. Water Resour. Res. 2015, 51, 4727–4750. [Google Scholar] [CrossRef]
- Aizen, V.B.; Aizen, E.M.; Melack, J.M. Precipitation, melt and runoff in the northern Tien Shan. J. Hydrol. 1996, 186, 229–251. [Google Scholar] [CrossRef]
- Wu, X.J.; Shen, Y.P.; Wang, N.L.; Pan, X.D.; Zhang, W.; He, J.Q.; Wang, G.Y. Coupling the WRF model with a temperature index model based on remote sensing for snowmelt simulations in a river basin in the Altay mountains, north-west China. Hydrol. Process. 2016, 30, 3967–3977. [Google Scholar] [CrossRef]
- Wu, F.; Zhan, J.; Wang, Z.; Zhang, Q. Streamflow variation due to glacier melting and climate change in upstream Heihe river basin, northwest China. Phys. Chem. Earth 2015, 79–82, 11–19. [Google Scholar] [CrossRef]
- Barnett, T.P.; Adam, J.C.; Lettenmaier, D.P. Potential impacts of a warming climate on water availability in snow-dominated regions. Nature 2005, 438, 303–309. [Google Scholar] [CrossRef] [PubMed]
Figure 1.
Spatial distribution of 64 catchments (red outlined) in Xinjiang. Black triangles denote a selected subset of 33 catchments with long-term hydrologic data during 1970–2010.
Figure 1.
Spatial distribution of 64 catchments (red outlined) in Xinjiang. Black triangles denote a selected subset of 33 catchments with long-term hydrologic data during 1970–2010.

Figure 2.
Impacts of snowmelt on Budyko curves (a) in 64 catchments of Xinjiang during 2000–2010 (results of the improved Budyko curves with the consideration of snowmelt water, blue dots; results of the original Budyko curves, red triangle), and the scatterplot of observed (Q) vs. simulated Q with meltwater including (blue circle) and meltwater excluded (red triangle) (b). Abbreviations: PET = potential evaporation; P = precipitation; Rain = rainfall; Qs = snow/glacier meltwater; Q = runoff; SMW = with snow/glacier meltwater; No_SMW = without snow/glacier meltwater.

Figure 3.
Contributions of critical factors to the spatial variations in Q. Contributions of Qs, PET and Rain to the spatial variations in Q.
Figure 3.
Contributions of critical factors to the spatial variations in Q. Contributions of Qs, PET and Rain to the spatial variations in Q.

Figure 4.
The spatial–temporal distribution of air temperature (10−1 × °C/yr, (a)), precipitation (mm/yr, (b)), rainfall (mm/yr, (c)), snowfall (mm/yr, (d)), snow cover fraction (SCF) (%/yr, (e)), and runoff (mm/yr, (f)) at 33 catchments during 1970–2010. The star symbol (*) indicate trends are significant at the 95% confidence level (p < 0.05).

Figure 5.
The distribution of slope coefficient (Slop) between temperature and SCF (a), runoff and SCF (b), temperature and precipitation (c), temperature and ratio of snowfall to precipitation (S/P) (d), rainfall and runoff (e), snowfall and runoff (f).
Figure 5.
The distribution of slope coefficient (Slop) between temperature and SCF (a), runoff and SCF (b), temperature and precipitation (c), temperature and ratio of snowfall to precipitation (S/P) (d), rainfall and runoff (e), snowfall and runoff (f).


Table 1.
Information of 33 gauging stations in the study area.
| Name of Catchment | Name of River | Catchment Area (km2) | Elevation (m asl) | Region |
|---|---|---|---|---|
| QKL | Buerjin River | 8549 | 2175 | Altay Mountains |
| ALT | Kelan River | 1636 | 2201 | |
| ET | Ulungur River | 1739 | 1246 | |
| TH | Ili River | 9547 | 2153 | Tienshan Mountains |
| HSG | Huangshuigou | 4450 | 2942 | |
| DSK | Kaidu River | 18,659 | 2996 | |
| BYBLK | Kaidu River | 6652 | 3034 | |
| KEGD | Qingshui River | 3573 | 1688 | |
| KKH | Kaiken River | 2667 | 1411 | |
| MYG | Meiyaogou | 2053 | 780 | |
| ALG | Alagou River | 6490 | 2048 | |
| WQ | Bortala River | 3313 | 2509 | |
| JHSK | Jinghe | 2487 | 2121 | |
| JLD | Sikeshu River | 943 | 3030 | |
| JJM | Kuitun River | 2139 | 1919 | |
| LMM | Bayingou | 1082 | 3307 | |
| YXQ | Urumqi River | 1088 | 2994 | |
| BJH | JingouRiver | 2309 | 2556 | |
| KSWT | Manasi River | 2196 | 2031 | |
| SM | Hutubi River | 3822 | 1841 | |
| TDG | Toudaogou | 3020 | 1444 | |
| SLGLK | Taushgan River | 19,501 | 3564 | |
| TL | Tailan River | 2166 | 3138 | |
| SAM | Kushan River | 2472 | 3843 | Kunlun Mountains |
| KLBL | Kezi River | 14,274 | 3607 | |
| KLK | Gaizi River | 2127 | 4264 | |
| KLY | Keliya River | 7244 | 4325 | |
| WLWT | Yarkant River | 22,371 | 4609 | |
| CL | Cele River | 2469 | 2822 | |
| TGZLK | Yurungkash River | 14,879 | 4715 | |
| KQ | Yarkant River | 46,473 | 4424 | |
| YZMLK | Yarkant River | 4689 | 3171 | |
| QM | Kaqiang River | 27,253 | 4393 |
Table 2.
Metrics comparing observed and modeled long-term annual average runoff for all 64 catchments. Runoff was predicted using the original Budyko equation (top row) and improved Budyko equation with snowmelt water (bottom row).
Table 2.
Metrics comparing observed and modeled long-term annual average runoff for all 64 catchments. Runoff was predicted using the original Budyko equation (top row) and improved Budyko equation with snowmelt water (bottom row).
| Model | Slope | R | RMSE | % Error (RMSE/Q × 100%) |
|---|---|---|---|---|
| Original BH | 0.43 | 0.43 | 112.19 | 52.84 |
| Modified BH | 0.85 | 0.73 | 80.83 | 38.07 |
Notes: Slope is the line of best-fit; R is the correlation coefficient; RMSE is the root-mean-square error (mm yr−1); % error is the percentage that the RMSE is of average observed Q (RMSE/Q × 100%).
Table 3.
Comparison of snowmelt contribution among similar regions in Asia.
| Periods | Basins | Regions | Method | Meltwater Contribution (%) | Source |
|---|---|---|---|---|---|
| 2008–2010 | 64 basins | Xinjiang, China | Statistical Analysis | 19 | This study |
| 2010 | Kayiertesi River | Altay Mountains, China | Temperature-index | 21 | [53] |
| 1958–2012 | Aksu, Yarkand and Hotan River | Tarim Basin, China | Water balance | 54–60 | [13] |
| 1957–2004 | Kakshaal Basin | Tarim Basin, China | Hydrological model | 9–24 | [51] |
| Sari-Djaz Basin | 35–48 | ||||
| 1961–1999 | Manas River | North Tienshan Mountains, China | Hydrological model | 25 | [18] |
| 1959–2008 | Urumqi River | North Tienshan Mountains, China | Water balance | 48.4 | [19] |
| 2010 | Heihe River | South Qilian Mountains, China | Hydrological model | 8.9 | [54] |
| 1958–1982 | Kirgizskiy Alatoo, Zailiyskiy Alatau Basin | West Tienshan Mountains, China | Temperature-index model | 18–28 | [52] |
| 2000–2009 | Tamakoshi Basin | Hindu Kush Himalayan, Nepal | Temperature-index model | 18 | [25] |
© 2018 by the authors. Licensee MDPI, Basel, Switzerland. This article is an open access article distributed under the terms and conditions of the Creative Commons Attribution (CC BY) license (http://creativecommons.org/licenses/by/4.0/).
Share and Cite
MDPI and ACS Style
Bai, J.; Li, J.; Shi, H.; Liu, T.; Zhong, R. Snowmelt Water Alters the Regime of Runoff in the Arid Region of Northwest China. Water 2018, 10, 902. https://doi.org/10.3390/w10070902
AMA Style
Bai J, Li J, Shi H, Liu T, Zhong R. Snowmelt Water Alters the Regime of Runoff in the Arid Region of Northwest China. Water. 2018; 10(7):902. https://doi.org/10.3390/w10070902
Chicago/Turabian StyleBai, Jie, Junli Li, Hao Shi, Tie Liu, and Ruisen Zhong. 2018. "Snowmelt Water Alters the Regime of Runoff in the Arid Region of Northwest China" Water 10, no. 7: 902. https://doi.org/10.3390/w10070902
Note that from the first issue of 2016, this journal uses article numbers instead of page numbers. See further details here.