A New Assessment of Hydrological Change in the Source Region of the Yellow River


1
School of Water Resources and Environment, China University of Geosciences (Beijing), Beijing 100083, China
2
Department of Earth and Planetary Sciences, McGill University, Montreal, QC H3A 0E8, Canada
*
Author to whom correspondence should be addressed.
Water 2018, 10(7), 877; https://doi.org/10.3390/w10070877
Submission received: 11 June 2018
/
Revised: 25 June 2018
/
Accepted: 28 June 2018
/
Published: 30 June 2018
(This article belongs to the Section Hydrology)
Abstract
:Hydrological responses to climate change are a widely concerning question, particularly for the source region of the Yellow River (SRYR), which is sensitive to climate change and is widely underlain by frozen ground. In considering climate change impacts on catchment properties, the traditional separation approach based on the Budyko framework was modified to identify and quantify the climatic causes of discharge changes. On the basis of the decomposition method, the traditional separation method and the modified separation method were used to analyse the discharge change in the SRYR. Using the observed annual maximum frozen depth (MFD) to indicate the frozen ground level, the impacts of frozen-ground degradation on the discharge change were further considered using the modified separation method. Our results show that the traditional separation approach underestimated climate-induced discharge change; over the past half-century, the discharge change in the SRYR has been primarily controlled by climate change. Increasing air temperature is generally a negative force on discharge generation; however, it also causes frozen ground to degrade—a positive factor for discharge generation. Such conflicting effects enhance the uncertainty in assessments of hydrological responses to climate change in the sub-basins with widely distributed permafrost.
1. Introduction
Over the past five decades, the climate has changed dramatically at the global scale [1], resulting in long-term impacts on global rivers [2,3,4,5]. The response of hydrological basins in the Tibetan Plateau as a result of climate change is a major concern for the management of water resources, particularly in China. The water balance of headwater basins in the Tibetan Plateau is influenced by climate change at different levels [6,7,8]. Originating from the Tibetan Plateau, the Yellow River is the second longest river in China. Over the past five decades, the temperature has increased rapidly in the region, accompanied by significant changes in the river’s streamflow that were primarily exhibited as a sharp decrease for many sub-basins during the 1990s [9,10].
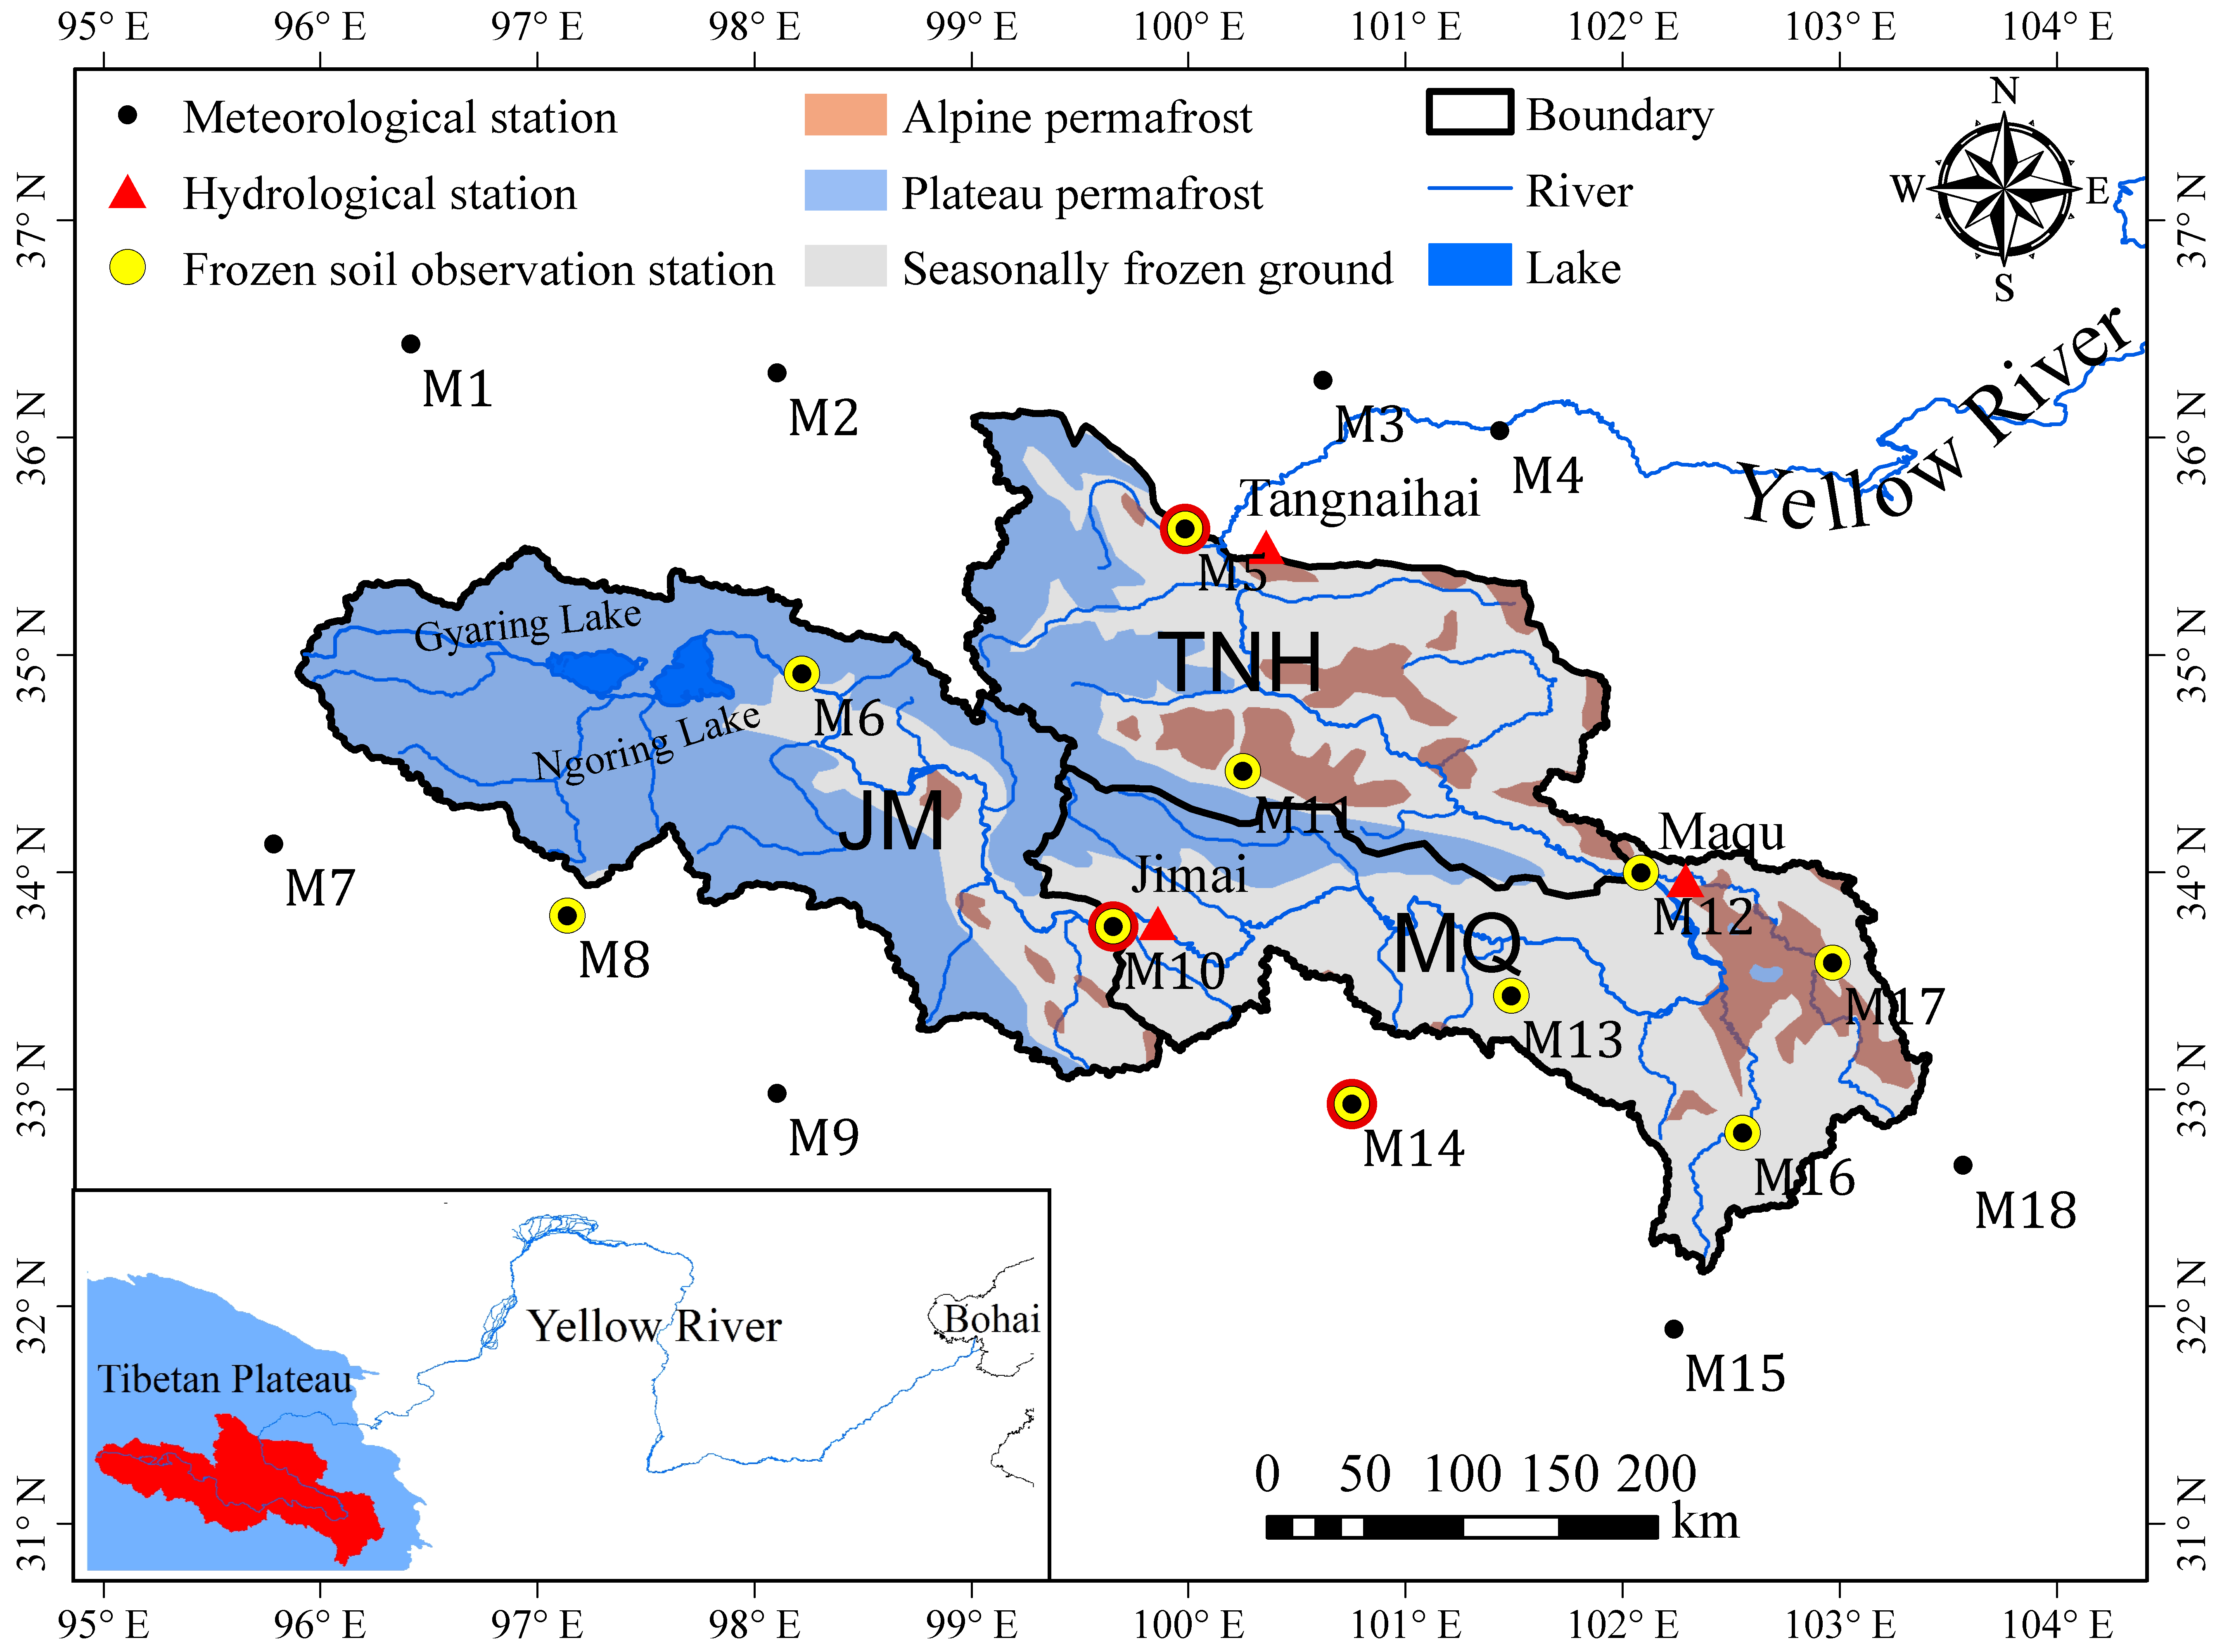
The source region of the Yellow River (SRYR) is situated in the eastern Tibetan plateau in a large basin above the Tangnaihai hydrological station (Figure 1), which contributes about 35% of the total annual runoff but has an area that is only 16% (121,972 km2) of the total Yellow River Basin [11]. In the 1990s, streamflow from the SRYR significantly decreased with increasing cases of flow cutoff [10,12,13]. The causes of the decreased flow within the SRYR and other sub-basins of the Yellow River have been extensively investigated in the literature. However, there are disagreements as to the causes of the observed decreases in streamflow. Much research based on data analysis and process-based hydrological modelling has suggested that climate change was the primary cause of the decrease in streamflow [10,12,14,15,16,17,18,19]. For instance, using the non-parametric Mann–Kendall test and moving t-test, Zheng [12] analysed the streamflow change in the SRYR and concluded that the decrease in streamflow was mainly caused by wet-season rainfall decrease. By analysing discharge data and meteorological data, Hu [16] found that a decrease in precipitation and an increase in temperature resulted in the streamflow decrease in the SRYR. Using a process-based land-surface hydrological model (VIC), to simulate the streamflow change in the SRYR, Cuo [14] and Meng [19] indicated that climate change (changes in precipitation and evapotranspiration) was the primary cause for the streamflow change. Other research based on the Budyko framework proposed that the decrease in discharge was mainly caused by changes in catchment properties [20,21]. For example, Zheng [20] found that the decrease in streamflow in the 1990s was a result of climate change and land-use changes, where the land-use changes were more important and contributed about 70% of the total change in streamflow. Zhao [21] suggested that 65% of the streamflow change in the upper catchment of the Jimai hydrological station could be attributed to the effects of human activities. This conclusion is potentially at odds with the very low population density in the area above the Tangnaihai hydrological station (about 6 people/km2; 2003 census data) and in the area above the Huangheyan station (0.34 people/km2) [15]. From 1990 to 2000, the change in land use in the SRYR was generally less than 5%, although a few sites exhibited 5–15% change [22]. Therefore, it is not easy to attribute the negligible impact of human activities and land-use changes to more than 50% of the change in the discharge of the SRYR.
A poorly understood factor of the SRYR is the hydrological impacts of changes in the frozen ground (permafrost and seasonally frozen ground). Permafrost is defined as a subsurface region in which the temperature is below 0 °C for two or more consecutive years [23]. Frozen ground in the SRYR has undergone significant degradation since the 1980s [24], which has been manifested as a shrinking permafrost area, a decreasing maximum frozen depth (MFD), and a reducing freezing duration of the seasonally frozen ground [25,26].
In considering frozen-ground degradation, recently Wang [27] used a climate elasticity method combined with a sequential average method to reassess the discharge change in the SRYR and concluded that the 32.6% discharge decrease in the 1990s was caused by frozen-ground degradation while the 12.4% discharge decrease was caused by land-use changes. These results seem inconsistent with existing studies indicating that permafrost degradation could enlarge baseflow [28,29,30,31,32,33] and increase the runoff discharge [34,35]. Nevertheless, Wang [27] showed the potential of considering frozen-ground degradation in the Budyko framework to remedy the overestimation of land-use changes in a previous study on the hydrological changes in the SRYR. Meanwhile, the catchment-specific parameter in the Budyko framework could also be dependent on the climate condition [36,37,38,39]; however, this effect was not accounted for in most of the investigations on the SRYR [20,21,27].
As described above, previous assessments of hydrological response in the SRYR on the basis of the Budyko framework were inconsistent with conclusions obtained by other methods, and climate change impacts on the catchment-specific parameter were sparsely considered in previous studies. Frozen ground is a climate-sensitive landscape that is widely distributed in the SRYR, but its hydrological impacts on the SRYR are still disputed. Accordingly, this study aims to (1) modify the traditional separation method in considering both climate change and frozen-ground degradation impacts on the catchment-specific parameter, (2) reassess the causes of long-term discharge changes in the SRYR, and (3) provide a better understanding of hydrological responses to climate change and frozen-ground degradation in the SRYR. A catchment-specific parameter, on the basis of the Budyko framework, was applied to represent the properties of the drainage basins. Correlation analysis was performed to reveal the relationships between the time-varying catchment parameter and potential drivers of hydrologic change, such as climatic forcing and frozen-ground degradation.
2. Study Area and Data Processing
2.1. Catchments and Sub-Basins
The Yellow River originates from the Tibetan plateau, flows across the north of China, and eventually empties into the Baohai Sea. The SRYR is situated in the northeastern Tibetan plateau, the region between 95°30′ E–103°30′ E and 32° N–36°40′ N, which is a transition zone of seasonally frozen ground and permafrost (Figure 1). Three hydrological stations, Jimai, Maqu, and Tangnaihai, monitor the mainstream of the SRYR from upstream to downstream. The SRYR was divided into three sub-basins in this study according to the three hydrological stations: the Jimai (JM) Basin, the Jimai–Maqu (MQ) Basin, and the Maqu–Tangnaihai (TNH) Basin, from upstream to downstream, respectively. Two major lakes, Gyaring and Ngoring, are located within the JM sub-basin. The JM and TNH sub-basins are relatively dry, with a high elevation and cold climate, whereas the MQ sub-basin, the major runoff generation area of the SRYR, has a relatively humid and warm climate and contributes 51% of the runoff to the SRYR [19].
The distribution of frozen ground in the 1980s was obtained from the Map of Snow, Ice, and Frozen Ground in China (1988), published by the Environmental and Ecological Science Data Center for West China, National Natural Science Foundation of China [40]. The classifications of the frozen ground were further simplified into plateau permafrost, alpine permafrost, and seasonally frozen ground. As shown in Figure 1, permafrost occupies 80% and 46% of the basin areas of JM and TNH, respectively, whereas in the MQ, only 23% of the basin area is occupied by permafrost.
2.2. Data Processing
Daily meteorological data from 1961 to 2013 at 18 meteorological stations inside and close to the SRYR were collected from the China Meteorological Administration (CMA), including precipitation, air temperature, wind speed at 10 m height, relative humidity, and sunshine duration. The FAO Penman–Monteith equation [41] was employed to calculate potential evapotranspiration. The annual precipitation intensity (I) was defined as the ratio of annual precipitation to the annual number of raining days. The annual precipitation (P) (mm), annual precipitation intensity (I) (mm/d), annual mean temperature (T) (°C), and annual potential evapotranspiration (E0) (mm) from 1961 to 2013 were derived for the meteorological stations. Then, the inverse-distance weighted technique (IDW) was applied to gridded data of P, E0, T, and I at a resolution of 0.01° × 0.01°.
Monthly streamflow data from 1961 to 2013 at the Jimai, Maqu and Tangnaihai hydrological stations were obtained from the Yellow River Conservancy Commission (YYCC). Firstly, these monthly streamflow data were translated into annual runoff volume data for each hydrological station. Annual runoff volume data for the JM and TNH stations were directly used to represent annual runoff volume generated in JM and the SRYR, respectively. The MQ–JM difference and TNH–MQ difference in annual runoff volume were used to represent the individual runoffs in MQ and TNH, respectively. Finally, the obtained runoff volume data for each basin were divided by their respective basin area to obtain the annual runoff depth, which was defined as discharge in following analyses.
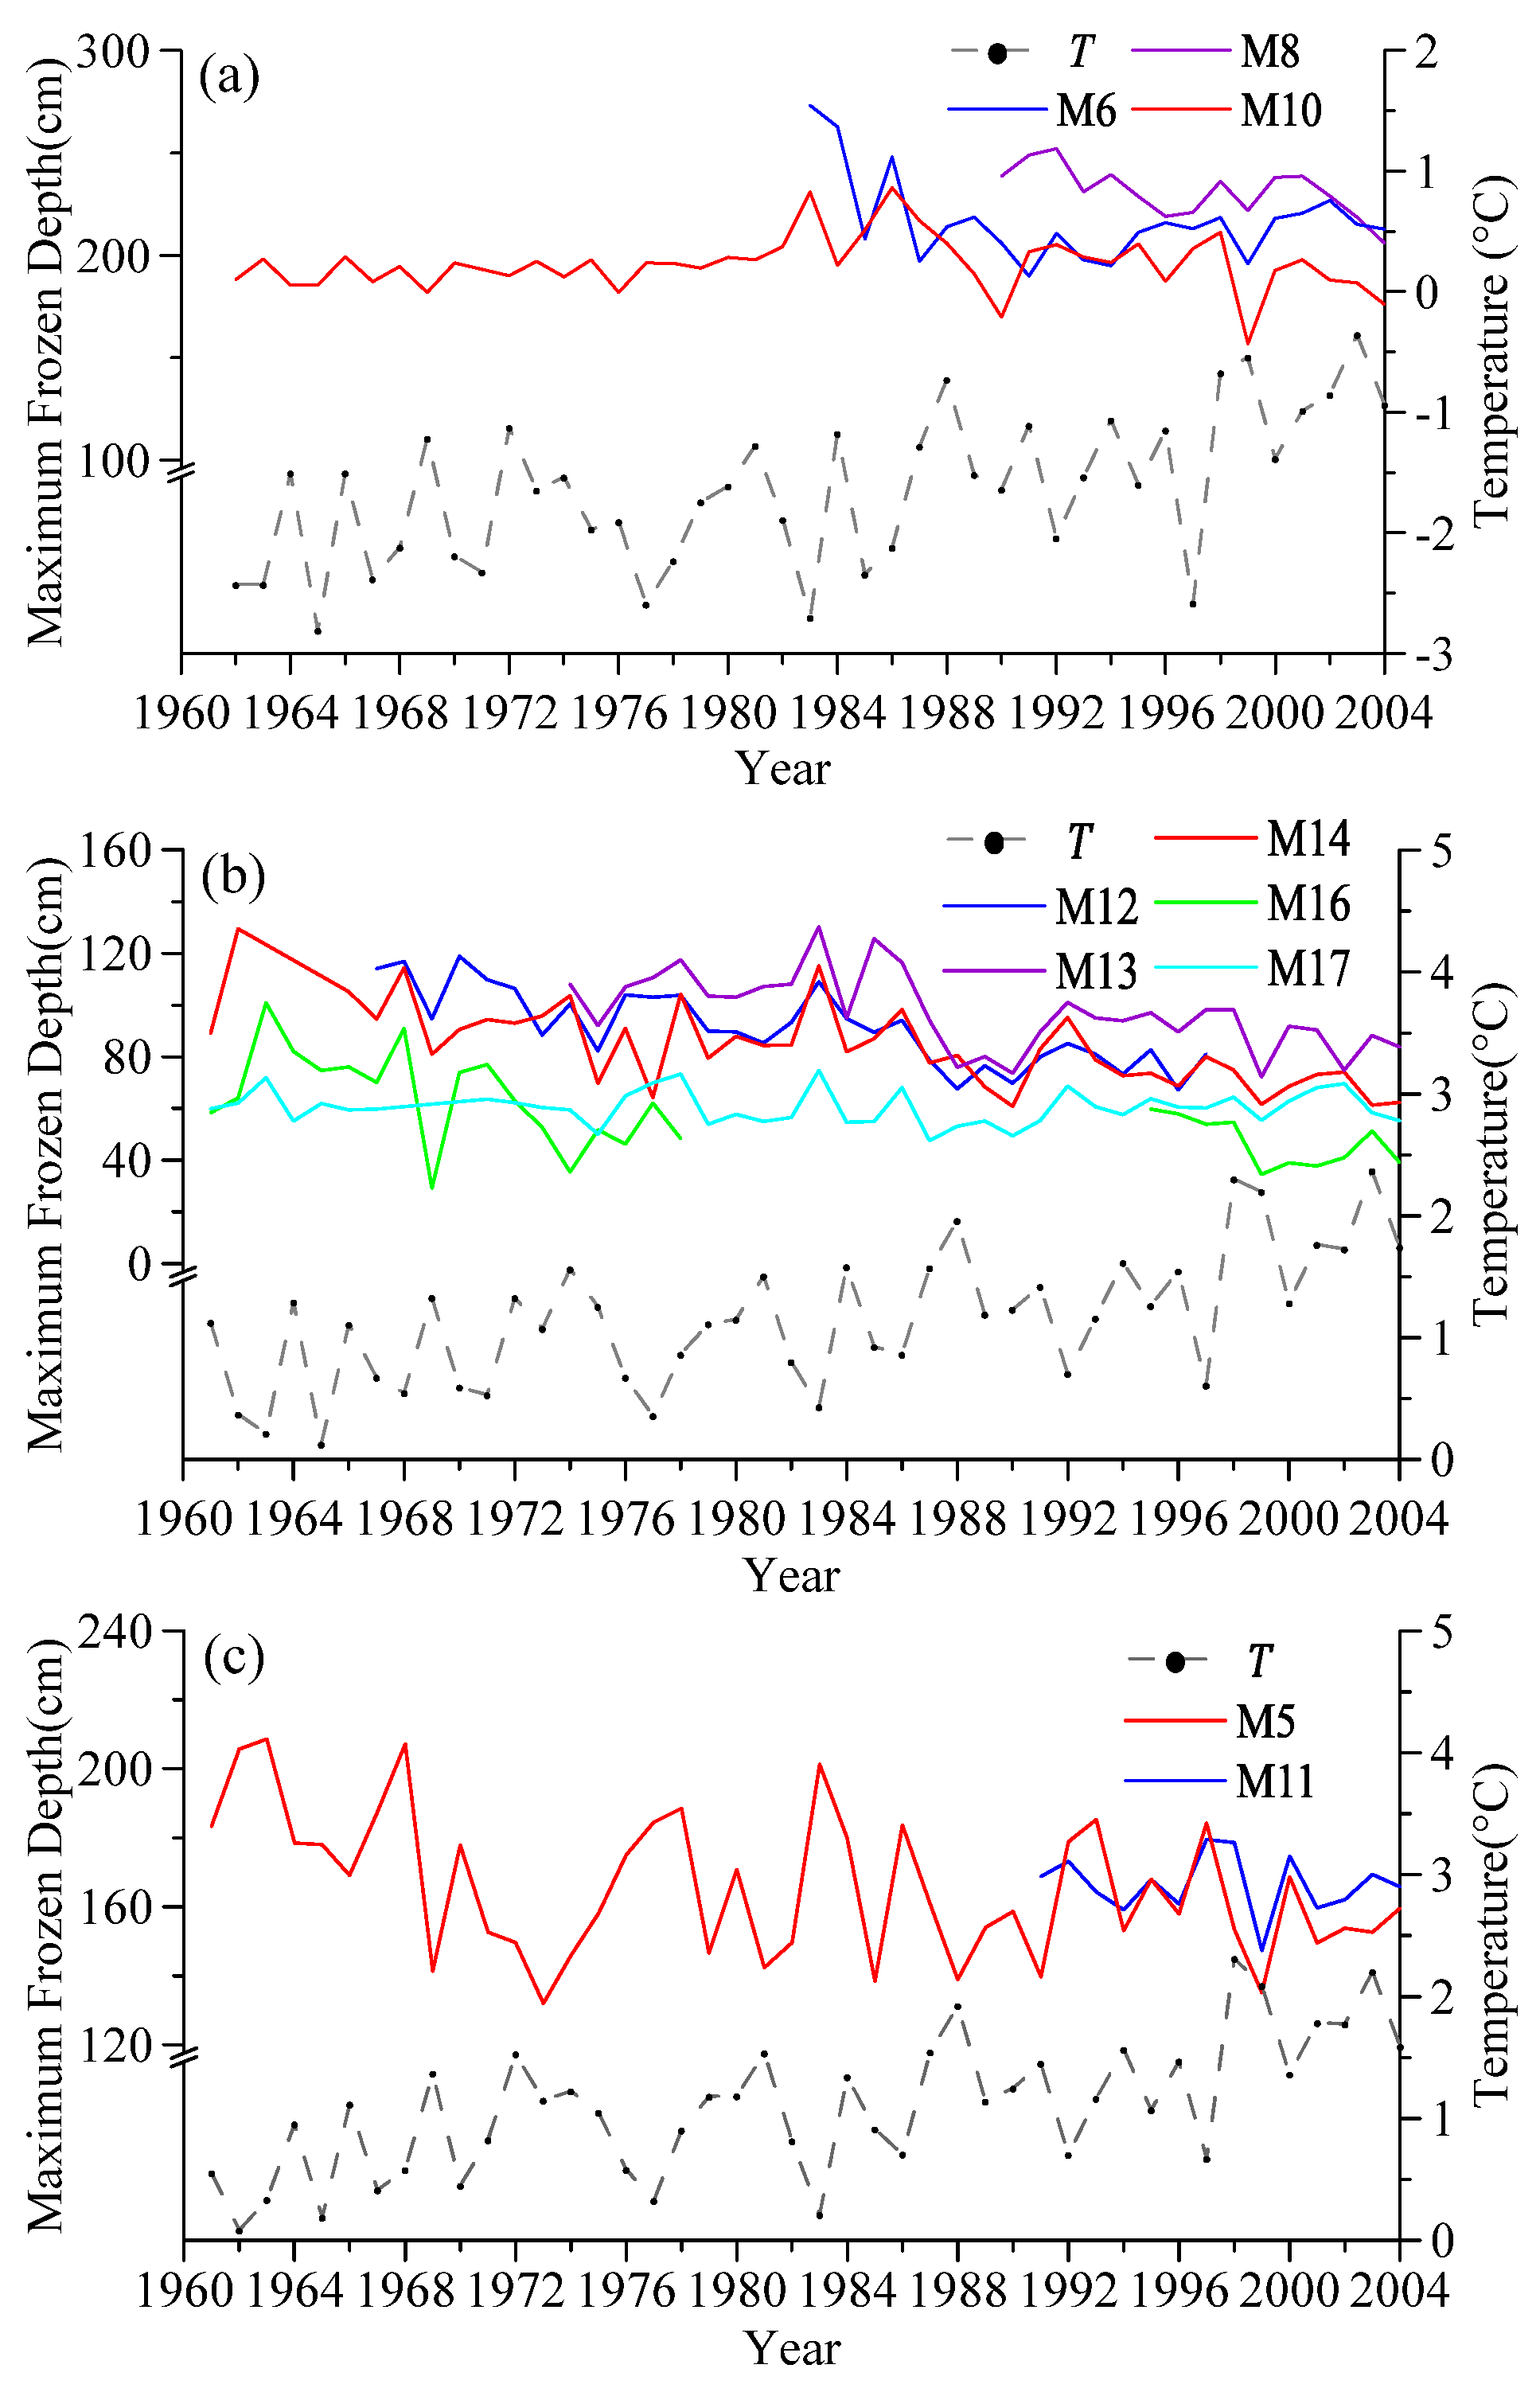
Observed daily frozen depth data for 10 meteorological stations (Figure 1) were collected from the CMA. Firstly, the daily frozen depth was used to calculate the monthly mean frozen depth for each year; then the maximum monthly mean frozen depth value for each year was defined as the annual MFD. Daily frozen depth data were available for 1961 to 2004, but some missing data existed, and the length of data varied for different stations. The variation patterns of the annual MFD and annual mean air temperature (MAT) (T) for the three sub-basins are shown in Figure 2.
As shown in Figure 2, the MFD values for JM and TNH varied from 120 to 300 cm; however, MFD values for MQ were generally lower than 120 cm. As air temperature increased, the MFD exhibited a decreasing trend at most of the observation sites, particularly in the period after 1980. The MFDs at each station in and around the same sub-basin showed a similar trend; thus the station with the longest record was selected to account for the representative MFD data in each sub-basin. Therefore, M5, M10, and M14 were selected for JM, MQ, and TNH, respectively. In the MQ sub-basin, M17 also had the longest record but showed little variation compared to the other sites, because it was located at alpine permafrost. Therefore, M17 was not selected to represent the MFD of MQ. The locations of M5, M10, and M14 are shown in Figure 1. The station M14 was not located in the MQ sub-basin, but it exhibited the same variation trend in MFD as that observed at stations in the MQ basin (M12, M13, and M16) with shorter records.
3. Methods
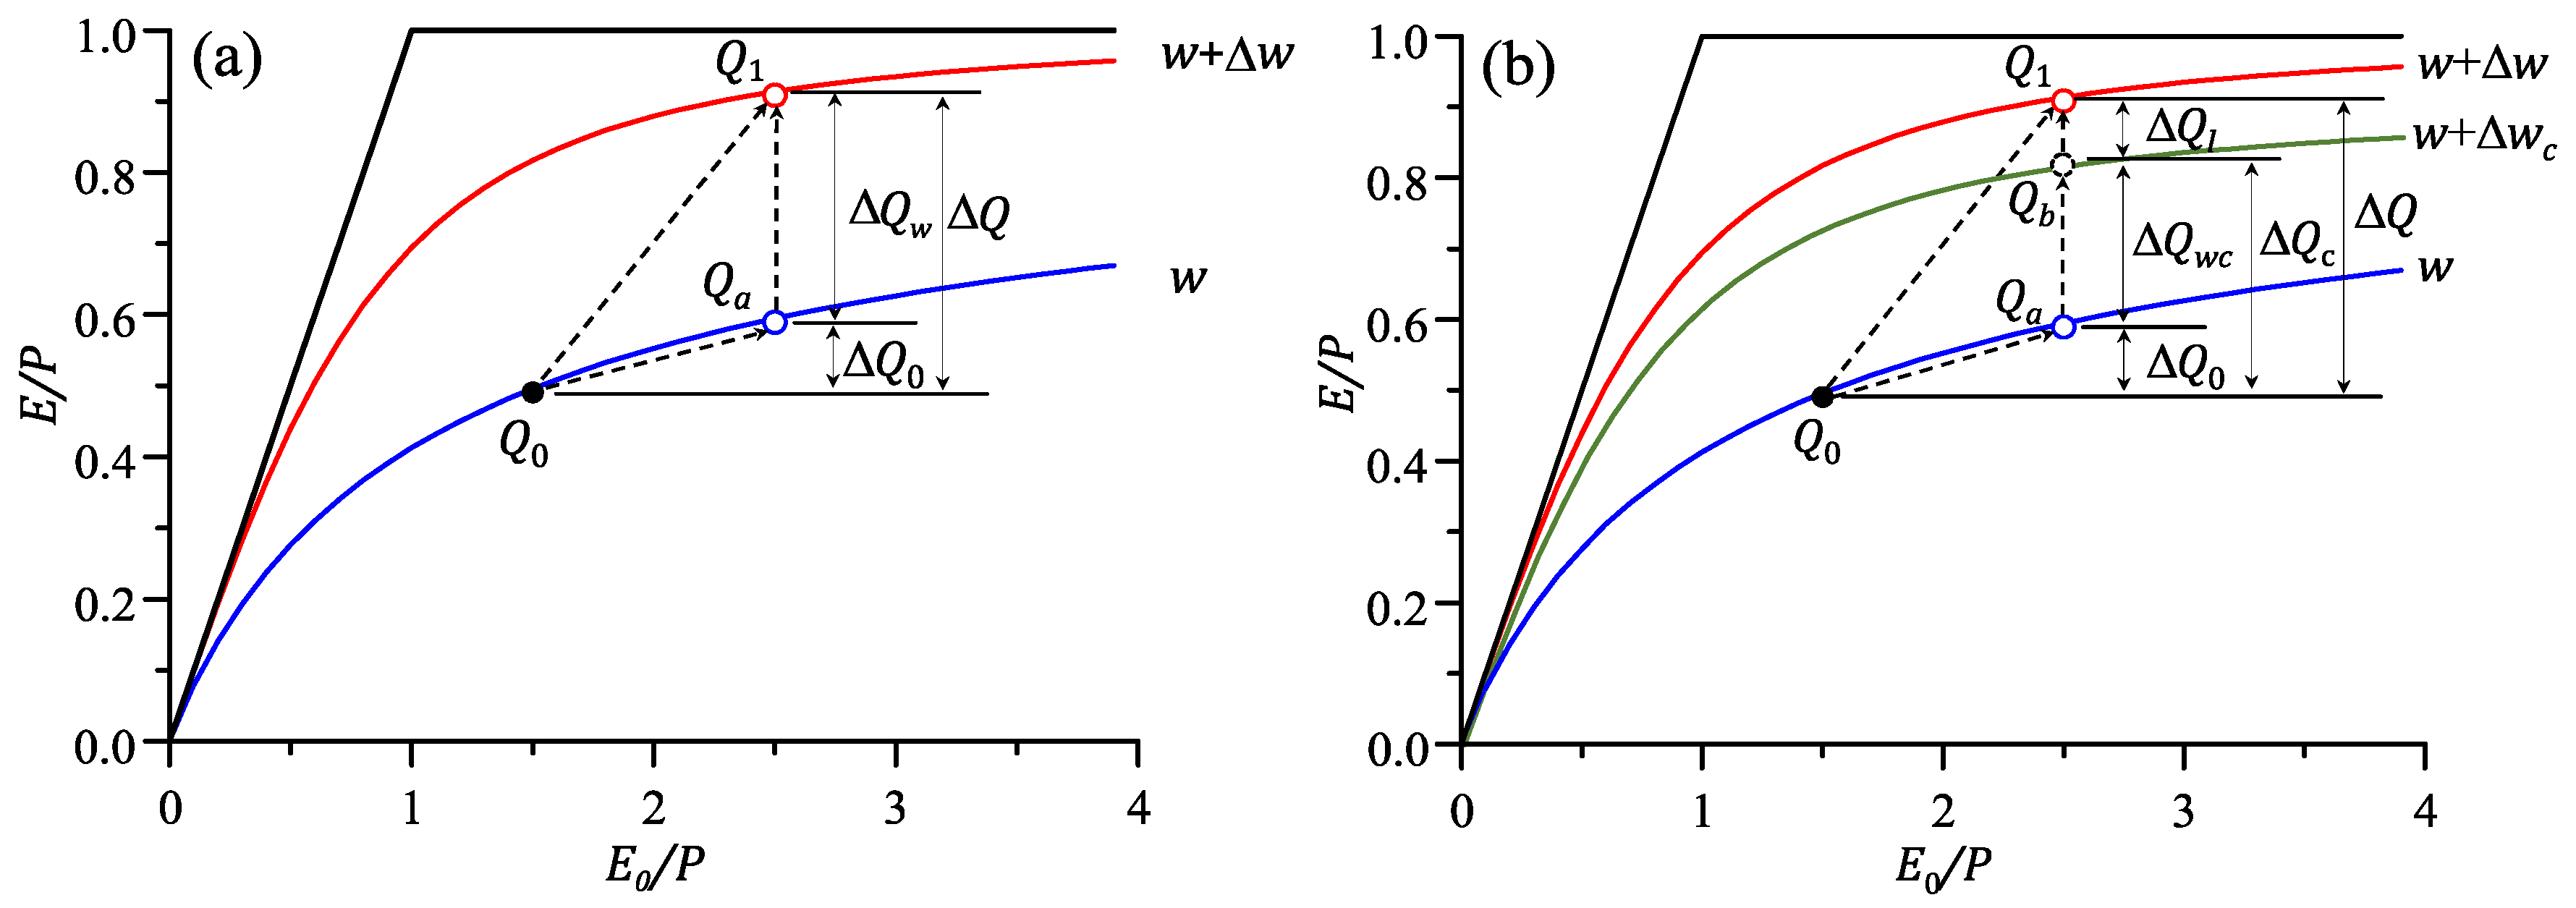
To assess the hydrological response of the SRYR and its three sub-basins to climate change and frozen-ground degradation, a new analysis method was used in this study. First, the Budyko framework was applied to investigate the shift in mean annual water balance in different periods. Second, using a decomposition method, the discharge change was preliminarily partitioned into two components on the basis of the traditional separation approach (Figure 3a): the change along a Budyko curve (ΔQ0) and the change induced by catchment-specific parameter change (ΔQw). Finally, the impacts of climate change and the degrading frozen ground on ΔQw were further identified with the modified separation approach. Accordingly, the total climatic contribution to the discharge change (ΔQc) was identified (Figure 3b).
3.1. Budyko Framework
Evapotranspiration in a catchment can be calculated from the water balance equation as follows:
where the annual evapotranspiration, E; the annual precipitation, P; and the annual discharge, Q, are calculated as the average flux on the basin, and ΔS is the increment in storage during an accounting period. Over a long period (usually more than 10 years), the change in storage (ΔS) is negligible for the mean annual water balance, such that E = P − Q can be applied.
Budyko [42] demonstrated that the mean annual evapotranspiration ratio (E/P) is mainly controlled by the mean aridity index (E0/P, where E0 is the annual potential evapotranspiration). This hypothesis is the underlying principle of the Budyko framework when building a straightforward estimation formula for E/P versus E0/P. Non-parametric and one-parameter formulas have been proposed in the literature; however, the one-parameter formulas are more practical in comparison to the non-parametric formulas, as the catchment-specific parameter can represent the variable catchment properties [43]. Accordingly, the long-term mean evapotranspiration ratio can be calculated as follows:
where w is the catchment-specific parameter and F() denotes a one-parameter formula. The long-term mean discharge can then be calculated as
where f() is the function derived from F(). The parameter w can be inversely determined with observation data of Q, E0, and P for a long period using the mean annual water balance or for year-by-year patterns using a moving average method [39].
3.2. The Traditional Separation Approach
In the traditional separation approach, the discharge change between two periods, indicated as Q0 to Q1 in Figure 3a, is primarily separated into two parts on the basis of the Budyko framework:
As shown in Figure 3a, Q0 and Q1 are basin-scale discharges with respect to different periods that are represented by points located on different Budyko curves. ΔQ0 is the discharge change from Q0 to Qa caused by the change in E0/P along the same Budyko curve. ΔQw is the discharge change from Qa to Q1 caused by the change in specific parameter (Δw) when the E0/P value remains the same.
There are three common used methods to calculate ΔQ0 and ΔQw: the climate elasticity method [44,45,46], the sensitivity method [47], and the decomposition method [48]. As compared by Wang and Hejazi [48], these separation methods obtained similar results when they were applied for the same catchments. However, the decomposition method eliminates the discretization errors caused by the calculation of partial derivatives in the other two methods [39,49]. By the decomposition method [48], the different parts of the change in discharge can be estimated as
In previous studies, using the traditional separation method, the discharge change caused by the specific parameter change (ΔQw) was directly attributed to land-use changes or human activity [20,21]. However, for explicitly explaining the discharge change in the SRYR, further attribution analysis was imperative.
3.3. Further Attribution Analysis Based on the Modified Separation Approach
As indicated in Figure 3a, the discharge change caused by Δw is defined as ΔQw. The further attribution analysis of ΔQw or Δw in previous studies generally contained two steps: firstly, obtaining time-varying simples (ΔQw or w) by the moving average method [39] or the sequential average method [27]; secondly, determining potential explanatory variables from stepwise regression analysis [39] or a curve-fitting method [27]. In this study, the 11 year moving average method was used to obtain the time-varying specific parameter w, and the stepwise regression method was used to determine the explanatory variables.
Previous studies have reported that the catchment-specific parameter depends on several catchment properties (the relative infiltration capacity, relative soil water storage, etc.) that can be influenced by climate change, such as by changes in the precipitation intensity (I), evapotranspiration (E0), and temperature (T) [36,37,39]. To identify the climatic impacts on the catchment properties, we applied an indirect method that was similar to the approach used by Jiang [39]. The w value was assumed to be linearly correlated with potential explanatory variables by the following:
where β0, β1, β2, and β3 are coefficients; T is the annual MAT; I represents the characteristics of precipitation intensity; and E0 is the annual potential evapotranspiration. Each of the variables was normalized by the absolute mean annual value, indicated by subscript m (Im, Em, and Tm).
The βi (i = 0, 1, 2, …) values were determined through stepwise regression analysis. In each step of the stepwise regression analysis, a variable was considered for addition to, or subtraction from, the set of explanatory variables on the basis of a sequence of F-tests, and the variance inflation factor (VIF) was used to diagnose the collinearity. The selected model had the highest R2 value and contained variables with a VIF of <10. A high VIF value indicates the presence of multicollinearity; a VIF value of 10 is often adopted to diagnose multicollinearity. In practice, a VIF of <10 indicates ignorable multicollinearity among such variables [50,51,52,53].
According to Equation (7), the climatic change in the catchment-specific parameter, Δwc, can be estimated as
where (= I/Im), (= E0/Em), and (= T/Tm) are the normalized values of I, E0, and T, respectively. Using the MFD to indicate frozen ground change and adding normalized MFD change series () to Equation (7), a modified formula is proposed in this study to check the impact of change in the frozen ground:
where and β4 are the normalized MFDs used to indicate the status of the frozen ground and the relevant coefficient, respectively.
In most of the existing studies based on decomposition methods, ΔQ0 was considered as the impact of climate change on discharge, whereas ΔQw was attributed to the change in land use or human activities. However, in this study, we propose an additional climatic discharge change (ΔQwc) that links with Δwc; it is also induced by variations in climate conditions and relevant properties (MFD). This additional climatic discharge change is estimated in a similar way to Equation (6) (Figure 3b):
Accordingly, we define the total climatic change in discharge as the following summation:
Because of the very low population density (2003 census data [15]) and a slight land-use change [22] in the SRYR, human activities were not directly accounted for in this study, but the impact of land-use change on discharge could then be approximately evaluated by ΔQl = ΔQ − ΔQc (Figure 3b).
In this study, the normal climatic impacts on the discharge change in the SRYR and its three sub-basins were assessed using Equation (8), and the impact of frozen-ground degradation on the three sub-basins with different frozen-ground distributions were particularly analysed using Equation (9). The comparison between the results of Equations (8) and (9) indicated the impacts of the frozen-ground degradation, as presented in Section 4.3 and Section 4.4.
3.4. Selection of the Budyko Formula
Fu’s equation [54,55] was selected in this study. Substituting Fu’s equation into Equation (3), we obtain
To inversely obtain the w value from the observation data, we simply used E = P – Q but included an uncertainty of the impact of the ignored change in water storage. To minimise the effect of the change in storage, the 11 year moving average method was applied [39].
4. Results
4.1. Climate and Discharge Changes
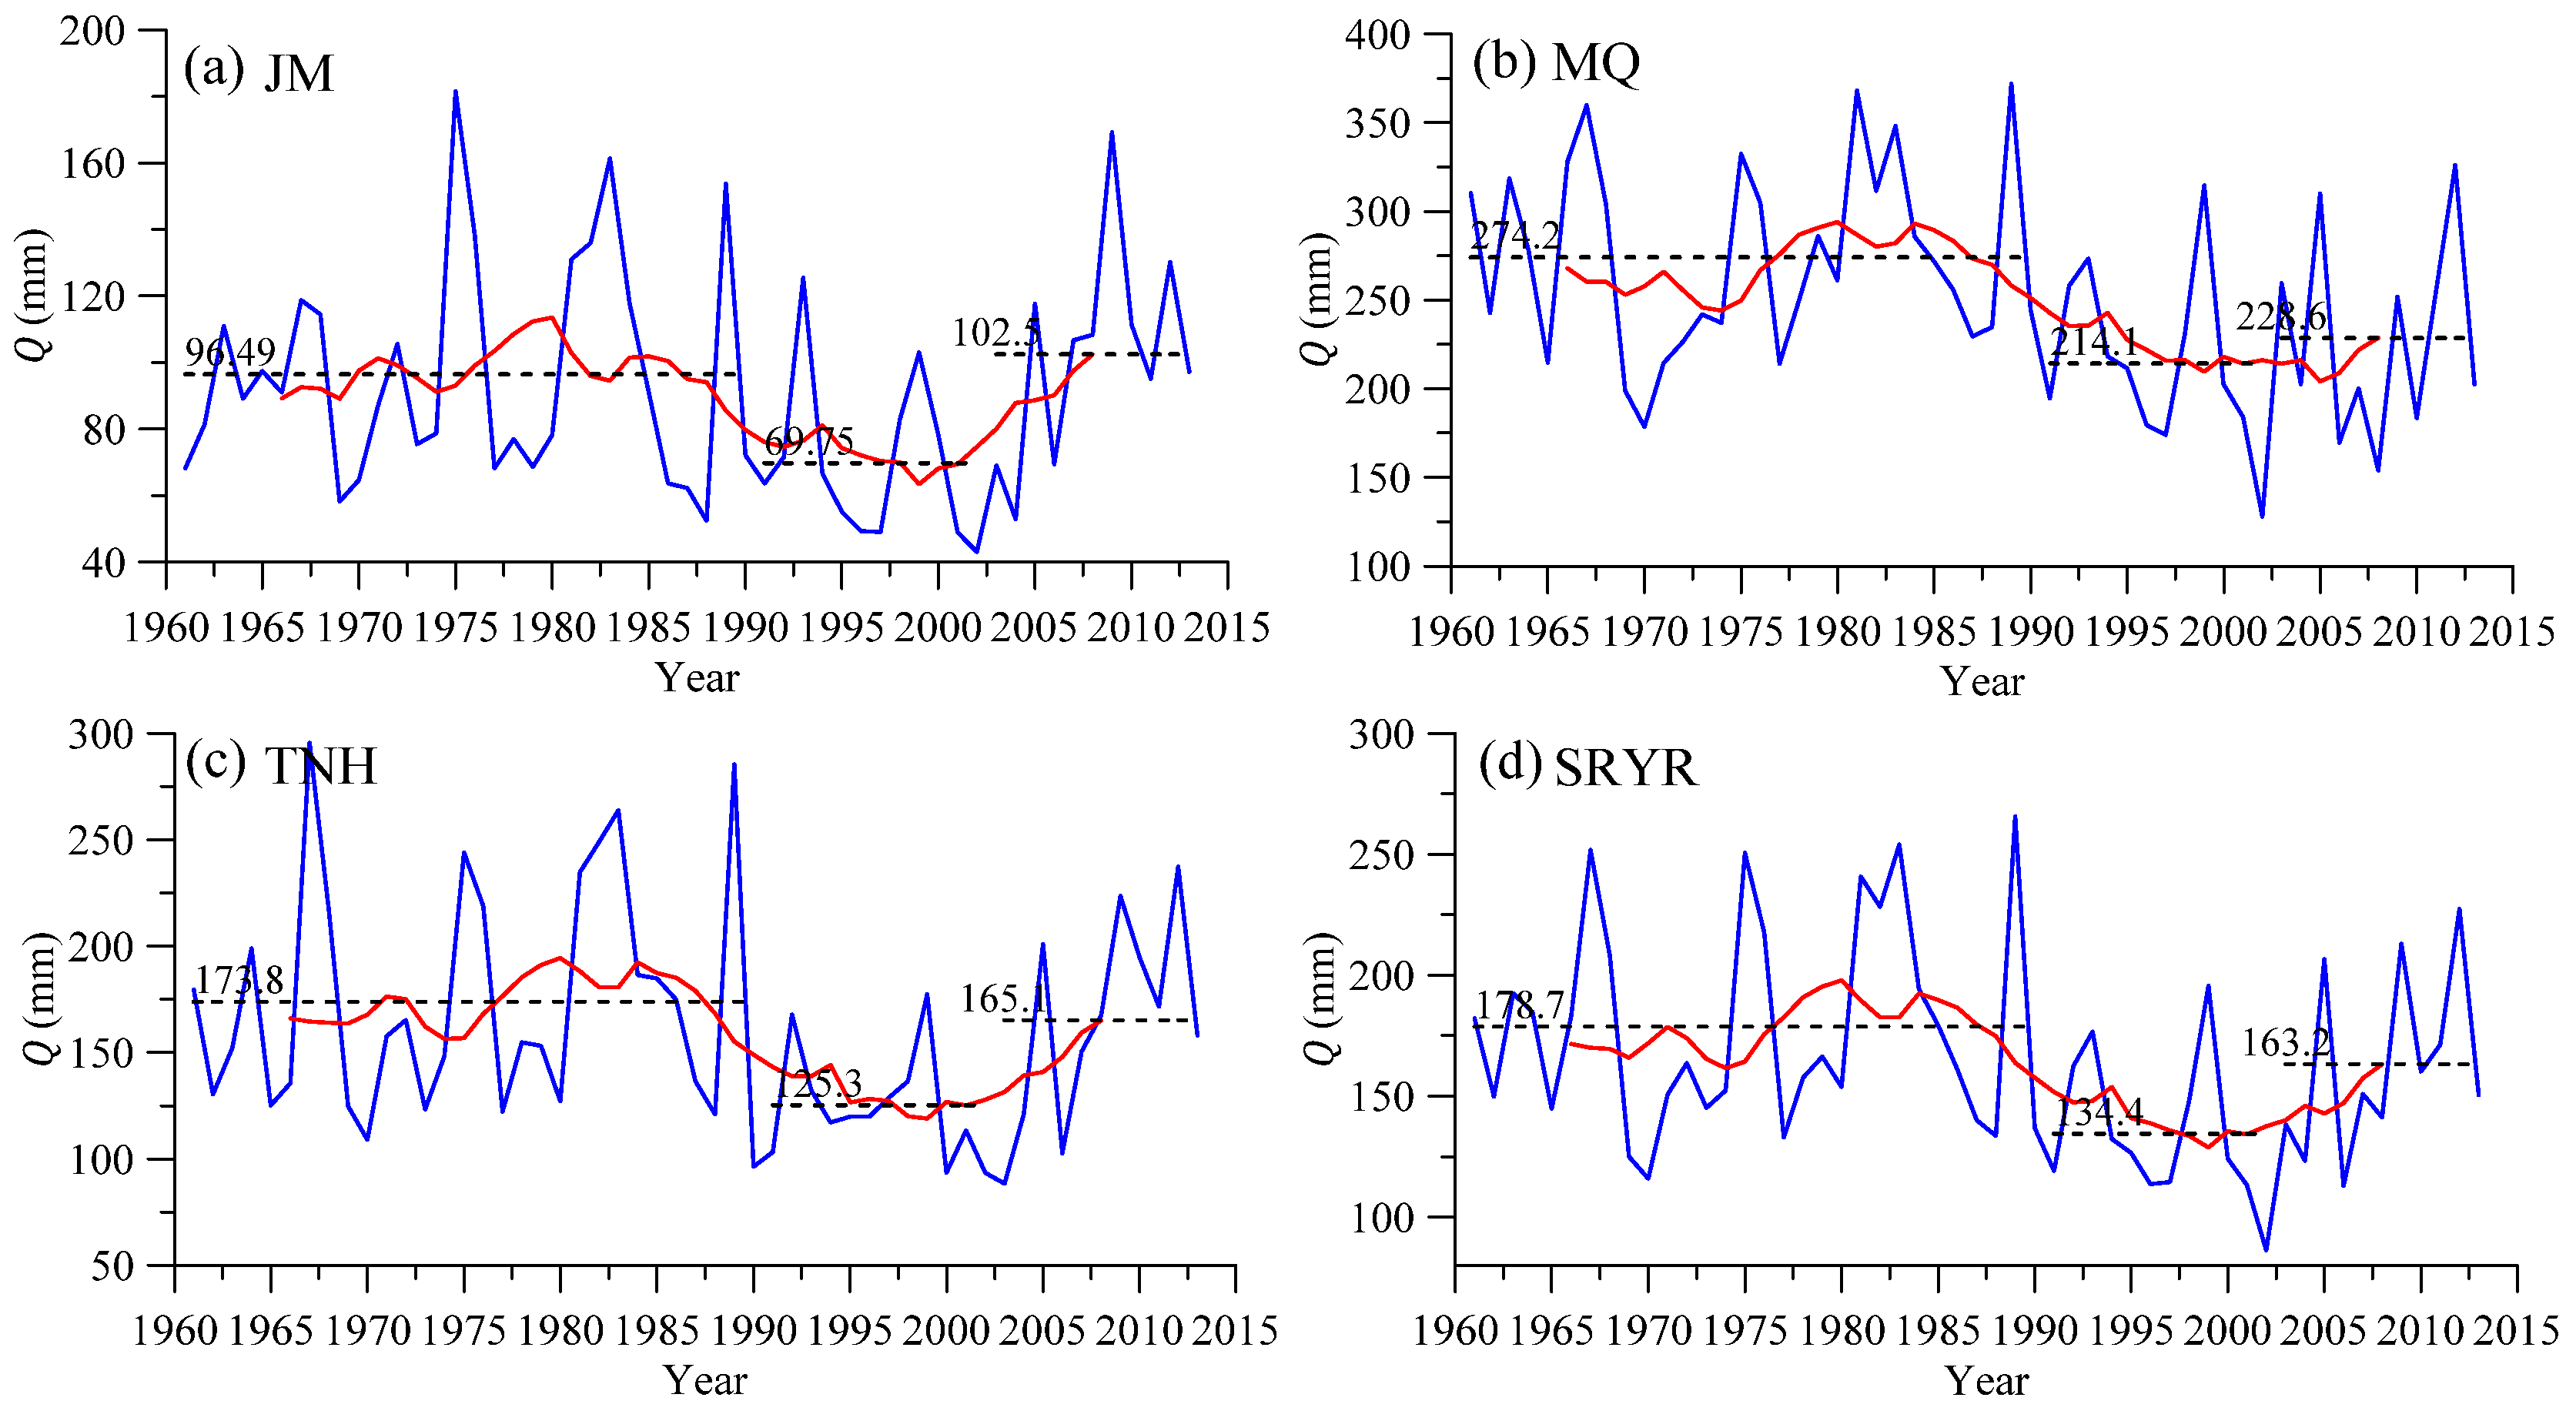
The long-term discharge changes of the SRYR and its three sub-basins are shown in Figure 4; the variation patterns generally can be divided into three periods: the pre-change period from 1961 to 1990 and two post-change periods—a low-flow period from 1991 to 2002 and a recent period from 2003 to 2013. In this section, the climate and discharge changes of the 1991–2002 and 2003–2013 periods are investigated in comparison with the 1961–1990 period, which was the same as the climate pre-change period defined by IPCC [1]. Climate change showed temporal and spatial differences in the SRYR (Table 1). For the period 1991–2002, P decreased (3.0–6.6%) and E0 slightly increased (1.24–1.50%) in the whole study area. The largest change in P (−6.56%) and E0 (1.54%) occurred in MQ. In the 21st century (2003–2013), P increased (5.52–11.05%) across the whole study area, with a sharp increase in the JM (11.05%) and TNH (6.25%) sub-basins. Potential evapotranspiration clearly increased in the 21st century, and ΔE0 varied from 2.89% to 4.41%, with the largest increases in E0 (4.40%) and P (11.05%) occurring in MQ and JM, respectively.
As shown in Figure 4 and Table 1, discharge in the SRYR and its three sub-basins decreased by more than 20% in 1991–2002 but showed a recovery trend in 2003–2013, particularly in JM. The discharge changes in the two periods 1991–2002 and 2003–2013 were further partitioned using the decomposition method, and the results are listed in Table 1. It is indicated that both ΔQ0 and ΔQw were significant. In general, ΔQw contributed more than half of the total absolute change, indicating that the change in the catchment parameter plays a more important role in the hydrological behaviour of the SRYR, which is similar to the findings of previous research for the other catchments [20,21]. A relatively different result was found for the 21st century for the JM basin, where ΔQ was positive but ΔQw was negative, and the normal direct climatic change, ΔQ0, became a dominant component in ΔQ.
If ΔQw is completely explained as the human-induced change in the discharge, we would obtain an unreasonable conclusion on the basis of the results in Table 1: human activities were able to cause significant negative impact on the hydrological processes in areas with a very low population density. This indicates that something is missing from the analysis; Δw should not be completely referred to as the change in land use. Therefore, a further analysis is necessary to extract the impact of the climate change on ΔQw.
4.2. Time-Varying w Value
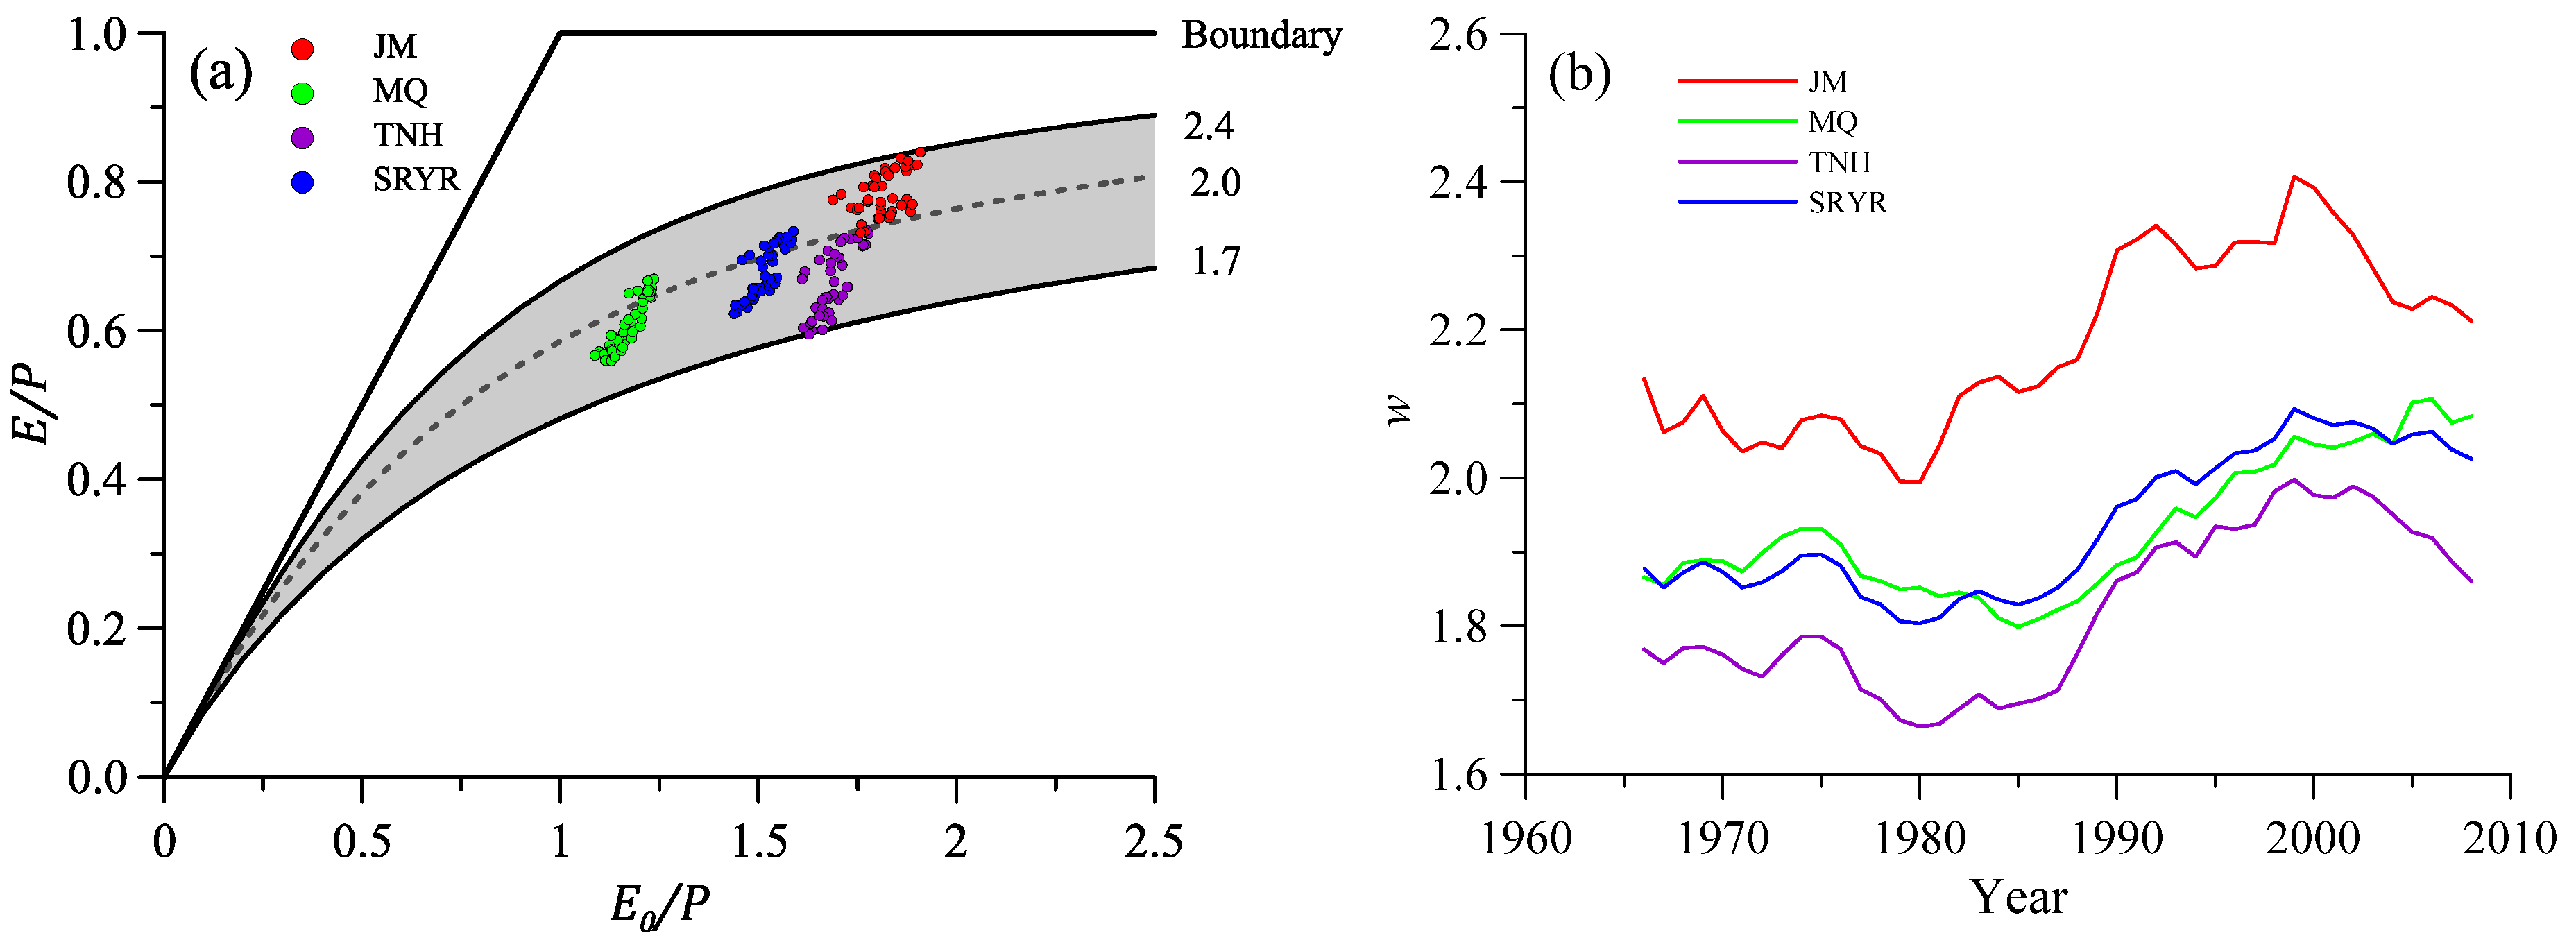
The shift paths of the basin-scale water balance were plotted in the Budyko space (Figure 5a). Each point in the Budyko space could be located to a given Budyko curve by changing the w value for Fu’s equation. Typical Budyko curves for w = 2.4, 2.0, and 1.7 are also shown in Figure 5a for comparison. The gray area in Figure 5a indicates a zone confined by the Budyko curves with the maximum and minimum w values. Using the 11 year moving average values of P, E0, and Q, the time-varying w value was obtained using Fu’s equation. As shown in Figure 5b, the time-varying values of w in the three sub-basins and the SRYR significantly increased during 1980–2000. In the 21st century, this increasing trend continued for MQ but stopped and transitioned to a declining trend for JM, TNH, and the SRYR. MQ had the lowest dryness index (E0/P), but its w value ranged between the w values of JM and TNH. The data points generally showed a positive relationship between the evapotranspiration ratio (E/P) and E0/P, with slopes that were steeper than the slope of traditional Budyko curves with a constant parameter, indicating that ΔQw plays a more important role than ΔQ0 in the discharge change (ΔQ) of the SRYR and the three sub-basins (ΔQw and ΔQ0 refer to Figure 3a).
4.3. Results of Using Equation (8)
In this study, we used the new method (Section 3.3) to further investigate ΔQw with the regression formula (Equation (8)). The relationship between the moving average w values and the climatic forces was analysed with Equation (7). Four optimal regression models (with a significance level of 0.001) were chosen through covariate analysis (Table 2). For the sub-basin JM, the air temperature (T) had a more essential role than the potential evapotranspiration (E0) in controlling the w value, which contrasts with MQ. In TNH and the SRYR, both T and E0 were significant factors that correlated to the w value. The precipitation intensity (I) was a significant factor both in the SRYR and the three sub-basins. The selected variables in the respective model were not the same, but the explanatory variables contained in each model could be generally divided into two groups: water-supply- and energy-supply-related. Water-supply-related explanatory variables included I, and the energy-supply-related explanatory variables included T or E0. According to the Budyko hypothesis, the mean annual water balance in a basin is a synthesis of water supply from precipitation and energy-supply-controlled loss of water by evapotranspiration. Both water-supply- and energy-supply-related variables were included in each formula (Table 2), indicating the reasonability of the obtained results.
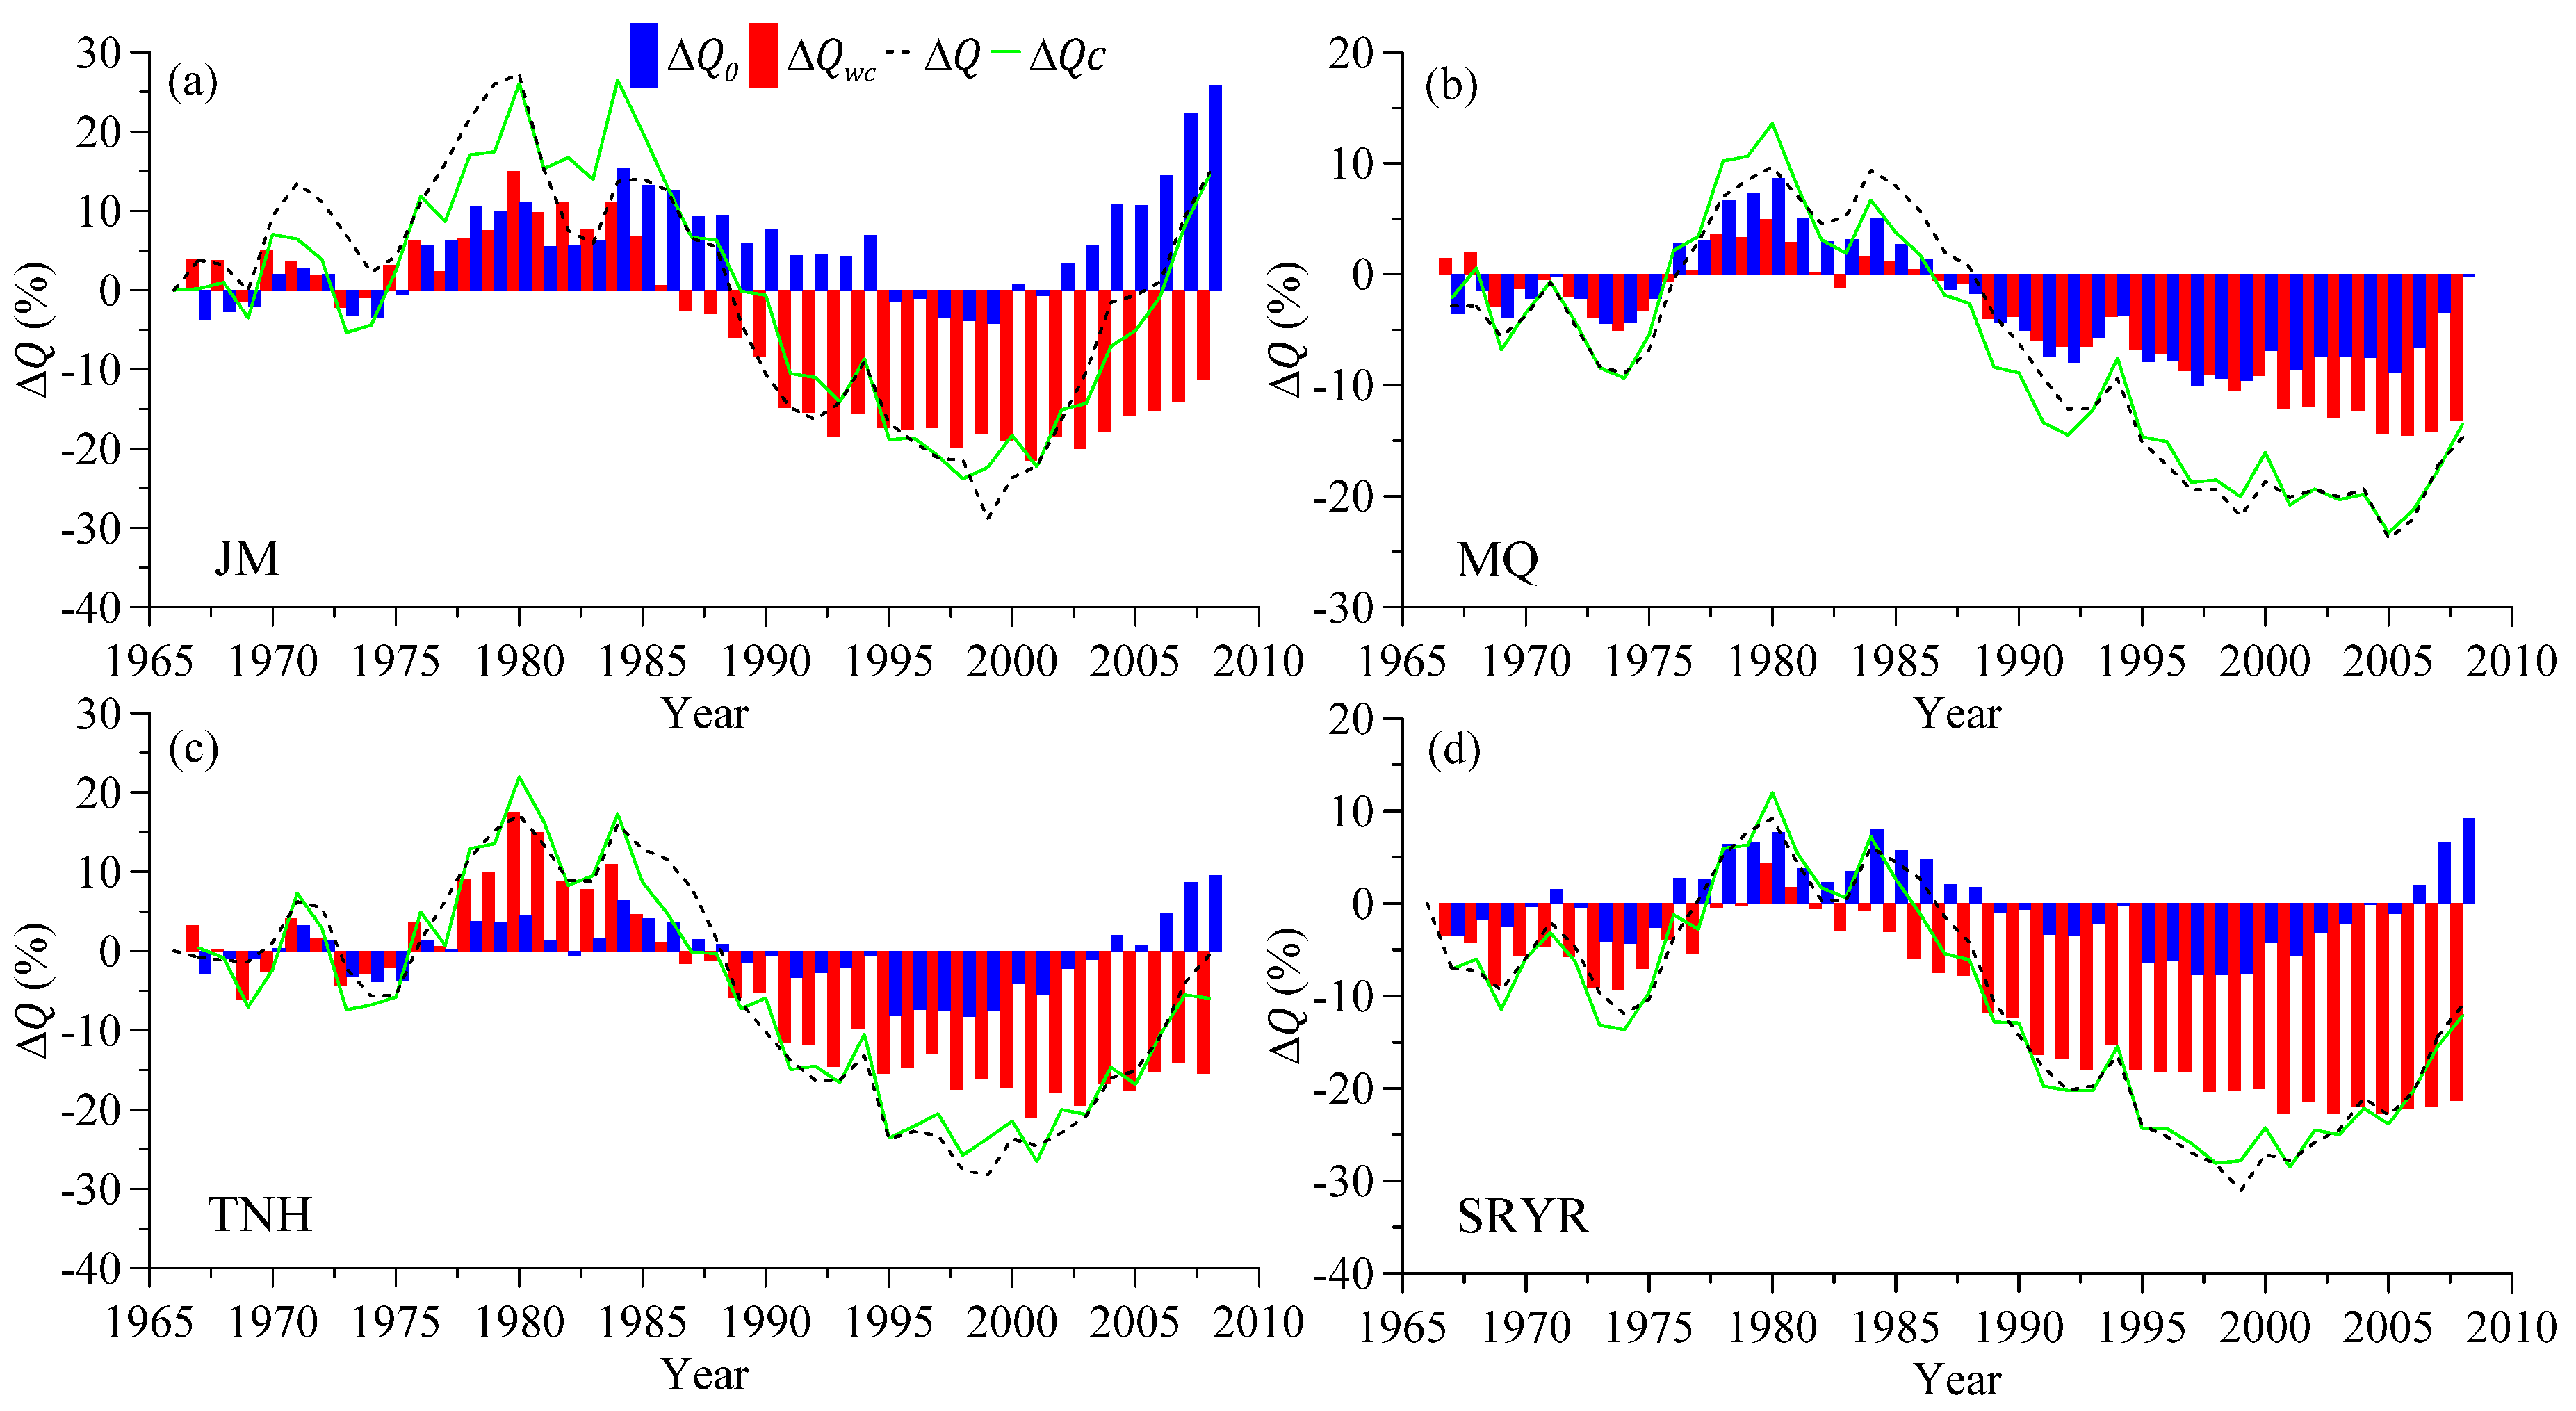
To assess the impact of the climate change on discharge at the basin scale, ΔQwc and ΔQc were estimated with Equations (10) and (11), respectively. The change was related to the moving average data of the first window of 1961–1971. Results are shown in Figure 6, where ΔQ, ΔQc, ΔQ0, and ΔQwc are presented as the percentages of the mean annual discharge during 1961–1971 (substituted by 1966 in Figure 6). As indicated, ΔQc was close to ΔQ for the three sub-basins and the SRYR, demonstrating that climate change is the primary cause of the discharge change in the SRYR. The absolute values of ΔQwc were generally higher than those of ΔQ0, indicating that the change in the catchment-specific parameter plays a more important role than the direct impacts of the changes in the precipitation and potential evapotranspiration. In JM, TNH, and the SRYR, as shown in Figure 6a,c, the absolute value of ΔQwc was more than twice the absolute value of ΔQ0 between 1988 and 2006. The contributions of the catchment-specific parameter changes obtained by the decomposition methods(ΔQw) and shown in Table 1 are similar to those of the modified method(ΔQ−ΔQ0 ≈ ΔQwc), which indicates that the modified method can obtain time-varying results without expense of accuracy.
4.4. Results of Using Equation (9)
To assess different frozen-ground distribution impacts in the three sub-basins, normalised MFD change series () of the three sub-basins were added as candidate explanatory variables in Equation (7), and further stepwise regression analyses were carried out for JM, MQ, and TNH. The results showed that improved the regression model of the two sub-basins JM and TNH, where permafrost is widely distributed, as follows:
These regression formulas could increase the correlation coefficient to R2 = 0.92 and R2 = 0.93 for JM and TNH, respectively. However, was not selected by the stepwise regression analysis in MQ, which indicates that the impact of frozen-ground degradation on MQ was negligible. For the SRYR, w was more significantly correlated with the MFD of TNH rather than with the mean MFD of the whole area; this may be linked with the fact that TNH is close to the outlet of the whole area. By considering the MFD of TNH in the SRYR stepwise regression analysis, the regression coefficient slightly increased from R2 = 0.94 to R2 = 0.95, indicating that the impact of frozen-ground degradation also existed for the discharge change in the whole SRYR.
The coefficients of were positive and close to 1.0, indicating that the MFD was a positive factor for the catchment parameter. Equations (13) and (14) also showed that the w value was positively correlated with the air temperature, T, and negatively correlated with the precipitation intensity, I, in both sub-basins and was positively correlated with E0 in TNH. These results for the relationship between the catchment parameter and the normal climatic forces were consistent with those shown in Table 2, but the values of the coefficients were different.
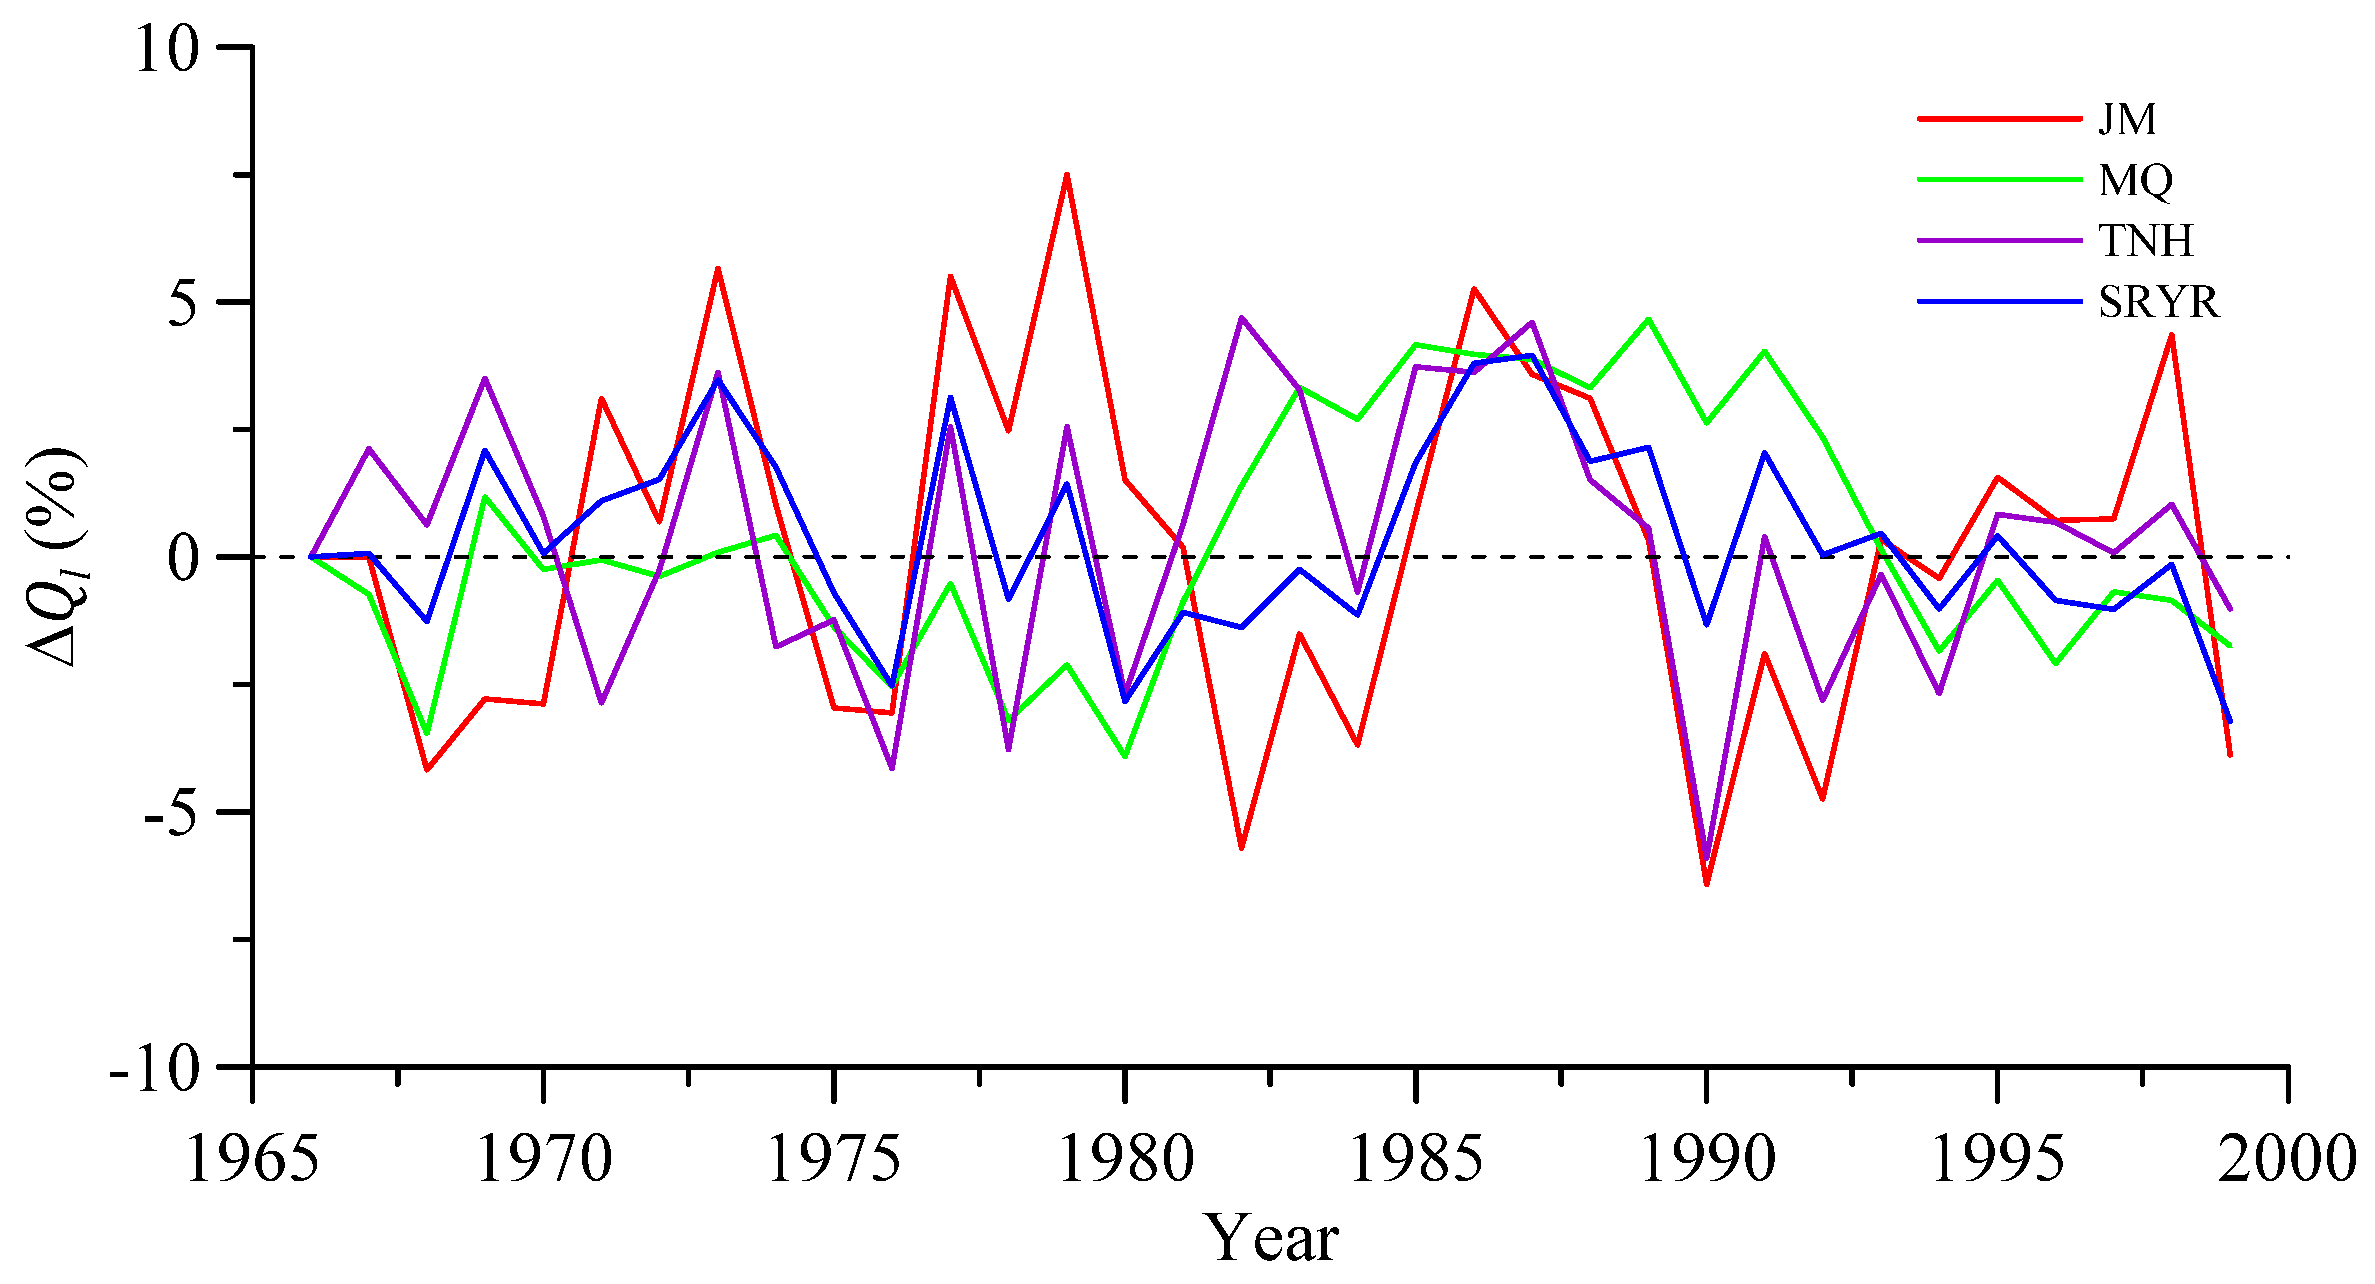
The change in discharge derived from land-use changes was then estimated by ΔQl = ΔQ − ΔQc from the new results of ΔQc. As shown in Figure 7, the ΔQl values were generally less than 5% of the total change and appeared to show a random oscillation, which indicates that the land-use-change impacts on discharge were negligible.
5. Discussions
5.1. The Role of Temperature in Discharge Change
In this study, a modified method based on the Budyko framework was used to investigate hydrological responses to climate change in the SRYR, by Equations (9) and (11). It was found that temperature (T), precipitation intensity (I), and evapotranspiration (E0) were controls on the discharge change in the three sub-basins by altering the catchment-specific parameter. In the past five decades, the temperature has significantly increased in the Yellow River Basin [56,57,58,59]; the effect of temperature changes on discharge is also highlighted in the largest tributary of the Yellow River: the Weihe River Basin [39]. This indicates that air temperature is an important factor in altering catchment discharge by disturbing the true evaporation [39,56].
Wang [27] used the freezing index (DDF) as an indicator of the frozen-ground change to analyse the discharge change in the SRYR and concluded that a 32.6% discharge decrease in the 1990s was caused by frozen-ground degradation. The DDF is defined as the absolute value of accumulated negative air temperature in a hydrological year (from September 1 to August 31 in the SRYR). In that study, the DDF was considered as the only explanatory variable for change in ΔQw. However, one should be aware of the fact that the DDF is significantly correlated with annual MAT; attributing DDF impacts on the discharge change to frozen-ground degradation may cause a misleading assessment of the pure hydrological impact of frozen-ground degradation in the SRYR.
The temperature effect on the discharge change should be carefully considered when the freezing index (DDF) is used in analysis. Accordingly, we further analysed the relationship between the air temperature and ΔQw by nonlinear regression as shown in Figure 8. In the three sub-basins and the SRYR, the air temperature was significantly correlated with ΔQw, which was similar to the relationship between the DDF and ΔQw obtained by Wang [27]. However, ΔQw was not monotonically decreasing with increasing temperature, particularly in JM, TNH, and the SRYR. This indicates that using only temperature change could not sufficiently explain the change in ΔQw. In this study, we selected three climate factors (T, E0, and I) as candidate explanatory variables in the stepwise regression analysis and obtained four optimal models (Table 2). These optimal models explained the ΔQw change in the SRYR and the three sub-basins well (Figure 6). Because T and E0 were positive controls for the w value, they acted as negative controls for ΔQw. However, precipitation intensity (I) was a negative factor for w change and thus a positive factor for ΔQw change; hence the non-monotonic relationship between ΔQw and T was caused by increased precipitation.
5.2. The Role of Frozen-Ground Degradation in Discharge Change
To analyse the impact of frozen-ground degradation on the discharge change, the observed MFD was used to indicate the frozen-ground change in this study. As shown in Figure 2, the MFD has generally decreased since the 1980s, whereas the air temperature has increased. To analyse this correlation, we compared the MFD data for 10 stations with the annual MAT and freezing index (DDF). The locations of these stations are shown in Figure 1, and the correlation analysis results are shown in Table 3. The MFD was positively correlated with the DDF and negatively correlated with the MAT. In general, the significance of the correlation between the MFD and DDF was higher than the correlation between the MFD and MAT, except for the M8 station. This indicates that the decrease in MFD was mainly controlled by the increase in the air temperature for the cold seasons. However, the R2 correlation coefficients were not high, indicating that frozen ground in the region may be influenced by other factors, such as the soil temperature and moisture, snowpack, and canopy [60,61,62,63]. Long-term observed MFD data series may be more accurate in indicating frozen-ground degradation than the freezing index.
If the negative correlation between the MFD and MAT is significant, it would influence the meaning of the regression formulas for the catchment parameter, w. According to Equations (13) and (15), w can be determined by
where are the components related to the other factors and β3 and β4 are the coefficients for the MAT and MFD (both are positive), respectively. Further, we can describe the MFD–MAT correlation by
where ζ is the absolute slope of the correlation line and η is the residual resulting from other controls. Substituting Equation (16) into Equation (15) yields
Because β3, β4, and ζ are positive coefficients, then β3 − β4ζ must be less than β3. Accordingly, the MFD–MAT correlation may reduce the positive sensitivity (when ζ is less than β3/β4) or cause negative sensitivity (when ζ is greater than β3/β4) of the catchment parameter to the change in air temperature. This may explain why the coefficient of T in Table 2 was less than that of Equations (13) and (14). If β3 ≈ β4ζ, then the role of the MAT cannot be explicitly included in Equation (15). This may be the reason why T is not included in the formulas of the sub-basin MQ in Table 2, although the effects of air temperature should also exist in the basin. It is speculated that in MQ, the w value is also positively correlated with the MFD but is offset by the effect of air temperature.
As indicated in Equations (13) and (14), this positive relationship between w and MFD implies that the degradation of frozen ground (decreasing MFD) will cause negative changes in the w and E/P values and thus increase the discharge in JM and TNH, which are widely underlain by permafrost. In general, increasing air temperature increases evapotranspiration and decreases the discharge in catchments [39,56]. However, the degradation of permafrost due to increasing air temperature would increase the discharge, which partially counteracts the negative impact of the increasing air temperature. This effect leads to a more complex response of streamflow in the cold basins with permafrost than that in warm basins without permafrost.
Why does the decreasing MFD act as a positive factor for the discharge of basins in the SRYR? This is still an unsolved problem that was not resolved using only the Budyko framework. However, these results are consistent with the degradation of permafrost due to increasing air temperature being able to increase the discharge of groundwater [28,29,30,31,32,33]; the decrease in the MFD is a major factor for the increase in baseflow in the Qilian Mountain [64], and melt ice within permafrost and increasing hydrological connectivity following permafrost thaw will increase runoff discharge [34,35].
6. Conclusions
On the basis of the Budyko framework, this study modified and improved the traditional separation approach to identify the causes of the discharge change in drainage basins. This modified approach was applied for the SRYR when analysing the interannual change in discharge from 1961 to 2013. The role of varying frozen ground in this cold region was investigated by using the observation data of the MFD. Several conclusions can be drawn according to the obtained results:
- (1)
- The long-term discharge variations in the SRYR are divided into three periods: a pre-change period (1961–1990), a low-flow period (1991–2002), and a recent period (2003–2013). Compared to the pre-change period, the discharge showed a sharp decrease (of more than 20%) in the low-flow period (1991–2002). In the recent period (2003–2013), the discharge showed a recovery trend; particularly, in the JM sub-basin, the discharge increased by 6.22% relative to the pre-change period.
- (2)
- The change in discharge of the SRYR in the past half-century has been mainly controlled by climate change rather than by local human activities. In the low-flow period (1991–2002), the increase in air temperature and potential evapotranspiration and the decrease in the annual precipitation were the main reasons for a significant decrease in discharge. In the recent period (2003–2013), although the air temperature continued to increase, the increase in precipitation partially offset the air temperature and potential evapotranspiration impacts on discharge, thus leading to a recovery in discharge compared to the low-flow period (1991–2002).
- (3)
- The modified separation approach considered climate change and frozen-ground degradation impacts on the catchment-specific parameter. The changes in the catchment-specific parameters (w) in the SRYR and the three sub-basins were mainly caused by changes in the water-supply-related variable, I, and energy-supply-related variables, T and E0. In addition, the catchment-specific parameters of JM and TNH were correlated with the MFD of frozen ground, which indicates that the impacts of the frozen-ground degradation on hydrological responses in the permafrost dominated the sub-basins.
- (4)
- Increasing air temperature is generally a negative force for discharge. However, in the SRYR, it also causes permafrost degradation that can act as a positive factor for discharge. Such conflicting effects enhance the uncertainty in assessments of the hydrological response to climate change in the sub-basins with widely underlain permafrost.
Author Contributions
P.W. designed and carried out this research. S.L. and X.-S.W. supervised and instructed this research. P.W. and X.-S.W. wrote this paper. Y.F. prepared and analyzed the data. J.M.M. provided advices and help in this paper revision. All authors have approved the manuscript.
Funding
This research was supported by the China Geological Survey from 2000, the National Natural Science Foundation of China (41330634, 41072191, and 91125011), and the Fundamental Research Funds for Central Universities.
Acknowledgments
The authors are grateful to the two anonymous reviewers for their insightful and constructive comments, which greatly improved the quality of the paper.
Conflicts of Interest
The authors declare no conflicts of interest.
References
- IPCC. Climate Change 2007: The Physical Science Basis. In Contribution of Working Group I to the Fourth Assessment Report of the Intergovernmental Panel on Climate Change; Cambridge University Press: Cambridge, UK, 2007; p. 996. [Google Scholar]
- Abdul Aziz, O.I.; Burn, D.H. Trends and variability in the hydrological regime of the Mackenzie River Basin. J. Hydrol. 2006, 319, 282–294. [Google Scholar] [CrossRef]
- Birsan, M.-V.; Molnar, P.; Burlando, P.; Pfaundler, M. Streamflow trends in Switzerland. J. Hydrol. 2005, 314, 312–329. [Google Scholar] [CrossRef]
- Chen, J.; Wu, X.; Finlayson, B.L.; Webber, M.; Wei, T.; Li, M.; Chen, Z. Variability and trend in the hydrology of the Yangtze River, China: Annual precipitation and runoff. J. Hydrol. 2014, 513, 403–412. [Google Scholar] [CrossRef]
- Chiew, F.H.S.; Teng, J.; Vaze, J.; Post, D.A.; Perraud, J.M.; Kirono, D.G.C.; Viney, N.R. Estimating climate change impact on runoff across southeast Australia: Method, results, and implications of the modeling method. Water Resour. Res. 2009, 45. [Google Scholar] [CrossRef] [Green Version]
- Immerzeel, W.W.; van Beek, L.P.; Bierkens, M.F. Climate change will affect the Asian water towers. Science 2010, 328, 1382–1385. [Google Scholar] [CrossRef] [PubMed]
- Liang, L.; Li, L.; Liu, C.; Cuo, L. Climate change in the Tibetan Plateau Three Rivers Source Region: 1960-2009. Int. J. Climatol. 2013, 33, 2900–2916. [Google Scholar] [CrossRef] [Green Version]
- Su, F.; Zhang, L.; Ou, T.; Chen, D.; Yao, T.; Tong, K.; Qi, Y. Hydrological response to future climate changes for the major upstream river basins in the Tibetan Plateau. Glob. Planet. Chang. 2016, 136, 82–95. [Google Scholar] [CrossRef]
- Liu, C.; Zheng, H. Changes in components of the hydrological cycle in the yellow river basin during the second half of the 20th century. Hydrol. Process. 2004, 18, 2337–2345. [Google Scholar] [CrossRef]
- Yang, D.; Li, C.; Hu, H.; Lei, Z.; Yang, S.; Kusuda, T.; Musiake, K. Analysis of water resources variability in the Yellow River of China during the last half century using historical data. Water Resour. Res. 2004, 40. [Google Scholar] [CrossRef] [Green Version]
- Lan, Y.; Zhao, G.; Zhang, Y.; Wen, J.; Liu, J.; Hu, X. Response of runoff in the source region of the Yellow River to climate warming. Quat. Int. 2010, 226, 60–65. [Google Scholar] [CrossRef]
- Zheng, H.; Zhang, L.; Liu, C.; Shao, Q.; ukushima, Y. Changes in stream flow regime in headwater catchments of the Yellow River basin since the 1950s. Hydrol. Process. 2007, 21, 886–893. [Google Scholar] [CrossRef] [Green Version]
- Zhang, Q.; Xu, C.-Y.; Yang, T. Variability of Water Resource in the Yellow River Basin of Past 50 Years, China. Water Resour. Manag. 2008, 23, 1157–1170. [Google Scholar] [CrossRef]
- Cuo, L.; Zhang, Y.; Gao, Y.; Hao, Z.; Cairang, L. The impacts of climate change and land cover/use transition on the hydrology in the upper Yellow River Basin, China. J. Hydrol. 2013, 502, 37–52. [Google Scholar] [CrossRef]
- Liang, S.; Ge, S.; Wan, L.; Zhang, J. Can climate change cause the Yellow River to dry up? Water Resour. Res. 2010, 46. [Google Scholar] [CrossRef] [Green Version]
- Hu, Y.; Maskey, S.; Uhlenbrook, S.; Zhao, H. Streamflow trends and climate linkages in the source region of the Yellow River, China. Hydrol. Process. 2011, 25, 3399–3411. [Google Scholar] [CrossRef]
- Tang, Q.; Oki, T.; Kanae, S.; Hu, H. Hydrological cycles change in the Yellow River basin during the last half of the twentieth century. J. Clim. 2008, 21, 1790–1806. [Google Scholar] [CrossRef]
- Tang, Y.; Tang, Q.; Tian, F.; Zhang, Z.; Liu, G. Responses of natural runoff to recent climatic variations in the Yellow River basin, China. Hydrol. Earth Syst. Sci. 2013, 17, 4471–4480. [Google Scholar] [CrossRef] [Green Version]
- Meng, F.; Su, F.; Yang, D.; Tong, K.; Hao, Z. Impacts of recent climate change on the hydrology in the source region of the yellow river basin. J. Hydrol. Reg. Stud. 2016, 6, 66–81. [Google Scholar] [CrossRef]
- Zheng, H.; Zhang, L.; Zhu, R.; Liu, C.; Sato, Y.; Fukushima, Y. Responses of streamflow to climate and land surface change in the headwaters of the Yellow River Basin. Water Resour. Res. 2009, 45. [Google Scholar] [CrossRef] [Green Version]
- Zhao, F.; Xu, Z.; Zhang, L.; Zuo, D. Streamflow response to climate variability and human activities in the upper catchment of the Yellow River Basin. Sci. China Ser. E Technol. Sci. 2009, 52, 3249–3256. [Google Scholar] [CrossRef]
- Wang, S.-Y.; Liu, J.-S.; Ma, T.-B. Dynamics and changes in spatial patterns of land use in Yellow River Basin, China. Land Use Policy 2010, 27, 313–323. [Google Scholar] [CrossRef]
- Zhou, Y.; Guo, D.; Qiu, G.; Cheng, G. Geocryology in China; Science Press: Beijing, China, 2000; 450p. (In Chinese) [Google Scholar]
- Jin, H.J.; Wang, S.L.; Lü, L.Z.; He, R.X.; Chang, X.L.; Luo, D.L. Features and degradation of frozen ground in the sources area of the Yellow River, China. J. Glaciol. Geocryol. 2010, 49, 5522–5529, (In Chinese with English Abstract). [Google Scholar]
- Jin, H.; He, R.; Cheng, G.; Wu, Q.; Wang, S.; Lü, L.; Chang, X. Changes in frozen ground in the Source Area of the Yellow River on the Qinghai–Tibet Plateau, China, and their eco-environmental impacts. Environ. Res. Lett. 2009, 4, 045206. [Google Scholar] [CrossRef]
- Yang, M.; Nelson, F.E.; Shiklomanov, N.I.; Guo, D.; Wan, G. Permafrost degradation and its environmental effects on the Tibetan Plateau: A review of recent research. Earth-Sci. Rev. 2010, 103, 31–44. [Google Scholar] [CrossRef]
- Wang, T.; Yang, H.; Yang, D.; Qin, Y.; Wang, Y. Quantifying the streamflow response to frozen ground degradation in the source region of the yellow river within the budyko framework. J. Hydrol. 2018, 558, 301–313. [Google Scholar] [CrossRef]
- Walvoord, M.A.; Striegl, R.G. Increased groundwater to stream discharge from permafrost thawing in the Yukon River basin: Potential impacts on lateral export of carbon and nitrogen. Geophys. Res. Lett. 2007, 34, 123–134. [Google Scholar] [CrossRef]
- St Jacques, J.M.; Sauchyn, D.J. Increasing winter baseflow and mean annual streamflow from possible permafrost thawing in the northwest territories, Canada. Geophys. Res. Lett. 2009, 36, 329–342. [Google Scholar] [CrossRef]
- Bense, V.F.; Kooi, H.; Ferguson, G.; Read, T. Permafrost degradation as a control on hydrogeological regime shifts in a warming climate. J. Geophys. Res. Earth Surf. 2012, 117, 8316. [Google Scholar] [CrossRef]
- McKenzie, J.M.; Voss, C.I. Permafrost thaw in a nested groundwater-flow system. Hydrogeol. J. 2013. [Google Scholar] [CrossRef]
- Evans, S.G.; Ge, S.; Liang, S. Analysis of groundwater flow in mountainous, headwater catchments with permafrost. Water Resour. Res. 2015, 51, 9564–9576. [Google Scholar] [CrossRef] [Green Version]
- Duan, L.; Man, X.; Kurylyk, B.L.; Cai, T. Increasing winter baseflow in response to permafrost thaw and precipitation regime shifts in Northeastern China. Water 2017, 9, 25. [Google Scholar] [CrossRef]
- Connon, R.F.; Quinton, W.L.; Craig, J.R.; Hayashi, M. Changing hydrologic connectivity due to permafrost thaw in the lower Liard River valley, NWT, Canada. Hydrol. Process. 2014, 28, 4163–4178. [Google Scholar] [CrossRef]
- Duan, L.; Man, X.; Kurylyk, B.L.; Cai, T.; Li, Q. Distinguishing streamflow trends caused by changes in climate, forest cover, and permafrost in a large watershed in northeastern china. Hydrol. Process. 2017, 31, 1938–1951. [Google Scholar] [CrossRef]
- Yang, D.; Sun, F.; Liu, Z.; Cong, Z.; Ni, G.; Lei, Z. Analyzing spatial and temporal variability of annual water-energy balance in nonhumid regions of China using the Budyko hypothesis. Water Resour. Res. 2007, 43. [Google Scholar] [CrossRef] [Green Version]
- Donohue, R.J.; Roderick, M.L.; McVicar, T.R. Roots, storms and soil pores: Incorporating key ecohydrological processes into Budyko’s hydrological model. J. Hydrol. 2012, 436, 35–50. [Google Scholar] [CrossRef]
- Williams, C.A.; Reichstein, M.; Buchmann, N.; Baldocchi, D.; Beer, C.; Schwalm, C.; Wohlfahrt, G.; Hasler, N.; Bernhofer, C.; Foken, T.; et al. Climate and vegetation controls on the surface water balance: Synthesis of evapotranspiration measured across a global network of flux towers. Water Resour. Res. 2012, 48. [Google Scholar] [CrossRef] [Green Version]
- Jiang, C.; Xiong, L.; Wang, D.; Liu, P.; Guo, S.; Xu, C.-Y. Separating the impacts of climate change and human activities on runoff using the Budyko-type equations with time-varying parameters. J. Hydrol. 2015, 522, 326–338. [Google Scholar] [CrossRef]
- Wang, T. (Ed.) 1:4,000,000 Map of the Glaciers, Frozen Ground and Deserts in China; Science Press: Beijing, China, 2006; Available online: http://westdc.westgis.ac.cn (accessed on 29 June 2018).
- Allen, R.; Pereira, L.S.; Raes, D.; Smith, M. Crop Evapotranspiration—Guidelines for Computing Crop Water Requirements; FAO Irrigation and Drainage Paper No. 56; FAO: Rome, Italy, 1998. [Google Scholar]
- Budyko, M.I. (Ed.) Climate and Life; Translated from Russian by D. H. Miller; Elsevier: New York, NY, USA, 1974. [Google Scholar]
- Xiong, L.; Guo, S. Appraisal of Budyko formula in calculating long-term water balance in humid watersheds of southern China. Hydrol. Process. 2012, 26, 1370–1378. [Google Scholar] [CrossRef]
- Arora, V.K. The use of the aridity index to assess climate change effect on annual runoff. J. Hydrol. 2002, 265, 164–177. [Google Scholar] [CrossRef]
- Dooge, J.C.I.; Bruen, M.; Parmentier, B. A simple model for estimating the sensitivity of runoff to long-term changes in precipitation without a change in vegetation. Adv. Water Resour. 1999, 23, 153–163. [Google Scholar] [CrossRef]
- Kuhnel, V.; Dooge, J.C.I.; O’Kane, J.C.I.; Romanowicz, R.J. Partial analysis applied to scale problems in surface moisture fluxes. Surv. Geophys. 1991, 12, 221–247. [Google Scholar] [CrossRef]
- Roderick, M.L.; Farquhar, G.D. A simple framework for relating variations in runoff to variations in climatic conditions and catchment properties. Water Resour. Res. 2011, 47. [Google Scholar] [CrossRef] [Green Version]
- Wang, D.; Hejazi, M. Quantifying the relative contribution of the climate and direct human impacts on mean annual streamflow in the contiguous United States. Water Resour. Res. 2011, 47, 411. [Google Scholar] [CrossRef]
- Yang, H.; Yang, D.; Hu, Q. An error analysis of the Budyko hypothesis for assessing the contribution of climate change to runoff. Water Resour. Res. 2014, 50, 9620–9629. [Google Scholar] [CrossRef] [Green Version]
- Neter, J.; Wasserman, W.; Kutner, M.H. Applied Linear Regression Models; Irwin: Homewood, IL, USA, 1989. [Google Scholar]
- Hair, J.F.J.; Anderson, R.E.; Tatham, R.L.; Black, W.C. Multivariate Data Analysis; Macmillan: New York, NY, USA, 1995. [Google Scholar]
- Jolliffe, I.T. Principal components in regression analysis. Princ. Compon. Anal. 2002, 167–198. [Google Scholar] [CrossRef]
- Jou, Y.J.; Cho, H.J. A VIF-Based Optimization Model to Alleviate Collinearity Problems in Multiple Linear Regression; Kluwer Academic Publishers: Dordrecht, The Netherlands, 2014. [Google Scholar]
- Fu, B. The calculation of the evaporation from land surface. Sci. Atmos. Sin. 1981, 5, 23–31. (In Chinese) [Google Scholar]
- Zhang, L.; Hickel, K.; Dawes, W.R.; Chiew, F.H.S.; Western, A.W.; Briggs, P.R. A rational function approach for estimating mean annual evapotranspiration. Water Resour. Res. 2004, 40, 89–97. [Google Scholar] [CrossRef]
- Tang, C.; Crosby, B.T.; Wheaton, J.M.; Piechota, T.C. Assessing streamflow sensitivity to temperature increases in the salmon river basin, Idaho. Glob. Planet. Chang. 2012, 88, 32–44. [Google Scholar] [CrossRef]
- Fu, G.; Chen, S.; Liu, C.; Shepard, D. Hydro-climatic trends of the yellow river basin for the last 50 years. Clim. Chang. 2004, 65, 149–178. [Google Scholar] [CrossRef]
- Huang, Y.; Cai, J.; Yin, H.; Cai, M. Correlation of precipitation to temperature variation in the Huanghe River (Yellow River) basin during 1957–2006. J. Hydrol. 2009, 372, 1–8. [Google Scholar] [CrossRef]
- Wang, W.; Shao, Q.; Yang, T.; Peng, S.; Yu, Z.; Taylor, J.; Xing, W.; Zhao, C.; Sun, F. Changes in daily temperature and precipitation extremes in the Yellow River Basin, China. Stoch. Environ. Res. Risk Assess. 2013, 27, 401–421. [Google Scholar] [CrossRef]
- Goodrich, L.E. The influence of snow cover on the ground thermal regime. Can. Geotech. J. 1982, 19, 421–432. [Google Scholar] [CrossRef] [Green Version]
- Nelson, F.E.; Shiklomanov, N.I.; Mueller, G.R. Estimating active layer thickness over a large region: Kaparuk River basin, Alaska, USA. Arct. Alp. Res. 1997, 29, 367–378. [Google Scholar] [CrossRef]
- Yamazaki, T.; Kondo, J.; Nishida, A. Seasonal frost depth of grounds with bare surface, snow cover and vegetation. J. Jpn. Soc. Snow Ice 1998, 60, 213–224. [Google Scholar] [CrossRef]
- Shanley, J.B.; Chalmers, A. The effect of frozen soil on snowmelt runoff at sleepers river, vermont. Hydrol. Process. 1999, 13, 1843–1857. [Google Scholar] [CrossRef]
- Qin, Y.; Lei, H.; Yang, D.; Gao, B.; Wang, Y.; Cong, Z.; Fan, W. Long-term change in the depth of seasonally frozen ground and its ecohydrological impacts in the qilian mountains, northeastern tibetan plateau. J. Hydrol. 2016, 542, 204–221. [Google Scholar] [CrossRef]
Figure 1.
Relative location of the three sub-basins (Jimai (JM), Jimai-Maqu (MQ), and Maqu-Tangnaihai (TNH)), distribution of frozen ground, and meteorological and hydrological stations (the red circles indicate stations that have the longest frozen-ground record in their respective sub-basin).
Figure 1.
Relative location of the three sub-basins (Jimai (JM), Jimai-Maqu (MQ), and Maqu-Tangnaihai (TNH)), distribution of frozen ground, and meteorological and hydrological stations (the red circles indicate stations that have the longest frozen-ground record in their respective sub-basin).

Figure 2.
Change in the maximum frozen depth (MFD) and annual mean temperature of (a) Jimai (JM), (b) Maqu (MQ), and (c) Tangnaihai (TNH) sub-basins.
Figure 2.
Change in the maximum frozen depth (MFD) and annual mean temperature of (a) Jimai (JM), (b) Maqu (MQ), and (c) Tangnaihai (TNH) sub-basins.

Figure 3.
Partition of discharge change in the Budyko framework. (a) The traditional separation approach: discharge change (ΔQ) is primarily separated into two components, ΔQ0 and ΔQw. (b) The modified separation approach: ΔQw is further separated into ΔQwc and ΔQl in considering the impacts of climate change and frozen-ground degradation on the catchment-specific parameter.

Figure 4.
Time series of annual discharge, Q, in the three sub-basins and the source region of the Yellow River (SRYR). The dashed, red, and blue lines indicate the mean values in different periods, 11 year moving average value, and annual mean value of discharge, respectively.
Figure 4.
Time series of annual discharge, Q, in the three sub-basins and the source region of the Yellow River (SRYR). The dashed, red, and blue lines indicate the mean values in different periods, 11 year moving average value, and annual mean value of discharge, respectively.

Figure 5.
Plots of the moving average water balance in the Budyko space: (a) time-varying values of the catchment parameter (w) in Fu’s formula, and (b) for the three sub-basins. In (a), 2.4, 2.0, and 1.7 refer to the w value for the three types of curves.
Figure 5.
Plots of the moving average water balance in the Budyko space: (a) time-varying values of the catchment parameter (w) in Fu’s formula, and (b) for the three sub-basins. In (a), 2.4, 2.0, and 1.7 refer to the w value for the three types of curves.

Figure 6.
Decomposition results of the climatic change in discharge (ΔQ0, ΔQwc, and ΔQc) in comparison with the total change in discharge (ΔQ) for the three sub-basins and the source region of the Yellow River (SRYR). (a–d) The results of using Equation (8) for Jimai (JM), Maqu (MQ), Tangnaihai (TNH), and the SRYR.

Figure 7.
Time series of ΔQl in the three sub-basins and the source region of the Yellow River (SRYR).
Figure 7.
Time series of ΔQl in the three sub-basins and the source region of the Yellow River (SRYR).

Figure 8.
Relationship between temperature and ΔQw in the three sub-basins and the source region of the Yellow River (SRYR).
Figure 8.
Relationship between temperature and ΔQw in the three sub-basins and the source region of the Yellow River (SRYR).


Table 1.
Results of decomposition method.
| Basins | Period | w | P (%) | E0 (%) | Q (%) | ΔQ0 (%) | ΔQw (%) | ΔQ (%) |
|---|---|---|---|---|---|---|---|---|
| JM | 1961–1990 | 2.10 | Reference Period | |||||
| 1991–2002 | 2.33 | −3.36 | 1.30 | −27.72 | −7.69 | −20.03 | −27.72 | |
| 2003–2013 | 2.21 | 11.05 | 3.70 | 6.22 | 18.60 | −12.38 | 6.22 | |
| MQ | 1961–1990 | 1.85 | Reference Period | |||||
| 1991–2002 | 2.01 | −6.56 | 1.54 | −21.89 | −11.43 | −10.47 | −21.89 | |
| 2003–2013 | 2.08 | 0.96 | 4.41 | −16.60 | −1.18 | −15.42 | −16.60 | |
| TNH | 1961–1990 | 1.74 | Reference Period | |||||
| 1991–2002 | 1.94 | −5.43 | 1.24 | −27.94 | −9.37 | −18.58 | −27.94 | |
| 2003–2013 | 1.86 | 6.25 | 2.89 | −5.02 | 8.38 | −13.40 | −5.02 | |
| SRYR | 1961–1990 | 1.85 | Reference Period | |||||
| 1991–2002 | 2.04 | −5.23 | 1.36 | −24.81 | −9.63 | −15.17 | −24.81 | |
| 2003–2013 | 2.03 | 5.52 | 3.67 | −8.70 | 6.83 | −15.53 | −8.70 | |
Table 2.
Results of w covariate analysis for the period between 1961 and 2013.
| Basins | Models of Equation (7) (Candidates , and ) | R2 |
|---|---|---|
| JM | 5.229 + 0.466 − 2.582 | 0.83 |
| MQ | −3.778 − 1.582 + 7.291 | 0.88 |
| TNH | 1.982 + 0.442 − 3.194 + 2.591 | 0.91 |
| SRYR | 1.002 + 0.057 − 2.085 + 2.963 | 0.94 |
Table 3.
Correlations between maximum frozen depth (MFD) and DDF at weather stations, compared to correlations between MFD and mean air temperature (MAT).
Table 3.
Correlations between maximum frozen depth (MFD) and DDF at weather stations, compared to correlations between MFD and mean air temperature (MAT).
| Station | R2 of MFD–DDF | R2 of MFD–MAT | MFD Record Length (Years) |
|---|---|---|---|
| M5 | 0.67(+) * | 0.49(−) * | 1960–2004 (45) |
| M6 | 0.29(+) | 0.13(−) | 1983–2004 (22) |
| M8 | 0.19(+) | 0.41(−) | 1990–1996, 1998–2004 (14) |
| M10 | 0.20(+) | 0.08(−) | 1962–2004 (43) |
| M11 | 0.59(+) | 0.18(−) | 1991–2004 (14) |
| M12 | 0.51(+) | 0.46(−) | 1967–1997 (31) |
| M13 | 0.55(+) | 0.41(−) | 1974–2004 (31) |
| M14 | 0.46(+) | 0.24(−) | 1966–2004 (39) |
| M16 | 0.40(+) | 0.38(−) | 1971–1979, 1995–2004 (28) |
| M17 | 0.48(+) | 0.35(−) | 1974–2004 (31) |
Note: * (−) and (+) indicate negative correlation and positive correlation, respectively.
© 2018 by the authors. Licensee MDPI, Basel, Switzerland. This article is an open access article distributed under the terms and conditions of the Creative Commons Attribution (CC BY) license (http://creativecommons.org/licenses/by/4.0/).
Share and Cite
MDPI and ACS Style
Wu, P.; Liang, S.; Wang, X.-S.; Feng, Y.; McKenzie, J.M. A New Assessment of Hydrological Change in the Source Region of the Yellow River. Water 2018, 10, 877. https://doi.org/10.3390/w10070877
AMA Style
Wu P, Liang S, Wang X-S, Feng Y, McKenzie JM. A New Assessment of Hydrological Change in the Source Region of the Yellow River. Water. 2018; 10(7):877. https://doi.org/10.3390/w10070877
Chicago/Turabian StyleWu, Pan, Sihai Liang, Xu-Sheng Wang, Yuqing Feng, and Jeffrey M. McKenzie. 2018. "A New Assessment of Hydrological Change in the Source Region of the Yellow River" Water 10, no. 7: 877. https://doi.org/10.3390/w10070877
Note that from the first issue of 2016, this journal uses article numbers instead of page numbers. See further details here.