Article

Research on Optimal Water Allocation Based on Water Rights Trade under the Principle of Water Demand Management: A Case Study in Bayannur City, China

1
State Key Laboratory of Simulation and Regulation of Water Cycle in River Basin, China Institute of Water Resources and Hydropower Research, Beijing 100038, China
2
State Key Laboratory of Hydroscience and Engineering, Tsinghua University, Beijing 100084, China
*
Author to whom correspondence should be addressed.
Water 2018, 10(7), 863; https://doi.org/10.3390/w10070863
Submission received: 16 May 2018 / Revised: 9 June 2018 / Accepted: 28 June 2018 / Published: 28 June 2018

Abstract

:
In water shortage regions, water rights trading would be much useful for increasing water use inefficiency through changing users’ water demand. In this study, a water optimal allocation modelling system is proposed by considering water rights trading and other governmental policies such as water prices, water savings and industrial policies. An agent-based model was developed to describe the behaviors and goals of individual agents using complex adaptive system theory, information transfers, and functional mechanisms between agents. The developed model was applied to Bayannur City, which suffers from severe water shortages. The water prices for different industries, the water rights transaction price, and the behaviors of various agents in 2020 were forecasted. The results reveal that the water resources optimal allocation model applied in this study can help realize the reasonable allocation of regional water resources under limited water supply. It is also valuable to guide the government in making water resources allocation policies and provide a practical reference for the formulation and adjustment of a water market transaction price.

1. Introduction

With the development of economic and society, more and more water resources has been exploited to meet human being demand through digging wells, constructing reserviors, building water diversion channels for regulating water resources within a river basin or among river basins, and so on. However, rapid population growth, along with increased living requirements, urbanization, and industrial growth, has led to increased demand, competition, and conflicts among different water use sectors. If the demands of all water users are always full satisfied, it will inevitably result in significant low water resource utilization efficiency, even waste of water resources.
Therefore, water demand management [1] has gained increasing attention in recent years. The study on water demand management was initially carried out in Israel. After World War II, Israel published a national water management policy in which cereals with high water consumption are prohibited. Instead, fruits, flowers, vegetables, and cotton planting with low water consumption were encouraged, and users with high output value per unit water had high priority to obtain water resources [2]. In 1990, Canada highlighted that the reasons for replacing traditional management methods with water demand management were the continuously growing costs of exploiting water resources, the severity of water pollution, and increasing attention to water eco-environmental issues, not just water resource shortages [3]. In the International Water and Environment Conference in 1992, researchers coming from over 100 countries were involved in the discussion on the official definition of water demand management [4], and agreements have been reached that reasonable water supply amount should be evaluated and that improvements in water demand management could increase the utilization efficiency of water resources. Moreover, the conference concluded that a well price mechanism for adjusting water demand and supply should be established for targeting a reasonable allocation of scarce water resources. In china, “Three Red Lines”, proposed by the national central government in 2011, clearly gave out control targets of the exploitable volumes of water resources, water resource utilization efficiency, and pollutant discharges into water systems, in order to ensure socio-economic development is adaptable to the carrying capacity of the water eco-environment, and to promote the transformation of the economic development pattern and sustainability of water resources. In 2012, the state council also published relevant rules to strengthen the management of water demand and water use processes [5]. It is obvious that water demand management has become the basic principle under limited water resources situation. Moreover, the price mechanism is one of the most important factors in water demand management.
The essence of the optimal allocation of water resources under the principle of water demand management is to improve the overall efficiency of water using in one region. It includes two key aspects. The first is to improve the water use efficiency of each sector or industry user by adopting strict management system or advanced water saving technology; on the other hand, it is necessary to optimize water allocation among competing water users (including environmental and ecological water users). For the first issue, water pricing has drawn widespread attention as an effective way to optimize water resource allocation [6,7,8,9]. Thomas et al. [10] studied the effect of raising water prices on residents’ water consumption behavior and adopted a two-stage method to estimate the elasticity of domestic water consumption. Ioslovich et al. [11] argued that water resources could be effectively allocated with the support of pricing. An extension model of water resource allocation was proposed based on this idea, suitable for urban, agricultural, and other water uses. A water allocation scheme and its shadow price can be obtained from this model.
For the second issue, one of the reasonable solutions is to establish a water market and carry out water rights trading. There are many studies focusing on the concepts, functions, and rules of water markets and water rights trading. Colby et al. [12] analyzed the features of markets, water rights, and water rights trading, and proposed that the transaction of water rights could help establish a reasonable price for water resources. Schoolmaster [13] believed that the main purpose for establishing a water market was to reallocate water resources for improving utilization efficiency. In China, according to the Water Law, the ownership of water resources belongs to the country, and water rights trading only involves the right to use water resources [14]. Demonstration work on water markets led by the government has been carried out in several regions in China. In the upper reaches of the Yellow River, experimental work on water rights transactions has been carried out in the Inner Mongolia Autonomous Region. The focus of this work was water rights trading among cities, such as the Bayannur and Ordos cities, and the trade volume was determined as 360 million m3. The transferor of this trade was the Hetao irrigation district, while the transferees were industrial water consumers from the Wuhai, Alxa League, and Ordos [15].
The administered system and market-based system are two common model structures of water markets according to the pattern of water rights trading [16]. Debate on the performance of these two systems has lasted for decades and still receives extensive attention in both research and practice. In a market-based system, stakeholders can make independent decisions. Whether to participate in water transaction only depends on their own economic benefits and water market conditions [17,18]. In an administered system, water rights trading is fully planned for achieving the overall optimal benefits [19]. Matthew et al. [20] suggested that water markets do not often function efficiently in practice, because self-interest is the main issue in the water rights trading market. Calatrava et al. [21] showed that centralized water markets lead to more efficient water resources allocation and utilization than that of decentralized markets. The water demand management study case in our research is an entirely government-dominated, administered water rights trading system in the administrative area of the Bayannur City, and not a free water trading market [15].
Some scholars have realized that both market transactions and government policies need to be considered simultaneously for the optimal water allocation under the principle of water demand management [22]. Babel et al. [23] developed water allocation models through incorporating socio-economic, environmental and technical aspects together so that the goal of optimal allocation of water resources has been changed from pursuing a single economic benefit [1] to coordinated multiple goals [24]. Roozbahani et al. [25] developed a multi-objective model in which five water allocation objectives are proposed and three of them address the social factors and others represent the economic and environmental preferences.
In the aspect of model algorithm, the linear programming framework (LP) is preferred by many scholars [26]. Babel et al. [23] introduced a weighting method into the LP model to convert multi-objectives into a single objective function. The limitation of LP algorithm lies in the difficulty to deal with high order equations such as the economic benefits of stakeholders. A multi-agent model based on complex adaptive system theory is an effective way to solve the links between government and water rights traders [27,28,29]. Each agent is motivated by its self-benefit and could decide whether or how to interact with other agents, the overall objective of the system relies on the decisions of every agent in it. Feuillette [30] studied water demand management measures considering the Kairouan water table, the water consumption behavior of Tunisian farmers, and the social impacts of water use, with the help of a multi-agent model. Zhao et al. [16] established a consistent agent-based modeling framework to research water allocation under administered system, market-based system, and their combination. In his model, the water users’ behavior can be quantified and was proven to depend on transaction or administrative costs as well as their autonomy.
Integration of economic efficiency and environmental and social benefits in the administrative region need to be taken into consideration when government plays the main role in water management [31,32]. Under this condition, possible factors such as initial water rights, water prices, water rights trading systems, water savings and multi-objective optimization should be discussed and considered further. However, most previous studies are either based on water rights trading without considering water demand regulation or the response of water agent behavior to governmental regulation or are too complex to be applied to real-world problems. As an extension of the previous studies, the objective of this research is to develop a model for optimal water allocation through incorporating water rights trading and governmental regulation policies (water prices, water savings, and industrial policy) to regulate water demand. Therefore, with data collected from the Bayannur City and a field investigation, a multi-objective optimization model with a multi-agent structure under the complex adaptive system theory was established for the following purposes:
(1)
maximizing comprehensive economic, social, and environmental benefits in the administrative region;
(2)
determining water prices for different industries to satisfying the governmental planning objectives;
(3)
evaluating economic benefits for each industry;
(4)
identifying the influence of macro policies, initial water rights, water prices, and the water rights trading on the government-dominated administered system.

2. Case Study

2.1. Study Area

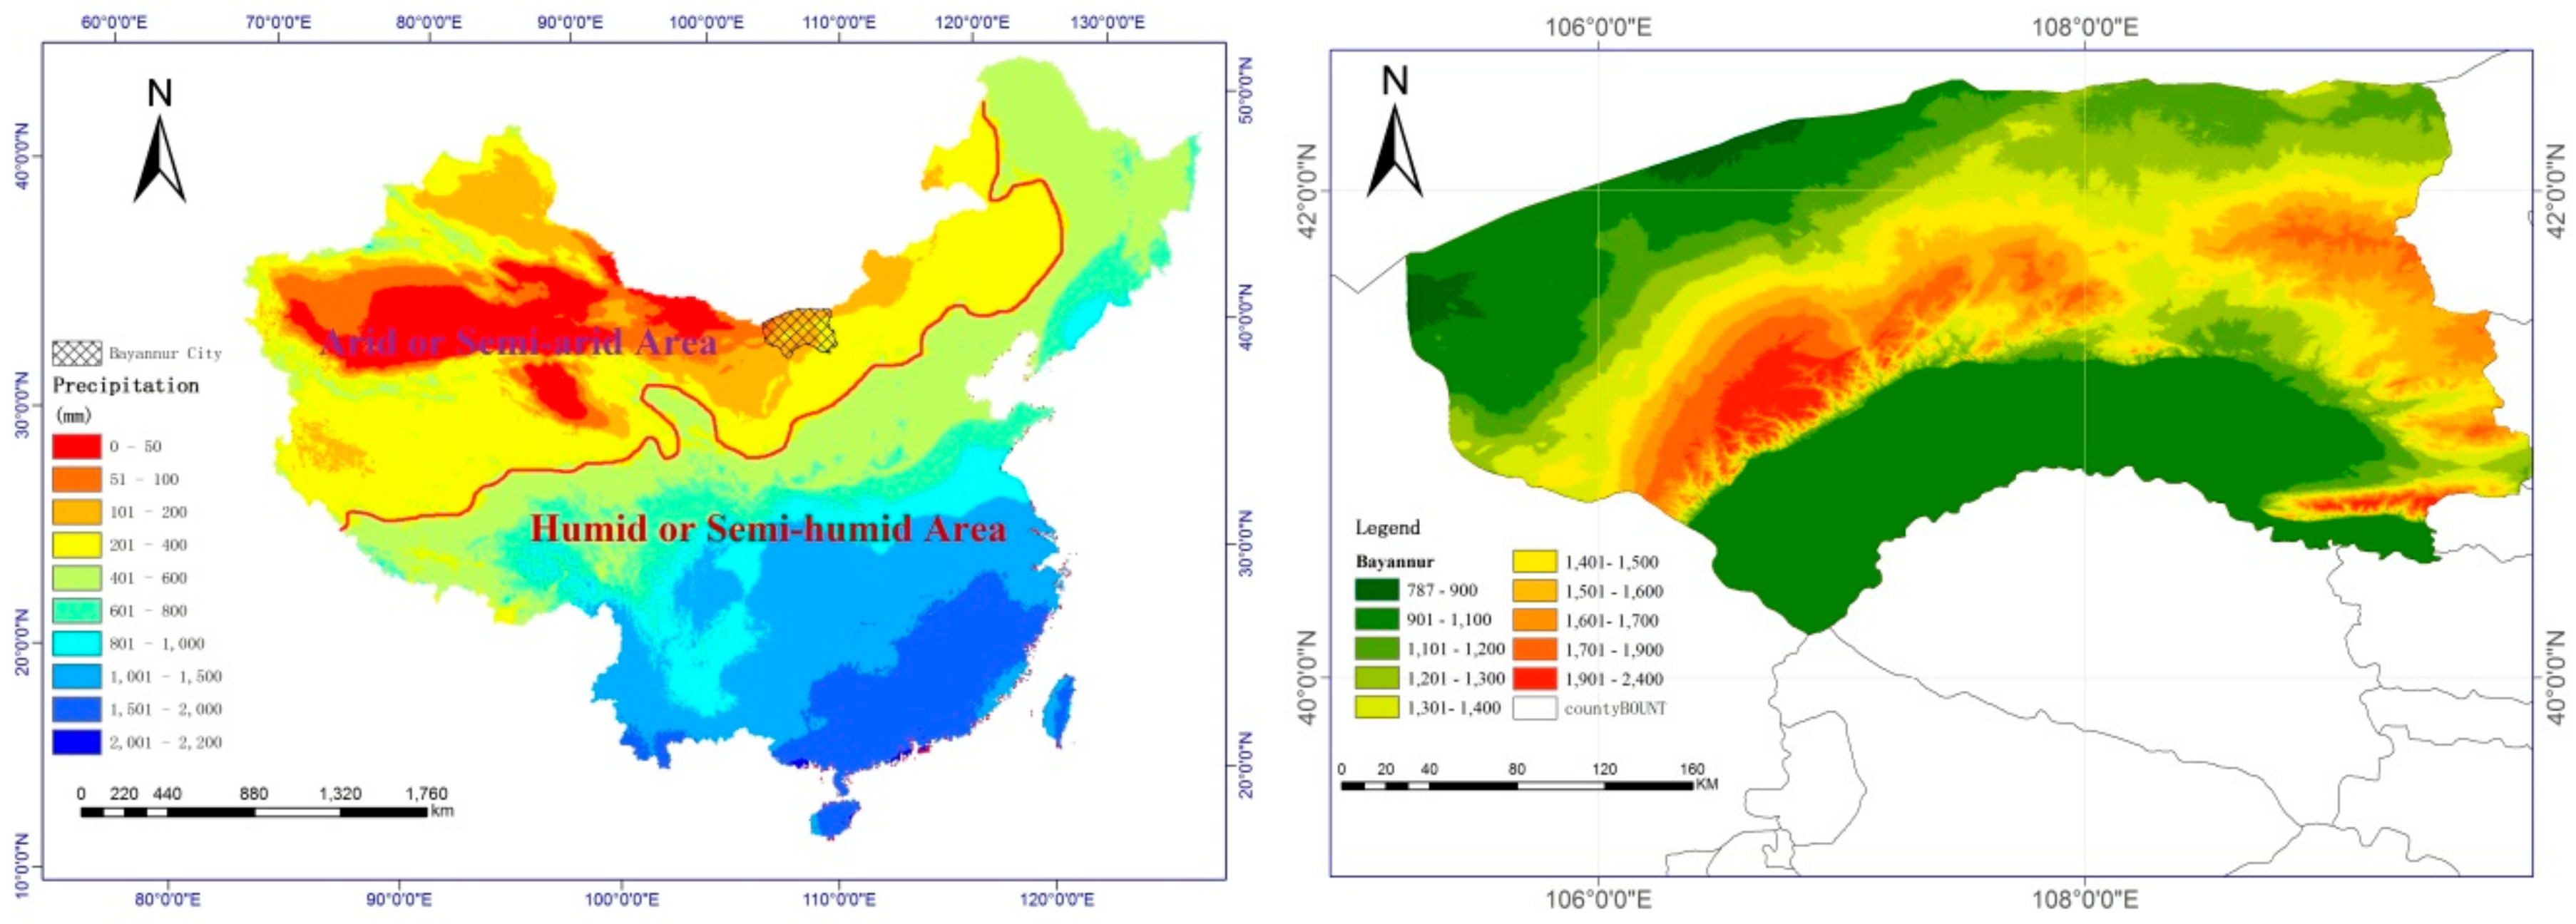
Located in the western Inner Mongolia Autonomous Region (Figure 1), Bayannur covers an area of 65,788 km2, of which 1000 km2 is agricultural acreage. The annual precipitation of Bayannur is 100–300 mm and is uneven in seasonal distribution. The majority of precipitation is concentrated in summer, from June to September, and less rainfall occurs in spring.
In 2010, the total water supply of Bayannur was 4.86 billion m3, with 666 million m3 from groundwater supply and 4.194 billion m3 from surface water supply, including 13 million m3 from water storage and 4.181 billion m3 diverted from other places. The total water consumption of Bayannur in 2010 was 4.86 billion m3, of which 98.08% or 4.77 billion m3 was used for production. Furthermore, the water consumption of primary industry was 4652.4 million m3, constituting 95.72% of total water consumption, while water usage values for secondary industry, tertiary industry, domestic use, and ecological purposes were 106.2 million m3 (2.19%), 8.3 million m3 (0.17%), 41.1 million m3 (0.84%), and 52.4 million m3 (1.08%). Around 22.68 million m3 was consumed by urban residents and was sourced mainly from groundwater. The per capita annual water consumption of the 688,900 urban residents was 32.92 m3, while the figure was 17.14 m3 per person for a total rural population of 1,074,500.
The main problems in the current water utilization in Bayannur are as follows:
(1) Large imbalance between water supply and demand
The initial water right of Bayannur from the Yellow River was 4 billion m3, as specified by the Inner Mongolia Autonomous Region. As water management has been strengthened in recent years, the water diverted from the Yellow River has decreased from 5.2 billion m3 to 4.836 billion m3. However, water supply still cannot meet demand and there is no water use index for newly approved industrial construction projects.
(2) Unreasonable water utilization structure
The main water user is the agricultural irrigation district of Bayannur. According to statistical data from 2010, the proportion of agricultural, industrial, and domestic water consumption was 96.1:2.1:1.8, which reveals a severe imbalance in water consumption for separate purposes.
(3) Low water resource utilization efficiency
The water resource utilization efficiency is very low for agricultural consumption, which can be attributed to significant losses from water conveyance canals and the low irrigation water price. The actual water price for agricultural purposes is 0.04 yuan per m3, which is only 43% of the current water cost (0.094 yuan per m3).
(4) Serious water pollution
With rapid industrial development and urbanization in Bayannur, an increasing amount of domestic and industrial wastewater has been discharged into the river without treatment, resulting in a large increase in point source pollution. Adding to this problem is non-point source pollution caused by unreasonable use of pesticides and fertilizer, and the quality of surface and groundwater is decreasing. The chemical and biological oxygen demand values (COD and BOD, respectively) and quantities of ammonia nitrogen, mercury, total phosphorus, non-ionic ammonia, and chlorides in the main drains of the Hetao agricultural irrigation district exceed the standard annual limits by 50%. The indexes of total phosphorus and total nitrogen in the Wuliangsuhai Lake far exceed the water quality standards.
The data above shows that there is a large imbalance between water supply and water demand in Bayannur, and the growing demand for water resources is far from being satisfied. The Inner Mongolia Autonomous Region is also aware of this issue and has initial water rights distribution under total quantity control. Moreover, water rights transactions between cities and studies on water pricing have also been implemented to alleviate the problem. Therefore, as a case study, Bayannur City is significantly representative for building a water demand management model and exploring an optimal configuration.

2.2. Data Sources

In this study, multi-year parameters (2005–2010) and economic equations for all agents were acquired or calculated based on the data from the Statistical Yearbook, Water Resources Bulletin and the Water Resources Planning Report of Bayannur city, Inner Mongolia Autonomous Region. Detailed socio-economic data such as current water prices, water saving costs and efficiency, purifying capacity of pollutants, and others were acquired during a field investigation in Bayannur City.

3. Modeling the System

3.1. Overview of the Model

The core concept of complex adaptive systems, established by Holland [33], is that adaptive or behavioral agents can interact independently with the environment and other agents. In the process of the continuous interaction, an agent may change its own structure and behavior according to the learning experience, which gradually derives system evolution. Based on the theory of complex adaptive systems, this study proposes a water demand management model for Bayannur, with government and water consumption agents as the two main agent types (as shown in Table 1). The agent model is used to describe the behavior and goal of each individual agent, while the complex adaptive theory is used to describe the information transfer and functional mechanisms between the agents. The government agent represents the water supply side, which aims to seek optimal regional water utilization benefits with a limited supply of water resources. The optimal benefits are divided into three aspects—the largest economic aggregate, the best social benefits, and the total amount of pollutant discharge—which cannot exceed the waste removal capacity of the region. The water consumption agent represents the water demand side, aiming to achieve maximum economic benefits from the utilization of allocated initial water rights, water rights gained through trade, and water saved using water-saving techniques. As the two agent types have completely different goals, there is a game between multiple users, which requires the calculation of the optimal water resource allocation across the entire region. The agents acting in Bayannur City were determined through field investigation. The integral structure of the model is shown in Figure 2.
The specific steps undertaken by the model are as follows: (1) Determine the amount of regional water supply, domestic and ecological water consumption, and the total amount of sewage that the government must treat; (2) Establish the initial water right allocation system and distribute the allocated water to each consumption region; (3) Establish a free water market, where temporary trading of water is allowed; (4) Formulate the right price for various industries within their initial water right scope, and the market price of free water based on current economic development; (5) Introduce a water saving cost–benefit system to demonstrate the water conservation effect; (6) Adopt the complex adaptive system in which the behavior, targets, and connections of every agent are taken into account, and obtain the optimal state of regional water resource allocation; (7) Check the water resource allocation state, water price, and pollutant emissions under the optimization state; and (8) Predict the allocation of water resources for future years.
Comment: A1, A2, B1, B2, B3, B4, B5 and C are references adopted for the water consumption agents.

3.2. Initial Water Rights, Water Prices, and the Water Trading Market

Many studies discuss methods for allocation of initial water rights [34,35], including allocation according to the current situation, introducing analytic hierarchy processes with rulemaking, and others. Therefore, this problem will not be emphasized in detail in this paper.
There are many models for water pricing, such as the shadow price method, marginal opportunity cost model, full cost pricing model, supply and demand pricing model, and sustainable pricing model based on supply and demand balance. However, these strategies require more parameters and complex calculation processing. This paper introduces the simpler ladder pricing model which is adopted by most cities in China.
Rather than free trade in a water rights trading market, water rights transfer is totally controlled by the government in this model. Therefore, it is not the establishment and operation mechanisms, but the water price that should be emphasized in the water rights trading market. The normal operation of a water market is based on a reasonable water price. The water price p h should include the resource price and transaction price. p h can be estimated using the supply and demand price model put forward by James and Lee [36], which provides an initial value for our model.
Q 2 = Q 1 ( p a p b ) E
where Q 2 is the water consumption after adjusting the price, Q 1 is the water consumption before adjusting the price, p a is the original price, p b is the adjusted price, and E is the water price elasticity coefficient.
Assuming that the initial water price for each industry is p 0 i , the current water requirement is Q c i , and the initial water right after allocating is t i Q d (where t i is distributive weight coefficient of the industry and Q d is the total regional distributable water), then according to the supply and demand pricing model, the new price, which is adaptable to the supply and demand for each industry is:
p i = p 0 i log E ( t i Q d Q c i ) p h = max ( p i )
Suppose that the water consumption agent is A i , its initial water right and the basic price is w i , and p 0 . k is the ladder coefficient of the price. Then, the per unit water price when water consumption quantity is w (as shown in Figure 3):
p = { p 0 + k w , w w i p h , w > w i
that is, when the consumption quantity of the users is within the initial water right, the water price grows linearly at a slow rate. However, if the consumption quantity exceeds the initial water right (or some of the initial right is sold by the user), the price is determined by the supply and demand relationship of the water rights market. The water rights of primary, secondary, and tertiary industry can be traded in the water market after allocating the initial water rights to each agent, and the water trading price is p h , which represents the stable water price in the water market.

3.3. Agent-Based Modeling

3.3.1. Service Industry Water Consumption Agent

The main behavior of the service industry is water consumption, and it can be regulated by the government, which sets the water price. Information (such as domestic water and sewage, and water consumption satisfaction) can be collected by this agent according to its own characteristics and provided to the government to achieve greater comprehensive satisfaction.

3.3.2. Production Industry Water Consumption Agent

The primary and secondary industry agents can be inducted as production agents. Some users will have extra water rights because of water savings or a reduction in production scale, while some users must obtain additional water rights to meet their production needs. Thus, there will be water rights trading in the water market. The production agents mainly have four water consumption behaviors: using water, buying water, selling water, and saving water.
(1) Using, buying, and selling water
The behavior objective of production agents is to maximize their economic benefits. The generation and selection of behaviors are determined by the economic agent equations. The equation for production agents can be defined as:
F i ( x i ) = f i ( x i ) p ( x i , w i ) c ( x i , w i ) δ
where x i and w i are the water consumption quantity and the initial water rights of the ith agent, respectively. F i ( x i ) and f i ( x i ) are the total and production profits. p ( x i , w i ) is the water price cost under water consumption quantity x i and initial water right w i . c ( x i , w i ) is the tax expenditure when buying or selling water resources. δ can be 0 or 1: when selling water δ = 0 , and when buying water δ = 1 . This means taxes are paid by the buyers.
Assuming that the agents will sell their extra water rights, or buy them if there is a shortfall, and the price follows the principle of the ladder water price (Figure 3), the water price cost and taxes paid when buying water are:
p ( x i , w i ) + c ( x i , w i ) δ = { 0 x i ( p 0 + k x ) d x p h ( w i x i ) , x i w i 0 w i ( p 0 + k x ) d x + p h ( x i w i ) + c ( x i w i ) , x i w i
By substituting Equation (5) into Equation (4), the water consumption quantity x ^ i under optimal production can be calculated from Equation (6):
x ^ i = arg max { F i ( x i ) = f i ( x i ) p ( x i , w i ) c ( x i , w i ) δ ; x i 0 } f i ( x ^ i ) p ( x ^ i , w i ) c ( x ^ i , w i ) δ = 0
If the optimal water consumption quantity is smaller than the initial water rights allocation x ^ i w i , then the selling quantity of the ith production agent is:
S i = w i x ^ i
If the optimal water consumption is larger than the initial allocation of water rights x ^ i w i , then extra water should be purchased. Thus, the agent behavior under the limited initial water rights allocation system depends entirely on the individual economic agent equation.
(2) Saving water
Under a perfect water rights system, water consumption agents will take water-saving measures and develop water-saving techniques to reduce water costs or obtain additional profit by selling water when their water-saving consciousness is improved by increased water prices. Two aspects—the water-saving effect and the input cost—are considered to measure the influence of water savings on the behavior of water consumption agents.
Suppose that the water saving cost K i of every agent is related to production water consumption quantity Q i . The cost function for water saving is:
K i = k i ( Q i )
where the efficiency coefficient of water saving is a i . Different agents in each industry have a different a i . By substituting the water saving cost, K i , and the coefficient, a i , into the economic agent Equation (4), the formula becomes:
F i ( y i ) = f i ( x i ) p ( y i , w i ) c ( y i , w i ) δ K i y i = ( 1 a i ) x i
It is considered that the water consumption quantity y i = ( 1 a i ) x i after water saving measures will produce the same benefits as the water consumption quantity x i before savings.
There are economic relationships between water saving, selling, and buying, which means that water consumption agents will choose whether to save water based on an economic viewpoint. If the water demand is larger than the initial water right, and the agent’s water-saving coefficient is a i , water resources a i x i will be saved if the water saving strategy is adopted. However, if the water resource shortfall is entirely purchased from the water trading market, the cost a i x i p h must be paid. The production agents will compare these two costs:
a i x i p h K i , saving   water a i x i p h < K i , buying   water
However, even if the water demand is smaller than the initial water right, the benefit ( 1 a i ) x i x i ( p 0 + k x ) d x + a i x i p h will be acquired if the water-saving measures are taken, and a i x i volume of water will be saved. The agent will still compare the benefit and cost to determine whether to adopt the water saving strategy.

3.3.3. The Government Agent

The behavior objective of the government agent is the optimization of regional water resource allocation to achieve the optimization of economic, social, and environmental benefits.
(1) Optimization of economic benefits
The optimization of economic benefit refers to the total economic benefits of all the agents in the corresponding region. The economic agent equation will be calculated for each sector to obtain all the sellers and their selling water volume S i . The total supply of the secondary allocation of the water market (total water stock volume) is:
S = S i
The total water demand quantity of all the users in the water market is N S because the regional water supply quantity is generally smaller than the total water requirement. As a seller’s market, the commodity, water rights, cannot satisfy all the users’ demand. That is, some of the buyers cannot reach the optimal production state determined by the economic agent equation. Thus, a shortage loss function [37] must be defined for the buyers to achieve optimal development of the regional economy under limited water resources.
Considering that all the transactions are fully carried out by the various agents in the region, the gross regional production benefit is:
F ( X ) = F i ( x i ) = f i ( x i ) c S
where c is the tax rate levied by the government when a per unit water resource is traded in the water market, and S is the total transaction volume. The gross regional production benefit F is related to the water consumption quantity x i of each agent. It satisfies:
X ^ = arg max { F ( X ) = f i ( x i ) c S } X = { x 1 , , x i , x n }
Generally, the optimization calculation is achieved by defining the shortage loss function of each agent. The initial water shortage quantity of the jth buyer is:
D j 0 = x ^ j w j
where x ^ j is the optimal water demand quantity of production, calculated by economic agent equation of agent j, and w j is the initial water right. For agent j, assuming only Δ D j water could be purchased from the water market, and the difference is:
D j = D j 0 Δ D j
Under optimal production, the loss caused by the water shortage is:
Z j = L j ( D j )
The conditional equation under the optimal secondary allocation of the water market follows:
f 1 ( X ) = Z = min Z j = min L j ( D j ) s t . Δ D j = S
The theoretical optimal solution of this equation is [37]:
L j ( D j ) D j = L k ( D k ) D k , j , k Δ D j = S
The physical meaning of Equation (18) is that the marginal benefit of each water agent is the same. That is, the water resources will be transferred from the agent with a lower marginal benefit to those whose marginal benefit is larger than the average benefit. This will lead to maximum gross regional production.
(2) Optimization of social benefits
For the allocation of regional water resources, the optimization of social benefits refers to the minimum total water shortage in the corresponding region:
f 2 ( X ) = min Q g = min ( x ˜ i Q d )
where x ˜ i is the optimal water demand of each production agent after water rights trading. Q d is the available allocation water quantity, and Q g is the total water shortage quantity of the region. The social benefit coefficient r is defined as:
r = x ˜ i Q d
The total regional water shortage quantity has a close relationship to the water demand quantity. When the water supply is basically stable, the supply and demand balance of the regional water resource can be achieved through the initial water rights allocation, water pricing, and formulation of the trading system under the water market system. These methods can adjust the optimal water demand quantity x ˜ i of each production agent so that it gradually approaches the regional total water supply quantity (r = 1).
(3) Optimization of environmental benefits
The optimization of environmental benefits ensures that pollution indexes such as COD do not exceed a certain limit whenever possible. It includes two levels: a total pollutant check and pollution minimization. Basically, the discharge of COD is linearly related to water consumption quantity, although generally, the COD concentration of each agent differs as a result of the production system. For the ith water consumption agent, its water consumption quantity is x i , and the total COD in the sewage which is processed by the government treatment plant is T i ( x i ) . Therefore, the principle of optimization of environmental benefits follows:
f 3 ( X ) = { T i ( x i ) T s min T i ( x i )
where T s is the pollutant emission limit.
Aiming at the multi-objective optimization of the above three conditions, the mathematical expression for the optimal allocation of regional water resources is:
F ( X ) = o p t { f 1 ( X ) , f 2 ( X ) , f 3 ( X ) }

3.4. Model Solution

The numerical processing of the proposed model was achieved in MATLAB. Conditions such as water resource-related parameters, economic equations for each agent, pollutant emission formulas, and socio-economic parameters were calculated and substituted into the model. Water prices for each industry and the water price of the water trading market were then adopted as the calculation parameters and F ( X ) was the comprehensive optimization target. Finally, with the help of a genetic algorithm, the optimal results for the multi-objective and multi-degree system were obtained.

4. Optimization of Water Allocation in Bayannur City

Based on the year 2010, water supply and demand in 2020 were forecasted and analyzed to develop a water resources allocation plan with optimum economic, social, and environmental benefits for Bayannur City.

4.1. Forecast of Water Supply

The available water supply refers to surface water, groundwater, and water supply from other sources, where the water supply of surface water includes the volume from the water storage project and Yellow River Diversion Project, as shown in Table 2.
In October 1999, the Inner Mongolia Autonomous Region set the water distributed to Bayannur City from the Yellow River at 4 billion m3, which was reiterated in 2005. With only 42 million m3 of surface water supply currently available, the available surface water supply for Bayannur City in 2020 is 4.042 billion m3.
The groundwater supply totaled 666 million m3 in 2010. The government of Bayannur City plans to introduce a program to promote water resource utilization efficiency and reduce groundwater use year by year. The predicted groundwater supply in 2020 is 580 million m3.
According to the overall goal in Construction Planning of Urban Sewage Treatment and Recycling Facilities in the Inner Mongolia Autonomous Region and Urban Development and Sewage Treatment Planning of Bayannur City, the recycled sewage volume in 2020 is 44 million m3, assuming the average sewage treatment rate is 60%. Simultaneously, the plan proposes to increase the reuse of return water in the main canals and water discharged into lakes to 0.15 and 0.05 billion m3, respectively. Therefore, the predicted total water supply in 2020 is 4.866 billion m3, approximately equivalent to current conditions.

4.2. Forecast of Water Demand

4.2.1. Agricultural Water Demand

The prediction of agricultural water demand must consider four factors, including:
(1)
variation of the irrigation area;
(2)
irrigation regulations;
(3)
crop composition and irrigation norms;
(4)
utilization efficiency of canal water.
The formula to calculate agricultural water demand is as follows:
Q a t = W n t · A t / η t
where Q a t is the gross irrigation quota in planning year t, while W n t , A t , and η t represent the net irrigation quota, irrigation area, and the utilization coefficient of canal water, respectively. In the 13th five-year plan, the Bayannur government proposes raising the utilization coefficient of canal water to 0.45, decrease the gross irrigation quota per mu to 500 m3, and increase the water-saving irrigation area to 5 million mu.

4.2.2. Industrial Water Demand

The formula to predict industrial water demand is as follows:
Q i t = j Q i t j = X t j · I t j / ϕ t j
where Q i t is the total industrial water demand in planning year t and Q i t j is the water demand of industrial department j in planning year t. X t j and I t j represent the industrial development index and the water quota of industrial department j in planning year t, respectively. I t j is the water consumption per unit output value of ten thousand yuan for water-intensive and normal industries and the cooling water consumption per unit of installed capacity for thermal and nuclear plants. ϕ t j is the water utilization coefficient of industrial department j in planning year t.

4.2.3. Water Demand of the Service Industry

Based on the Industrial Water Use Plan of Bayannur City and future economic development trends, the water demand of tertiary industry was forecast based on the water consumption per unit output value. The output value of the service industry will reach 75.6 billion yuan in 2020. In the meantime, with rising public awareness regarding saving water and the introduction of new water-saving techniques, the net water quota will be reduced. In 2020, the water quota for tertiary industry is estimated to be 4 m3 per 10,000 yuan.
There is still a need to forecast eco-environmental and domestic water demand for urban and rural residents, however, these factors are not specifically discussed in this paper. Overall, the total water demand in 2020 is estimated to be 5.052 billion m3, exceeding the total available water supply, as shown in Table 3.

4.3. Initial Water Rights Allocation

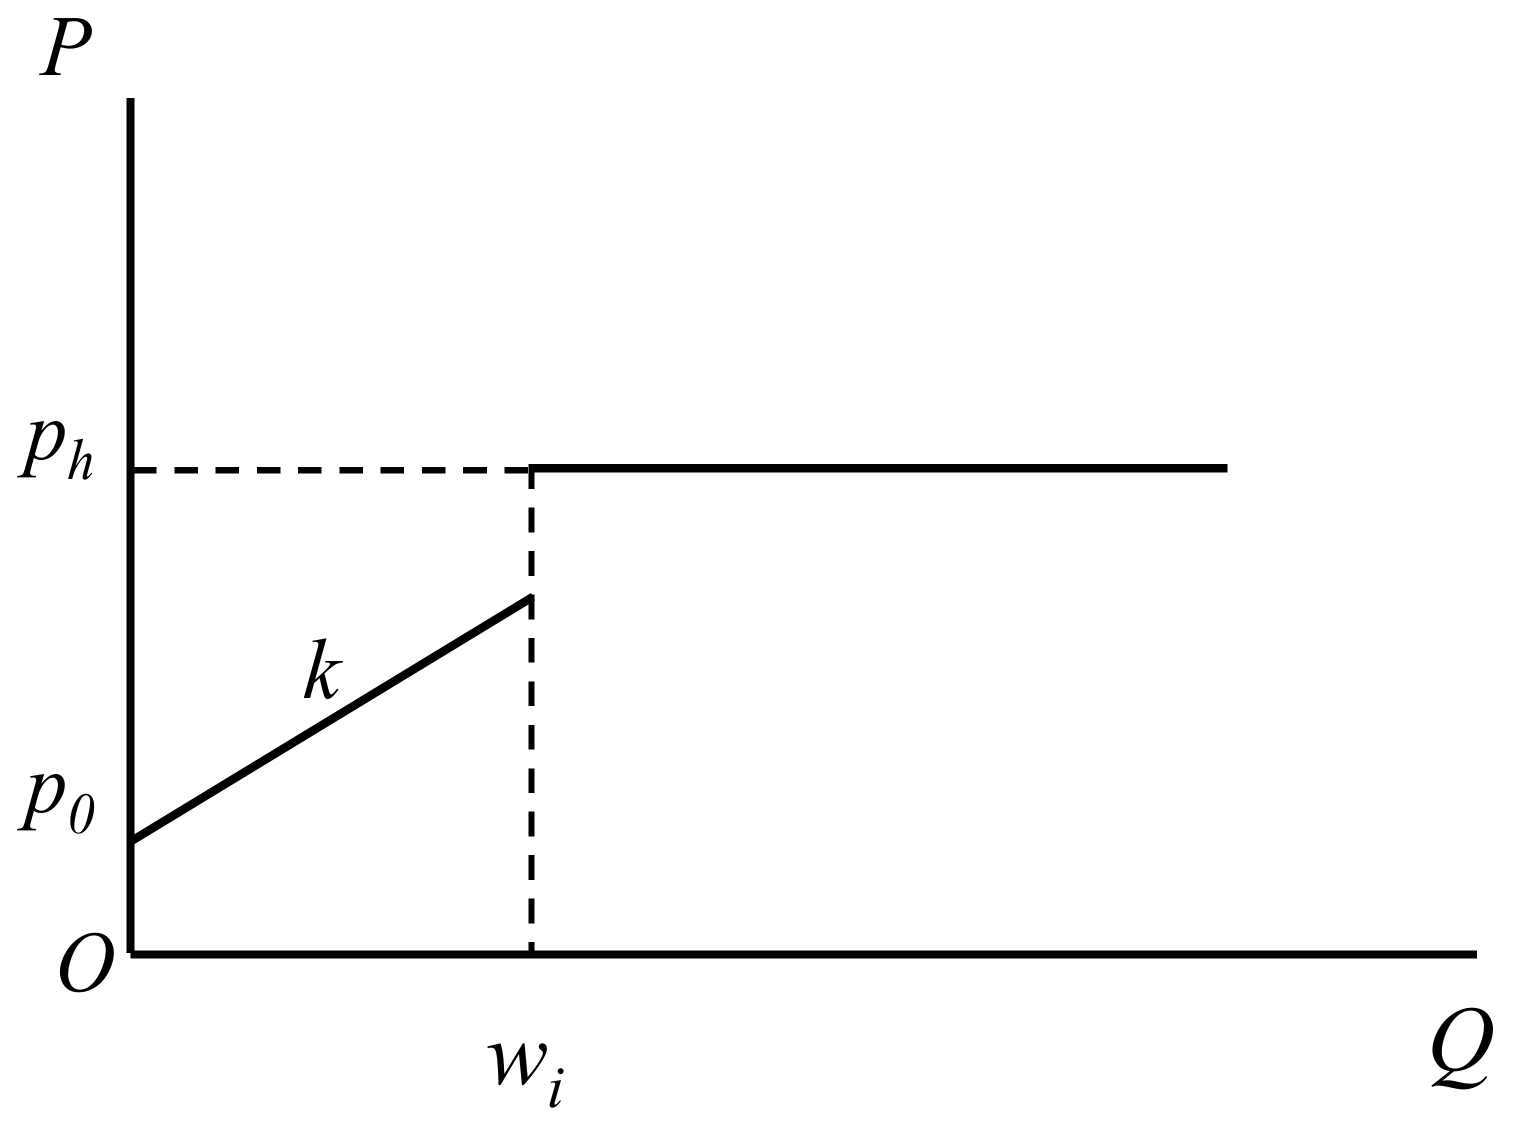
According to the water resource distribution principle, water consumption for domestic, ecological, and tertiary industry purposes should be satisfied first. It needs to be pointed out that these three types of water consumption are still affected by water price increases, and the impact of price increases is still calculated using Equation (1). According to the economic development trend of Bayannur City, it is estimated that the water price will increase to 3.7 yuan/m3 in 2020, which will greatly influence domestic water demand, while the service industry and eco-environmental water demand are less affected by the increase in water price. Therefore, excluding water consumption for these purposes, the remaining assignable water volume is the total amount for primary and secondary industries which can be allocated to water consumers, as shown in Table 4.
Based on the division of agents in Table 1, the analytic hierarchy process was adopted to distribute initial water rights in 2020, the results of which are shown in Table 5. Due to the industrial reform policy published by the Bayannur government to reduce the proportion of primary industry in the economic structure and enlarge the scale of secondary and service industries, the secondary and tertiary industry initial water rights in 2020 are increased compared to 2010, while the initial water right of primary industry is reduced correspondingly.

4.4. Optimal Water Resource Allocation

All the parameters and economic agent equations for each individual agent (obtained by actual data fitting between 2005 and 2010) were substituted into the optimization configuration programs. With the genetic algorithm, the water prices for each industry and the transaction price in the water market were calculated as optimization target parameters. The result of optimal water allocation for Bayannur City in 2020 is shown in Table 6 and Table 7.
One of the key reasons that the social benefits reached the optimum (r = 1) in 2020 was the increase in the water price for all industries. Particularly for primary industry, due to the increase in its water price from 0.04 yuan per m3 in 2010 to 0.071 yuan per m3 in 2020, a huge reduction in agricultural water consumption emerged and excess water was sold into the water market, which allowed the water demand and supply for Bayannur City to balance. In the meantime, the existence of water market transaction regulations enables weak industries, such as paper and chemical industries, to sell redundant initial water rights and turn losses to profits with the transfer benefits. However, this type of economic profit is entirely dependent on water transactions based on policies and planning. Radically, to reverse the economic loss requires the corporation to carry out reform and reinforce its profitability.
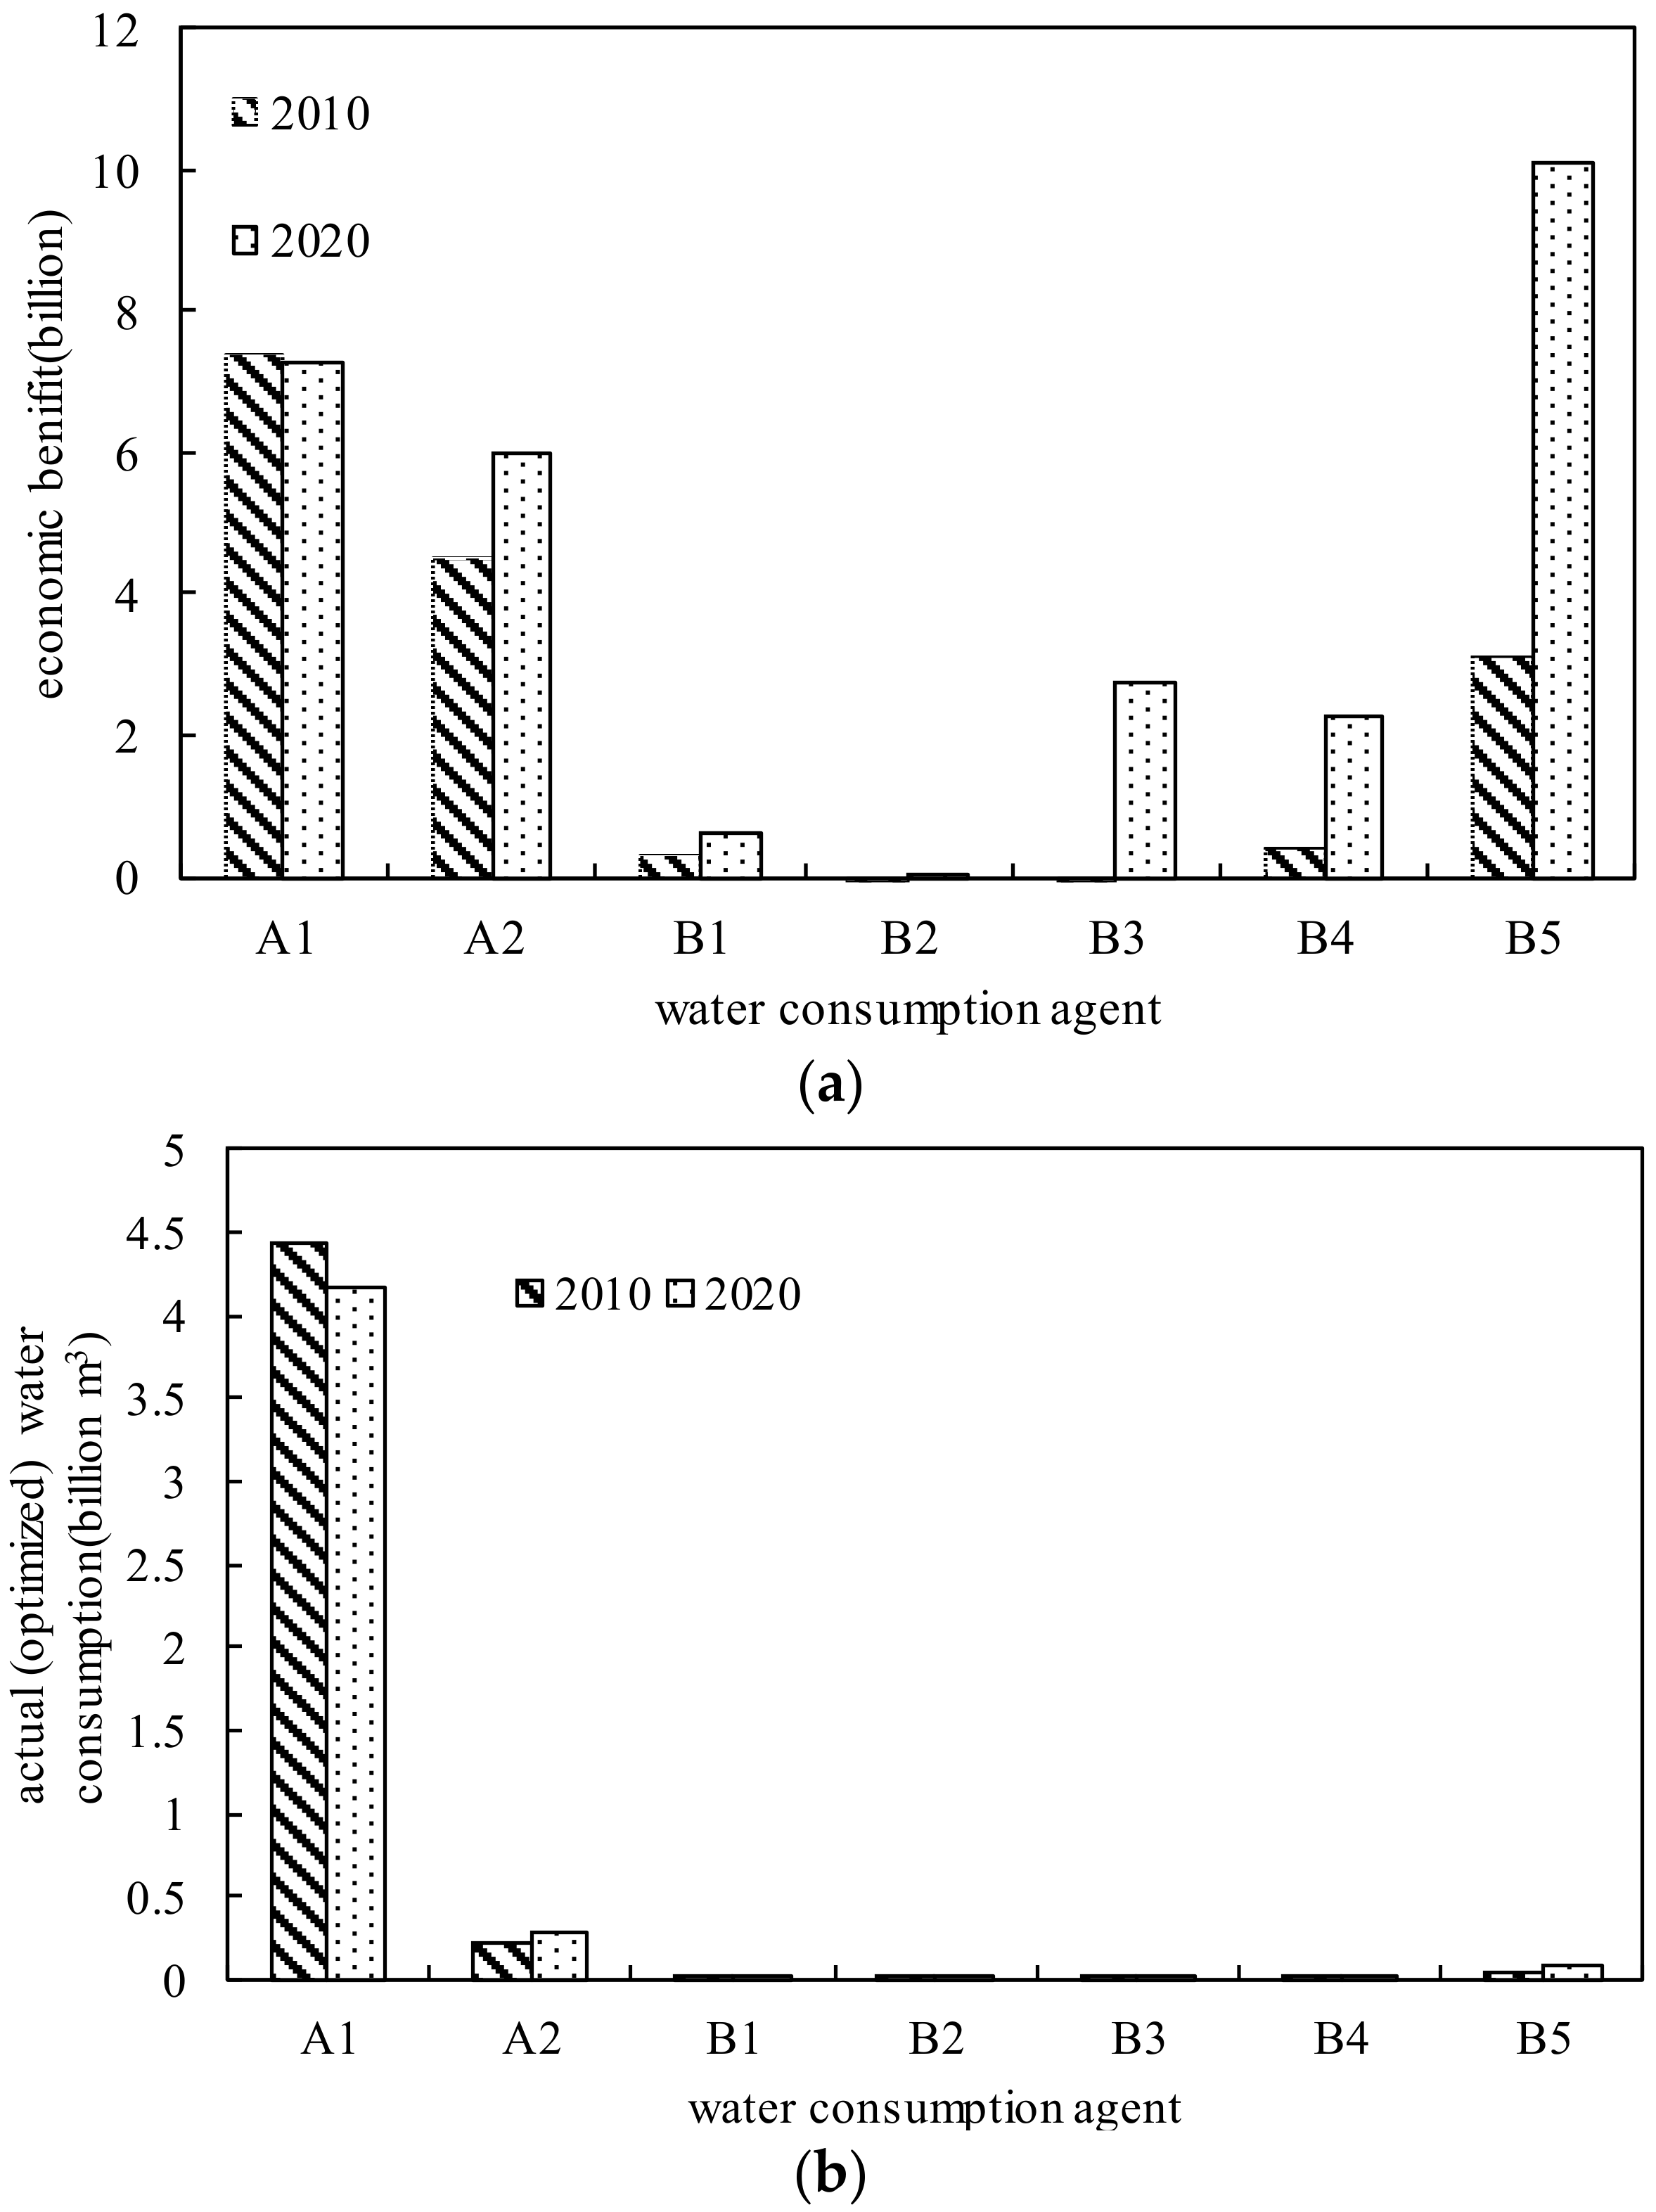
Depicting the water consumption and the actual, optimized profits of each agent in 2010 and 2020, 
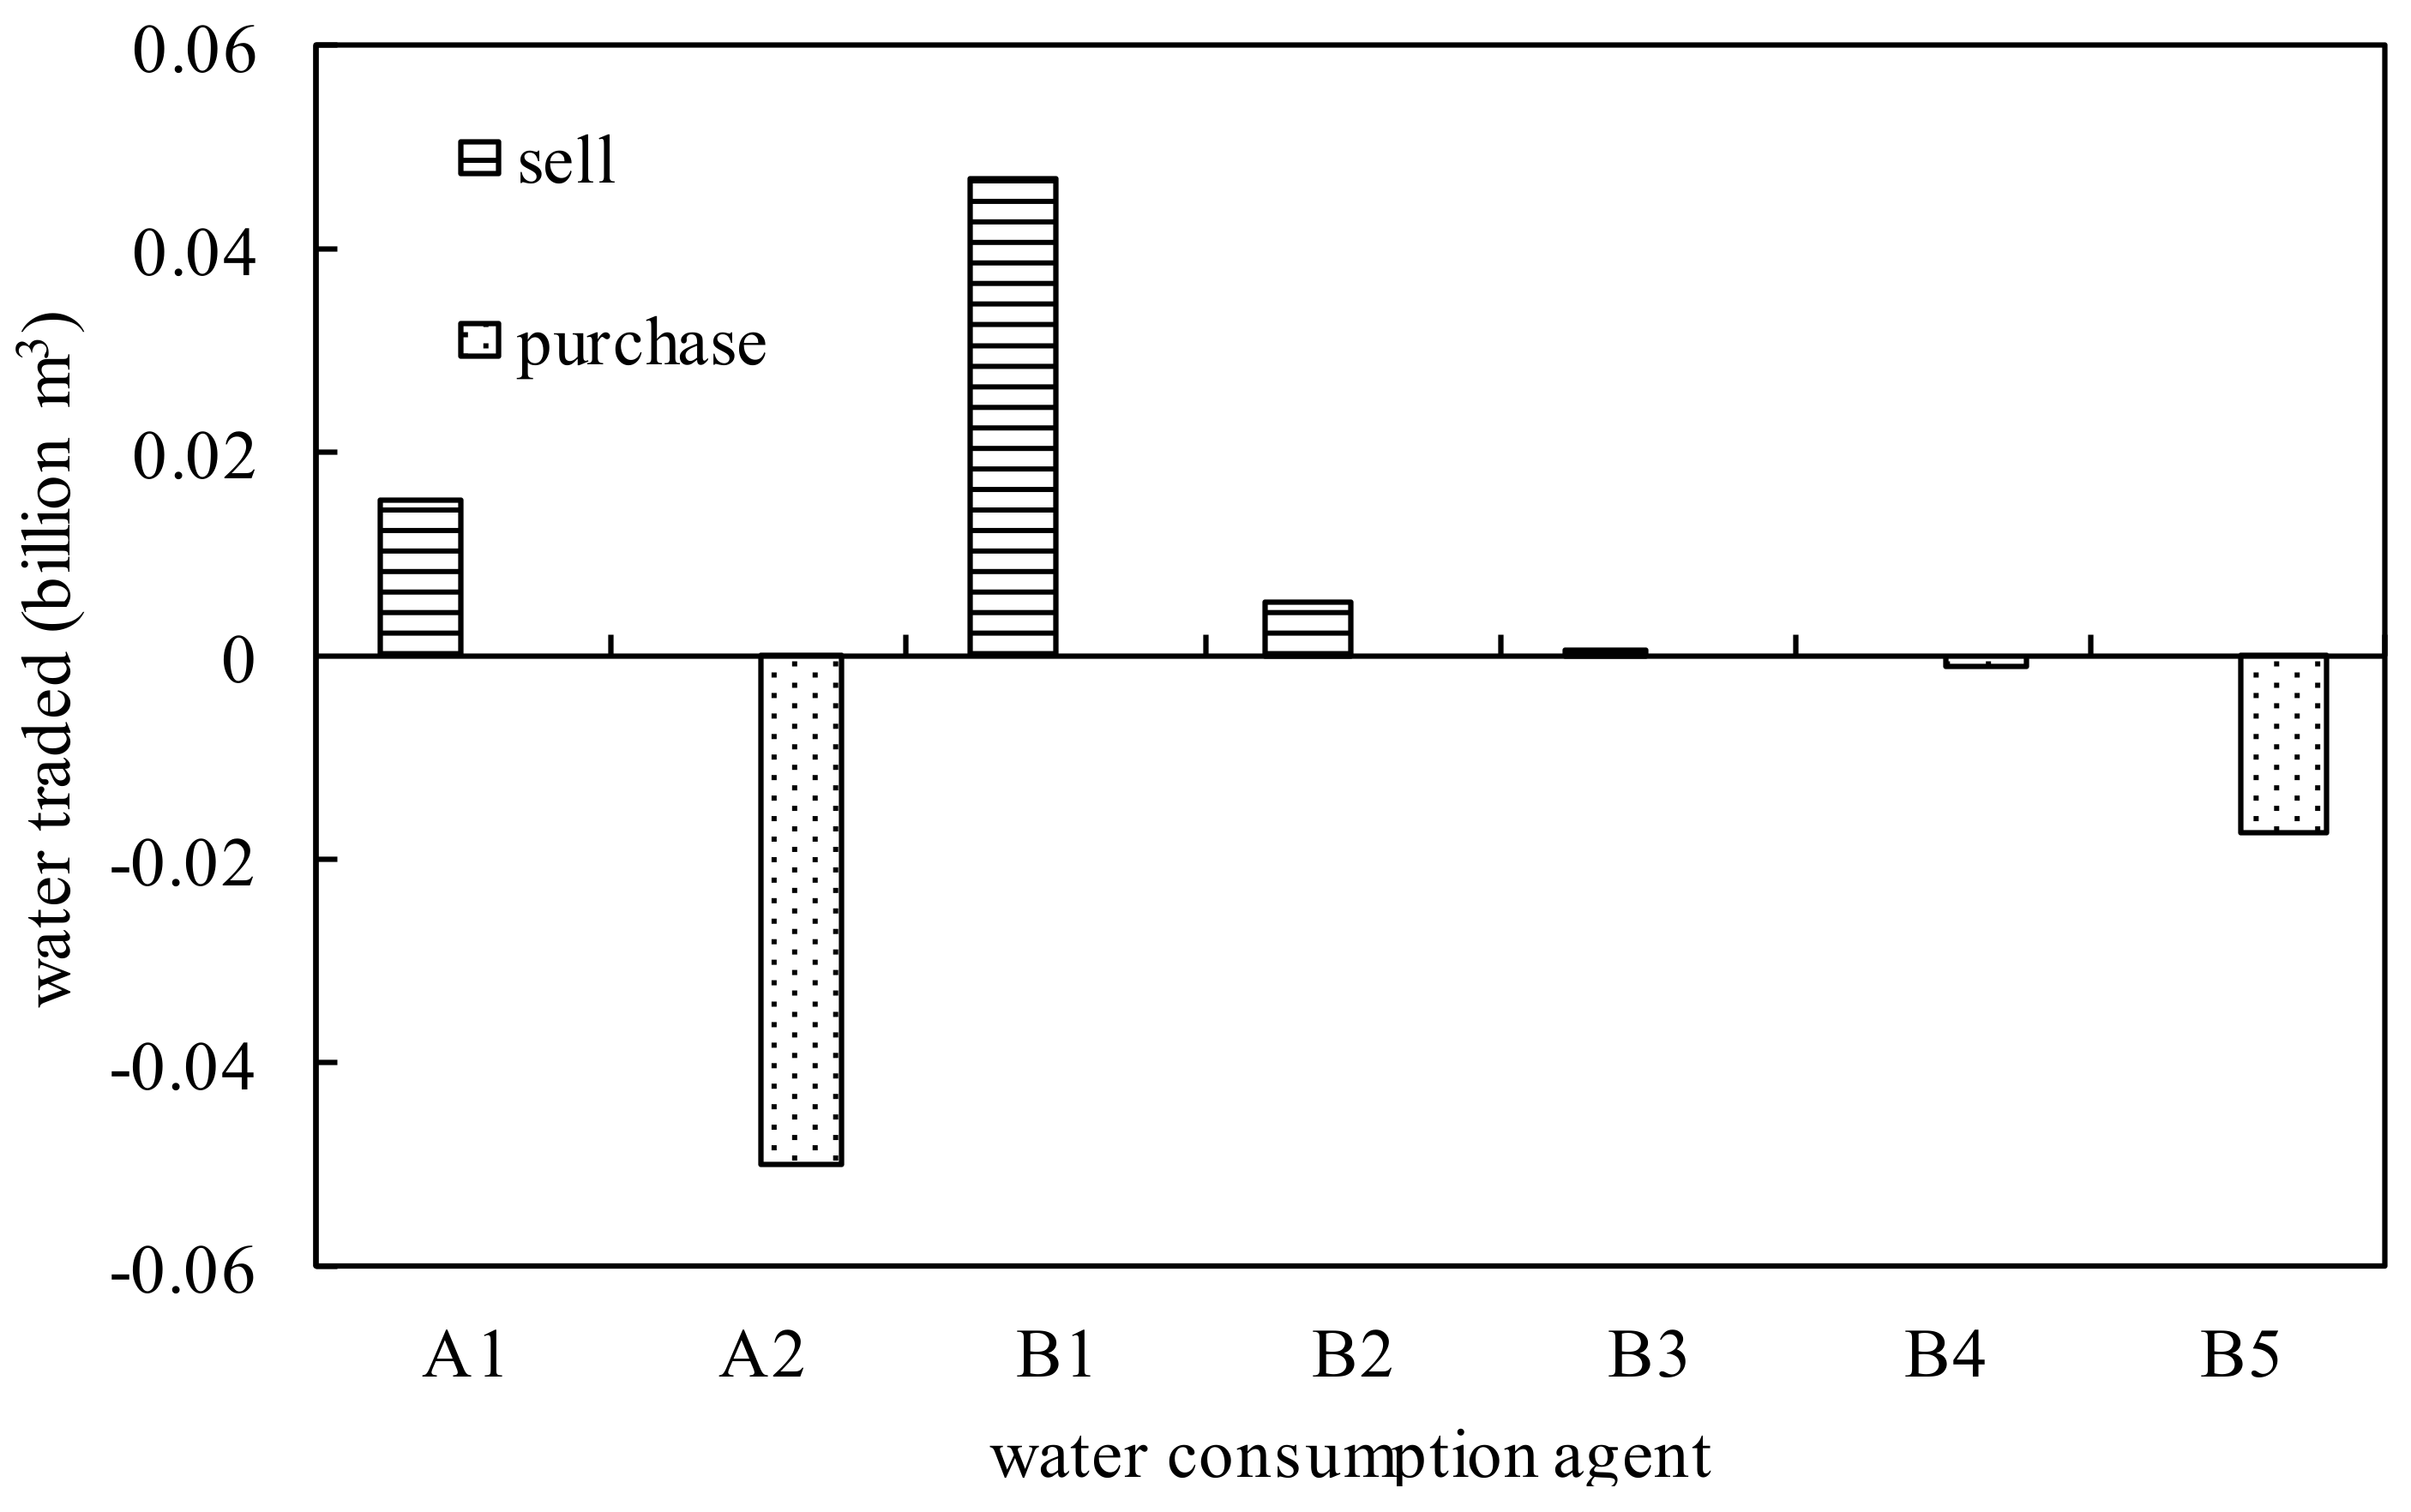
Figure 4 demonstrates that of all primary industries, the planting industry consumes the most water resources, which nevertheless shows no positive correlation with its profits, resulting in huge waste. The water consumption of the planting industry decreases in 2020, which perfectly matches the policies of the Bayannur government. Despite the reduction in water consumption, there is no obvious variation in the profits of the planting industry. The key reason is that the planting industry has redundant initial water rights and any loss caused by the reduction in water use can be reimbursed through water rights transaction in the market. Forestry, animal husbandry, side line occupations and fishery industries, as well as the livestock product processing industry and the mining industry, are the superior industries in Bayannur City, contributing a large proportion of economic profits. From the results of the calculation, these industries enjoy a considerable increase in both water consumption and profits, which brings a significant boost to the overall economy. The directions of flow of the initial water rights in the market in 2020 are shown in Figure 5.
An environmental benefit check was carried out to verify the rationality of water resource allocation in 2020 and showed that the total discharge of domestic and tertiary industrial sewage will be 61 million m3. According to the overall urban planning of Bayannur City, by 2020 the urban sewage treatment rate will reach 90%, and by 2030 the total sewage treatment capacity of its three sewage treatment plants will reach 104 million m3 (285 thousand m3/day). As calculated, the design capacity of the urban sewage treatment plant should reach 67 million m3 according to this plan. Total emissions of industrial sewage will be 78 million m3 in 2020, and all the regional enterprises should meet the discharge standards in the overall plan.

5. Discussion and Conclusions

As the above analysis is based on ideal economic agent equations, it assumes that the behaviors of water consumption agents merely comply with the constraint of achieving maximum economic benefits. However, in reality, agent behaviors are restricted by various objective conditions, which cannot be specifically realized in econometric models. By focusing on the main facets of this complicated problem, this research demonstrates an optimal allocation system for water resources and its outcomes under simplified conditions. There may be errors in specific values, especially for the fitting parameters and the form of the economic agent equations, which can have a huge impact on the results. However, the research is useful for water resource allocation regularity studies, water transaction markets, and as a reference for government to develop policies.
On the other hand, the concept of an administered system in this paper is an optimization system with top-down integral management from the perspective of the government, the central idea of which is that transactions in the water market are rational and transparent, and the trade between various agents is under the unified management of the government instead of the free market economy. In a free water trade market, there is a bidding game between the sellers and buyers, which may cause an unreasonable imbalance in water resource distribution. Probably, the imbalance means greater economic benefits for certain agents, but this is far from the optimal configuration when considering the overall economic benefits of the region. For future research, a bidding mechanism reflecting market economic regularity should be introduced into the model to explore water rights transactions and optimal water resource allocation under a market-based system for a comparison to the results under the administered system.
Based on the theory of complex adaptive systems, this study proposed an optimal multi-agent water resource configuration model and introduced the model into the Bayannur City case study. The results of the optimal water allocation with the optimum comprehensive economic, social, and environmental benefits verify its validity and provide scientific guidance for regional water resource management.

Author Contributions

Y.H. and Y.Z. conceived and designed the model; L.W. and Y.Z. performed the model testing; H.L., F.H., J.Z., Y.Z., Q.W. and S.J. contributed to the data materials; and L.W. wrote the paper.

Acknowledgments

This work was jointly supported by the National Key Research and Development Program of China (Grant No. 2016YFC0401306), the National Natural Science Foundation of China (Grant No. 71503265), and the International Science and Technology Cooperation Program of China (Grant No. 2016YFE0102400).

Conflicts of Interest

The authors declare no conflict of interest.

References

  1. Divakar, L.; Babel, M.S.; Perret, S.R.; Gupta, A.D. Optimal allocation of bulk water supplies to competing use sectors based on economic criterion—An application to the Chao Phraya River Basin, Thailand. J. Hydrol. 2011, 401, 22–35. [Google Scholar] [CrossRef]
  2. Arlosoroff, S. Integrated approach for efficient water use case study: Israel. In Proceedings of the World Food Prize International Symposium, Des Moines, IA, USA, 24–25 October 2002. [Google Scholar]
  3. Tate, D.M. Water Demand Management in Canada: A State of the Art Review; Inland Waters Directorate Water Planning and Management Branch: Ottawa, ON, Canada, 1990. [Google Scholar]
  4. Bai, B. Research on the countermeasures of sustainable use and development for water resource in China. Future Dev. 1997, 10, 10–13. (In Chinese) [Google Scholar]
  5. Chinese State Council. Advice on Applying the Strictest Water Resources Management System (2012, No. 3). 2012. Available online: http://www.gov.cn/zhuanti/2015-06/13/content_2878992.htm (accessed on 15 February 2012). (In Chinese)
  6. Schneider, M.L.; Whitlatch, E.E. User-specific water demand elasticities. J. Water Res. PL-ASCE 1991, 117, 52–73. [Google Scholar] [CrossRef]
  7. Murdock, S.H.; Albrecht, D.E.; Hamm, R.R.; Backman, K. Role of sociodemographic characteristics in projections of water use. J. Water Res. PL-ASCE 1991, 117, 100–112. [Google Scholar] [CrossRef]
  8. Miehael, L. Estimating urban residential water demand: Effective of price structure, conservation, and education. Water Resour. Res. 1992, 28, 609–615. [Google Scholar]
  9. Teerink, J.R.; Nakashima, M. Water Allocation, Rights, and Pricing: Examples from Japan and the United States; World Bank Technical Paper; No. WTP 198; The World Bank: Washington, DC, USA, 1993. [Google Scholar]
  10. Thomas, J.F.; Syme, G.J. Estimating residential price elasticity of demand for water: A contingent valuation approach. Water Resour. Res. 1998, 24, 1847–1857. [Google Scholar] [CrossRef]
  11. Ioslovich, I.; Gutman, P.O. A model for the global optimization of water prices and usage for the case of spatially distributed sources and consumers. Math. Comput. Simul. 2001, 56, 347–356. [Google Scholar] [CrossRef]
  12. Colby, B.G.; Bush, D.B. Water right transactions: Market values and price dispersion. Water Resour. Res. 1993, 29, 1565–1572. [Google Scholar] [CrossRef]
  13. Schoolmaster, F.A. Water marketing and water rights transfers in the lower RIO Grande Valley Texas. Prof. Geogr. 2010, 43, 292–304. [Google Scholar] [CrossRef]
  14. Zhang, R.; Chen, S.; Tong, L. Water rights and the institutional regimes of their allocation and trading in the water market. J. North China Inst. Water Conserv. Hydroelectr. Power 2002, 23, 77–80. (In Chinese) [Google Scholar]
  15. Liu, F.; Duan, Y.; Ma, Y. Case studies of water right trading in some typical regions. J. Econ. Water Resour. 2016, 34, 23–27. (In Chinese) [Google Scholar]
  16. Zhao, J.; Cai, X.; Wang, Z. Comparing administered and market-based water allocation systems through a consistent agent-based modeling framework. J. Environ. Manag. 2013, 123, 120–130. [Google Scholar] [CrossRef] [PubMed]
  17. Huskova, I.; Harou, J.J. An agent model to simulate water markets. Presented at the 6th International Congress on Environmental Modeling and Software (iEMSs), Leipzig, Germany, 1–5 July 2012. [Google Scholar]
  18. Giuliani, M.; Castelletti, A. Assessing the value of cooperation and information exchange in large water resources systems by agent-based optimization. Water Resour. Res. 2013, 49, 3912–3926. [Google Scholar] [CrossRef] [Green Version]
  19. Roozbahani, R.; Abbasi, B.; Schreider, S. Optimal allocation of water to competing stakeholders in a shared watershed. Ann. Oper. Res. 2015, 229, 657–676. [Google Scholar] [CrossRef]
  20. Matthews, O.P. Fundamental questions about water rights and market reallocation. Water Resour. Res. 2004, 40, 474–480. [Google Scholar] [CrossRef]
  21. Calatrava, J.; Garrido, A. Modelling water markets under uncertain water supply. Soc. Sci. Electron. Publ. 2002, 32, 119–142. [Google Scholar] [CrossRef]
  22. Gareth, P.; Joel, R. Water Allocation, Transfers and Conservation: Links between Policy and Hydrology. Int. J. Water Resour. Dev. 2000, 16, 197–208. [Google Scholar]
  23. Babel, M.S.; Gupta, A.D.; Nayak, D.K. A Model for Optimal Allocation of Water to Competing Demands. Water Resour. Manag. 2005, 19, 693–712. [Google Scholar] [CrossRef]
  24. Mckinney, D.C.; Cai, X. Multi-Objective Optimization Model for Water Allocation in the Aral Sea Basin: Stochastic Optimization; Draft Working Paper, Environmental and Water Resources Engineering Program; University of Texas at Austin: Austin, TX, USA, 2002. [Google Scholar]
  25. Roozbahani, R.; Schreider, S.; Abbasi, B. Optimal water allocation through a multi-objective compromise between environmental, social, and economic preferences. Environ. Modell. Softw. 2015, 64, 18–30. [Google Scholar] [CrossRef]
  26. Yu, B.; Tisdell, J.G.; Podger, G.; Salbe, I. A hydrologic and economic model for water trading and reallocation using linear programming techniques. In Proceedings of the MODSIM 2003: International Congress on Modelling and Simulation, Townsville, Australia, 14–17 July 2003. [Google Scholar]
  27. Souza Filho, F.A.; Lall, U.; Porto, R.L.L. Role of price and enforcement in water allocation: Insights from Game Theory. Water Resour. Res. 2008, 44, W12420. [Google Scholar] [CrossRef]
  28. Yang, Y.C.E.; Cai, X.; Stipanovic, D.M. A decentralized optimization algorithm for multiagent system-based watershed management. Water Resour. Res. 2009, 45, W08430. [Google Scholar] [CrossRef]
  29. Bithell, M.; Brasington, J. Coupling agent-based models of subsistence farming with individual-based forest models and dynamic models of water distribution. Environ. Model. Softw. 2009, 24, 173–190. [Google Scholar] [CrossRef]
  30. Feuillette, S.; Bousquet, F.; Le Goulven, P. SINUSE: A multi-agent model to negotiate water demand management on a free access water table. Environ. Model. Softw. 2003, 18, 413–427. [Google Scholar] [CrossRef]
  31. Su, L.; Liu, J.; Christensen, P. Comparative Study of Water Resource Management Policies between China and Denmark. Procedia Environ. Sci. 2010, 2, 1775–1798. [Google Scholar] [CrossRef]
  32. Richard, A.; Wildman, J.; Noelani, A.F. Management of water shortage in the Colorado river basin: Evaluating current policy and the viability of interstate water trading. J. Am. Water Resour. Assoc. 2012, 48, 411–422. [Google Scholar]
  33. Holland, J.H. Emergence: From Chaos to Order; Addison-Wesley Publishing Company, Inc.: New York, NY, USA, 1998. [Google Scholar]
  34. Kelman, J.; Kelman, R. Water allocation for economic production in a semi-arid region. Int. J. Water Resour. Dev. 2002, 18, 391–407. [Google Scholar] [CrossRef]
  35. Wang, L.; Fang, L.; Hipel, K.W. Cooperative water resources allocation based on equitable water rights. In Proceedings of the IEEE International Conference on Systems, Man and Cybernetics, Washington, DC, USA, 8 October 2003; Volume 5, pp. 4425–4430. [Google Scholar]
  36. Jia, C.; Gu, P.; Lu, D.; Liu, X.; Wang, N.; Zhang, Y. Promoting Sustainable Utilization of Water Resources with Reasonable Water Pricing. J. China Univ. Geosci. 2005, 5, 55–58. (In Chinese) [Google Scholar]
  37. Lund, J.R.; Reed, R.U. Drought water rationing and transferable rations. J. Water Res. PL-ASCE 1995, 121, 429–437. [Google Scholar] [CrossRef]
Figure 1. Location of the study area.
Water 10 00863 g001
Figure 2. The overall framework for the optimal water resource allocation model.
Water 10 00863 g002
Figure 3. Water price ladder model.
Water 10 00863 g003
Figure 4. The relationship between water consumption and profits of various agents of primary and secondary industry: (a) the economic benefits of various agents; (b) the actual (optimized) water consumption of various agents.
Water 10 00863 g004
Figure 5. Initial water right trades by various agents in the water market in 2020.
Water 10 00863 g005
Table 1. Summary of the main agents in Bayannur City.
Water SupplyGovernment Agent
Water consumptionPrimary industryPlanting industryA1
Forestry, animal husbandry, side line occupations and fisheryA2
Secondary industryElectric power industryB1
Paper industryB2
Chemical industryB3
Livestock product processing industryB4
Mining industryB5
Tertiary industryServiceC
Table 2. The available water supply of Bayannur City in 2010 and 2020 (predicted).
YearSurface Water SupplyUnderground Water SupplyReuse Volume of SewageOtherTotal
201040.946.660.370.6348.60
202040.425.80.44248.66
(Unit: 100 million m3).
Table 3. Water demand prediction for Bayannur City in 2020.
YearDomestic DemandProduction DemandEco-Environmental DemandTotal
AgricultureIndustryService
20208255407,990.266,241302419,686.37505,196.55
(Unit: 10,000 m3).
Table 4. Assignable water volume for Bayannur City in 2020.
YearTotal Water SupplyEco-Environmental Water DemandDomestic Water DemandService Industry Water DemandAssignable Water Volume
202048.661.930.630.345.80
(Unit: 100 million m3).
Table 5. Initial water rights distribution for Bayannur City in 2020.
YearTotal Assignable Water VolumeInitial Water Rights
Planting IndustryForestry, Animal Husbandry, and FisheryElectric Power IndustryPaper IndustryChemical IndustryLivestock Product Processing IndustryMining Industry
202045.8041.932.360.540.0560.170.160.58
Ratio0.920.0520.0120.00120.00370.00350.013
(Unit: 100 million m3).
Table 6. Water consumption and benefits in 2010 and 2020.
YearWater Consumption/BenefitsPlanting IndustryForestry, Animal Husbandry and FisheryElectric Power IndustryPaper IndustryChemical IndustryLivestock Product Processing IndustryMining IndustryTotal
2010Actual water consumption442,60022,600692467115010943165471,768
Actual benefits74.0245.032.84−0.63−0.423.931.41156.16
2020Initial water rights
(10,000 m3)
419,334.723,584.135410.92562.21688.621586.125837.34458,004
Optimized water consumption
(10,000 m3)
417,745.428,533.65732.8191.61648.811694.627557.07458,004
Optimized benefits
(0.1 billion yuan)
72.7459.936.110.2527.2722.7101.07290.07
Table 7. Water prices in 2010 and 2020 (Unit: yuan/m3).
Water PriceFirst IndustrySecondary IndustryTertiary IndustryDomestic UseWater MarketTax RateSocial Benefits
2010p1 = 0.04p2 = 3.2p3 = 3.75p4 = 2.4
2020p1 = 0.071p2 = 3.2, k2 = 0.1p3 = 4.3, k3 = 0.12p4 = 3.7, k4 = 0.1ph = 5.8c = 0.06r = 1

