Cost-Optimal Flexibilization of Drinking Water Pumping and Treatment Plants

1
Fraunhofer Institute for Energy Economy and Energy System Technology (IEE), 34119 Kassel, Germany
2
German Aerospace Center (DLR), 51147 Cologne, Germany
3
Department of Electrical Engineering and Computer Science, University of Kassel, 34125 Kassel, Germany
*
Author to whom correspondence should be addressed.
Water 2018, 10(7), 857; https://doi.org/10.3390/w10070857
Submission received: 28 March 2018
/
Revised: 20 June 2018
/
Accepted: 21 June 2018
/
Published: 28 June 2018
(This article belongs to the Special Issue Energy Efficient Management of Water Collection, Treatment, Storage and Distribution)
Abstract
:This paper examines potential cost savings attained through the flexible operation of water treatment plants and drinking water pumping and the benefits gained by investing in extended water storage capacities that enhance flexibility. An existing plant in South Germany serves as an example. Mixed-integer linear programming is used to model the plant and the electricity procurement on the German spot market while ensuring the security of supply. Cost optimization considering the different cost components reveals potential cost savings through flexible operation. The paper evaluates the benefits of building additional water reservoirs and rates the financial effects of the measures used to enhance the flexibility of water pumping and treatment plants.
1. Introduction
The increasing share of electricity generated from fluctuating renewable sources has begun to change the way in which the European electricity system operates. In 2015, 30% of Germany’s total energy generation was created by renewable sources. Although generation followed demand in the past, the gap between electrical energy supply and demand is likely to widen in the future due to weather-dependent renewable electricity production. To bridge this imbalance in the electricity system, load management is a key measure for the successful integration of a high proportion of renewable energy into the grid. A considerable advantage of demand side management is that it prevents regenerative generators being curtailed because the electricity grid is oversaturated [1]. The electricity prices traded on the European Power Exchange (EPEX) day-ahead spot market are mainly related to the residual load today [2], but situations are more frequently occurring where electricity generated from wind and/or photovoltaics (PV) dominated the market, leading to very low or even negative price which is a market signal indicating higher supply than demand. The strong fluctuations in feed-in and prices provide incentives for consumers’ loads to implement demand side management (DSM) while simultaneously realizing cost savings in electricity procurement. Although load management is common amongst the largest industrial consumers, the potential for savings in large- to medium-sized loads is often untapped. However, the flexible operation of these loads also leads to a significant reduction in electricity procurement costs. Numerous studies have focused on industrial and residential load shifting [1,3,4,5], as well as cost advantages for consumers through optimized load commitment considering both fluctuating market prices or time-of-use tariffs [6,7,8,9]. However, research on industrial DSM has mainly focused mainly on energy-intensive production industries, such as steel, cement, and chemical processes [10]. Supra-regional drinking water suppliers operate large pumping and treatment plants as well as distribution networks. Although their electricity demand may not be comparable to that of production industries, they are equipped with extensive water reservoirs and thus have considerable load shifting potential. Despite the large DSM potential in this sector, few studies have analyzed how to perform load management be pursued in this field [11,12,13,14]. Most of the research focused on improving the energy efficiency in water supply systems [15,16,17]. As such, this paper examines the potential cost savings achieved through the flexible operation of water pumping and treatment plants as well as benefits gained by investing in extended storage capacity to enhance flexibility.
We present a case study within the enWasser—Investigation of a Demand Side Management Potential in the Water Supply Industry for the Integration of Renewable Energies project [18] that evaluates the potential cost savings gained through the flexible operation and extension of water storage capacities, based on the Zweckverband Bodensee-Wasserversorgung (BWV, also referred to as “the operator”) example.
2. Case Study
2.1. Water Pumping and Treatment System
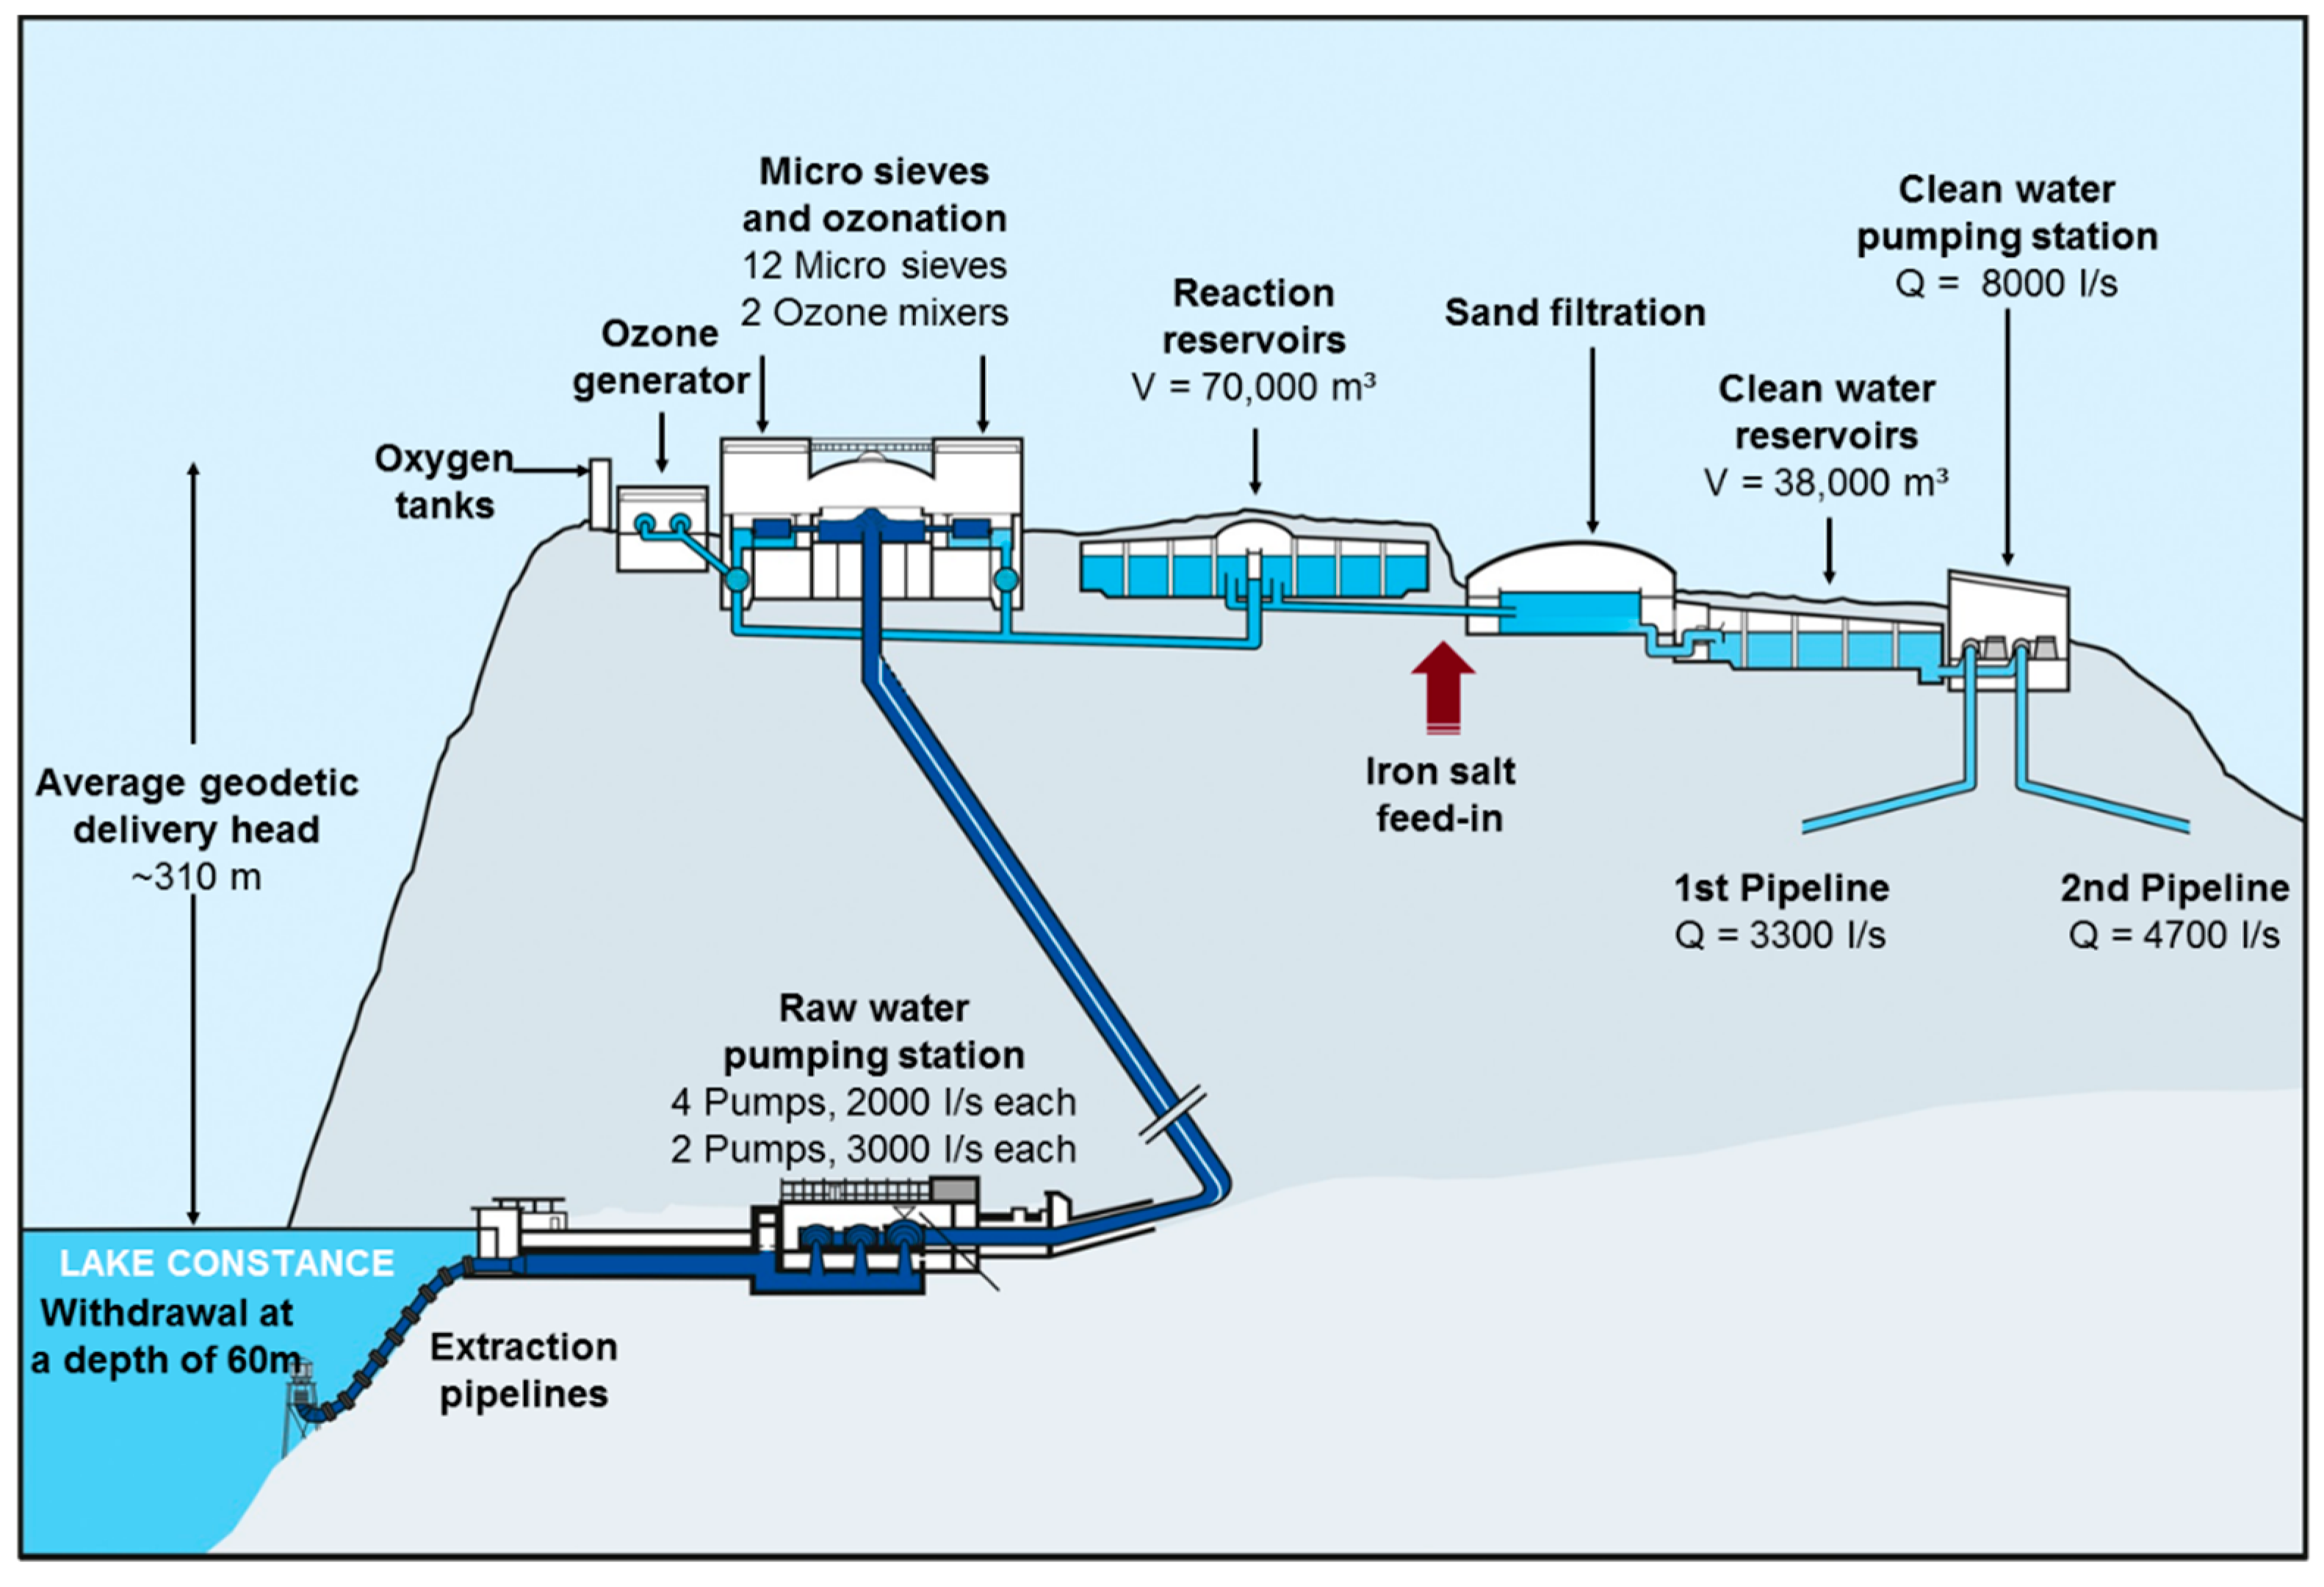
BWV is located at Lake Constance in Southwestern Germany, providing approximately four million people with approximately 125 million cubic meters of drinking water annually. The layout of the BWV water pumping and treatment system is shown in Figure 1.
Six centrifugal raw water pumps with two power levels with a maximum capacity of 35 MW lift the water through two pressure pipes more than 300 m from Lake Constance to the top of a nearby hill, where it enters the treatment plant. Due to the geographical conditions, the BWV system creates pressure build-up directly at the point of withdrawal of the raw water instead of through water towers near the customers (i.e., local water suppliers). Consequently, gravity ensures the subsequent distribution of clean drinking water to consumers. For this reason, the majority of the required system energy is used by the pumps for the positional energy of the water. These local conditions, a flat plateau on the mentioned hill, allow the entire treatment and storage processes of the drinking water to occur without the loss of positional energy to provide the required supply pressure with minimal additional pumping effort. During the treatment stage, the raw water is first fed into a micro-screening process to remove turbidity. Subsequent treatment with ozone enables sterilizes and oxidizes the undesirable dissolved water constituents. Three ozoners with a maximum output of about one MW are available for this purpose. Intermediate storage follows micro sieving and ozonation to ensure the complete reaction of the ozone. After a sand filtration stage that separates any suspended matter that may be present, clean water can be stored before it is transported away from a clean water pumping station (max. 7.8 MW) to the distribution network. Two pipelines 1700 km long spread over Southwest Germany leave the water plant and supply the distribution network. This region has two additional water reservoirs in the first network section under consideration, herein referred to as “the grid storage”. Local water suppliers subsequently serve the end consumers. The plant’s major electricity consumers are the raw water pumps, followed by the clean water pumps. Together with the ozonation and a minor base consumption, the maximum consumable power of the system is 36 MW, due to limited pump operation.
The existing reaction reservoirs have a capacity of 70,000 m³ and the clean water reservoirs provide a further 38,000 m³. To ensure adequate supply at any given time, the operator must maintain a stored water reserve, the capacity of which depends on the water demand. The flexible manageable capacity of the grid storage has not yet been determined in detail.
2.2. Electricity Procurement
At the beginning of the enWasser project, the BWV electricity procurement was independent of the spot market. The operation of the pumping and treatment plants followed fixed base and peak price contracts, known as “inflexible operation”. In “flexible operation” of plants, the plant is operated to optimize costs, meaning electricity is preferably consumed when spot market prices are low. The actual electricity costs include spot market prices, a grid usage charge, plus taxes and levies, including the EEG surcharge according to the German Renewable Energy Sources Act (EEG) [19]. The EEG laws encourage the generation of renewable electricity based on a financial support scheme. The costs are derived from an EEG surcharge paid by electricity consumers. Similar incentive schemes promoting the installation of renewable energy generators exist in 70 countries and 28 provinces, found mainly in developing countries [20].
We first assess the flexible operation of the plant, examining the procurement of electricity on the spot market that provides cost savings without the need for investing in storage capacity.
“Atypical grid usage” is a special regulation regarding grid usage charges, in which a large consumer’s grid usage fee is proportionally determined by the maximum load during predefined peak load times, provided that the first is higher than 20% of the overall annual maximum load of the plant [21]. At the beginning of the project, the plant’s maximum load was 19.7 MW at peak load times. BWV has reduced this value over the course of the project, which is why, during the second step of our investigation, we determine the costs and cost savings for a maximum load of 17.2 MW during peak load hours. All following analyses use this scenario as the reference. Table 1 provides an overview of the described scenarios using historical input values from 2014.
2.3. Options for Storage Extension
A comprehensive study of the possibilities of extending the existing storage capacity by building new reservoirs revealed a number of favorable options [2,22]. Increased storage capacity allows for the more flexible operation of the pumping station and treatment plant. In terms of the flexible operation of an existing plant, this paper discusses the impact and benefits of: (1) flexible operation of the existing plant with simultaneous integration of the existing grid storage, (2) extension of the reaction reservoirs, and (3) construction of a new raw water reservoir.
Since the available grid storage capacity for flexible management is unknown, an available capacity of 70,000 m³ was assumed, based on the first two elevated tanks in the network. Due to construction and spatial restrictions, the realizable additional capacity of the reaction reservoir was limited to about 80,000 m³, amounting to a total capacity of roughly 150,000 m³. The maximum total capacity of a newly built raw water reservoir would be about 300,000 m³.
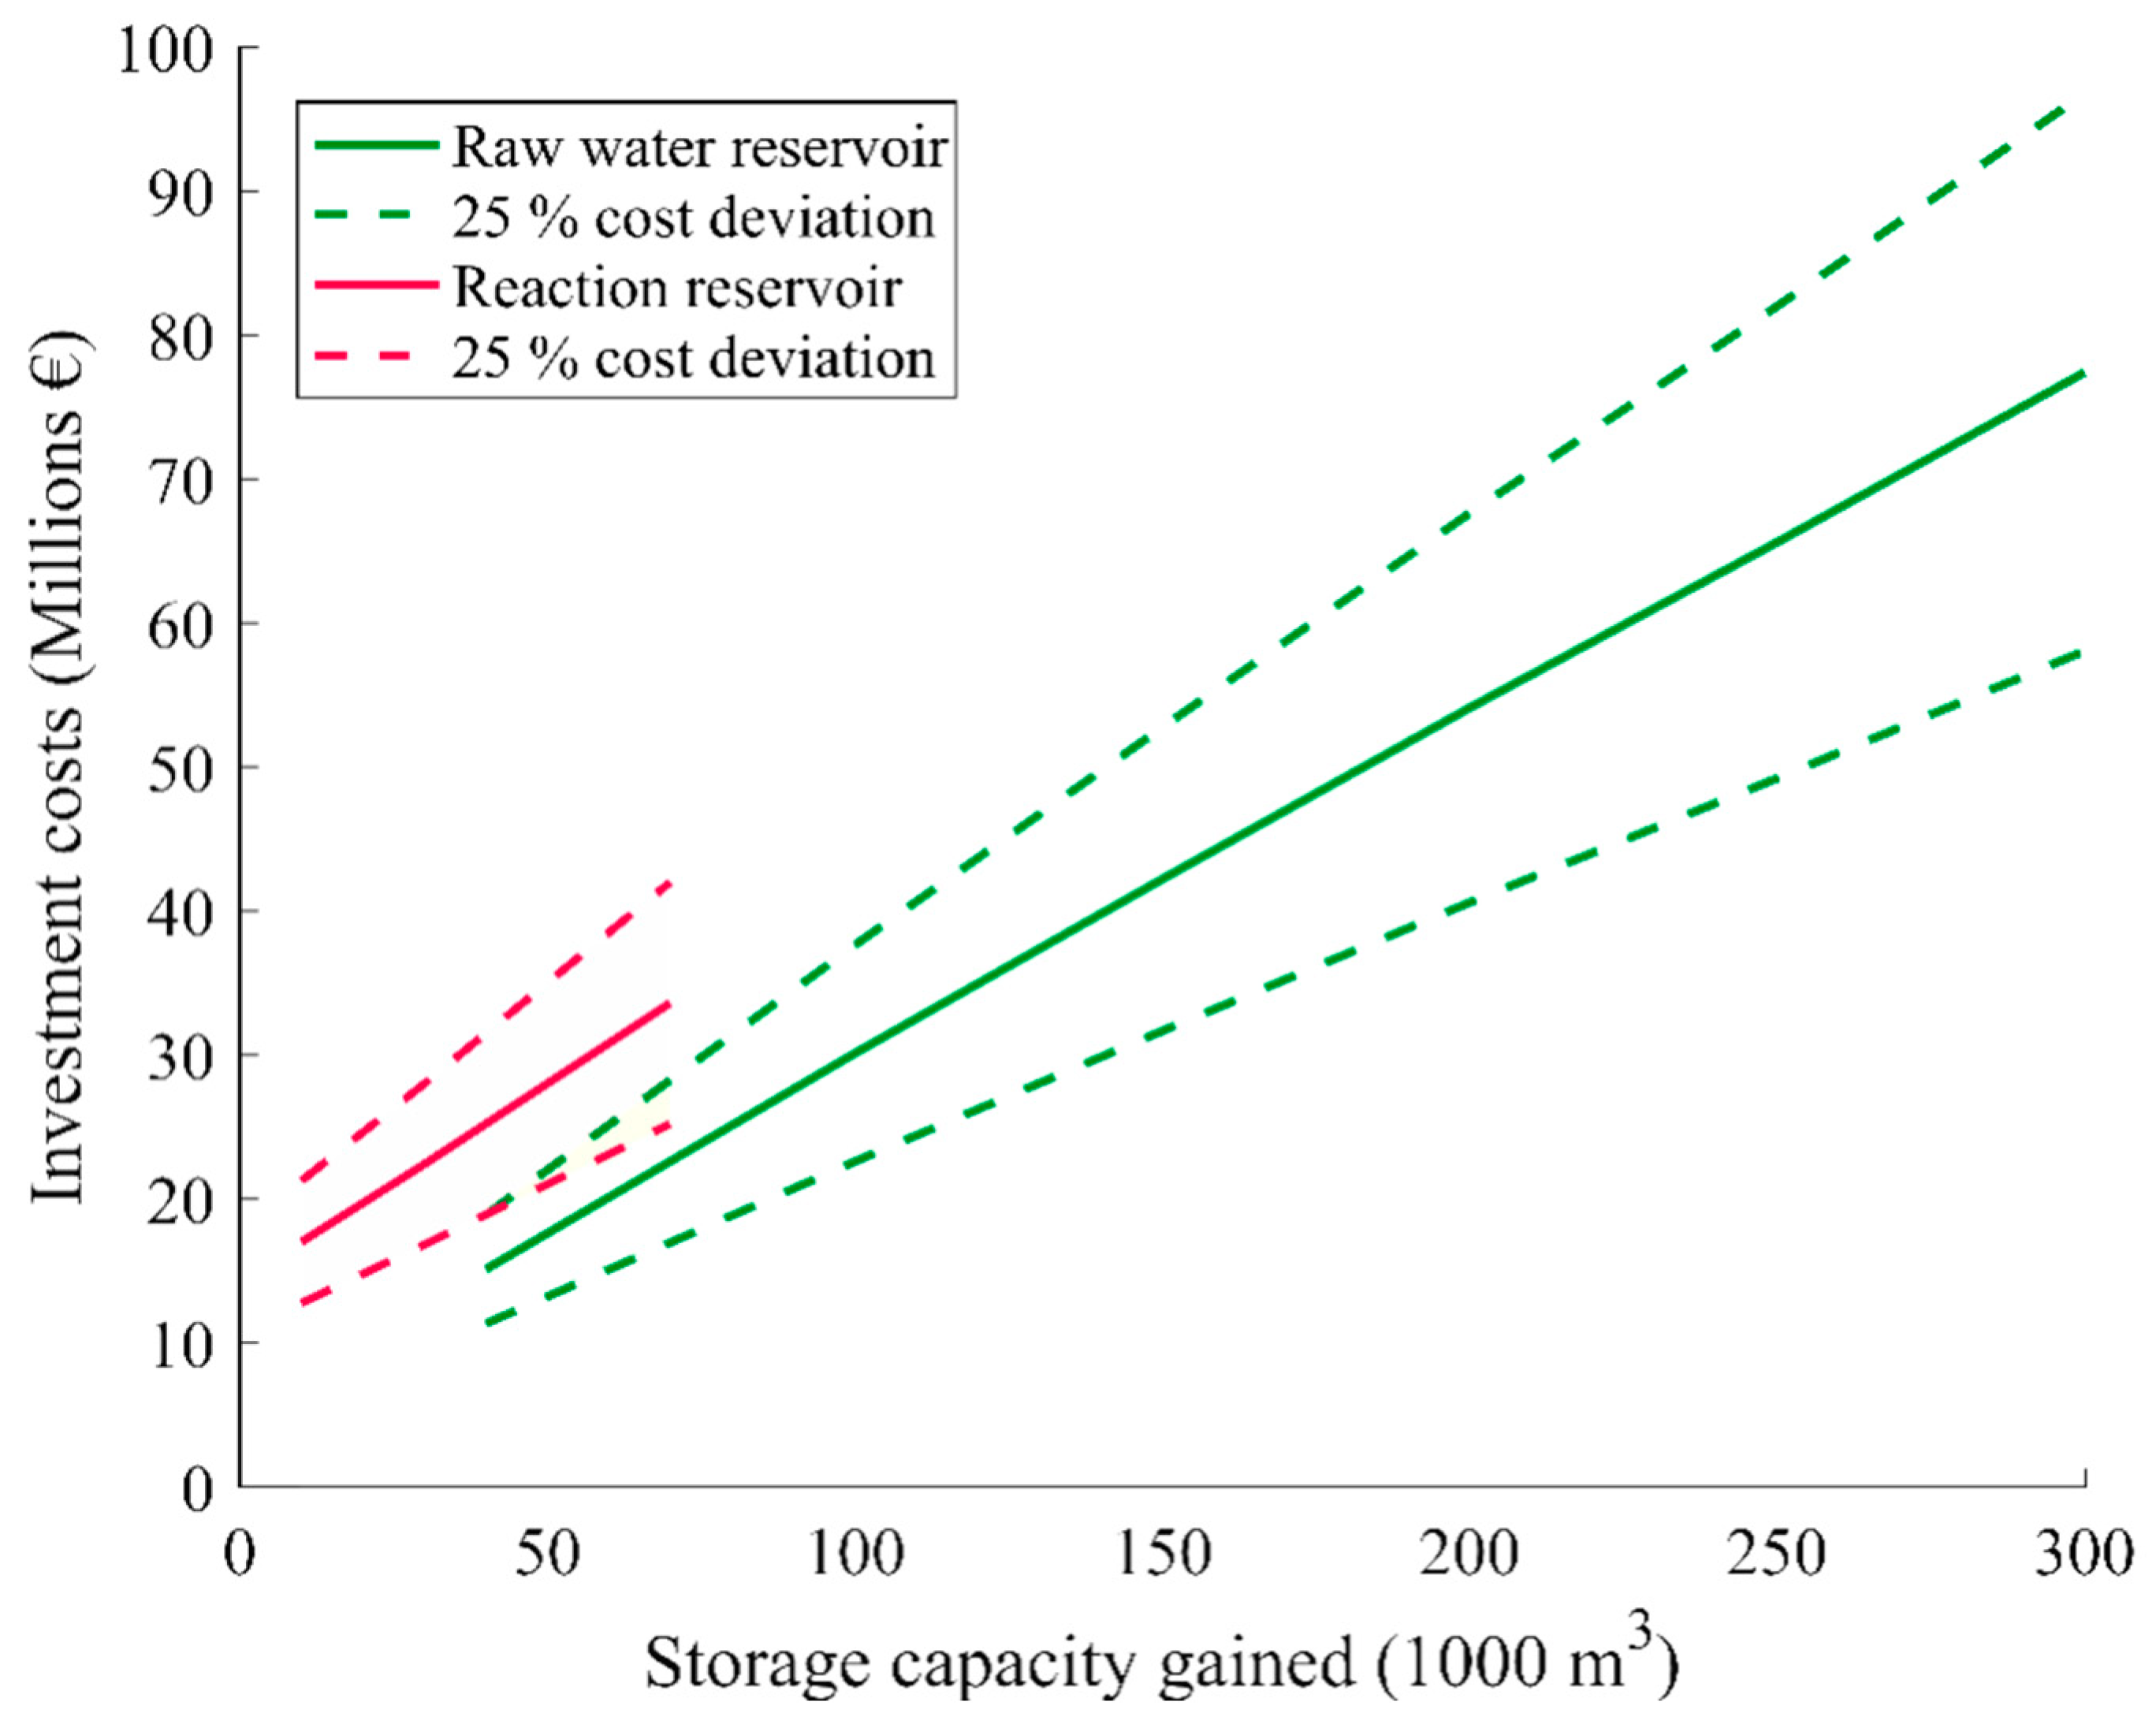
A previous study [22] estimated the investment costs for different storage types. The average specific costs to construct a new raw water reservoir are generally lower than to construct a more resilient reaction reservoir as the existing parts have to be demolished and rebuilt on a larger scale. Consequently, the absolute costs for the capacity actually gained (the newly built capacity less existing capacity) are considerably higher than for a newly constructed raw water reservoir, as depicted in Figure 2. Due to uncertainties in the estimate, the expenditure may vary by ±25% and applies to normal terrain only. For rough terrain (the BWV treatment plant is located on a hilltop) the average cost would likely be higher, but the available data, though sufficient for this investigation, were limited to the data and information presented.
As grid storage already existed, the costs for developing the capacity to increase system operation flexibility werepresumed to be negligible in comparison to constructing new storage facilities.
3. Methods
3.1. Objective Function
The overall goal of the project was to develop a cost-optimal management strategy for the water pumping station and treatment plant when electricity is procured on the spot market. This can be formulated as a mixed-integer linear unit commitment problem (MILP) as [23,24] (for the nomenclature see the Supplementary Materials in Table S1):
where cj is the cost component and xj is the integer variable and continuous variables .
The restrictions define the limitation of the permitted range of the solution in the form of:
3.2. Simulation Framework
The optimization problem was implemented in RedSim (Renewable Energy Dispatch Simulation), a simulation framework developed by Fraunhofer IEE in the programming language MATLAB®, to set up the mixed-integer linear optimization problems for plants consisting of different units, such as generators, consumers, and storages. RedSim supports the user in model creation by automatically generating a solution matrix from the variables, parameters, and equations entered and transferring the matrix to a solver. Originally created for the optimization of virtual power plants, the extension by various modules of the object-oriented software allows the mapping of different types of technological plants, because technical specifications, such as characteristic curves, minimum downtimes, or start-up costs, have already been implemented for numerous technologies. The system of equations can be set up for different target functions, taking into account specific market conditions. The optimization problem is solved with IBM ILOG CPLEX Optimization Studio 12.4 and processed by RedSim [24,25]. The commercial solver CPLEX allows solving mixed-integer linear problems by using various algorithms such as the branch-and-cut method. The branch-and-cut method creates a search tree of nodes, where each node represents a linear sub problem. These nodes are branched until a limit is reached. Cuts represent additional limitations that are used to reduce the size of the solution space without changing the problem. In a previous study [26], rolling wave planning was used by the software to generate an optimal schedule for each modeled component.
4. Model and Simulation
4.1. Water Pumping and Treatment Plant Model
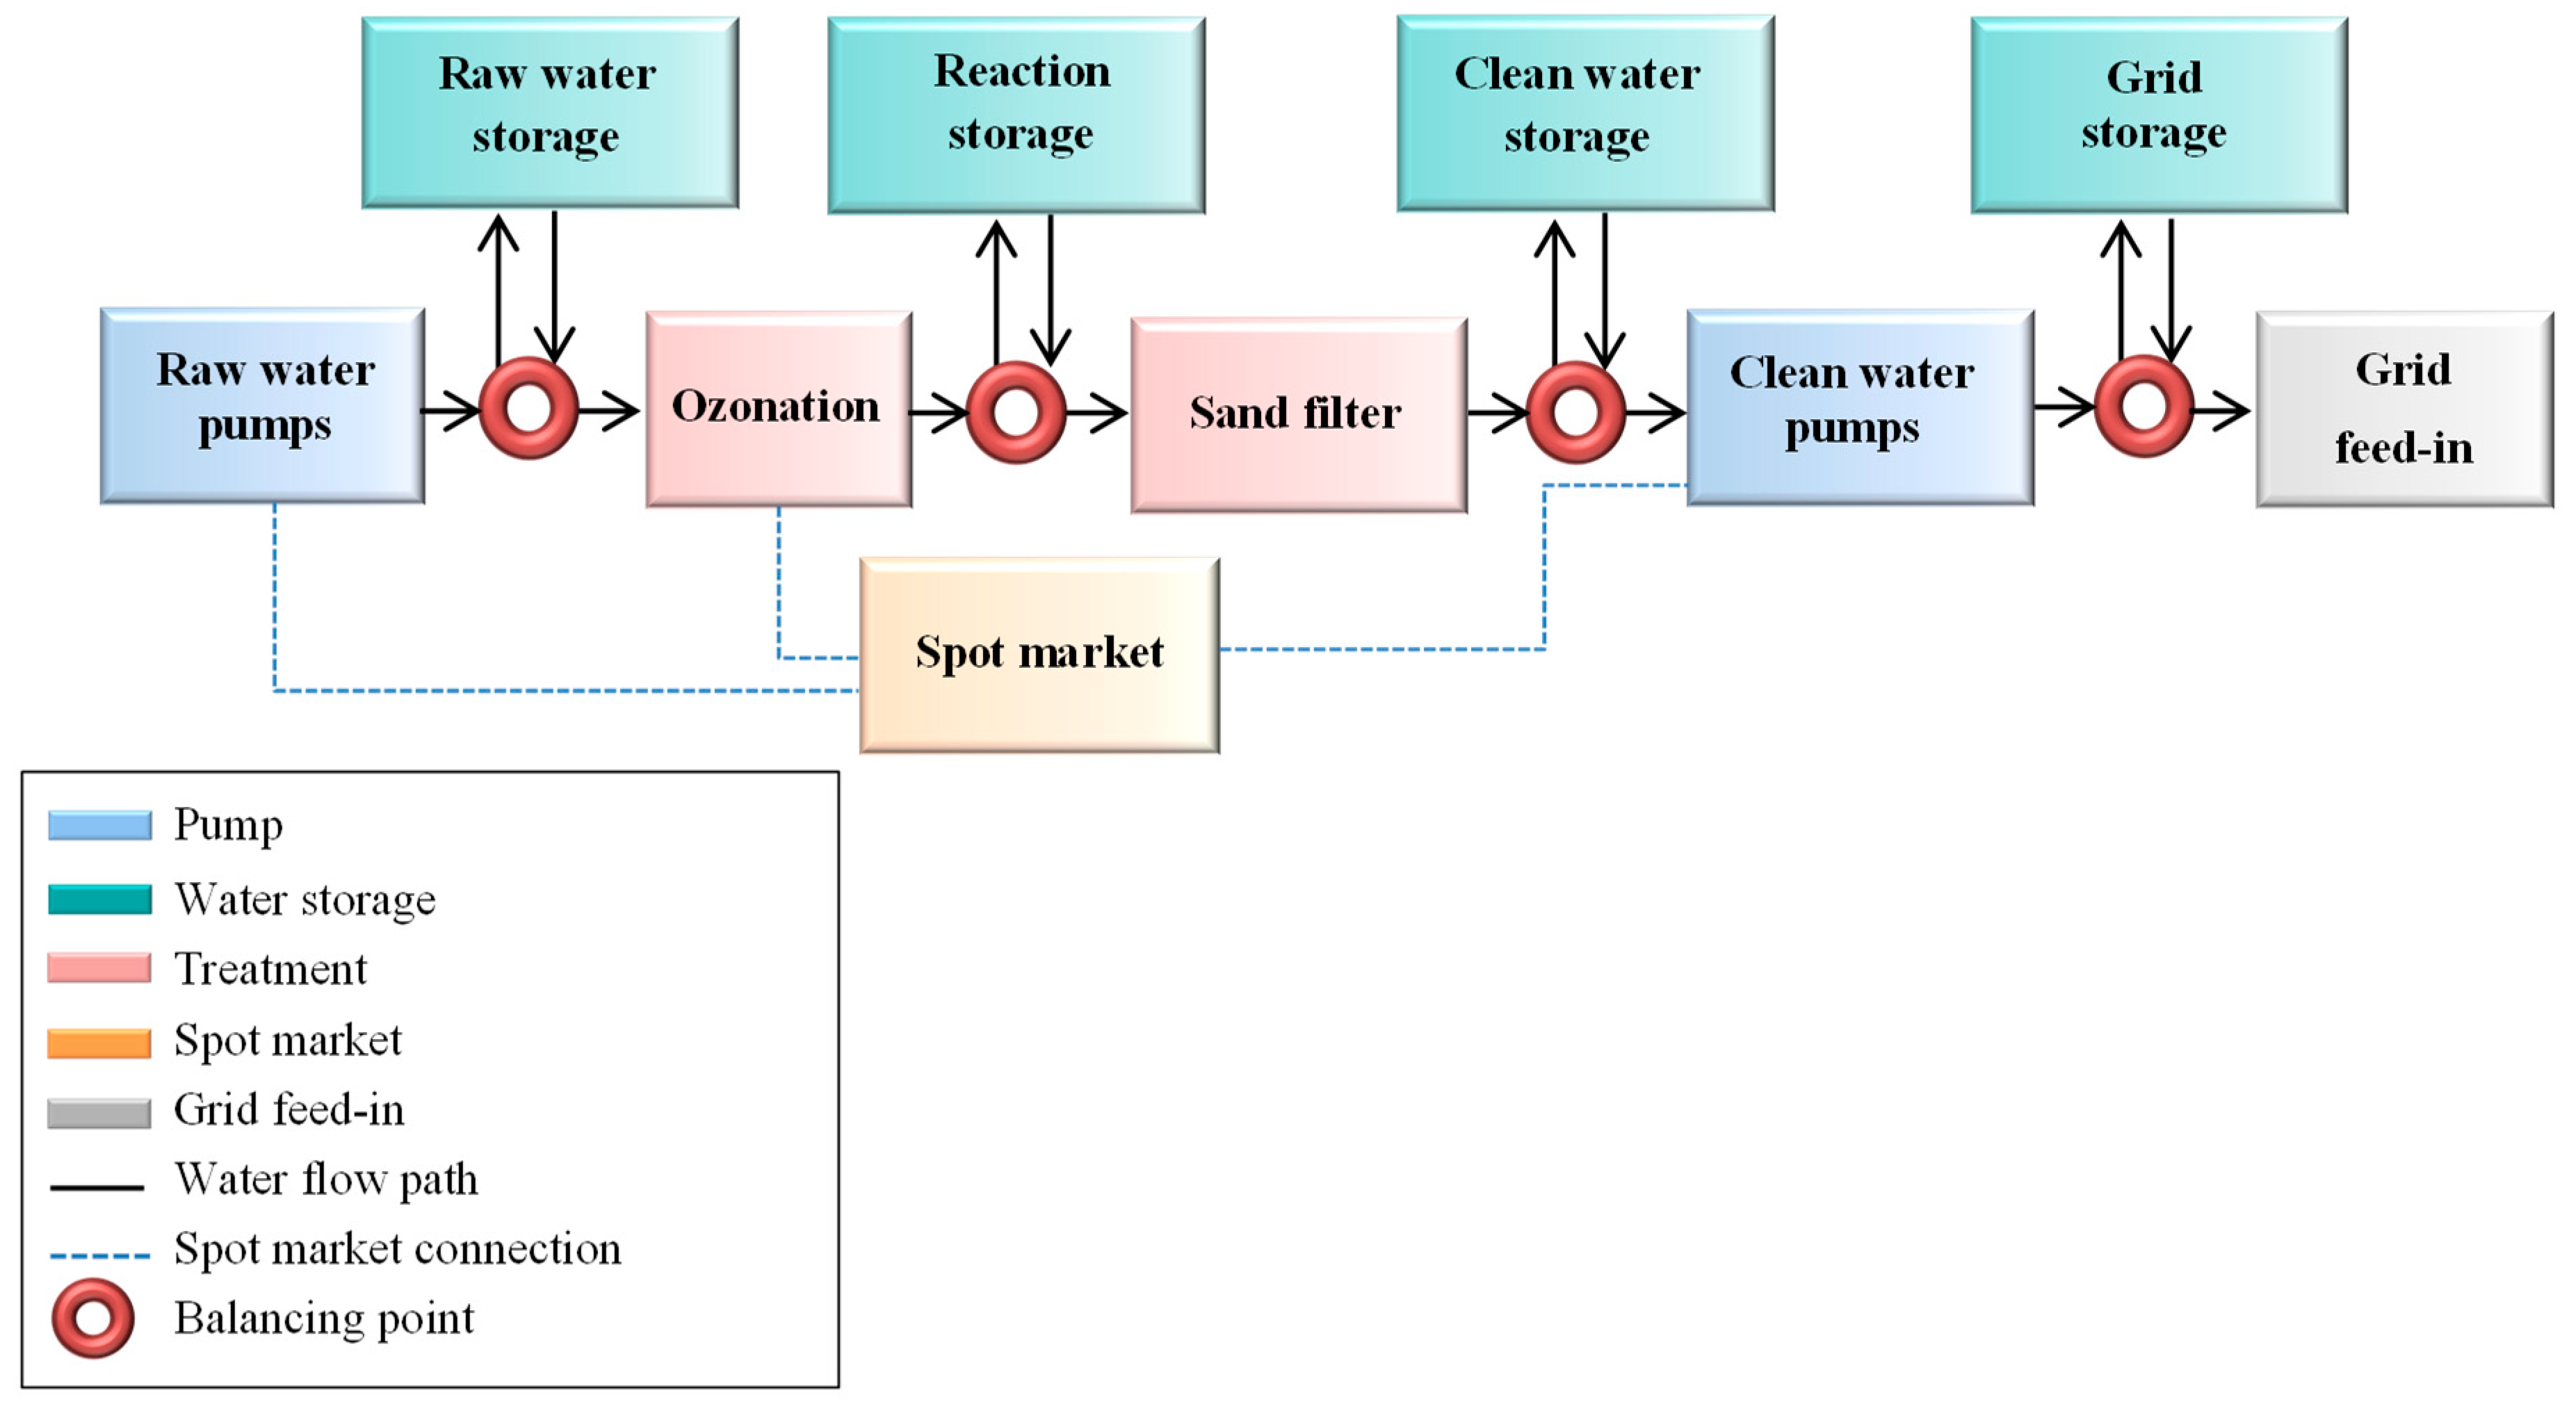
The BWV water pumping and treatment plant model contains all components relevant for the analysis (Figure 3) as described above. The capacities of the water reservoirs were assigned varying values depending on the storage option. For example, in the study of option (b), the capacity of the raw water reservoir was zero, and the impact of varying the capacity of the reaction reservoir was evaluated.
The raw and clean water pumps as well as the ozonation consume electricity and were thus connected to an electricity market model. The cost inputs considered included spot market prices, grid usage charge, the EEG surcharge, and other levies and taxes. As historical data were used, the price levels varied from year to year.
4.2. Objective Function
The objective of the simulation is a cost minimization, as described above. Regarding this particular model, the equation is
with three components consuming electricity procured at spot market prices in every time step , namely the raw water pumps, the ozonation and the clean water pumps (see Figure 3).
4.3. Modeling of the Pumps
The installed raw water pumps with the power consumption and the volume flow have fixed operating points, whereas some of the clean water pumps can operate in a flexible range. For the model component, the inflexible stages of the different pumps were combined into a single pump with fixed power consumption points (PCP) and corresponding flow rates . The latter were calculated using a specific conversion factor CFel that describes the ratio between the power consumed and the volume flow rate:
A binary variable son specifies whether each single is active, which leads to a -specific power consumption . The power consumption of the pump at each time step and the corresponding water volume flow can be derived from Equations (7) and (8).
Restricting the frequency of starting and stopping, i.e., when the model is shifted from one power consumption point to another, and , as in Equations (11) and (12), limit the wear and tear of the pumps to a maximum frequency and , as shown in Equations (13) and (14):
The flexible pumps are assumed to work on a linearized curve with the conversion factor converting the power consumption into a volume flow. The flow rate can therefore be calculated as the sum of the minimum flow rate, determined from the minimum power consumption and the conversion factor , and a flow range from the minimum to the current value for the flow rate:
4.4. Modeling the Ozonation
The production of the ozone can be modeled analogously to the pumps using Equations (7), (8), (15), and (16).
4.5. Modeling of the Water Reservoirs
The water reservoirs have a limited capacity and can be operated only within a limited volume inflow and outflow range :
The storage balance is described by the storage content of the previous time step plus the inflow and minus the outflow :
The reaction reservoirs also ensure a sufficient retention time for a complete ozone reaction within a dead zone with a constant volume due to stratification.
As such, the content of the storage may change only within a certain range during one time step from
4.6. Modeling the Sand Filter
The sand filter is the most restrictive component [2]. The volume flow through the filter and the change in velocity ( are limited.
The water loss occurring during the course of pumping and treatment is assigned to the sand filter, as this component causes the majority of the loss through backwashing. The loss is assumed as a percentage of the inflow rate with the factor .
4.7. Further Restrictions
In addition, cross-component technical and operational restrictions exist. The most important restriction is security of supply. This means that demand must be met at all times. For this reason, the flow rates of the two main pipes leaving the waterworks ( always meet the water demand .
A minimum reserve of stored water, including both the water stored in the reaction reservoir and the stored clean water , guarantees security of supply even if the demand is abnormal. The amount of water retained in the reservoirs should therefore never fall below the amount of water released into the network , which has been assigned a safety factor .
4.8. Day-Ahead Spot Market, Grid Utilization Charge, and Other Levies and Taxes
A model of the EPEX day-ahead spot market upon which the electricity procurement occurs is part of RedSim [24,25]. The EEG surcharge and further levies and taxes are added to the spot market costs.
Limiting the maximum load at peak load times reduces the costs for grid utilization, as described above. The extent to which the maximum load can be reduced depends on the flexibility of the plant. The limit has to be defined annually. The influence of varying values can be defined via
4.9. Simulation
The sample year chosen for the simulation was 2014. Thus historical data from 2014, such as the drinking water load profile, spot market prices, grid utilization charge, other levies and taxes, and peak load hours, served as inputs for the simulation. While the drinking water load profile was specific to BWV, all price and surcharge data were available [27,28].
For the storage options described above, simulations were performed using varying reaction capacities and raw water reservoirs. Furthermore, the effects and operational feasibility of reducing the maximum load at peak load hours were simulated.
5. Results and Discussion
5.1. Electricity Procurement on the Spot Market
In 2014, the plant was inflexibly operated without load management, and incurring total electricity costs of €15.501 million, of which €14.574 million would have been due to procurement based on the day-ahead spot market, and €0.928 million for grid usage (Table 1). In real terms, electricity was supplied at base and peak load prices. In a scenario assuming the flexible operation and electricity procurement on the spot market, while maintaining all other configurations, such as maximum load during peak load times and plant layout, the operator would have saved nearly 2.4% or €380,000 (in 2014). Integrating grid storage into the flexibly managed system, an additional savings of €70,000 would have been obtainable.
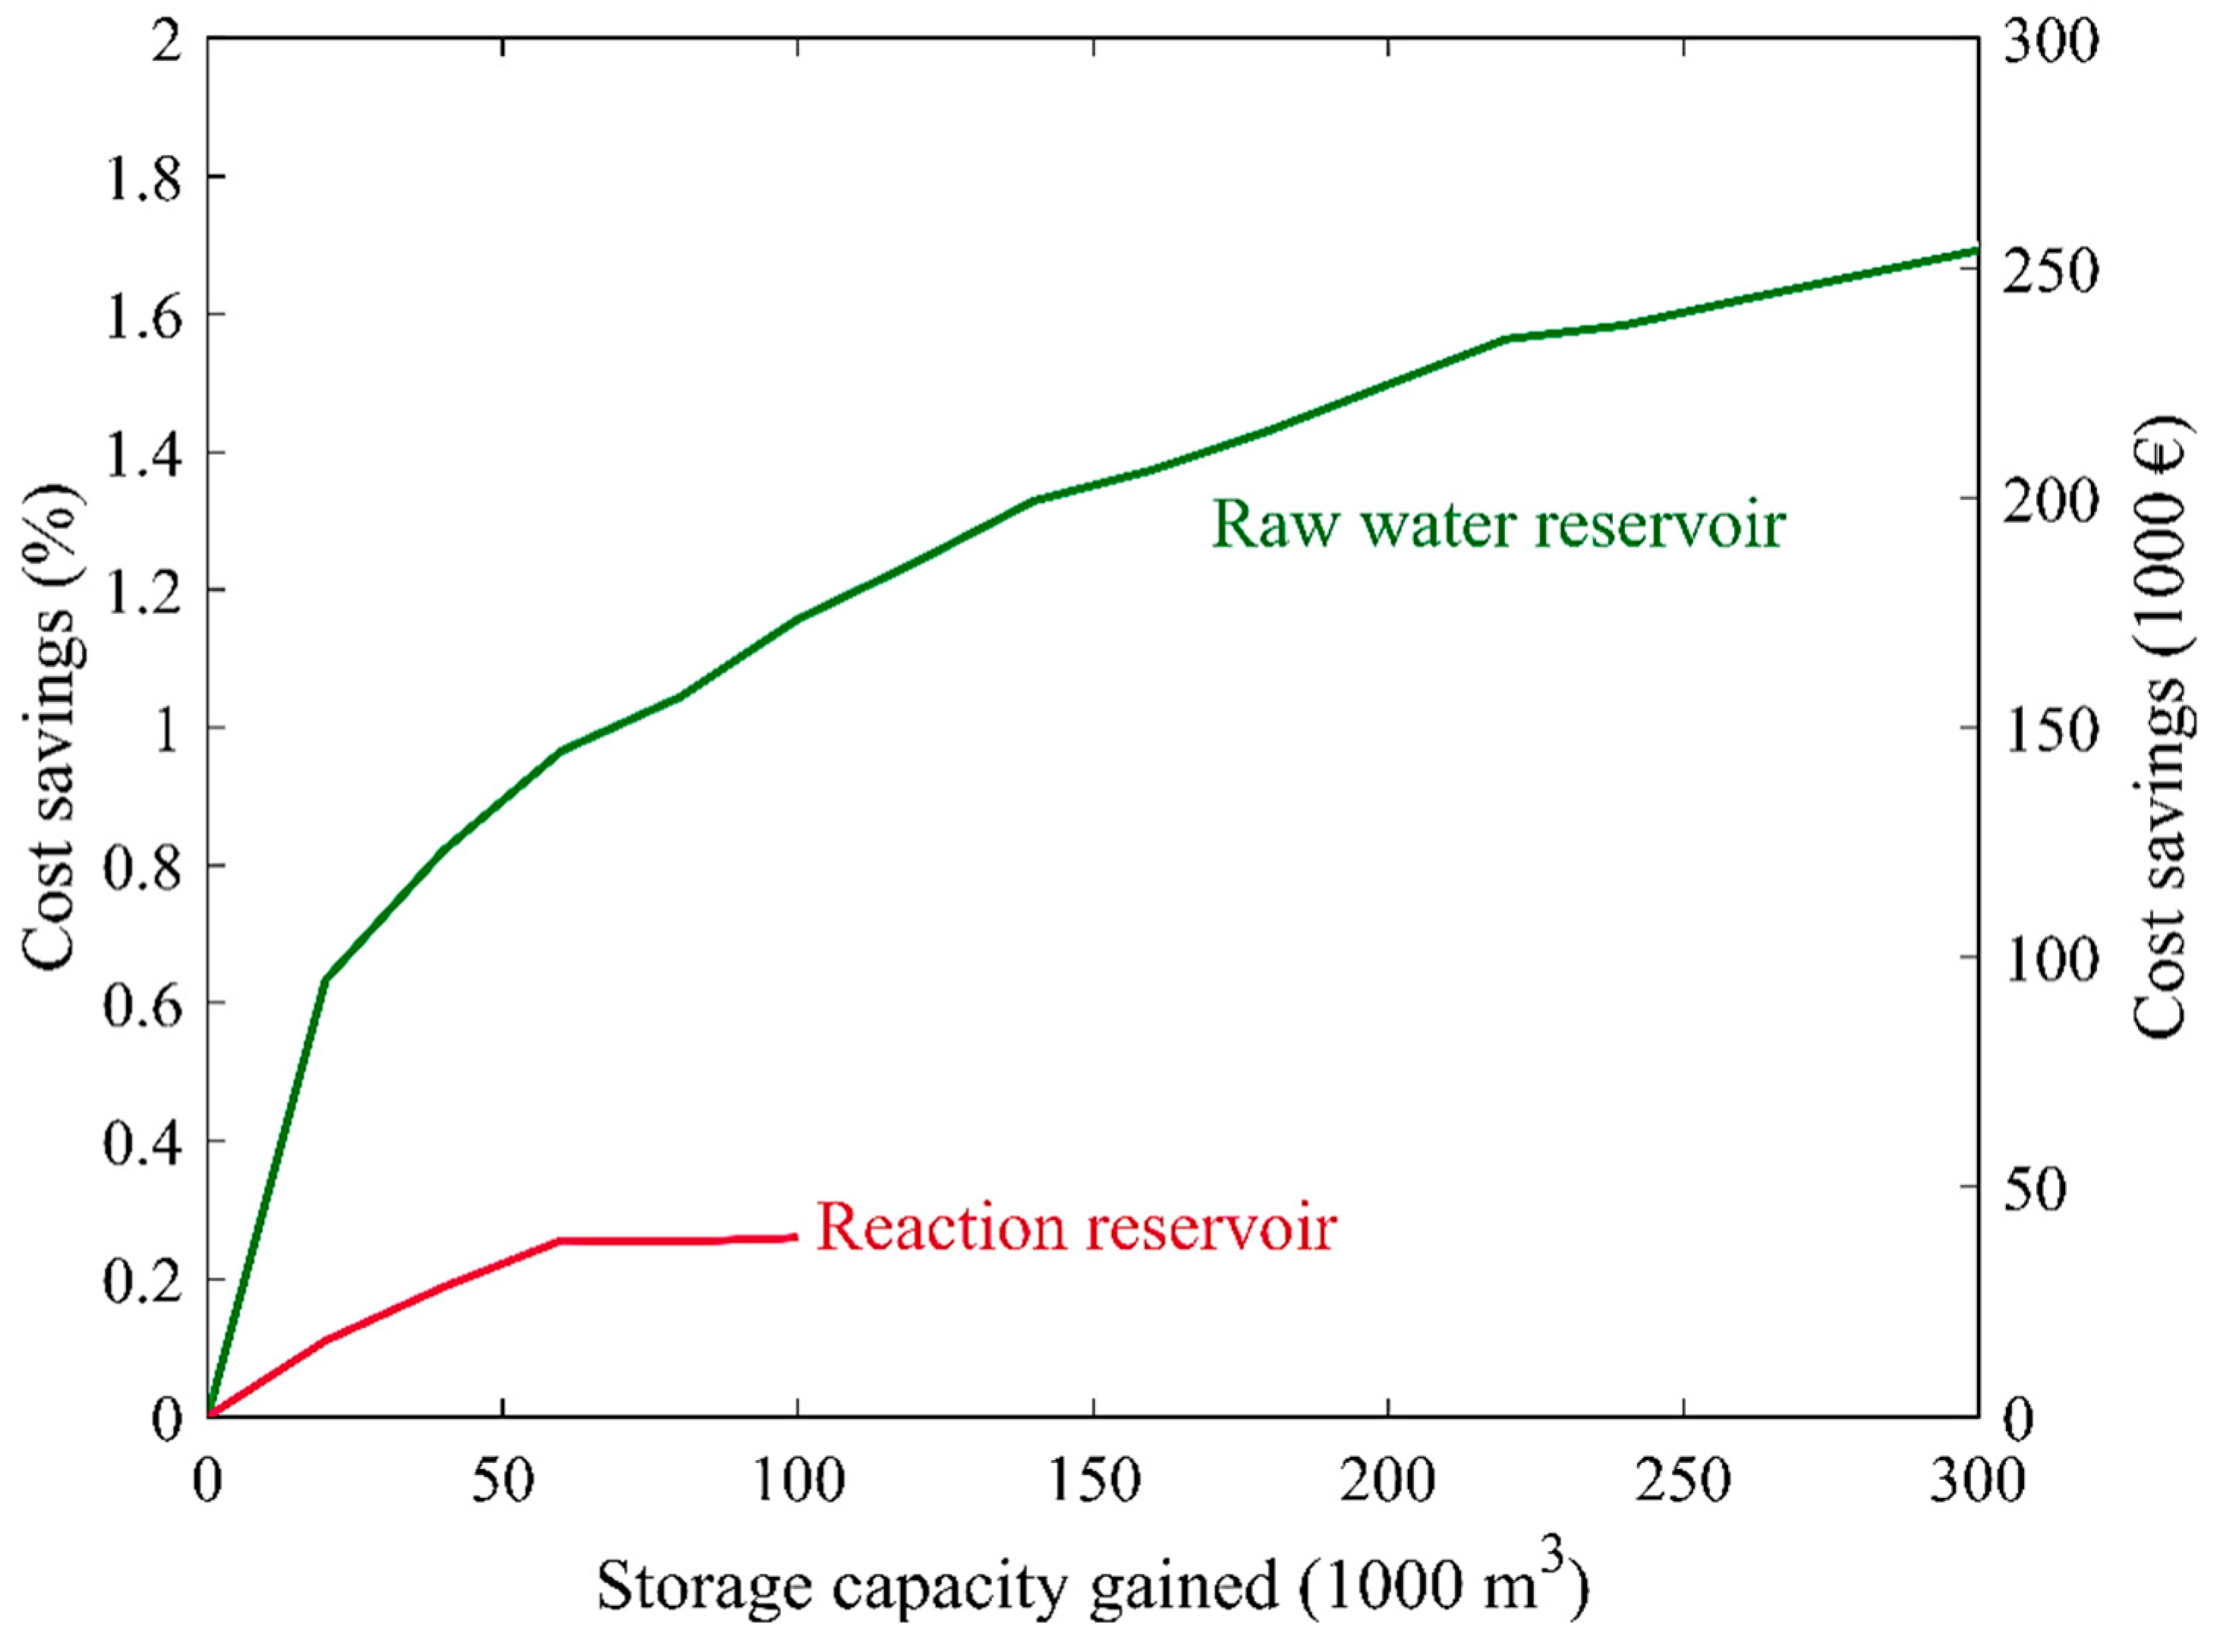
Further cost savings via procurement on the spot market can be achieved through additional storage capacity. This is depicted in more detail in Figure 4, which shows the cost saving potential for different storage options with varying additional capacity in comparison to the reference (Table 1). Here, the costs include expenses for procurement on the day-ahead spot market, the EEG surcharge, other levies and taxes, and the grid utilization charge. The last factor is mainly dependent on the reference maximum load during peak load times, which was set as 17.2 MW in this analysis. Hence, the cost savings discussed result from the operation of the plant depending on the fluctuating spot market prices.
Constructing a new raw water reservoir offers the greatest potential for cost savings (Figure 4). Generally, smaller reservoir sizes lead to greater marginal savings than large additional capacities. The strong effect of a raw water reservoir results from the decoupling of the powerful raw water pumps from the water treatment and thus leads to the largest gain in flexibility. The reaction reservoir, in addition to its specific restrictions due to the ozone reaction, is located between the treatment steps, so it is also dependent on the restrictions of the preceding and proceeding components. For example, in the particular case of the BWV, the sand filter is very limited in its flow range, which considerably hampers the flexible use of larger reaction reservoirs and causes a saturation of the curve in Figure 4 at cost savings below 300,000 €/year.
The cost savings achievable through developing the grid storage are limited due to the existing capacity available for flexible operation. However, the potential of the grid storage is accessible at a low cost because no new construction is required.
5.2. Atypical Grid Usage
Although the reference scenario operates with a maximum load of 17.2 MW at peak load hours, the reference plant can be operated at a decreased rate of about 9 MW according to the simulations. In contrast, an additional raw water reservoir that decouples the pumping of the raw water from the treatments steps, allows the raw water pumps to be switched off completely within a certain time period and thus achieving an even greater reduction in the maximum load at peak load hours to 2 MW. However, due to the method described above for determining the annual grid utilization charge, a reduction to 7 MW already leads to the minimum achievable cost savings, assuming an unchanged overall maximum load.
The cost savings achievable by reducing the maximum load is quite high. For example, a reduction from 17.2 to 9 MW allows the operator to save roughly 2.1% per year (€336,000 in 2014), when using he grid storage for flexible operation.
5.3. Sensitivity
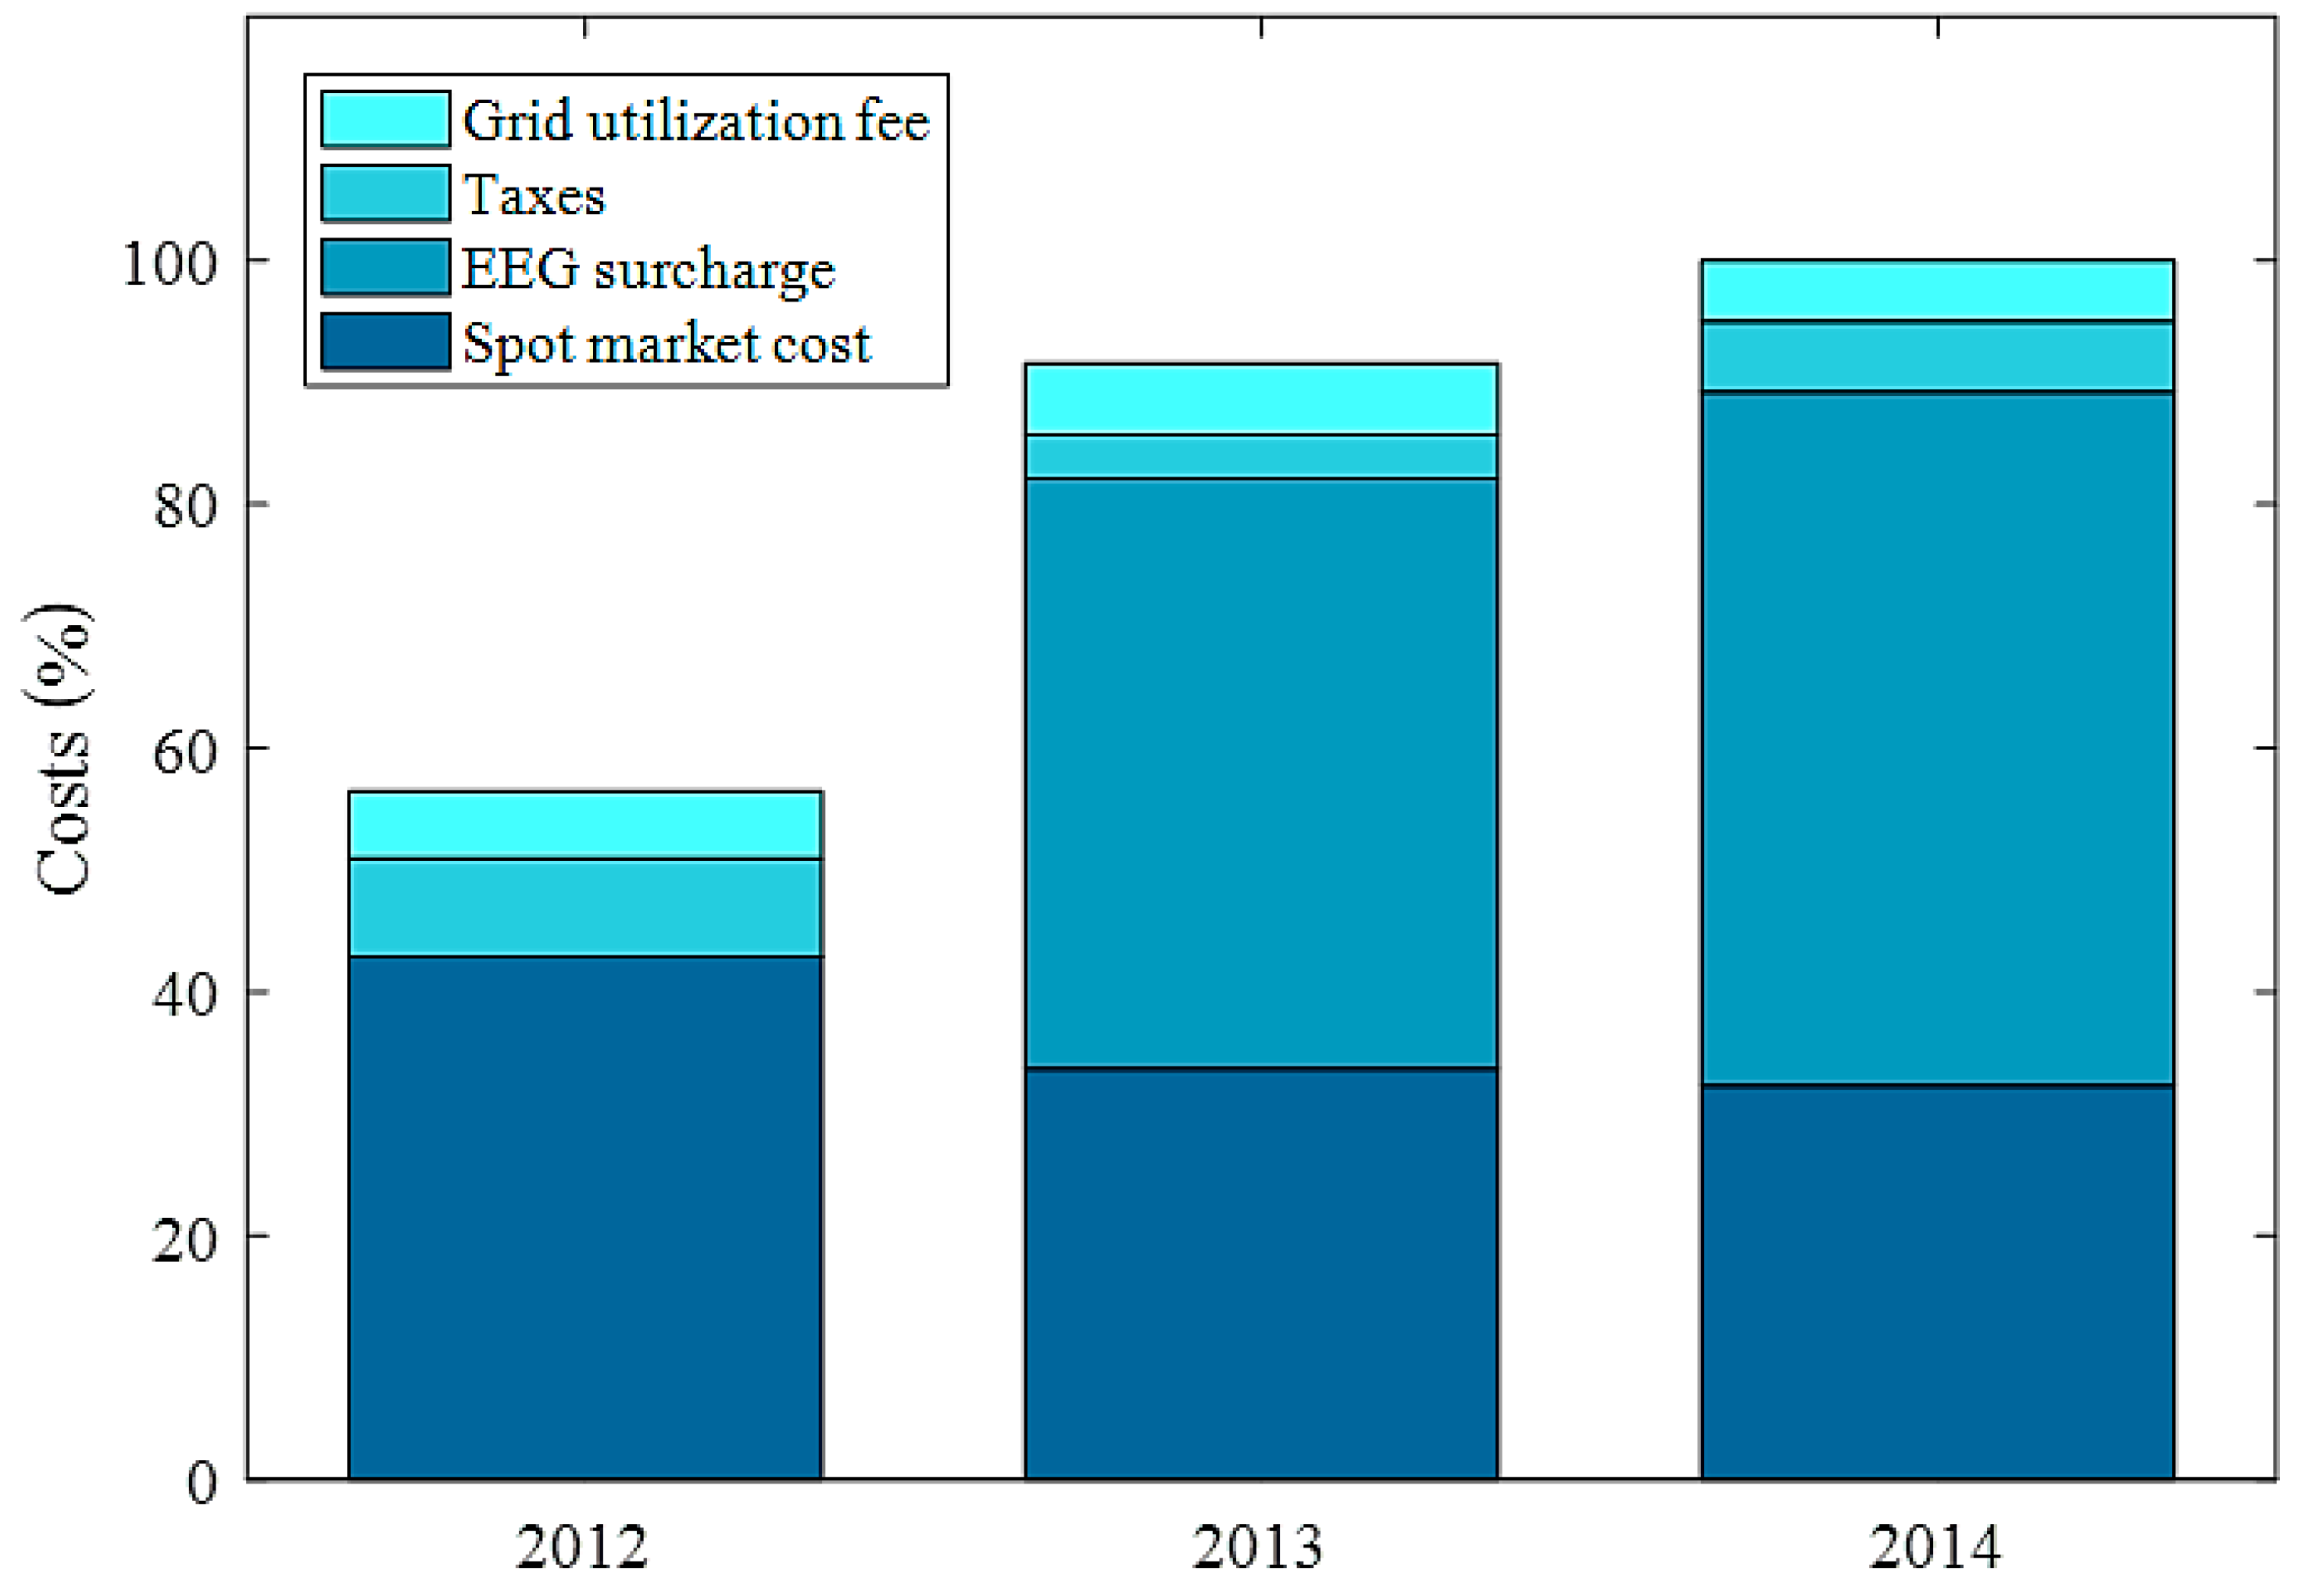
Since the simulations were based upon historical input data, the sensitivity of the results was crucial for a thorough interpretation of the results. The average spot market prices and the EEG surcharge have changed considerably in the past. However, their development in the future is unpredictable. Figure 5 sets the total (simulated) cost for electricity procurement in 2014 at 100%. The figure shows the total costs for 2012 and 2013 and the cost components for each year. Notably, in 2012, the BWV was exempted from the EEG surcharge.
The total costs are extremely sensitive to the selected year for the simulations and, thus, to the associated historical input data. The two most influential factors were the spot market prices and the EEG surcharge. Average spot market prices have fallen continuously in recent years. At the same time, the EEG surcharge has steadily risen, leading to an increase in absolute costs from 2013 to 2014.
The future development of both spot market prices and the EEG surcharge depends on various factors, such as politics, market regulations, and the number, characteristics, and behavior of market participants. Long-term forecasts are consequently highly uncertain. Investment decisions regarding storage capacity based on either historical data or assumptions of future development are therefore highly risky, considering the sensitivity of the costs for electricity procurement to spot market prices and the EEG surcharge.
5.4. Recommended Measures
Although any economic analysis of the options for storage extension are affected by the uncertainties described above, determining the net present value (NPV) based on the historical 2014 values may support any decisions concerning the best storage option, in particular if extended storage capacity is needed for further reasons, such as security of supply or operational issues. Assuming an interest rate of 4% and a storage lifetime of 50 years, the optimum NPVs for the storage options is determined according to:
which are listed in Table 2. In addition to the high risk, all NPVs calculated for 2014 are negative. This suggests that an investment decision in favor of additional storage capacity should not be based solely on the aim of increasing the flexibility of the plant, but must consider other factors. Cost savings due to increased flexibility can nevertheless deliver a contribution margin. Changes in the market or modifications in the regulatory framework can possibly lead to positive values. For instance, an advantageous alteration of the EEG to a dynamic EEG [29] would notably affect the value of flexibility.
The NPVs indicate that the most favorable storage option would be a small size raw water reservoir.
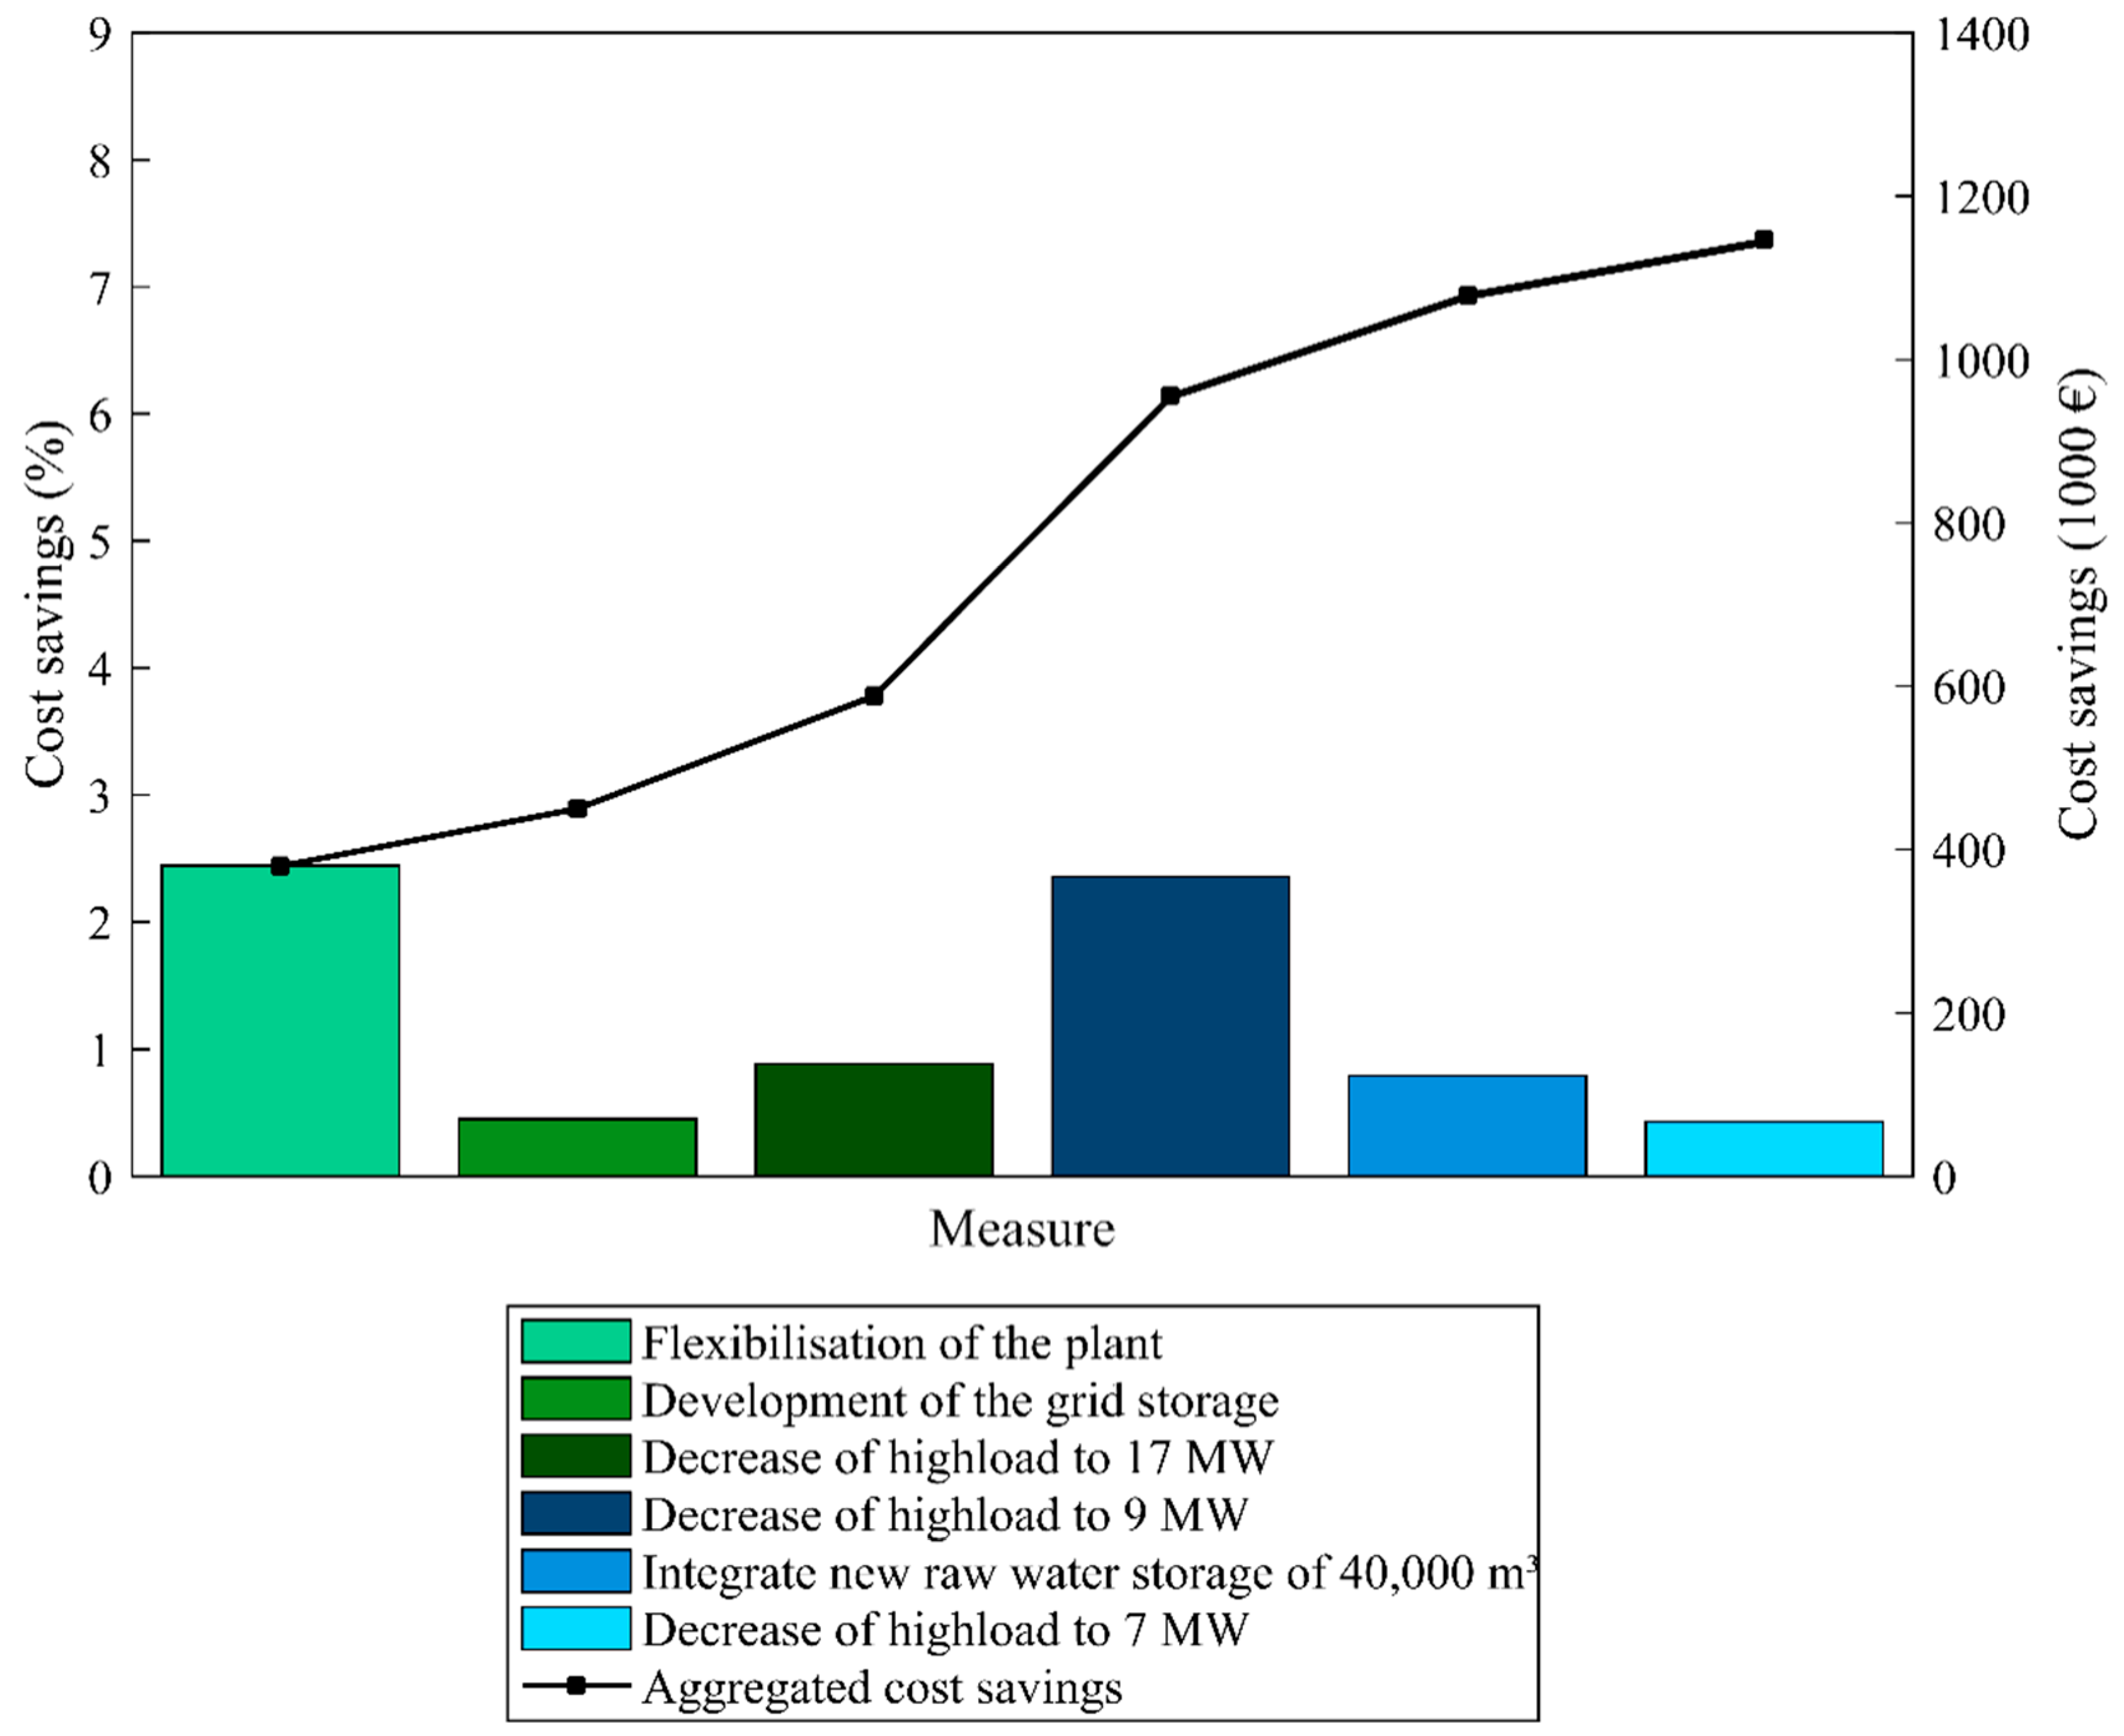
Apart from investing in additional storage capacity, measures related to the existing plant would provide a positive return. The recommended measures are shown step-by-step in Figure 6. The results are based on the simulations for 2014, but the qualitative conclusions are generally valid. The percentages relate to the total historical cost for electricity procurement stated in Table 1. The flexibilization of the existing plant reduces the annual cost of electricity procurement b 2.4%, whereas developing the grid storage allows further cost savings of 0.5% with a reference value of 70,000 m³.
A reduction in the maximum load to 17.2 or 9 MW at peak load times results in further considerable cost savings (the latter using also the flexibility of the grid storage). The construction of a raw water reservoir (40,000 m³) further reduces the maximum load at peak load times and, thus provides further cost savings. The aggregation of these measures offers potential annual cost savings of 7.4% for 2014.
6. Summary and Conclusions
Flexible operation of medium- to large-sized electricity loads can support the integration of renewable energies into the German electricity system [2]. Drinking water pumping and treatment plants have largely untapped potential for demand side management [14]. A key factor for increasing flexibility is the positioning of additional storage capacity, which allows water pumping to be controlled independently from water treatment. The storage volume is of secondary importance compared to the de-coupling of the pumping, treatment, and transport of the water. When related to the BWV, this means that constructing a small raw water storage facility as opposed to large additional capacities in between treatment steps offers significantly higher potential for demand side management and, hence, for cost savings. An investigation into other systems is expected to lead to similar conclusions, as water pumping and treatment plants can generally only be flexible if the pumping, treatment, and transport sections can be operated independently from each other, irrespective of the location of the main pumps.
Investments into additional storage capacities must be made for reasons other than to increase flexibility, e.g., quality of supply. The potential cost savings or revenues achievable, respectively, can provide a contribution margin, but are associated with great uncertainty and are insufficient to stimulate investment into extending storage capacity with the sole goal of flexibilization. However, identifying unused existing flexibility potential within the existing framework can have positive returns. In the BWV example, flexible management of the existing water pumping and treatment plant in conjunction with determining the available grid storage capacity offered valuable cost saving potential. To achieve these savings, investing in information technology, software, and staff training will be necessary, which are minor costs compared with the costs of constructing new storage facilities.
Supplementary Materials
The following are available online at https://www.mdpi.com/2073-4441/10/7/857/s1. Table S1: Nomenclature.
Author Contributions
Conceptualization, B.Z.; Methodology, B.Z. and H.G.; Software, H.G. and B.Z.; Validation, B.Z., H.G. and K.R.; Formal Analysis, B.Z. and H.G.; Investigation, B.Z. and H.G.; Data Curation, B.Z.; Writing-Original Draft Preparation, B.Z.; Writing-Review & Editing, B.Z. and H.G.; Visualization, H.G. and B.Z.; Supervision, B.Z. and K.R.; Project Administration, B.Z.; Funding Acquisition, B.Z.
Funding
This research was funded by BMBF (German Federal Ministry of Education and Research) grant number 02WER1316A.
Acknowledgments
This paper is based on the project ‘enWasser’ (promotion index 02WER1316A), which was funded by the German Federal Ministry of Education and Research. The responsibility for the content of this paper is up to the authors.
Conflicts of Interest
The authors declare no conflict of interest.
References
- Finn, P.; Fitzpatrick, C. Demand Side Management of Industrial Electricity Consumption: Promoting the Use of Renewable Energy through Real-time Pricing. Appl. Energy 2014, 113, 11–21. [Google Scholar] [CrossRef]
- Gadian, H. Kostenoptimierter Einsatz von Anlagen zur Trinkwasserförderung und -aufbereitung unter Variation von Wasserspeicherkapazitäten am Beispiel des Zweckverband Bodensee-Wasserversorgung. Master’s Thesis, University of Kassel, Kassel, Germany, 19 December 2016. [Google Scholar]
- Finn, P.; Fitzpatrick, C.; Connolly, D. Demand Side Management of Electric Car Charging: Benefits for Consumer and Grid. Energy 2012, 42, 358–363. [Google Scholar] [CrossRef]
- Paulus, M.; Borggrefe, F. The Potential of Demand-side Management in Energy-intensive Industries for Electricity Markets in Germany. Appl. Energy 2011, 88, 432–441. [Google Scholar] [CrossRef]
- Zhang, Q.; Grossmann, I.E. Planning and Scheduling for Industrial Demand Side Management: Advances and Challenges. In Alternative Energy Sources and Technologies; Martín, M., Ed.; Springer: New York, NY, USA, 2016; pp. 383–414. [Google Scholar]
- Babu, C.A.; Ahsok, S. Peak Load Management in Electrolytic Process Industries. IEE Trans. Power Syst. 2008, 23, 399–405. [Google Scholar] [CrossRef]
- Hadera, H.; Harjunkoski, I.; Sand, G.; Grossmann, I.E. Optimization of Steel Production Scheduling with Complex Time-sensitive Electricity Cost. Comput. Chem. Eng. 2015, 76, 117–136. [Google Scholar] [CrossRef]
- Mitra, S.; Grossmann, I.E.; Pinto, J.M.; Arora, N. Optimal Production Planning Under Time-sensitive Electricity Prices for Continuous Power-intensive Processes. Comput. Chem. Eng. 2012, 38, 171–184. [Google Scholar] [CrossRef]
- Chen, Z.; Wu, L.; Fu, Y. Real-Time Price-Based Demand Response Mangement for Residential Appliances via Stochastic Optimization and Robust Optimization. IEEE Trans. Smart Grid 2012, 3, 1822–1831. [Google Scholar] [CrossRef]
- Samad, T.; Kiliccote, S. Smart Grid Technologies and Applications for the Industrial Sector. Comput. Chem. Eng. 2012, 47, 76–84. [Google Scholar] [CrossRef]
- Wencki, K.; Koti, J.; Hunze, S. Ökonomische Rahmenbedingungen—Anreizsysteme zur Lastoptimierten Versorgung; ENERWA: Mülheim an der Ruhr, Germany, 2017. [Google Scholar]
- Els, L.A.; Pelzer, R.; Schutte, A.J. Load Management on a Municipal Water Treatment Plant. In Proceedings of the 2015 International Conference on the Industrial and Commercial Use of Energy (ICUE), Cape Town, South Africa, 18–19 August 2015; IEEE: New York, NY, USA, 2015; pp. 187–190. [Google Scholar] [CrossRef]
- Breytenbach, W.J.; Pelzer, R.; Marais, J.H. Integration of Electricity Cost Saving Interventions on a Water Distribution Utility. In Proceedings of the 2015 International Conference on the Industrial and Commercial Use of Energy (ICUE), Cape Town, South Africa, 18–19 August 2015. [Google Scholar] [CrossRef]
- Sparn, B.; Hunsberger, R. Opportunities and Challenges for Water and Wastewater Industries to Provide Exchangeable Services; NREL: Golden, CO, USA, 2015. [Google Scholar] [CrossRef]
- Nogueira Vilanova, M.R.; Perrella Balestieri, J.A. Energy and hydraulic efficiency in conventional water supply systems. Renew. Sustain. Energy Rev. 2014, 30, 701–714. [Google Scholar] [CrossRef]
- Ramos, H.M.; Kenov, K.N.; Vieira, F. Environmentally friendly hybrid solutions to improve the energy and hydraulic efficiency in water supply systems. Energy Sustain. Dev. 2011, 15, 436–442. [Google Scholar] [CrossRef]
- Vieira, F.; Ramos, H.M. Hybrid solution and pump-storage optimization in water supply system efficiency: A case study. Energy Policy 2008, 36, 4142–4148. [Google Scholar] [CrossRef]
- Gardian, H.; Zimmermann, B.; Hochloff, P.; Asanalieva, N.; Scholz, C.; Drusenbaum, C.; Weiß, M.; Stadler, C.; Ruprecht, A.; Katzfey, J.; et al. enWasser—Erschließung eines Lastmanagementpotenzials in der Wasserversorgung zur Integration Erneuerbarer Energien; Fraunhofer: Kassel, Germany, 2017. [Google Scholar]
- Federal Ministry for Economical Affairs and Energy. Nationwide equalisation. In Act on the Development of Renewable Energy Sources (Renewable Energy Sources Act—RES Act 2014); 754-27; Bundesanzeiger Verlag: Köln, Germany, 2014; pp. 35–36. [Google Scholar]
- REN21. Renewables 2013; Global Status Report; REN21 Secretariat: Paris, France, 2013. [Google Scholar]
- Federal Ministry of Justice and Consumer Protection. Sonderformen der Netznutzung. Stromnetzentgeltverordnung (StromNEV), §19; Bundesanzeiger Verlag: Köln, Germany, 2017; pp. 13–14. [Google Scholar]
- Baurconsult, B.W. Studie Wasserspeicher Sipplinger Berg; Erläuterungen: Stuttgart, Germany, 2015. [Google Scholar]
- Carrion, M.; Arroyo, J.M. A Computationally Efficient Mixed-Integer Linear Formulation for the Thermal Unit Commitment Problem. IEEE Trans. Power Syst. 2006, 21, 1371–1378. [Google Scholar] [CrossRef]
- Hochloff, P. Unit Commitment and Investment Valuation of Flexible Biogas Plants in German Power Markets; Energy Management and Power System Operation: Kassel, Germany, 2017; Volume 2. [Google Scholar]
- Hochloff, P.; Braun, M. Optimizing Biogas Plants with Excess Power Unit and Storage Capacity in Electricity and Control Reserve Markets. Biomass Bioenergy 2014, 65, 125–135. [Google Scholar] [CrossRef]
- IBM. Branch and Cut in CPLEX. Available online: https://www.ibm.com/support/knowledgecenter/SSSA5P_12.6.2/ilog.odms.cplex.help/refcppcplex/html/branch.html (accessed on 1 June 2018).
- EPEX Spot. Market Data: Day-Ahead Auction. Available online: https://www.epexspot.com/en/market-data/dayaheadauction (accessed on 24 June 2018).
- Bundesnetzagentur. Entwicklung der EEG-Umlage. Available online: https://www.bundesnetzagentur.de/SharedDocs/FAQs/DE/Sachgebiete/Energie/Verbraucher/Energielexikon/EEGUmlage.html (accessed on 24 June 2018).
- Ecofys Germany GmbH. Der Spotmarktpreis als Index für eine dynamische EEG-Umlage: Vorschlag für eine verbesserte Integration Erneuerbarer Energien durch Flexibilisierung der Nachfrage; Agora Energiewende: Berlin, Germany, 2014. [Google Scholar]
Figure 1.
Zweckverband Bodensee-Wasserversorgung (BWV) water pumping and treatment system.

Figure 2.
Estimated average investment costs for varying storage capacity gained by type of reservoir.
Figure 2.
Estimated average investment costs for varying storage capacity gained by type of reservoir.

Figure 3.
Model of the BWV water pumping and treatment plant.

Figure 4.
Cost saving potential for different storage options with varying additional storage capacity.
Figure 4.
Cost saving potential for different storage options with varying additional storage capacity.

Figure 5.
Cost components for electricity procurement by year in relation to the reference cost for 2014.
Figure 5.
Cost components for electricity procurement by year in relation to the reference cost for 2014.

Figure 6.
Aggregated cost savings in electricity procurement (spot market, EEG surcharges, levies, taxes, and grid usage fee) related to consecutive measures in 2014.
Figure 6.
Aggregated cost savings in electricity procurement (spot market, EEG surcharges, levies, taxes, and grid usage fee) related to consecutive measures in 2014.


Table 1.
Key parameters and results used to simulate different pumping and treatment plant configurations using values from 2014.
Table 1.
Key parameters and results used to simulate different pumping and treatment plant configurations using values from 2014.
| Parameter | Plant Configuration | ||
|---|---|---|---|
| Inflexible Operation | Flexible Operation | Flexible Operation: Reference 1 | |
| Max. load during peak load times (MW) | 19.7 | 19.7 | 17.2 |
| Electricity demand (GWh/a) | 144.5 | 144.3 | 144.3 |
| Cost spot market + levies and taxes (million €/year) | 14.574 | 14.127 | 14.123 |
| Grid usage charge (million €/year) | 0.928 | 0.926 | 0.792 |
| Total cost (million €/year) | 15.501 | 15.054 | 14.915 |
1 Flexible operation with reduced maximum load during peak load hours is used as the reference scenario in the following sections.
Table 2.
Net present values (NPVs) for minimum and maximum possible capacity of storage options (b) and (c).
Table 2.
Net present values (NPVs) for minimum and maximum possible capacity of storage options (b) and (c).
| Storage Option | Storage Capacity Gained (m³) | NPV (Million €) |
|---|---|---|
| b. Reaction reservoir | 40,000 | −29.144 |
| 80,000 | −46.144 | |
| c. Raw water reservoir | 40,000 | −13.100 |
| 300,000 | −113.060 |
© 2018 by the authors. Licensee MDPI, Basel, Switzerland. This article is an open access article distributed under the terms and conditions of the Creative Commons Attribution (CC BY) license (http://creativecommons.org/licenses/by/4.0/).
Share and Cite
MDPI and ACS Style
Zimmermann, B.; Gardian, H.; Rohrig, K. Cost-Optimal Flexibilization of Drinking Water Pumping and Treatment Plants. Water 2018, 10, 857. https://doi.org/10.3390/w10070857
AMA Style
Zimmermann B, Gardian H, Rohrig K. Cost-Optimal Flexibilization of Drinking Water Pumping and Treatment Plants. Water. 2018; 10(7):857. https://doi.org/10.3390/w10070857
Chicago/Turabian StyleZimmermann, Britta, Hedda Gardian, and Kurt Rohrig. 2018. "Cost-Optimal Flexibilization of Drinking Water Pumping and Treatment Plants" Water 10, no. 7: 857. https://doi.org/10.3390/w10070857
Note that from the first issue of 2016, this journal uses article numbers instead of page numbers. See further details here.