Bed Morphology around Various Solid and Flexible Grade Control Structures in an Unstable Gravel-Bed River

1
State Key Laboratory of Hydraulics and Mountain River Engineering, Sichuan University, Chengdu 610065, China
2
College of Water Resource and Hydropower, Sichuan University, Chengdu 610065, China
*
Author to whom correspondence should be addressed.
Water 2018, 10(7), 822; https://doi.org/10.3390/w10070822
Submission received: 17 May 2018
/
Revised: 14 June 2018
/
Accepted: 15 June 2018
/
Published: 21 June 2018
(This article belongs to the Special Issue Erosion and Torrent Control)
Abstract
:Flexible grade control structures (GCSs) are increasingly popular alternative countermeasures consisting of conventional solid structures for protecting riverbeds from erosion. Among this structure typology, tetrahedron framed permeable weirs (TFPW) were proposed to stabilize riverbeds and protect cross-river structures. The bed morphology as well as the interactions among the structures, water flow and bed features have not been systematically analyzed. Therefore, based on the field data collected in the Jianjiang River, a series of physical model experiments were carried out in this study to investigate the river morphology in unstable gravel-bed rivers under five different structural conditions, including no GCSs, solid bed sills and flexible TFPW with three different layout types. Data on bedform features, topography changes and the volume of erosion or deposition were collected and analyzed. The results indicated that dramatic general erosion and bed armoring would occur without any protection. The bed would be protected from upstream erosion with bed sills, but, at the same time, in addition to general erosion and bed armoring downstream of the structures, deep local scour might pose a serious threat to structural safety. TFPW had good protective effects on riverbeds by preventing the bed from erosion and even inducing sediment deposition both upstream and downstream from the structures. Because the flexible structures have advantages in ecology, structural stability and construction, TFPW were suitable and optimal for riverbed stabilization in unstable gravel-bed rivers.
1. Introduction
Both natural processes such as landslide damming [1,2] and anthropogenic causes such as dam construction [3,4], bed mining [5], land-use changes [6,7] and channelization [8] could destroy the relatively steady equilibrium states of rivers. In particular, gravel-bed rivers that flow from large-gradient mountain regions to low-gradient plains regions would become extremely unstable [9,10]. The instability of streambeds causes not only damage in riverbanks and other infrastructure but also failure of cross-river structures, such as bridges and underwater pipelines. Such mountain flood disasters occur in many unstable gravel-bed rivers from large-gradient mountain regions to low-gradient plains regions, and they urgently need to be prevented and controlled.
To stabilize riverbeds and riverbanks and to protect river crossing structures, grade control structures (GCSs) are usually constructed across the channel, and they are also called drop structures, stabilizers, weirs, barrages, check dams, or bed sills [11]. Traditionally, GCSs are impermeable or solid structures. Therefore, fluid jets are usually generated, leading to local scour downstream [12,13,14,15]. Then, the undermined foundation will pose a threat to the structure itself [16,17]. Although GCSs can protect fish habitat by preventing excessive riverbed degradation [15], they also constitute barriers for fish migration if they are high [8,18,19].
Among GCSs, check dams are 1.5–2 m above the original bed level, whereas bed sills are lower [20,21]. Both check dams and bed sills are widely used in alluvial mountain rivers [20]. In particular, bed sills are more widely used in the stabilization of gravel-bed rivers [22,23,24,25,26]. However, also due to the local scour downstream of the bed sills [27,28], the structure itself and even other structures in its vicinity, such as bridge piers, abutments, or bank revetments [29,30] might be undermined. Recently, flexible bed sills, named riprap bed sills [31,32] or rock sills [33], are extensively used in rivers to stabilize riverbeds, riverbanks and cross river structures and to enhance aquatic habitat. Although local scour might still occur downstream from the structures [33], benefited from the advantage of their good self-adaptability to the riverbed deformation, the flexible bed sills are an increasingly popular alternative to conventional GCSs. Extensive literature can be found on local scour downstream from bed sills, as well as on other impermeable high and low head GCSs. On the one hand, turbulent jets including horizontal and vertical jets, submerged jets, plunging jets and two- and three-dimensional jets could be found [13,14,16,18,21]. On the other hand, mostly from field and laboratory data, empirical predictive formulae that calculate the equilibrium depth and length of the scour holes are available in the literature [14,15,21,24,25,26,27,28,34].
Taking both hydraulics and ecology into consideration, flexible or permeable structures are proposed for constructing bed sills or weirs as new kinds of GCSs. In regard to the unstable gravel-bed rivers in piedmont areas, tetrahedron frames are chosen as the flexible materials to build low-head weirs for stabilizing the bed, and they are named tetrahedron framed permeable weirs (TFPW) in this study. A tetrahedron frame is a framed concrete component welded together by six identical reinforced concrete rods, and it has been used for the protection of bridge piers [34], central bars [35], groin and stilling basins [36], and even scour protection downstream from grade control structures [37]. Tetrahedron frames retard the flow and reduce the boundary shear stress, thus reducing the probability of sediment entrainment and even inducing sediment deposition [38]. With high permeability but also retarded flow, TFPW were proposed as a new kind of flexible riverbed protection structure in a mountainous river [39], and they had a significant effect on riverbed stabilization. In detail, TFPW can reduce the velocity, increase the water level, augment the roughness coefficient, protect the bed from degradation and promote sediment deposition. However, more details such as the bedform features under the protection of TFPW should be further understood. In addition, the applicability of TFPW in a piedmont unstable gravel-bed river rather than a mountainous river is still unclear.
In this paper, based on the field study of a piedmont river, the aim is to experimentally study the bed morphology of the unstable gravel-bed rivers under the protection of bed sills and TFPW. In Section 2, the general situation of the field study area and some hydraulic structures for bed stabilization such as bed sills in the Jianjiang River are presented. Then, we introduce the experimental methods in Section 3, where a total of five experiments under different structural conditions were carried out, including no GCSs, bed sills and TFPW with three different layout types. In Section 4, we show the experimental findings regarding the bed morphology characteristics (including the bedform features, topography changes, erosion and deposition) under different structural conditions. Finally, we discuss the effects of bed sills and TFPW on water flow and bed morphology.
2. Field Study
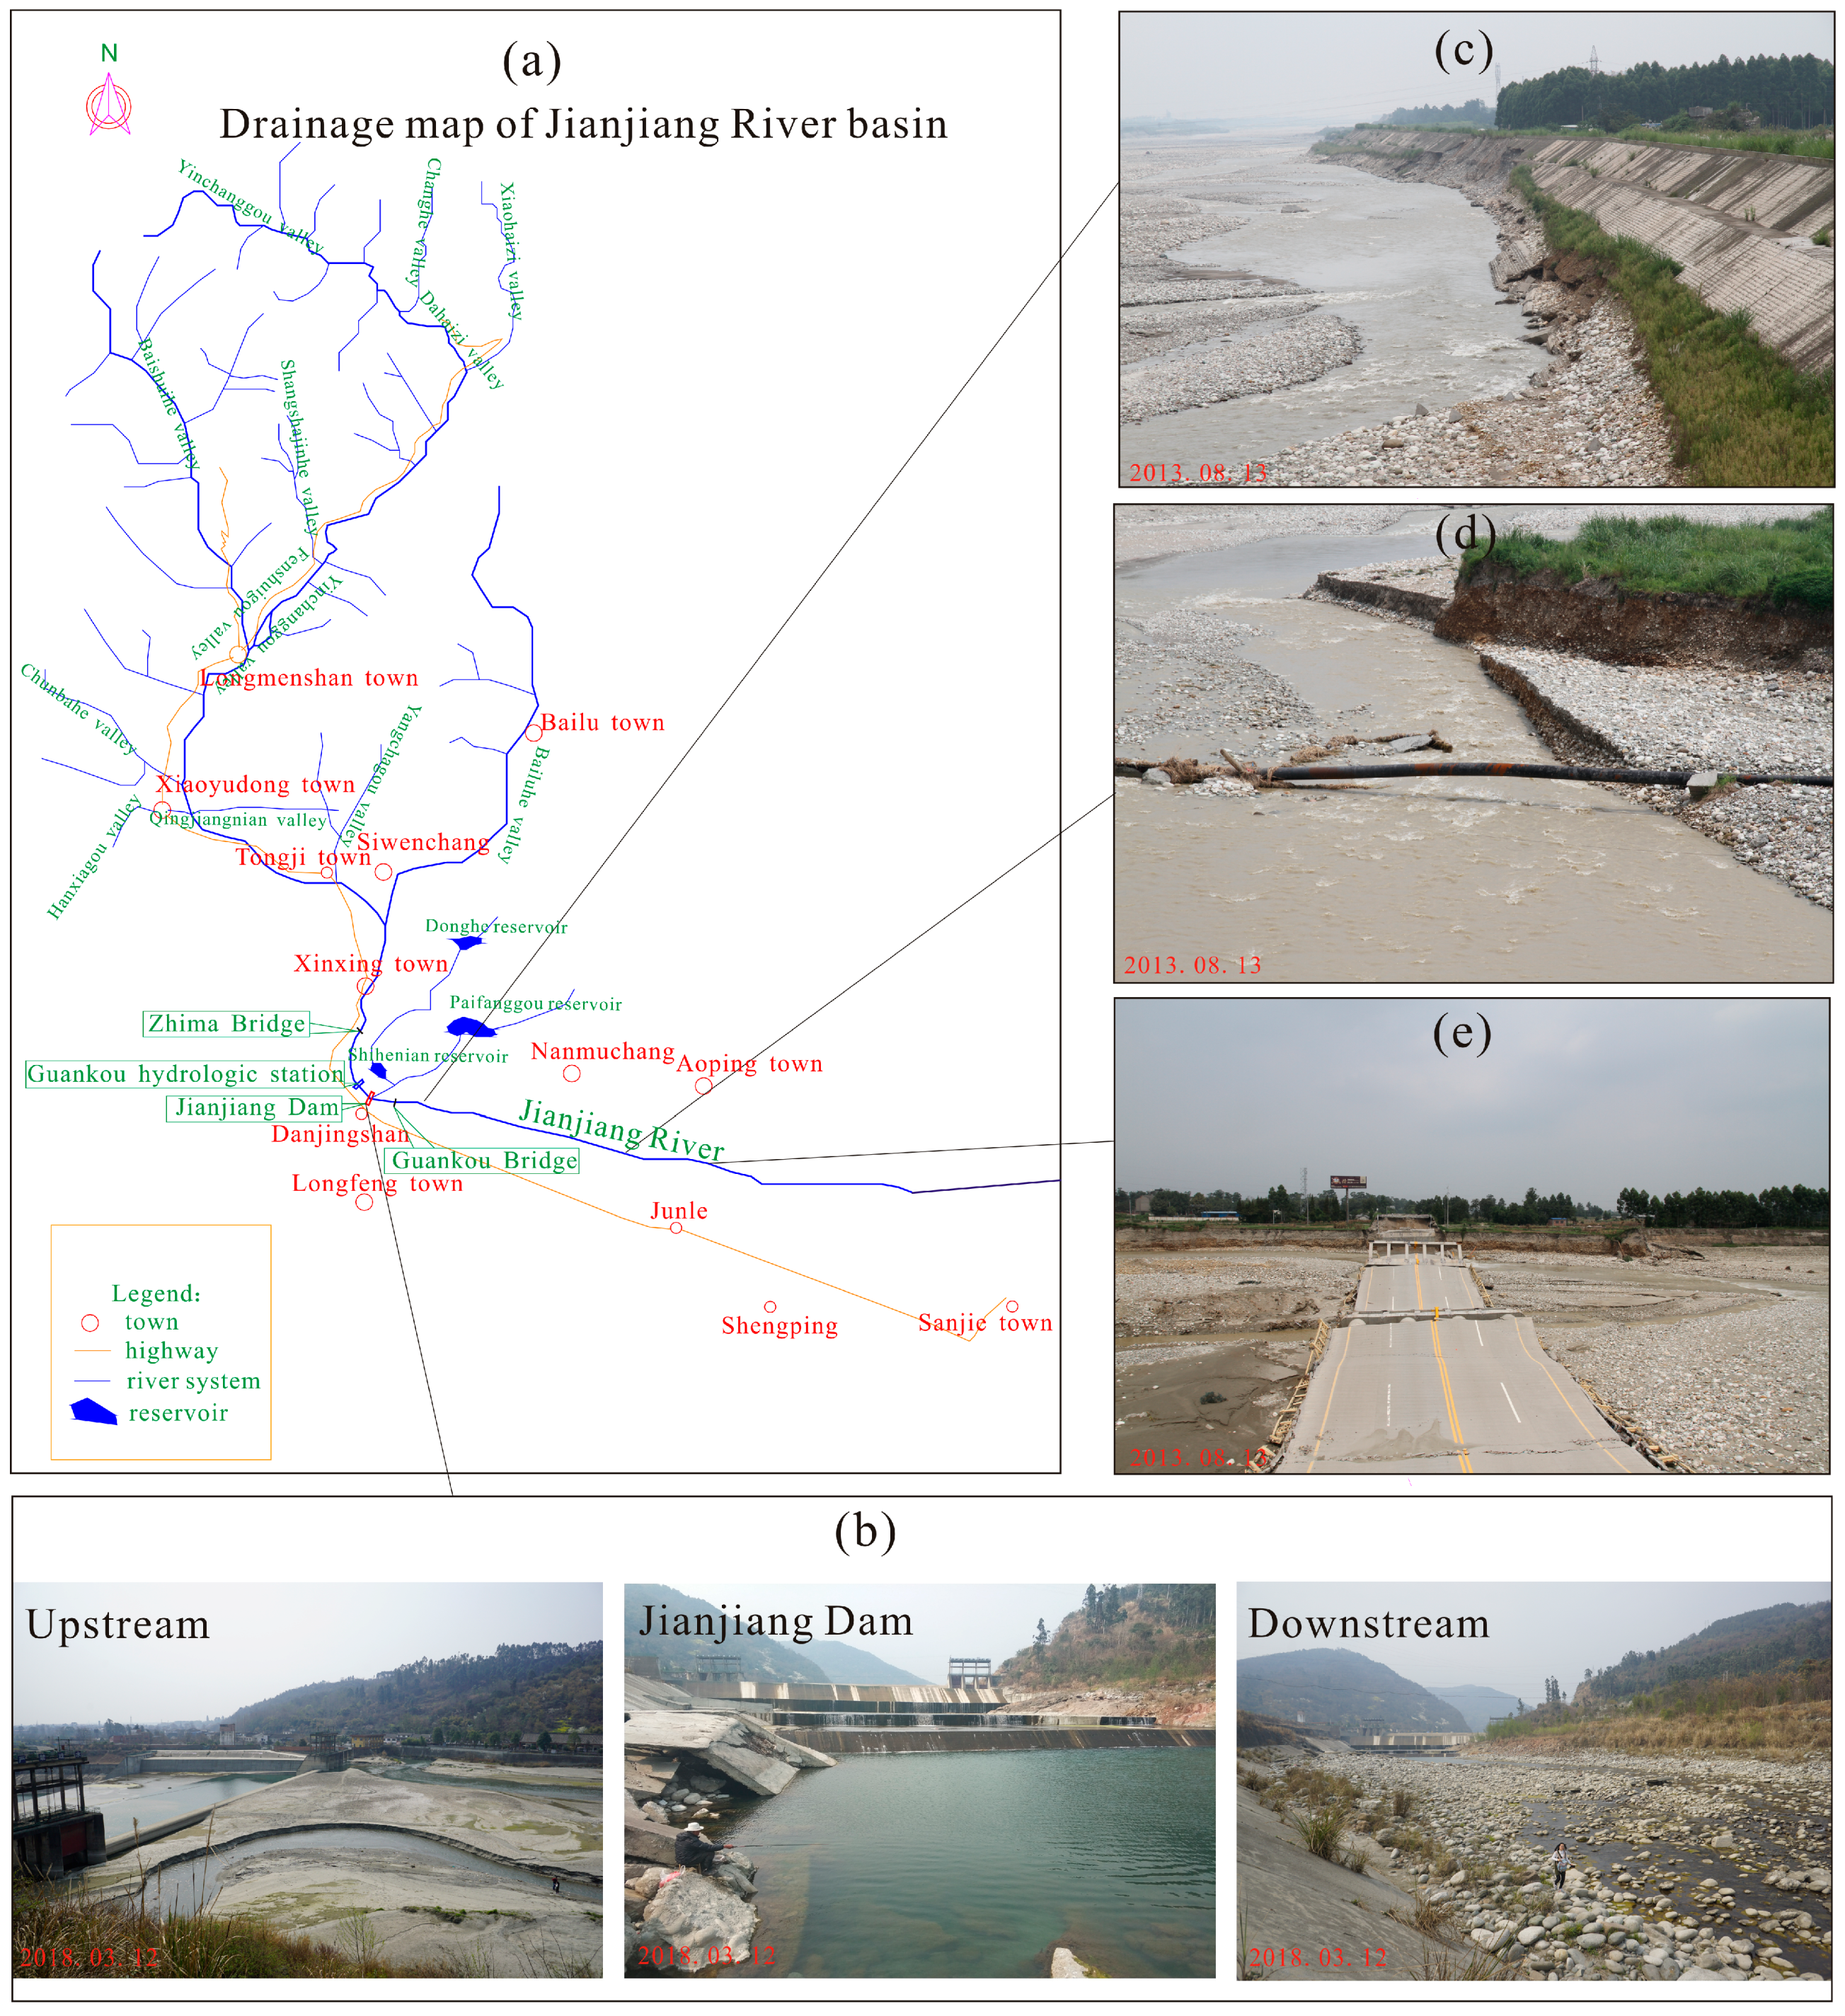
The study area is the plain reach of the Jianjiang River. The Jianjiang River originates from Longmen Mountain and flows to the Chengdu Plain, which converges with the Shiting and Mianyuan Rivers to form the Tuojiang River, which is a tributary of the Yangtze River [10]. The Jianjiang River covers a catchment area of 2808 km2 and has a length of approximately 120 km. The natural head of the Jianjiang River is 3500 m, causing a high stream gradient of 29.2‰. The landforms along the Jianjiang River are quite complex, including transition zones from high, middle, and low mountains to hills and plains. The two main landscapes are mountains and plains divided by the Guankou hydrologic station. Downstream from Guankou, the river flows into the Chengdu Plain, with a length of 55 km and a gradient of 5‰. In the plain reach of the Jianjiang River, the river course is wide and straight, extending from the west to the east. The width is approximately 300–500 m, with floodplains and terraces on both sides. The drainage map of the study area is shown in Figure 1a. The bed materials of the stream consist of granite and quartz sandstone boulders, pebbles and gravel with a subordinate proportion of sandy particles.
The floods in the study area have the general characteristics of flash flood in mountain areas, such as that many tributaries join the Jianjiang River and that both a sharp rise and a great fall of the water level in the stream occur within a short period of time during the heavy rains. They usually break out in summer, especially in July and August, with a flood commonly lasting one or two days. According to the measured data from the Guankou hydrologic station, the annual maximum flow is over 2000 m3/s, whereas the minimum flood peak flow is 128 m3/s. However, the average annual discharge is only 22.6 m3/s. In this study, the discharge of a two-year flood was selected as the prototypical discharge, which was 1140 m3/s.
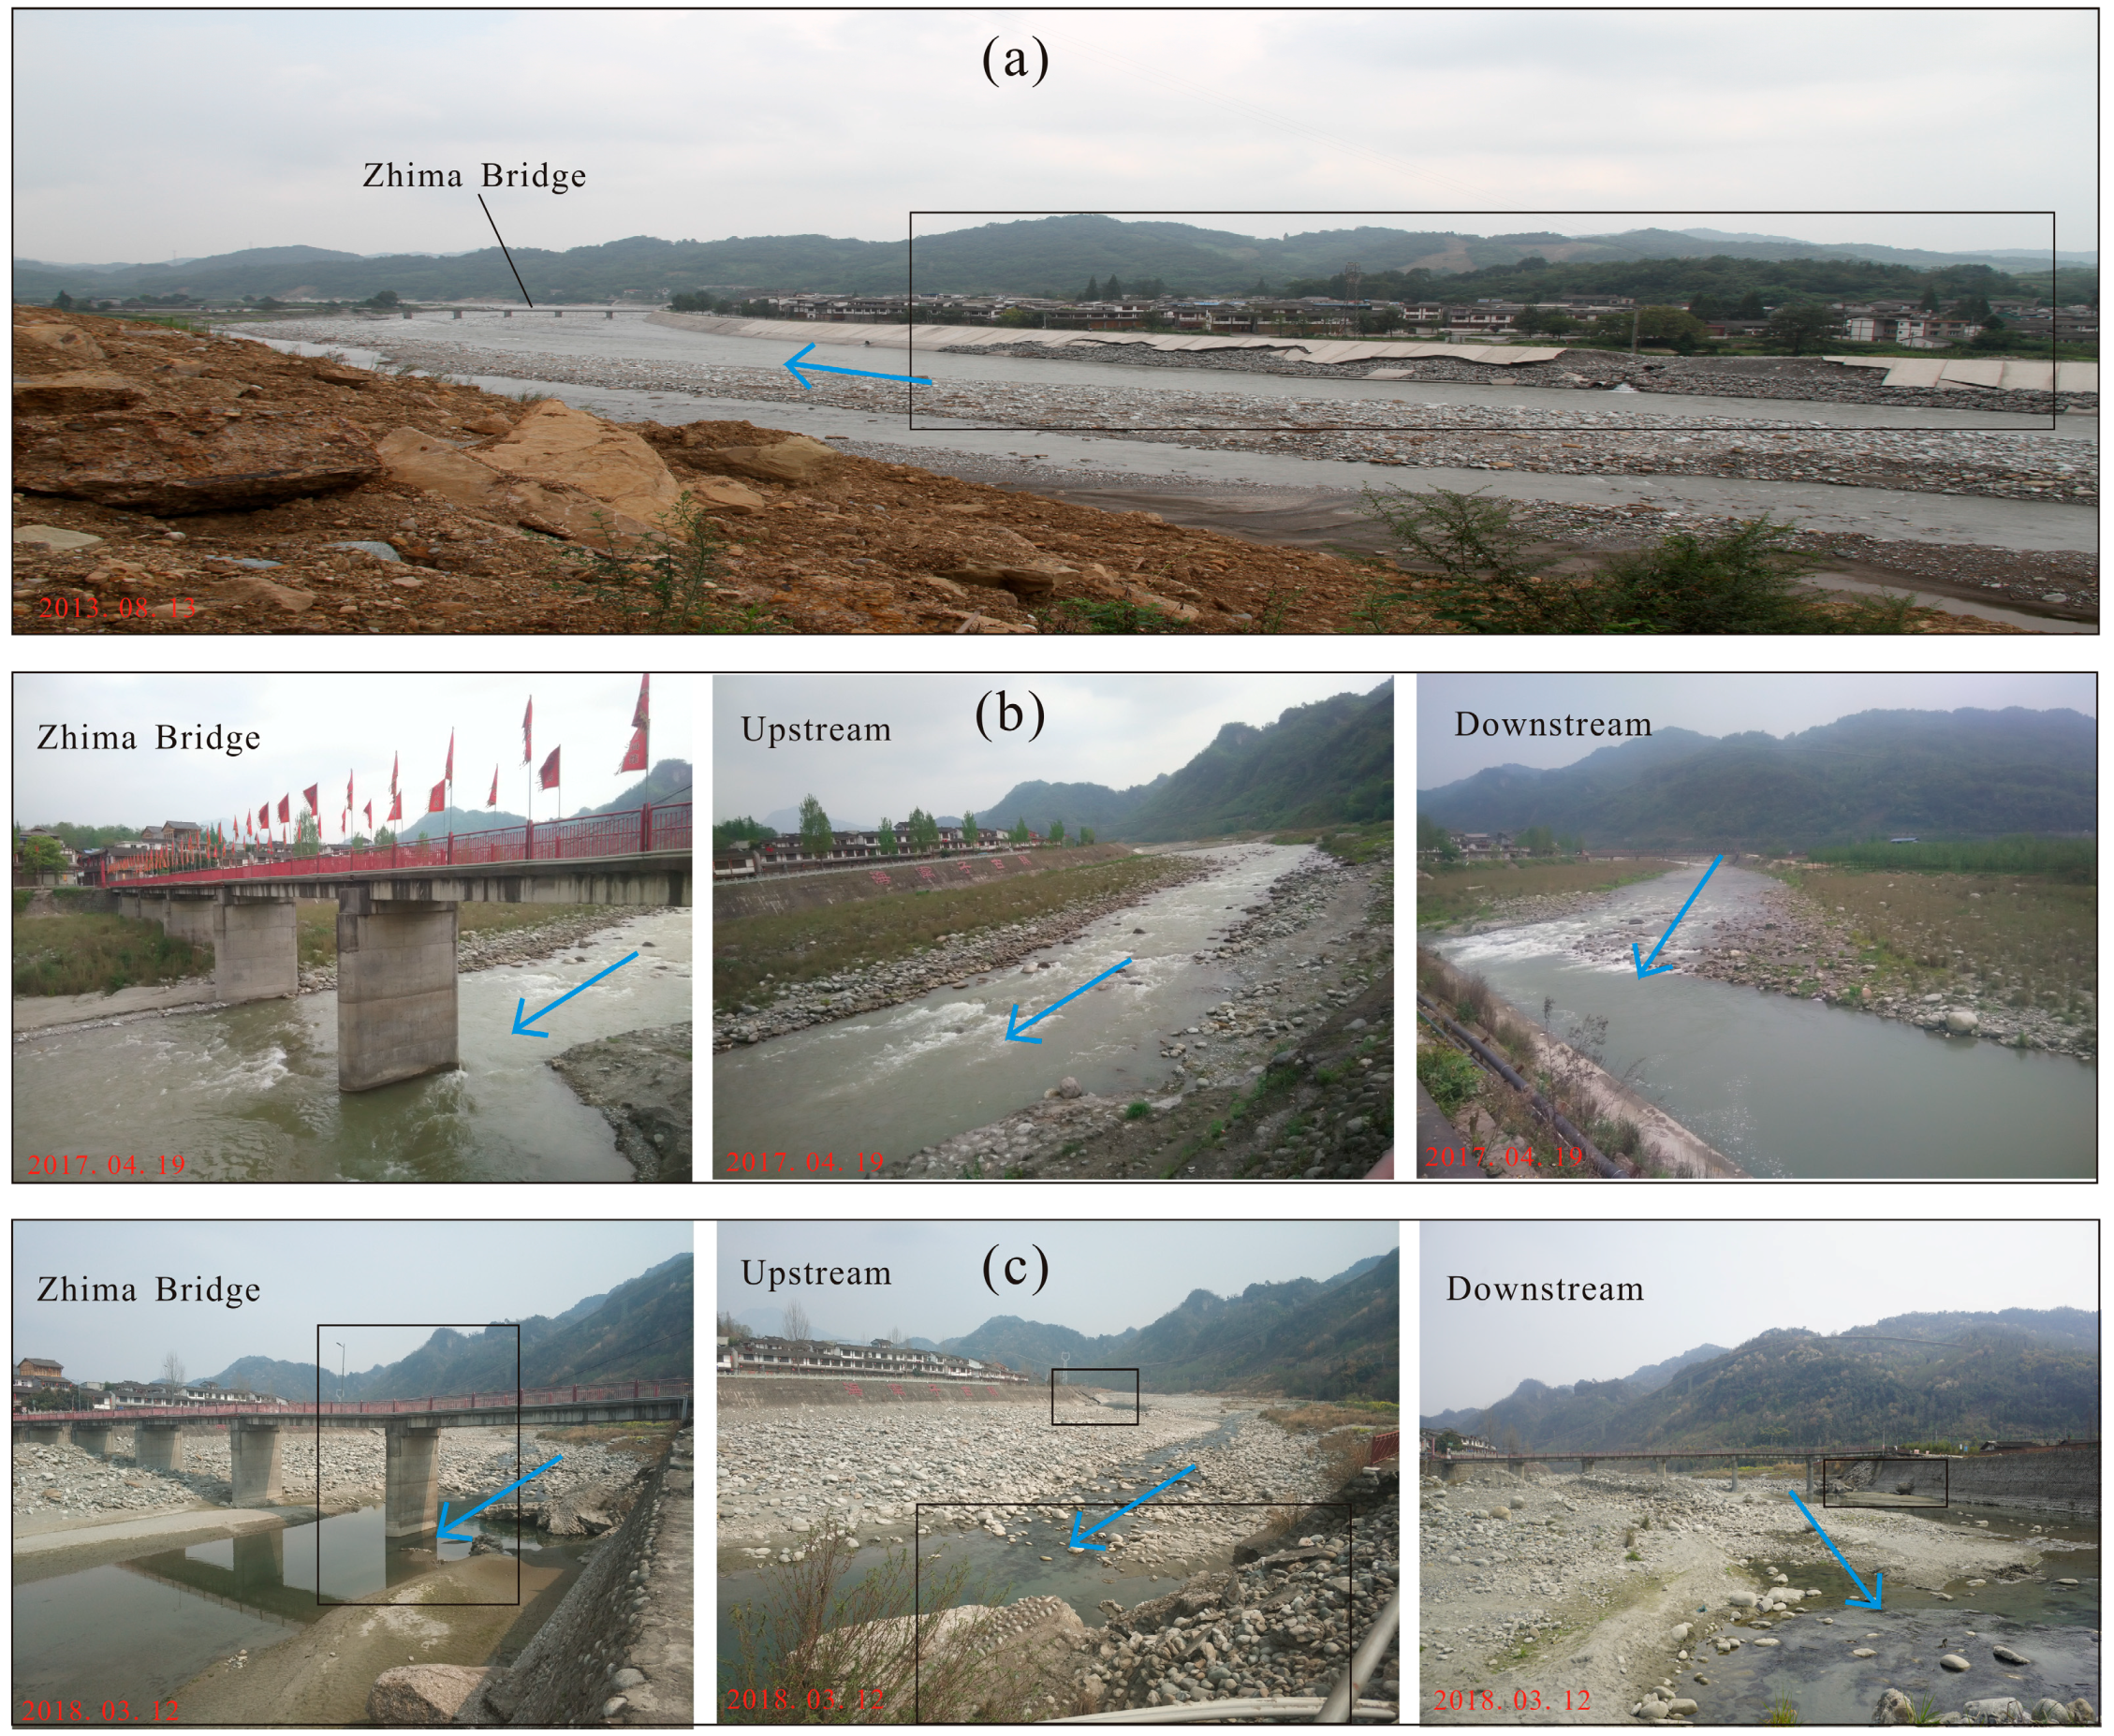
Downstream from the Jianjiang Dam, clear water scour occurred because of the serious shortage of sediment supply from dam interception and excessive sand extraction (Figure 1b). More seriously, dramatic erosion occurred in the piedmont section leading to the failure of embankments, bridges and pipelines. Figure 1c,d shows the flood damage scenes in the Jianjiang River after the “9 July” flood in 2013. According to the investigation, 10 villages and towns were hit by the flood, 25.14 km of embankments were destroyed in total, and nearly 200 million Yuan was lost. Among the damage, downstream of the Jianjiang Dam, 13.68 km of embankments were destroyed. The average undercutting depth was nearly 5 m. Similar phenomena could be observed in both the Shiting and Mianyuan Rivers [10]. After the “9 July” flood in 2013, another catastrophic flood disaster occurred in the summer of 2017, causing the failure of the Zhima Bridge and river embankment destruction (Figure 2). It was discovered that approximately 4.5 km of embankments along the Jianjiang River were destroyed during the flood disaster in 2017, despite being reconstructed in 2014. The unstable gravel-bed river should be stabilized to avoid more flood disasters and property loss.
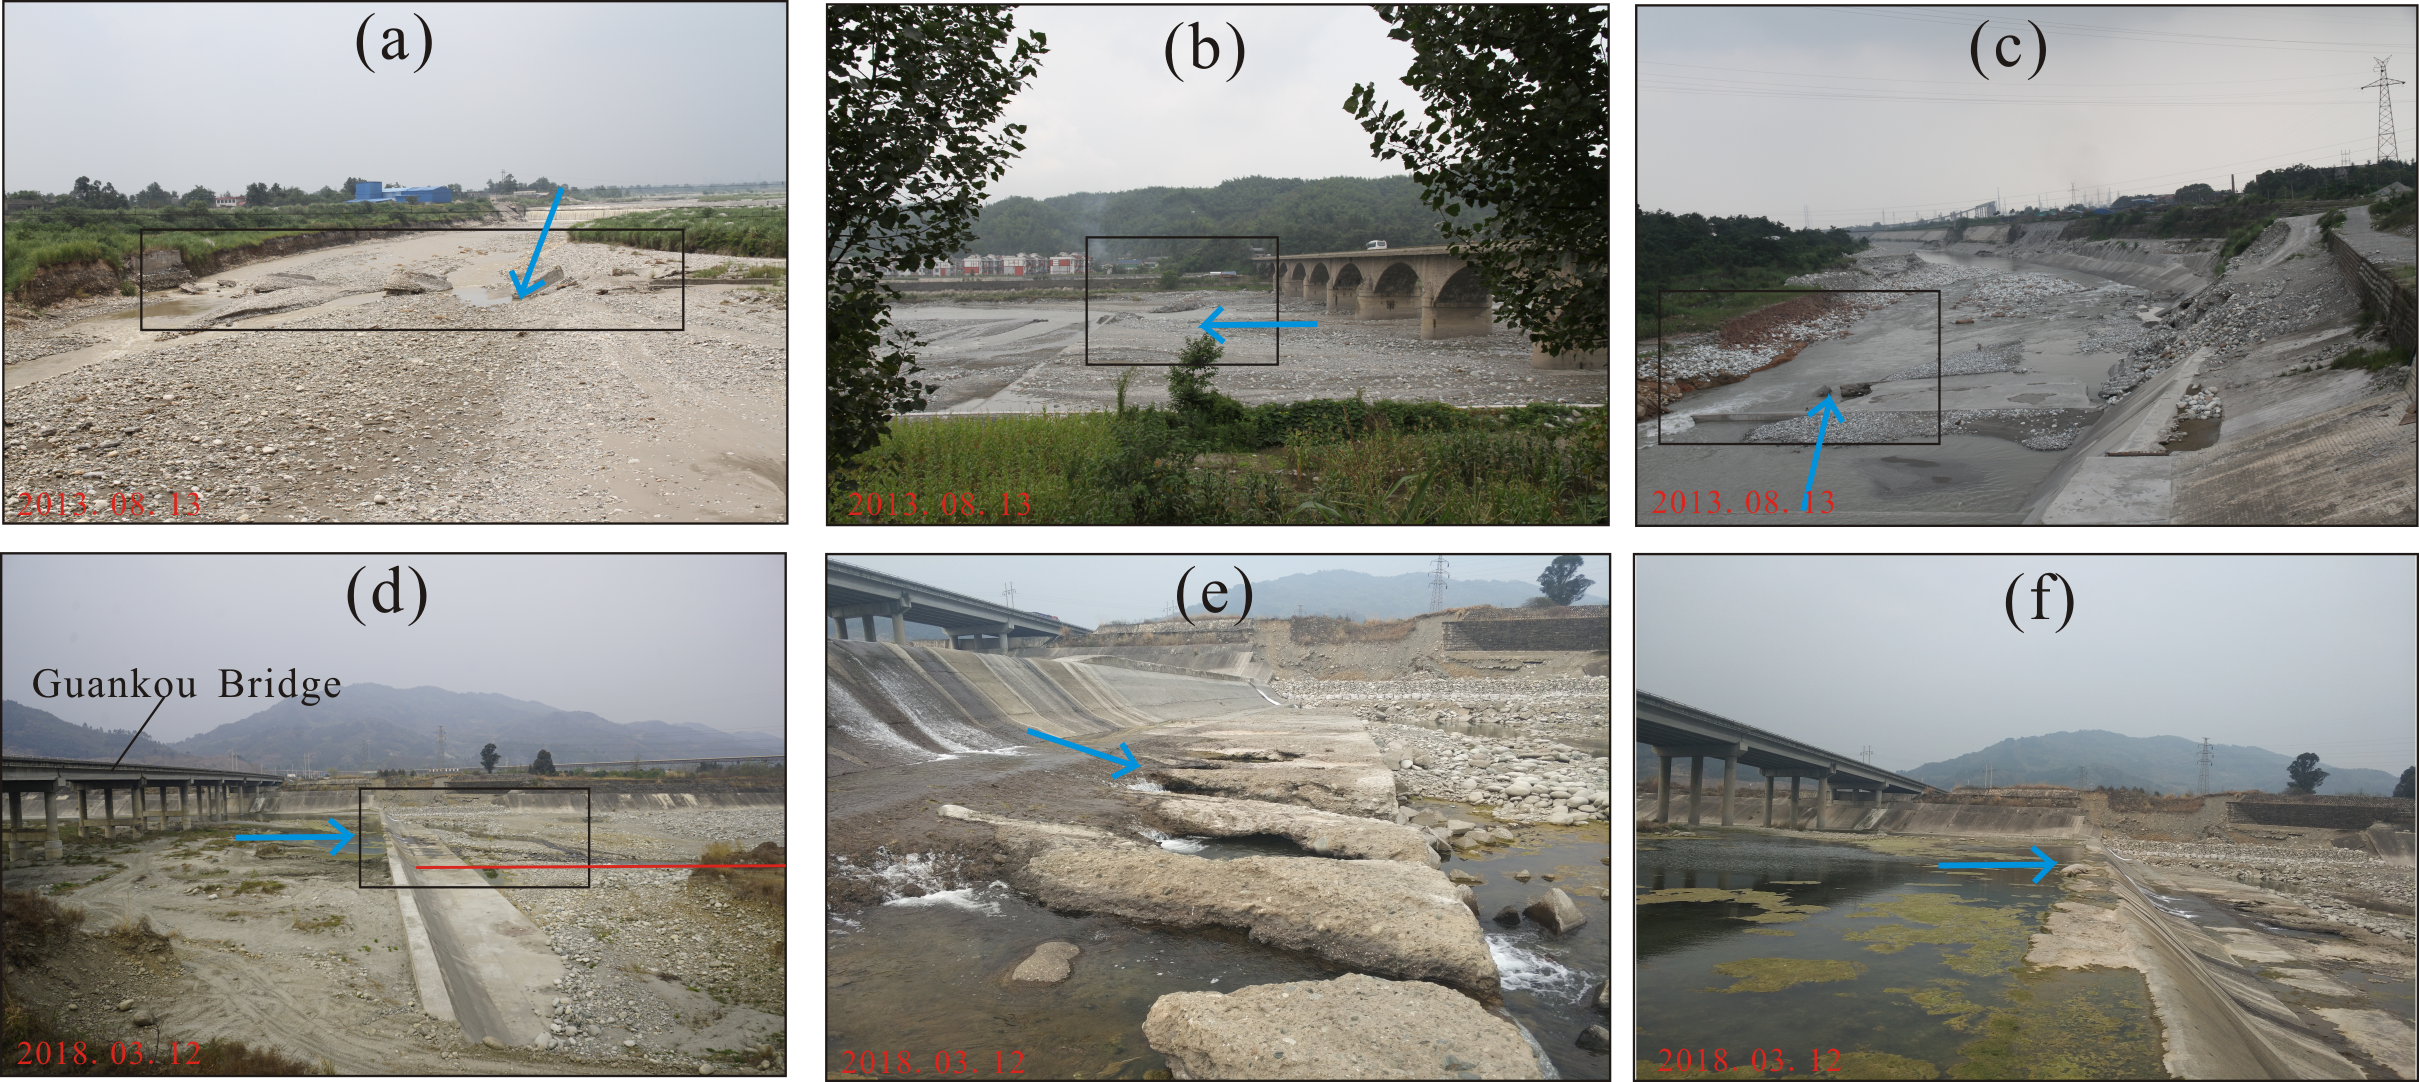
To intercept the bed sediments and improve the erosion key point, bed sills were built in the unstable piedmont reach of the Jianjiang River. However, either the thin or the broad sills were destroyed because of local scour downstream from the structures. Figure 3a–c shows the broken bed sills for stabilizing riverbeds downstream from weirs, bridges and dams in the Jianjiang River after the “9 July” flood in 2013. Moreover, as shown in Figure 3d–e, a bed sill for the pier protection of the Guankou Bridge was newly built after the “9 July” flood in 2013. However, upstream of the bed sill, finer sediments silted up, whereas serious local scour and general erosion occurred downstream from the structure. The scour was caused by jets when floods flew through the impermeable concrete sills even though in the low-water season, the local scour holes would be deepened by trickles. In addition to the destructibility of the solid sills, a lack of ecological friendliness is another major disadvantage by creating barriers for fish migration. Considering the advantages of safety and ecology, flexible structures are urgently proposed for bed stabilization.
3. Experimental Methods
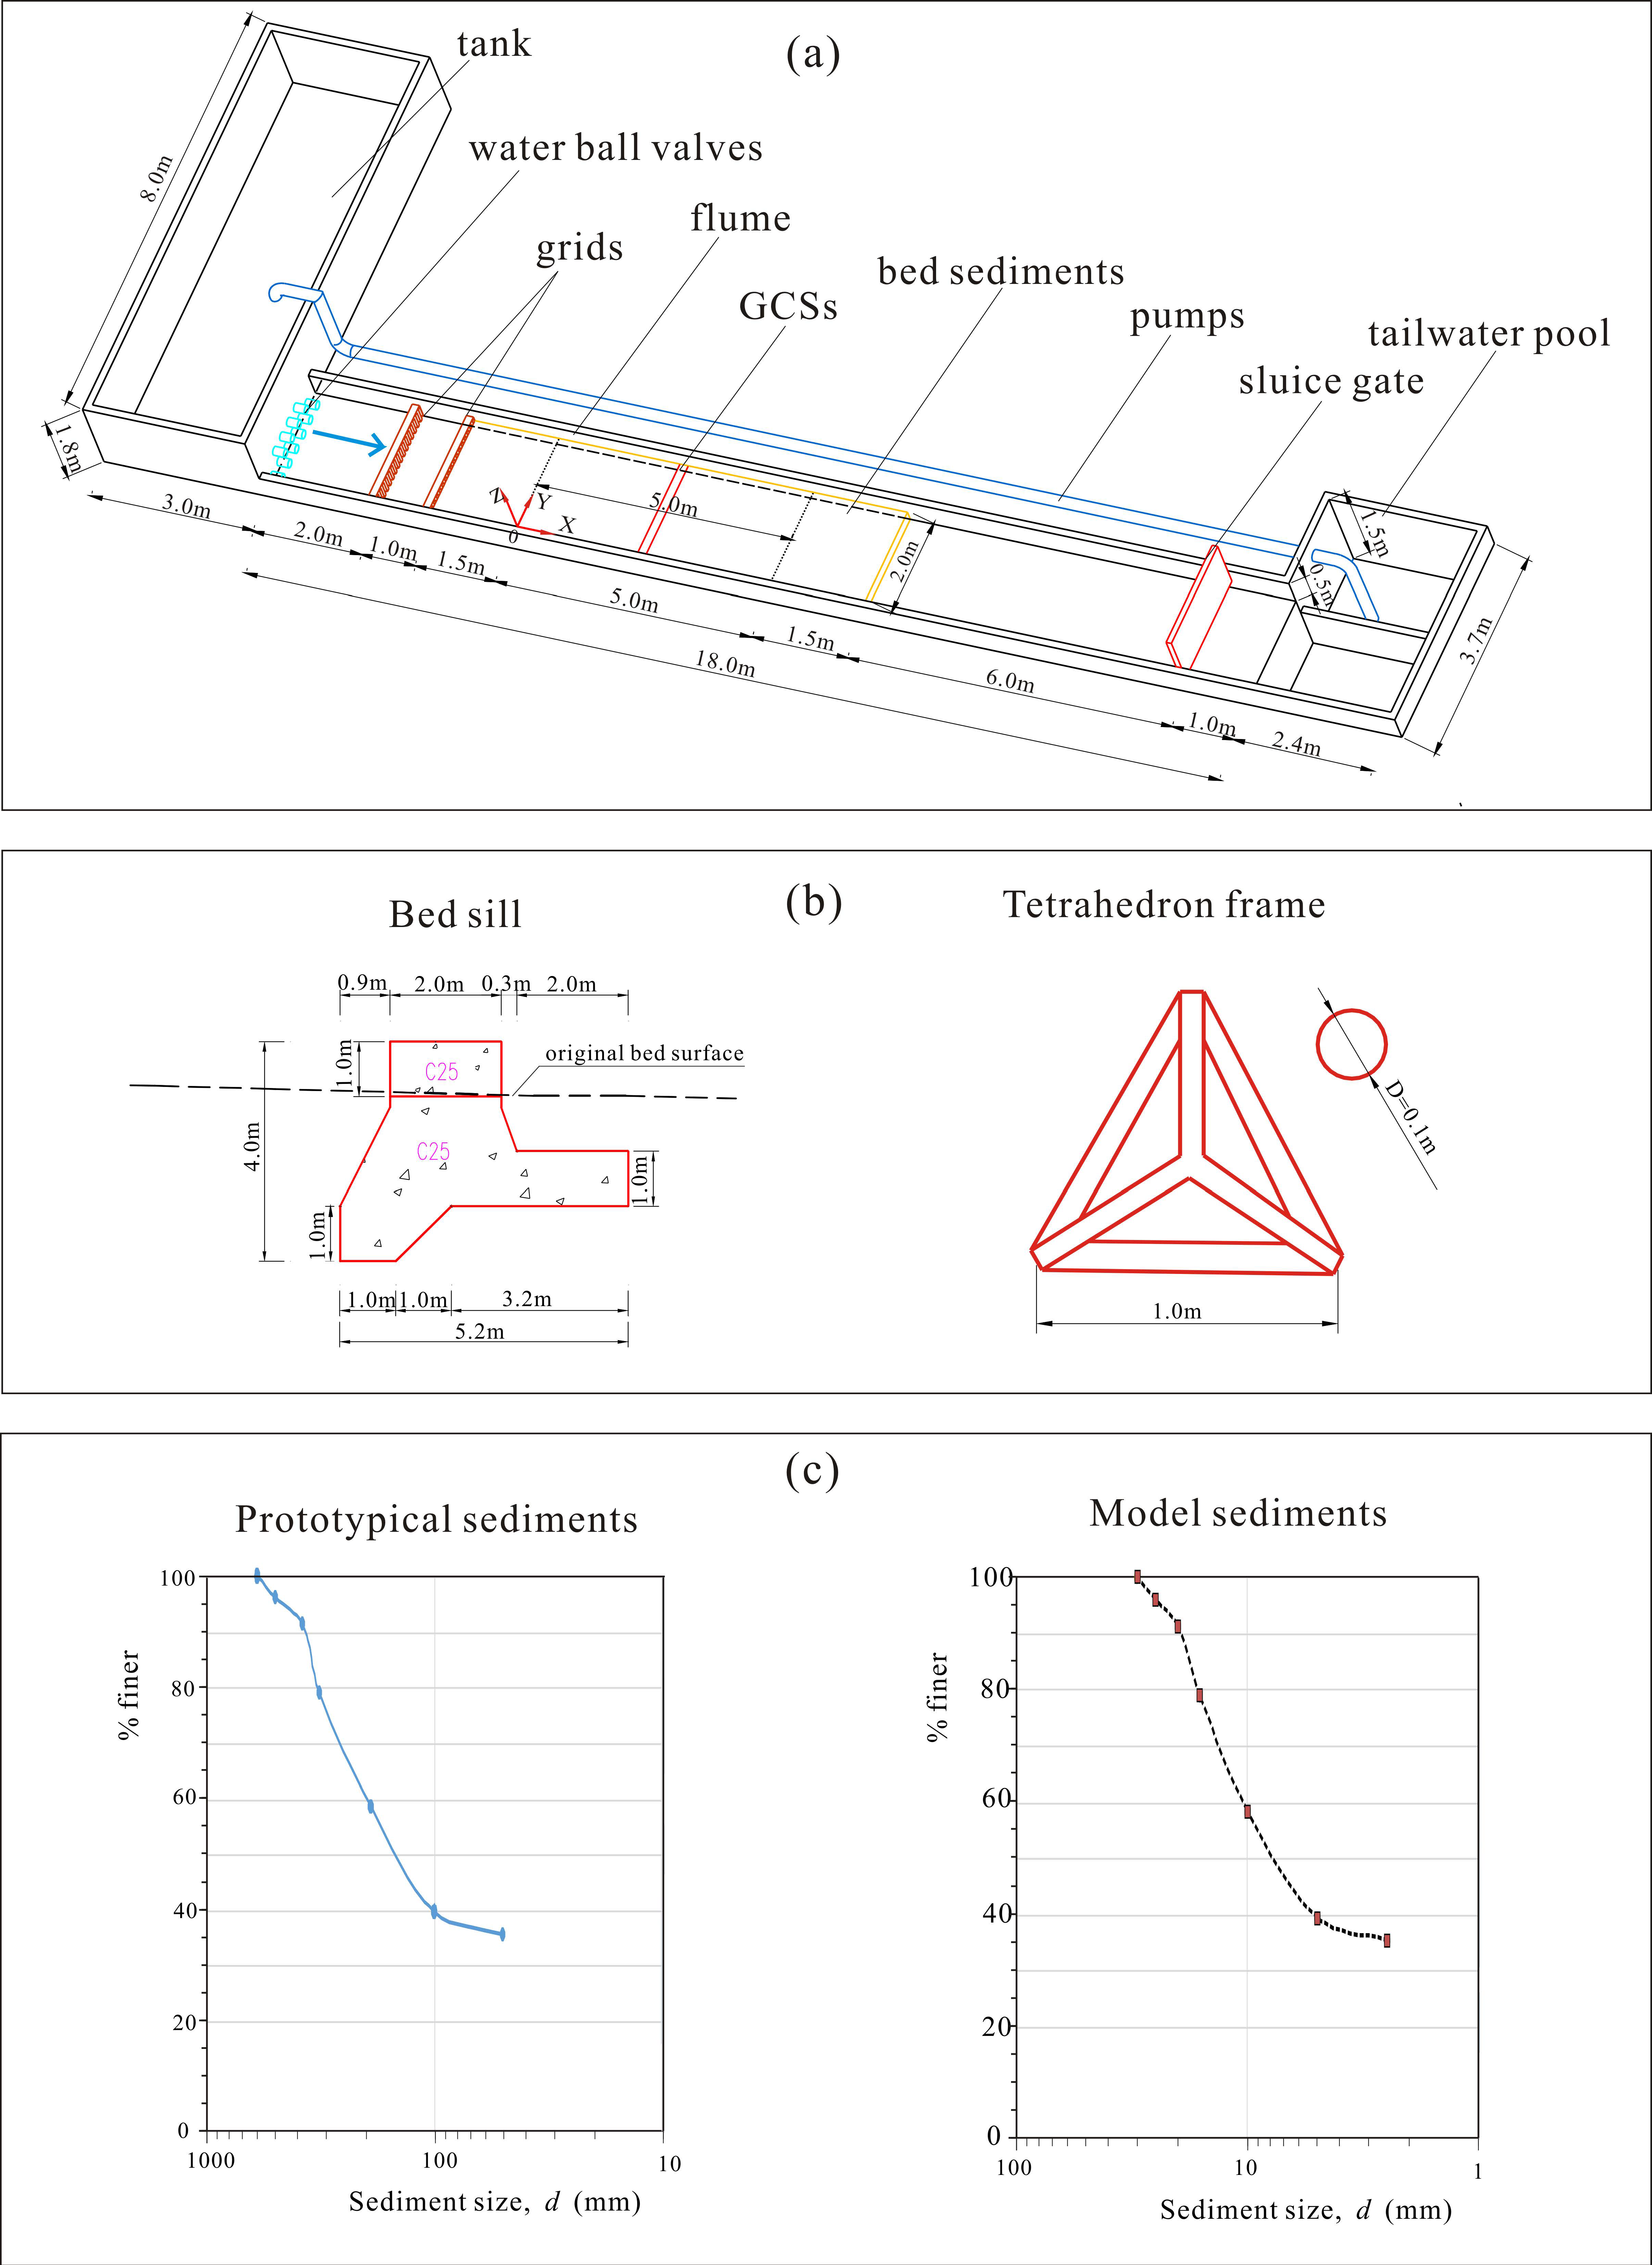
To optimize the hydraulic structures for river sediment control and bed stabilization in unstable gravel bed rivers, based on the prototype data of the plain reach of the Jianjiang River, a series of flume experiments were carried out to study the effects of solid bed sills and flexible TFPW on the bed morphology. The selected model scale was 1/20. All tests were conducted under clear water conditions.
3.1. Experimental Apparatus
Tests were carried out in a flume with a width of 2.0 m, a length of 18.0 m and a depth of 0.5 m. Two-staged grids for energy dissipation were installed in the head reach of the flume. Then, the lower section was filled with sediment particles. Figure 4a shows the schematic representation of the experimental apparatus. The channel slope was 5‰, which represents a typical riverbed slope in piedmont rivers. The test section was located 4.5–9.5 m from the starting point of the flume. A tank (1.8 m deep with 8.0 m × 3.0 m of surface area) with 10 water ball valves supplied the approaching stable flow. A tail water pool (1.5 m deep with 3.7 m × 2.4 m of surface area) collected the water, and four diving pumps (among which two had capacities of 33.3 L/s and 83.3 L/s and the other two were both 116.7 L/s) were used for providing all the experiments with circulating water. An adjustable sluice gate at the end of the channel was used to control the tail water depth.
3.2. Structures and Bed Sediment
The GCSs were placed perpendicular to the flow, whose crests extended across the channel. The traditional bed sills are concrete structures, a typical cross section of which is shown in Figure 4b. In this study, solid bricks were arranged as the model bed sills (11.5 cm wide, 5.3 cm above the bed and 5.3 cm below the bed level, respectively). Geometric similarity was followed when choosing the frame models, also with a proportional similarity of 1:20 [39]. The tetrahedron frame model consisted of six identical bars (the length was 5.0 cm). With a circular cross-section diameter of 5 mm, aluminum wires were alternatives for iron wires whose density was closer to that of reinforced concrete (the density of reinforced concrete is approximately 2.6 g/cm3, and the density of aluminum is 2.65 g/cm3, whereas that of iron is 7.8 g/cm3). The sketches of prototype tetrahedron frames are also shown in Figure 4b. The tetrahedron frames were thrown together randomly or paved in an orderly manner to build permeable weirs.
The sediments with a wide size distribution on the Jianjiang River floodplain were taken as samples. As shown in Figure 4c, to simulate gravel beds in piedmont rivers, based on the particle size distribution curves of the prototype sediments, the bed of the flume was covered by non-uniform sediments (relative density s = ρs/ρ = 2.65, geometric standard deviation σ = (d84/d16)0.5 = 3.4 and median value of the particle diameter d50 = 7.5 mm (where ρs is the density of bed material; ρ is the water density; d84 and d16 are 84%, and 16% finer diameters, respectively)). Figure 4c shows both the sediments in the Jianjiang River and the model bed sediments. The thickness of the bed material is approximately 0.20 m.
3.3. Experimental Groups and Procedure
A series of experiments were carried out under different structural conditions, including no GCSs, bed sills, and TFPW with different layouts. It has been investigated experimentally that the random Double TFPW and the paved Single TFPW were suitable and optimal for riverbed protection in mountainous rivers [39]. Further, the bed morphology under the protection of random Single TFPW (TFPW I), random Double TFPW (TFPW II) and the paved Single TFPW (TFPW III) in a piedmont river were observed in this study. In detail, the random Single TFPW is a single grade permeable weir by throwing tetrahedron frames together randomly (Figure 5d); the random Double TFPW means double grade weirs by throwing tetrahedron frames together randomly (Figure 5e); and the paved Single TFPW is a single grade weir with a broad crest that is paved by an orderly layer of tetrahedron frames (Figure 5f). Five different conditions were tested. Table 1 shows the structural properties of the experiments. To simulate the floods, the experiments were conducted under submerged conditions. In the study, the aspect ratio of the channel is high (B/h ≈ 10, where B is the width of the flume, and h is depth of flow), so the flow field can be treated as two-dimensional open channel flow. The flow Froude number Fr = U/(ghd)0.5 was calculated in this study, where U is the depth-averaged flow velocity, g is the acceleration due to gravity, and hd is the hydraulic depth (which was equal to the flow depth). The average Froude numbers upstream from bed sills, TFPW I, TFPW II and TFPW III in the reach between X = 0 m and X = 2.5 m were 0.26, 0.28, 0.31 and 0.28, respectively.
At the beginning of each test, the channel bed was carefully paved, and the GCSs were installed in the middle of the test section. After the bed sediments were fully submerged by still water, the bed morphologies before scouring were measured. Then, during approximately two hours of scouring, the flow characteristics under different GCS conditions were observed once the equilibrium states were reached. Finally, the bed features were carefully surveyed once again after scouring. In addition, to maintain the same gradation curve of the original bed, the bed materials were mixed after each experiment for the next test.
3.4. Data Collection and Processing
The discharge flow was controlled by a calibrated tank with a precision of ±0.1 L/s, which ranged from 83.3 L/s to 116.6 L/s between each experiment. A point gauge with reading accuracy of ±0.1 mm was used to read the water levels and the bathymetry of the mobile bed. The average flow velocity along the central axis of the flume was measured by photoelectric propeller current meters. Both before and after scouring, the streambed features were carefully observed, and the bed sediment characteristics were analyzed by sieving. The bed morphology was measured with a 2-D automatic topographic meter with precision of ±0.1 mm, and the bed elevation both before and after scouring was recorded point by point along each section. The point distance was 20 cm along the downstream direction (X direction), and the section distance was 10 cm along the transverse direction (Y direction). The grids of elevation measurement points can be seen in Figure 5. The volume of deposition or aggradation was calculated as
where m is the number of subsections along the downstream direction (here, m = 26); n is the number of subsections along the transverse direction (here, n = 19); A is the area of every grid, which is 0.02 m2; and is the relative magnitude of elevation change, whose mean value could be calculated by averaging the four values in the corners of every grid.
4. Results
4.1. Bedform Features
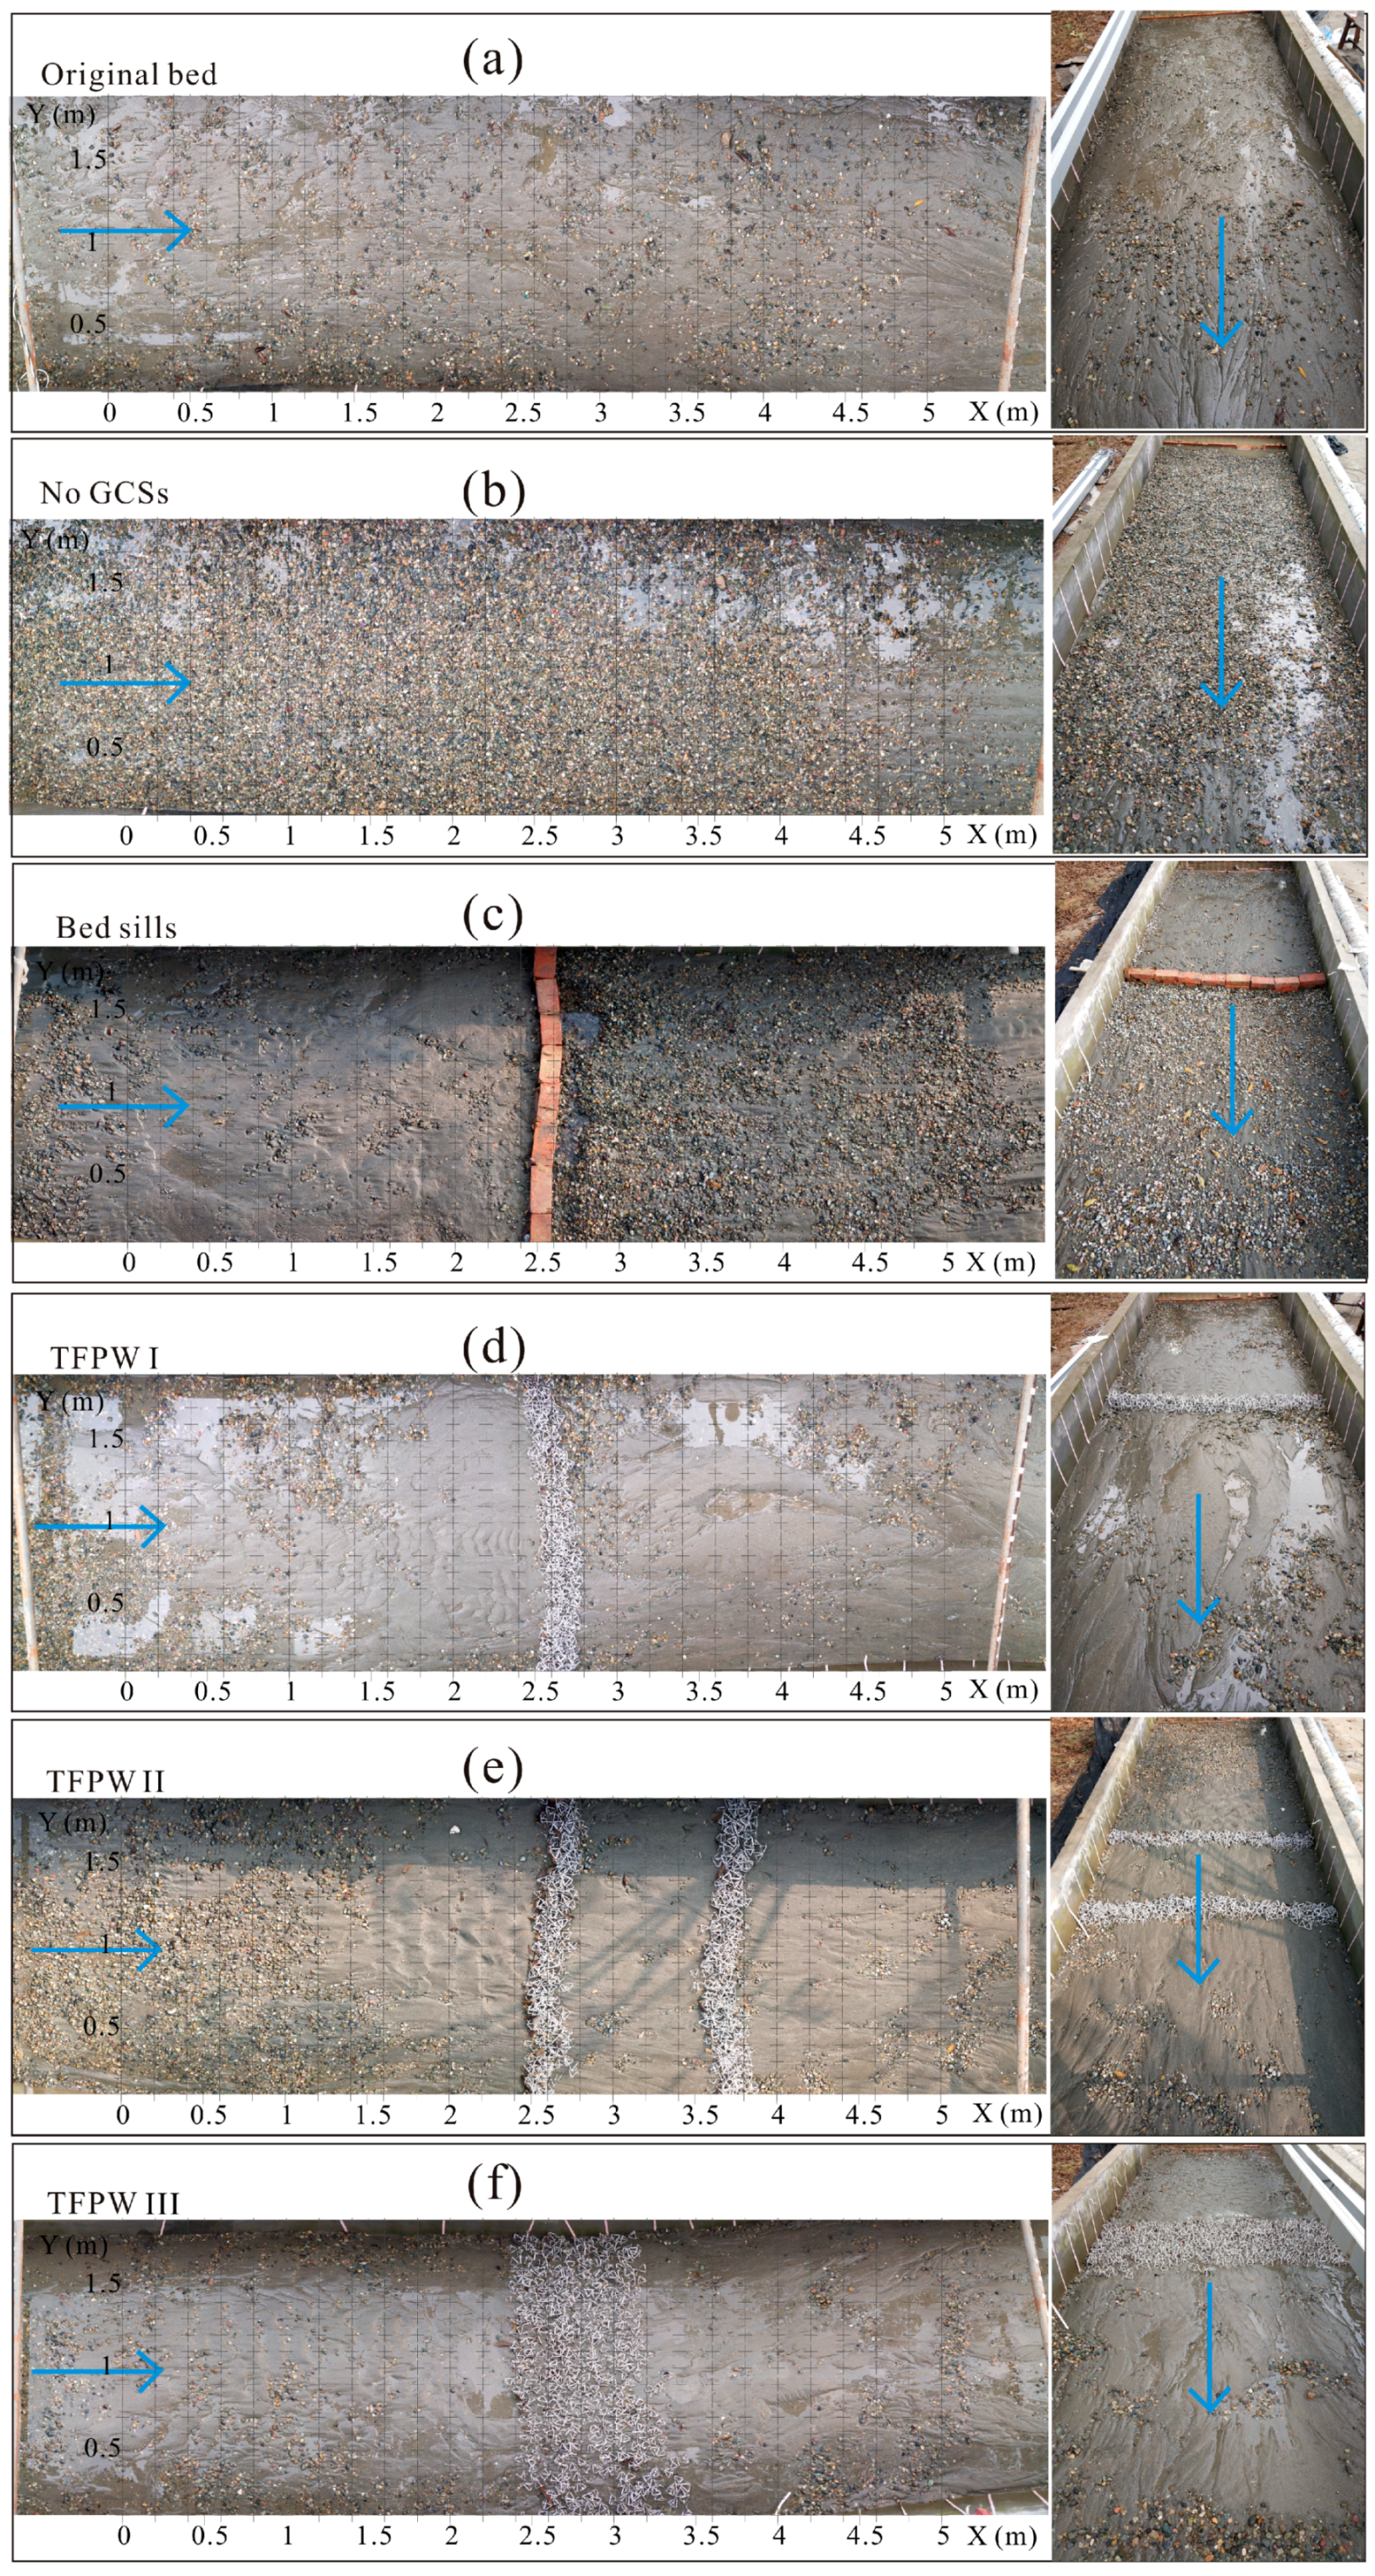
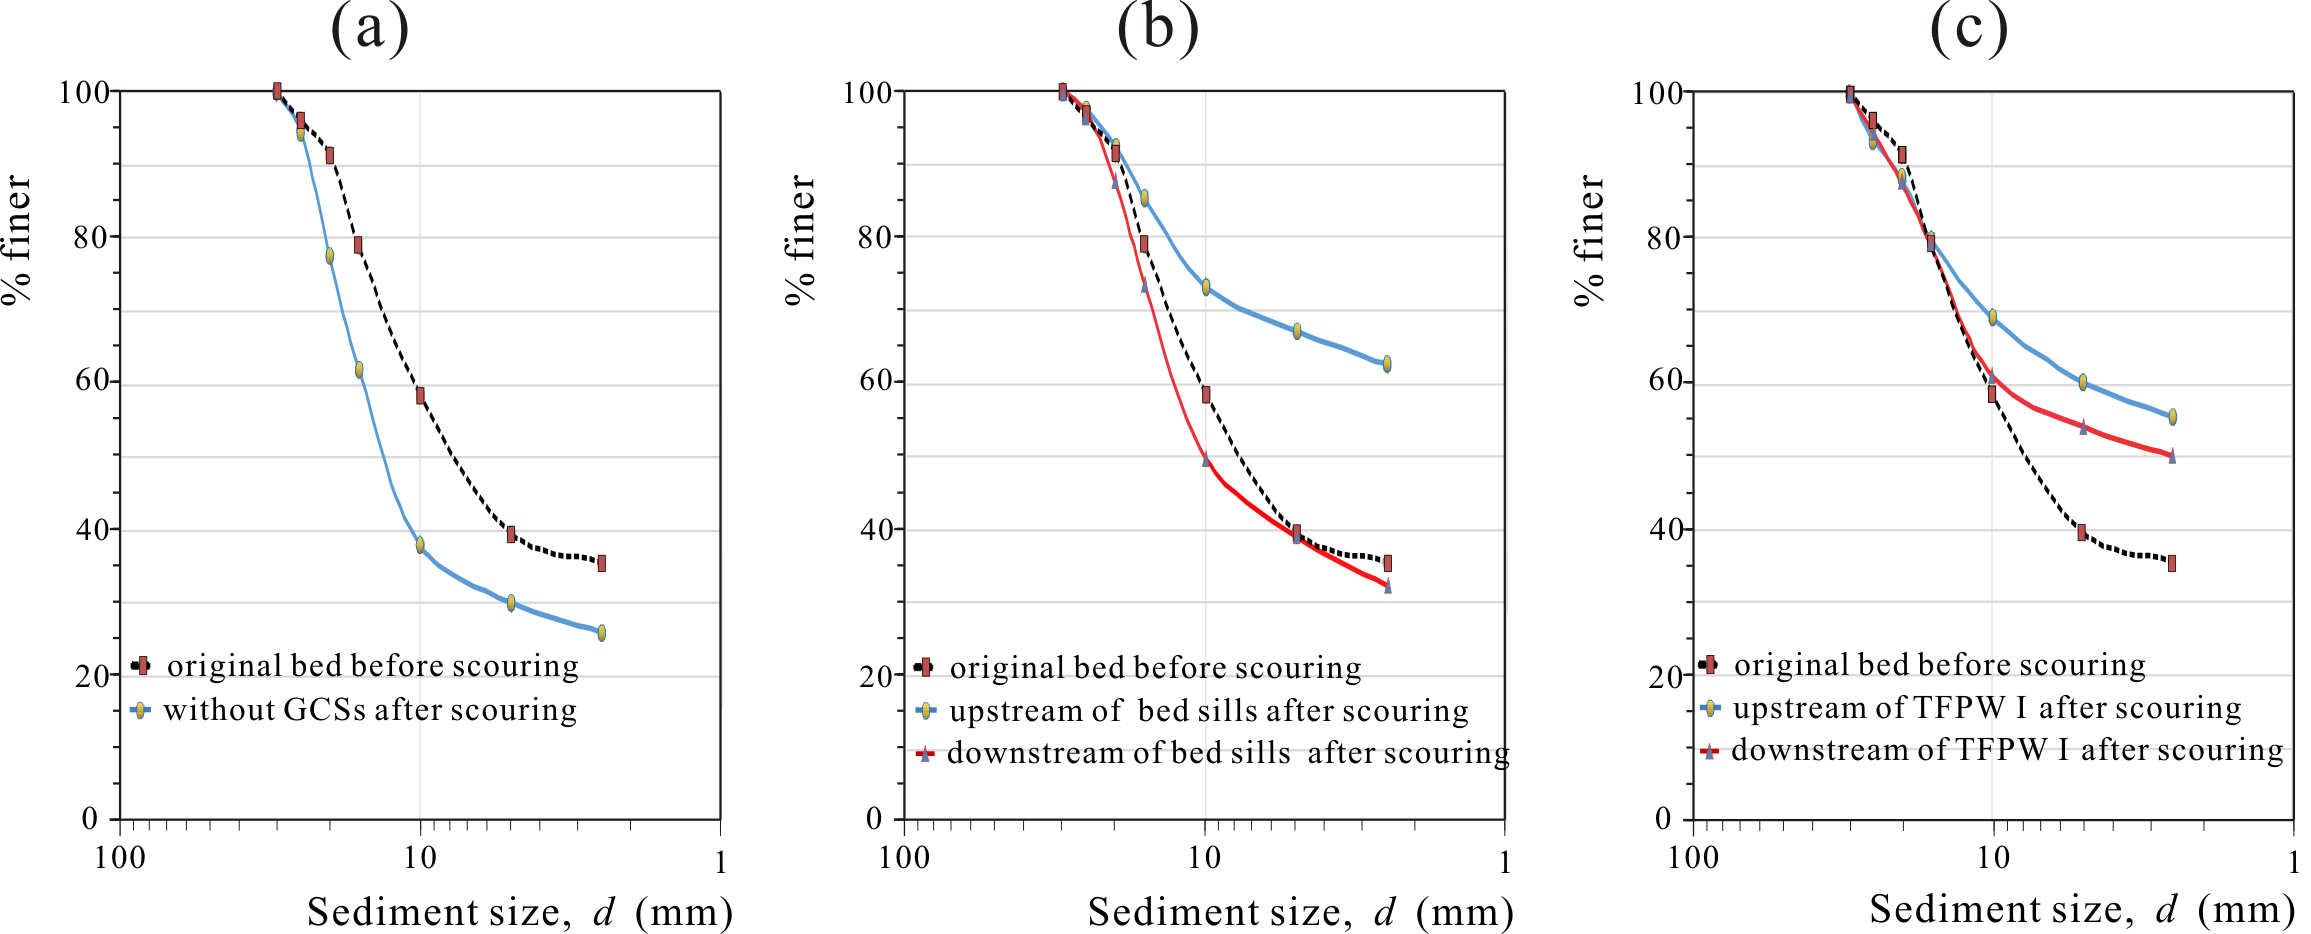
The bed features were carefully observed. The original bedform was flat, with a wide size distribution of bed materials (Figure 5a). Without any structures, the whole riverbed would be visibly armored under clear water conditions. The sand and finer sediment were washed away, leaving the armoring layer in the flume, as shown in Figure 5b. The bedform stayed almost planar without the disturbance of any structures. The cumulative frequency curve of bed materials after scour clearly became much steeper than that of the original bed, which indicated the bed surfaces were typically coarsened (Figure 6a).
The bedforms after scour under protection of bed sills are shown in Figure 5c. The sediments were intercepted by the impermeable sill, resulting in deposition upstream from the bed sill. Downstream from the structure, however, both general erosion and local scour could be observed, where finer sediments were washed away. The scour holes were located in the toe of the bed sill. A wide scour hole was located close to the left side, and a chain of holes was located from the right side to the center of the flume. It was observed from the cumulative frequency distribution that only the sediments upstream from the bed sills became finer, whereas the bed materials became much coarser downstream from the sills (Figure 6b).
The bedforms became more complex when protected by TFPW with different layout types. When protected by TFPW I, the sand would be washed downstream, and more gravel would be exposed in a faraway area upstream. However, the sand was deposited upstream from TFPW I, and ripples could be found close to TFPW I. Downstream from TFPW I, bars and pools as well as some armor layers appeared locally, as shown in Figure 5d. Sediments were deposited centrally upstream from the permeable weir, resulting in two main streams flowing through both sides where the major armor layers and the biggest pools are located. The particle size distribution curves in Figure 6c present a varying tendency in that the bed materials became much finer both upstream and downstream from the permeable weir. In addition, the sediments upstream from TFPW I were finer than those downstream from the structures. Similarly, under the protection of TFPW II, most fine sediments in the upper reach were brought to the area in front of TFPW II, successively leading to an armor layer and ripples on dunes upstream (Figure 5e). However, unlike TFPW I, the bedforms in the lower reach became much flatter when protected by TFPW II, where fewer pools or bars and fewer armor layers could be found. According to Figure 5e, both upstream and downstream from the structures, the bed materials became much finer than the original bed materials. Nevertheless, when the bed was protected by TFPW III, the phenomena became just a little different from TFPW I. The sand was deposited upstream from TFPW III, where the bedforms were still ripples, but the sedimentary area became larger. Downstream from TFPW III, some small bars and pools, as well as some locally armored layers, could also be found. A main flow on the left side could be seen as well. Covered by more fine sediments washed from the upper reach but staying out around the TFPW, the bed sediments there became much finer than the original bed after scouring.
4.2. Topography Changes
The topography both before and after scouring was compared. The original terrain of the bed was important for the topography changes, since the terrain after scouring had similarity with that before scouring. However, the structures played a pivotal role in changes of erosion and deposition. The contour lines of the riverbed when there were no structures are shown in Figure 7a. Without any GCSs, the elevation descended all the way along the flume. Some dunes were eroded, and scour holes became more numerous and larger. However, when both the solid bed sills and flexible TFPW traversed the flume, the change in topography turned out to be very distinctive (Figure 8).
When a bed sill traversed the flume, the contour profile upstream from the structure almost remained unchanged, whereas the elevation was reduced downstream of the sill (Figure 8a). It is obvious that the area with an altitude higher than 0.19 m developed to a smaller size, and the elevations in the toe of the sill were reduced remarkably where the local scour holes were located. The contour lines both upstream and downstream from the sill were sparser after scouring, which meant that the riverbed became flatter.
Under the protection of permeable structures, erosion became less after scouring. Upstream from TFPW I, a larger region with an elevation higher than 0.21 m appeared after scouring (Figure 8b), and the terrain became gentler with little rise or fall. Downstream from TFPW I, more low-lying areas were filled and leveled up. For TFPW II, upstream from the structures, the area with an altitude higher than 0.22 m became larger, whereas that with an altitude higher than 0.20 m became smaller (Figure 8c). Downstream from TFPW II, the area with an altitude higher than 0.195 m developed to a larger size, and the area with an altitude higher than 0.175 m also became larger. In particular, the elevations near the double grade structures increased, and more protruding parts appeared. It seems for TFPW III that the terrain became gentler with less rise or fall. Downstream from TFPW III, more low-lying areas were filled and leveled up (Figure 8d). The areas with an altitude higher than both 0.195 m and 0.175 m became larger. There were some protruding parts centrally distributed in the center position of the flume upstream of the TFPW.
4.3. Erosion and Deposition
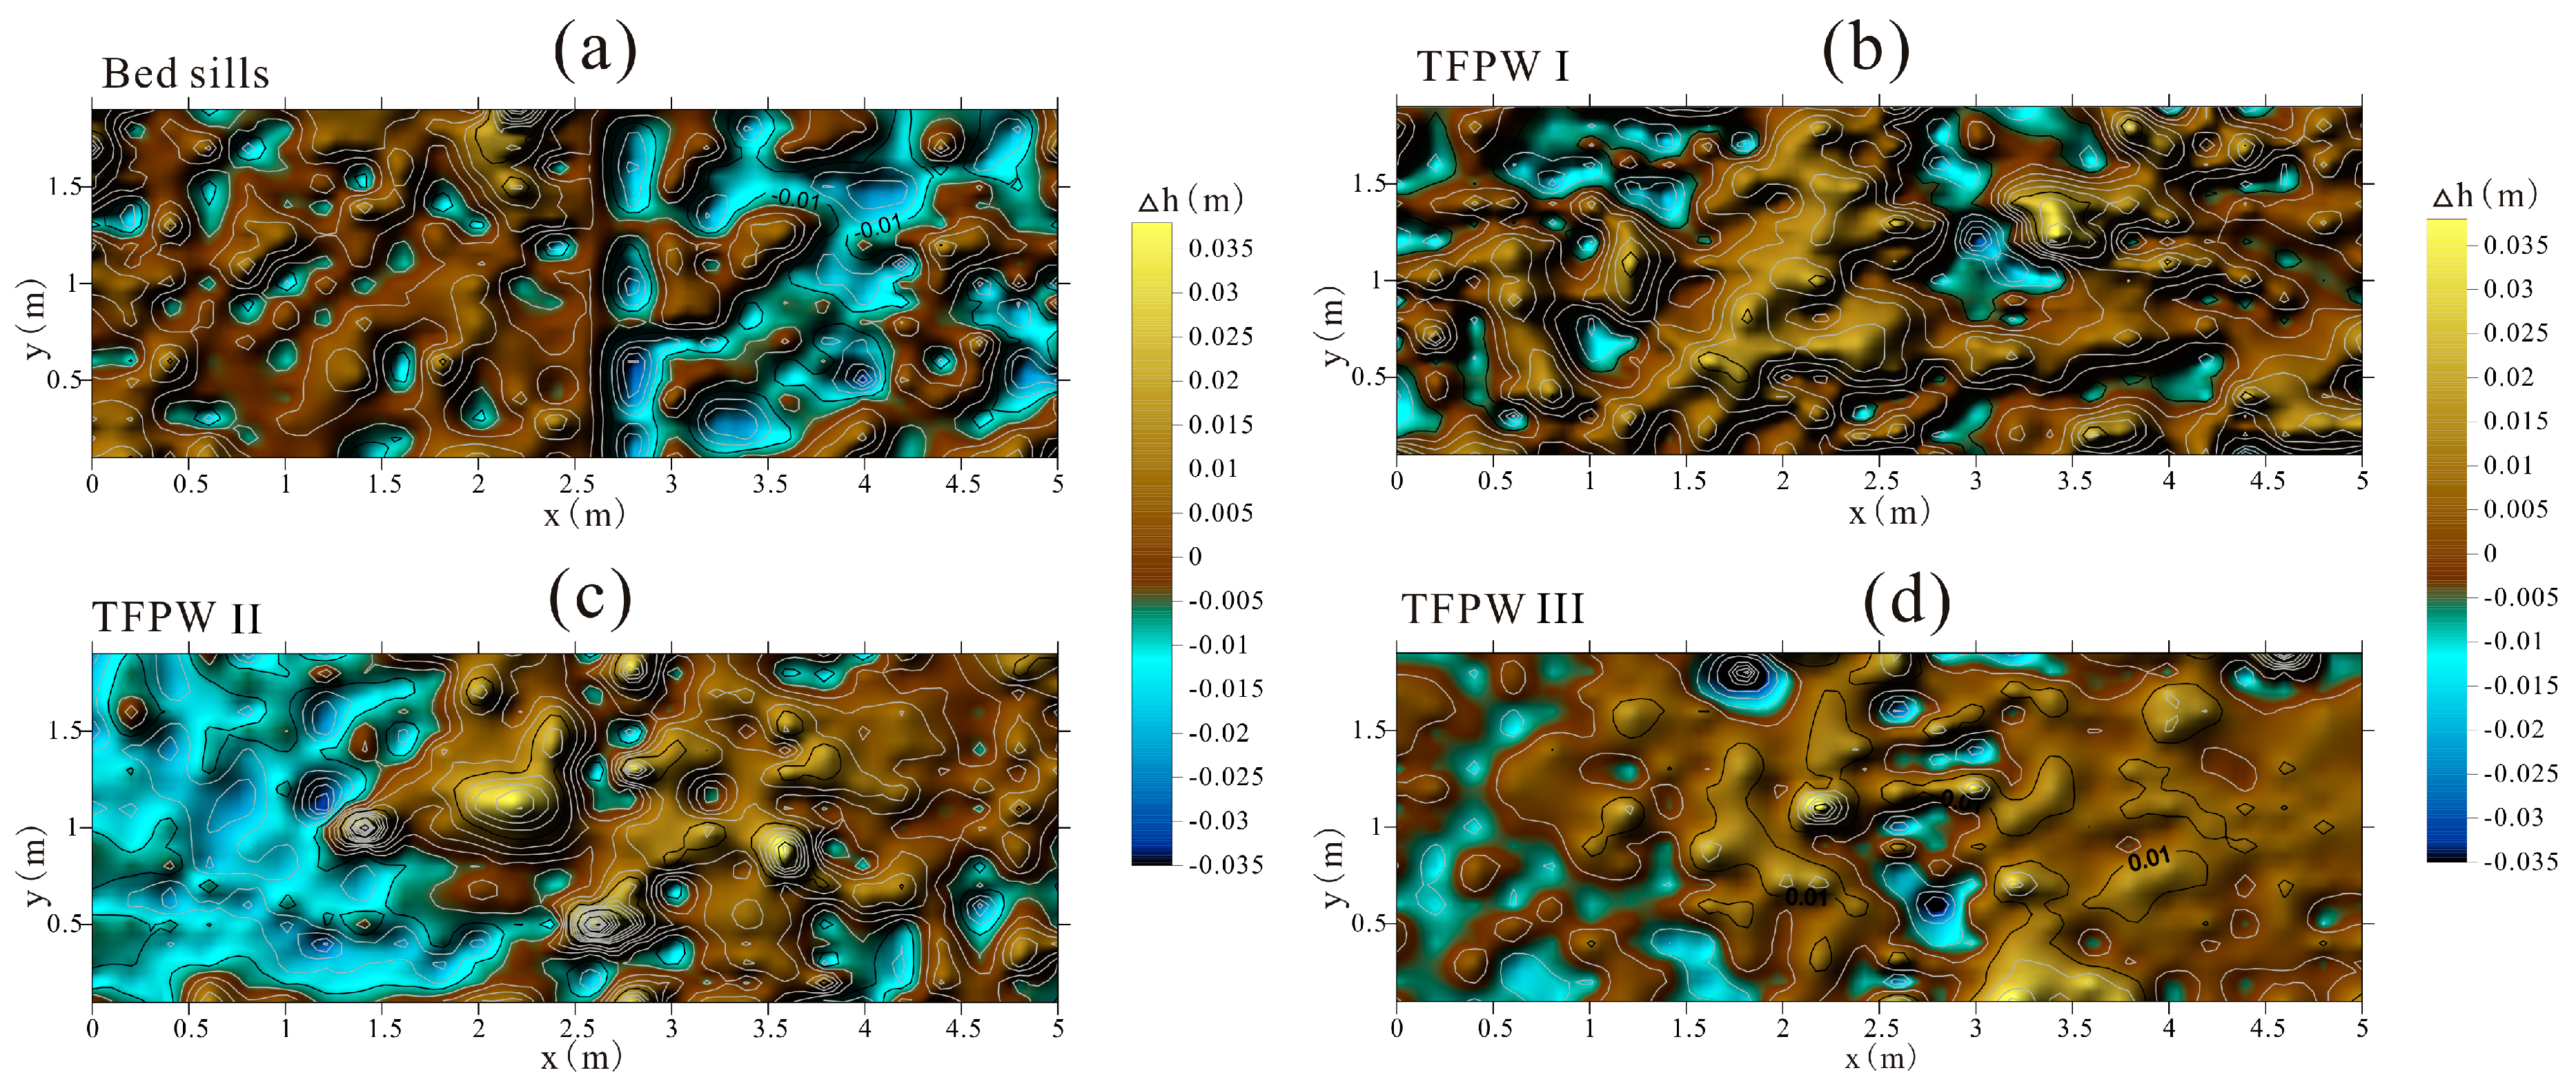
To more intuitively understand the erosion and deposition after clear water scouring, the relative magnitudes of elevation changes under the protective effects of different GCSs are shown in Figure 9. Without any structures, the bed was eroded dramatically, especially on the left side of the flume. It is worth noting that the scour in the lower part was much more severe than that in the upper reach (Figure 7b). Similarly, erosion was serious downstream from the bed sills, whereas more deposition occurred upstream (Figure 9a). There were several elliptical contour lines with negative values between X = 2.7 m and X = 3.0 m, where the scour holes were located. Further downstream, aggradation and erosion appeared alternately, making the terrain more planar downstream of the sill.
The deposition appeared differently both upstream and downstream of the structures when it came to TFPW. Protected by TFPW I, only a few local areas that were eroded in the upper reach (between X = 0 m and X = 1.5 m) as well as downstream from the structures (between X = 2.75 m and X = 3.5 m) could be clearly found (Figure 9b). Under the protection of TFPW II, although a large amount of degradation appeared between X = 0 m and X = 1.75 m, deposition could be found upstream from the upper TFPW. Then, some erosion occurred locally around the upper TFPW (between X = 2.5 m and X = 2.75 m) and downstream from both the upper TFPW (near X = 3.0 m) and the lower TFPW (close to X = 3.75 m). However, large-scale deposition appeared between the double grade TFPW and in the lower reach (Figure 9c). When protected by TFPW III, erosion appeared locally both upstream of the structures (between X = 0 m and X = 2.0 m) and in the area where the paved broad TFPW was located (between X = 2.5 m and X = 3.25 m). However, large-scale deposition occurred both upstream and downstream from TFPW III (Figure 9d).
Divided by X = 2.5 m where the GCSs were located, the volumes of erosion and deposition both upstream and downstream were calculated, and they are consistent with the experimental phenomena as listed in Table 2. Obviously, the total erosive volume was the largest when no structures protected the riverbed, and the erosion volume in the lower reach is much larger than in the upper reach. Upstream from bed sills, small-scale deposition appeared, but dramatic erosion appeared downstream, resulting in a large erosion volume in total. Positive values could be obtained both upstream and downstream of the TFPW, except for upstream from TFPW II. Although more erosion rather than deposition appeared upstream from TFPW II, a deposition volume of 0.007842 m3 in front of TFPW II was calculated, and the total erosion volume (0.011408 m3) was smaller than that with no GCSs (0.030787 m3) or bed sills (0.027285 m3). The total deposition volumes were similar when the bed was protected by TFPW I and TFPW III, 0.027884 m3 and 0.026877 m3.
5. Discussion
5.1. Interactions among Structures, Water Flow and Bed Features Downstream of GCSs
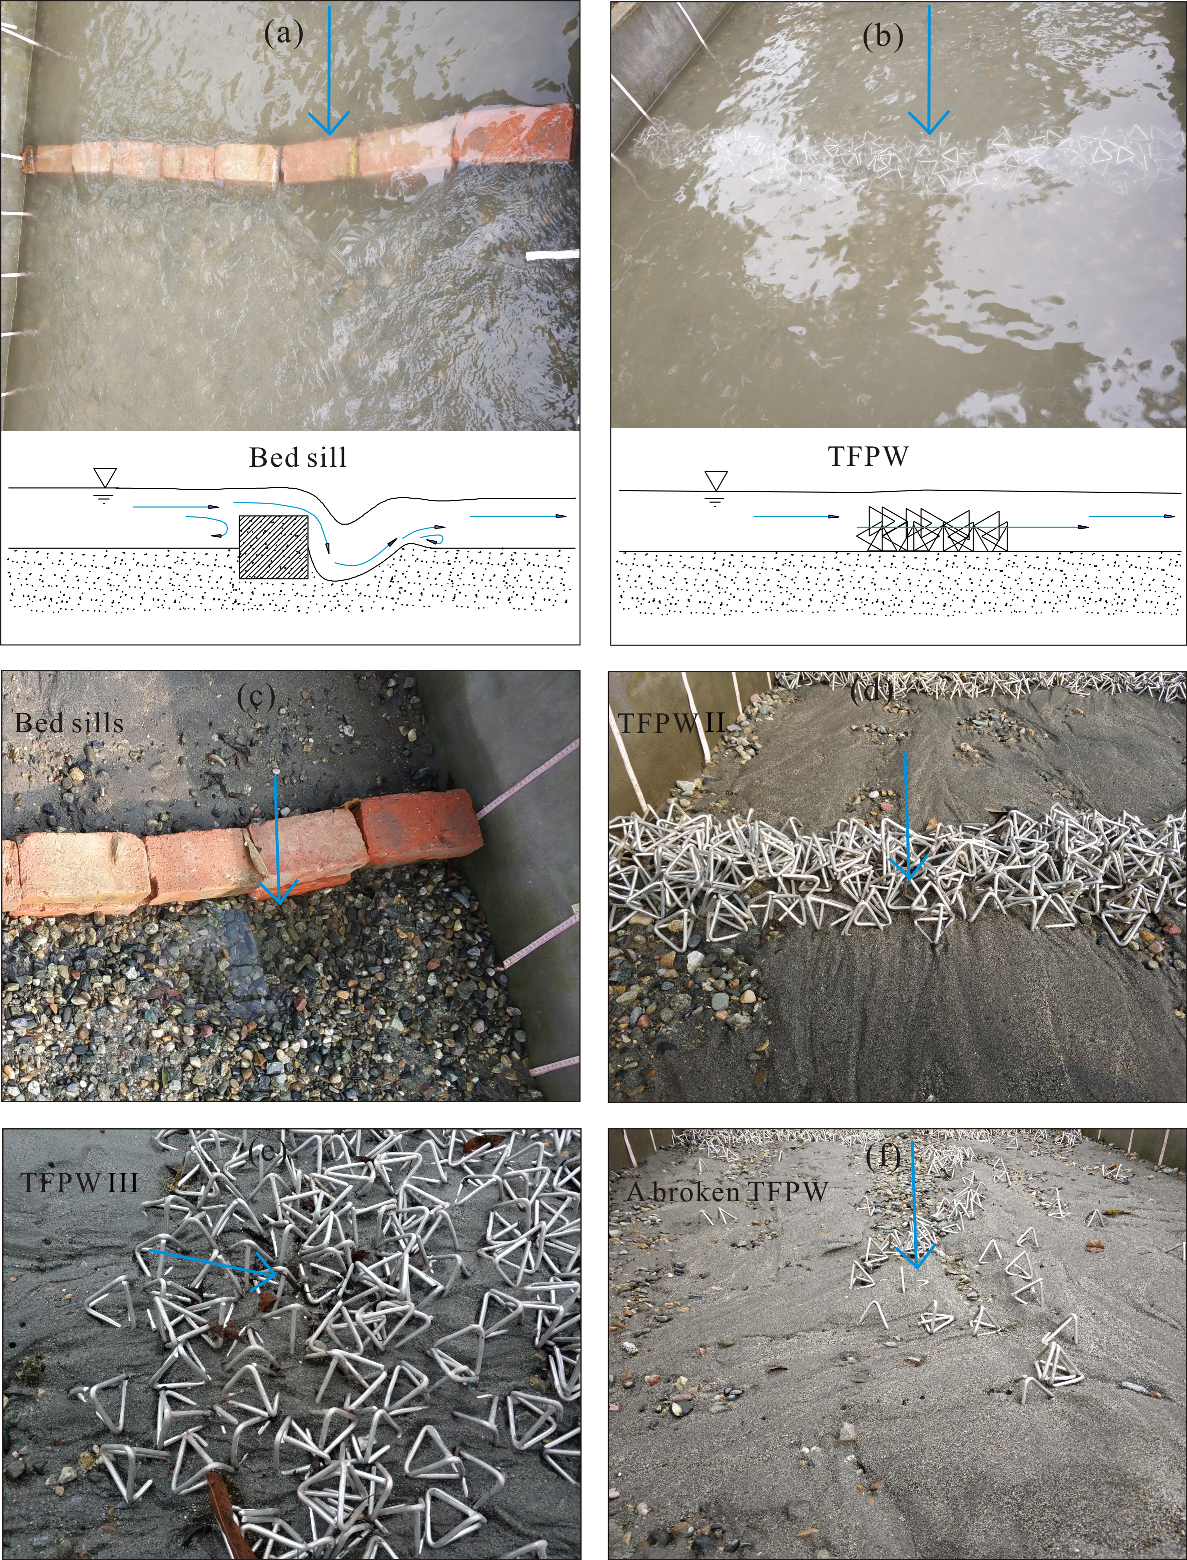
The bed surface of the unstable gravel-bed river exhibited distinctive geometric features under different GCS conditions. It was well-known that the bedform features depended on flow conditions and bed material characteristics. Although with the same inlet flow velocity and water depth, in addition to the same sediment size and grading, the bedforms were affected by hydraulic structures with different permeability. The interaction between structures and flow adjusts the sediment transport, thus controlling the bedforms. There were deep scour holes in the toe of the bed sills (Figure 5c) with local armored regions downstream from the TFPW (Figure 5d,e). The various bedforms downstream from the GCSs were caused by free flow over the structures. Figure 10a,b shows the pictures during scouring and the schematics of flow patterns obstructed by the impermeable bed sills and permeable TFPW, respectively. From bed sills to TFPW, the obstruction of flow became weaker, and flow continuity could be guaranteed. Consequently, local hydraulic phenomena over the structures and local scour downstream could be weakened and even avoided.
When the scour holes are so deep as to undermine the foundations of the GCSs, it is a danger to the stability of the riverbed in addition to structural safety, as found both in the field study of the Jianjiang River (Figure 3) and in the laboratory experiments (Figure 5c and Figure 10c). During the flood season, the free overfall jets with high velocity flowed over the crest of the bed sills, and then washed away the fine sediments and even the boulders that were backfilled around the sills as well as the precast concrete blocks for local scour protection. In the field investigation, as shown in Figure 3d, the toe board downstream of the bed sill was exposed and eroded. A main local scour hole on the left side and several holes located from the right side to the center of the river could be noticed, and drastic general erosion and riverbed armoring occurred in a large part downstream from the sill. After the water was released from the solid bed sills, free overfall jets impinged the bed surface very rapidly, resulting in local scour downstream from the structures (Figure 10e). The laboratory model realistically simulated the features around this bed sill, where both local scour and an armor layer were found downstream from the bed sill, as shown in Figure 5c.
Because of high water permeability, the water over the TFPW was hardly obstructed, where the water surface stayed almost horizontal with no jets or turbulence (Figure 10b). The water-depth variation around a TFPW used for riverbed stability in a mountainous channel was observed experimentally (in a narrow flume with a width of 1.0 m and a slope of 10‰, and the bed was paved as mountainous river morphology in each test) [39], where the water level changed slightly upstream from the TFPW, followed by a significant water level rise over the structures, and finally maintained a stable level. In this study, in a gentler and wider piedmont river, the water level varied less pronouncedly. However, small turbulence must appear near the riverbed due to the interference by the concrete bars of the tetrahedron frames. Therefore, some sand was washed away, and gravel was locally exposed close to the TFPW (Figure 5d–f).
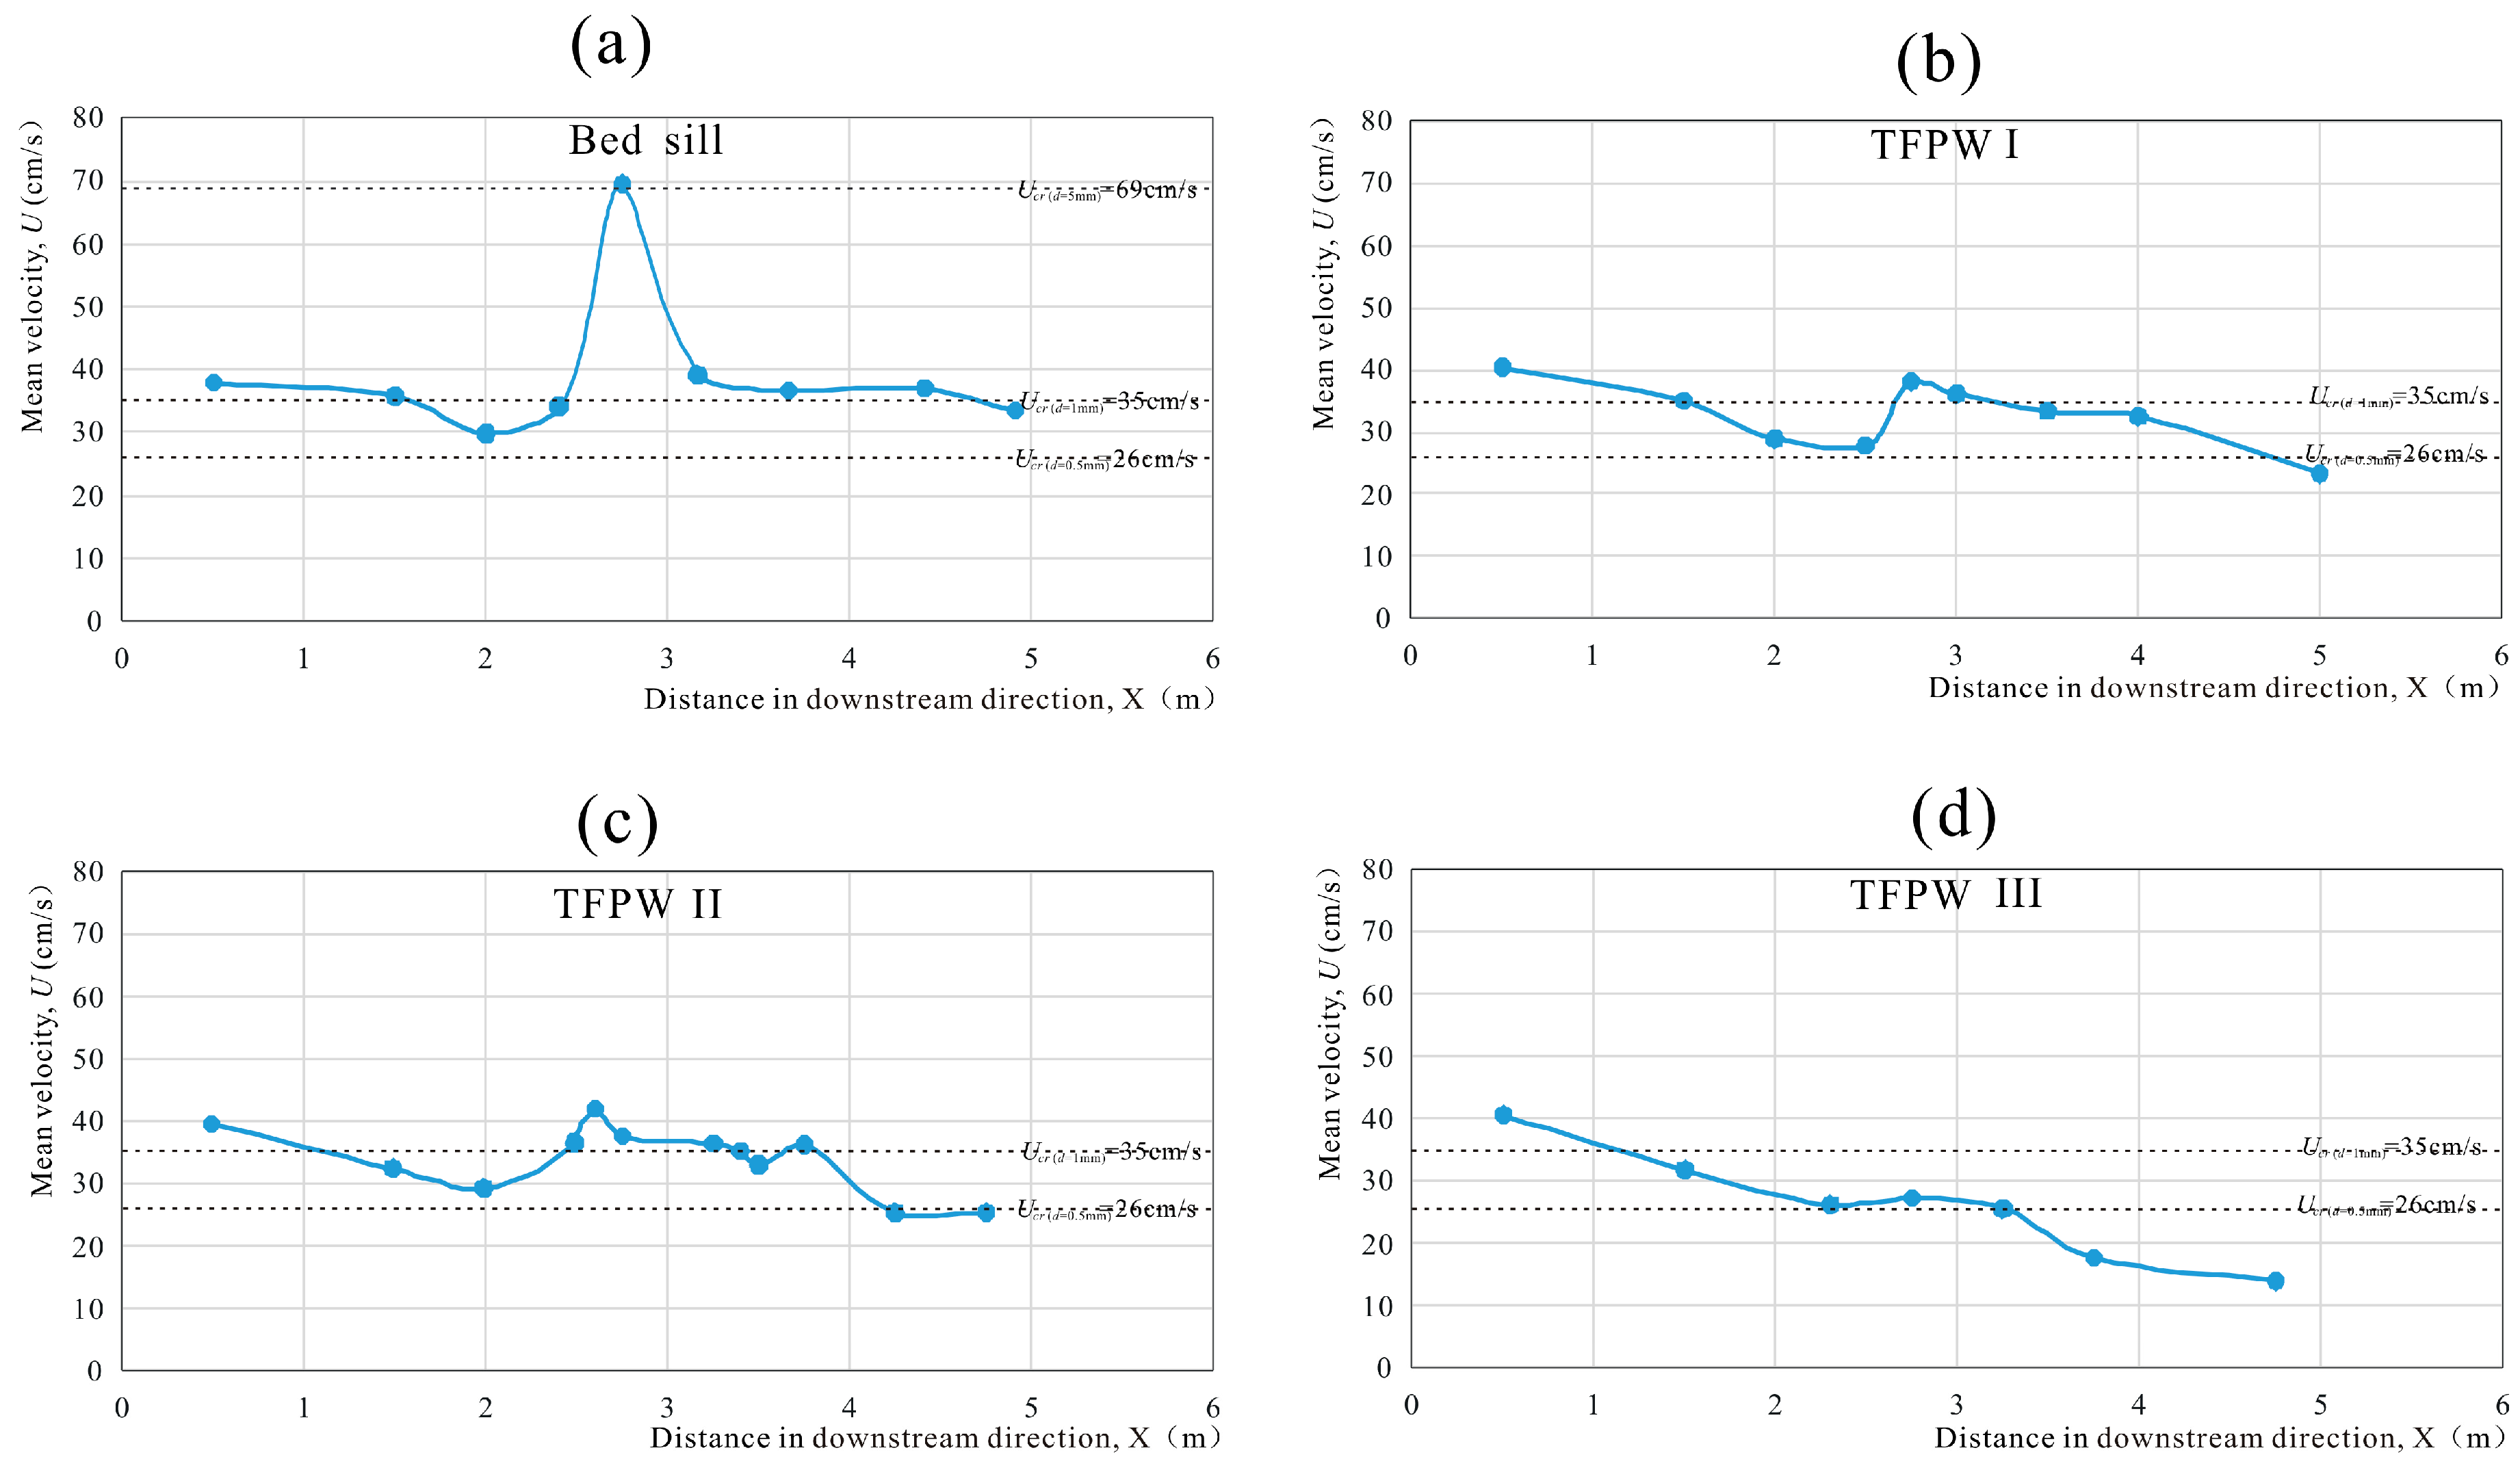
The time-averaged velocities along the central axis of the flume were measured and the diagram of velocity variation is shown in Figure 11. Upstream of all the GCSs, the velocity decreased. However, when the water flowed through the solid bed sill, the cross-section of the water was narrowed by the impermeable structures, resulting in remarkable increase of velocity (Figure 11a). Downstream of the bed sills, the velocity also decreased remarkably, but kept a larger value than that upstream from the bed sill. When it comes to the random TFPW, the velocities increased slightly when the water flowed through the structures, and then decreased due to the interception of tetrahedron frames (Figure 11b,c). Differently, when the water flowed through the paved TFPW, the velocity would keep almost unchanged but decreased in the downstream reach (Figure 11d). The reason of this phenomenon might be that, with lower height, the paved TFPW had less constriction effect on the cross-section of water, but still disturbed the near-bed velocity. Therefore, the TFPW could remarkably decelerate the flow velocity. The similar change regulations were observed by Wang et al. (2017), both the mean velocity and dimensionless near-bed velocity downstream from the TFPW were decreased by TFPW [39].
According to the same method as Wang et al (2017), a threshold velocity is used as a description of the sediment threshold condition [39]. An average velocity of Ucr at the particle level is used. In this study, the equation for hydraulically rough flow put forward by Grade (1970) was used, which was obtained by analyzing many data on the threshold condition [40], expressed as
where h is the flow depth; d is the representative sediment size, namely, the median diameter d50, which can be obtained from the particle size distribution curves; ∆ is the submerged relative density (∆ = s − 1); and s is the relative density of sediment (s = ρs/ρ).
To better understand the relationship between velocity and sediment motion, the threshold velocities (Ucr) for different particle sizes were calculated, which are 0.26 m/s, 0.35 m/s, 0.52 m/s and 0.69 m/s for the sediments with a diameter of 0.5 mm, 1 mm, 2.5 mm and 5 mm, respectively. When the velocity downstream from the TFPW was reduced to a threshold value for sediment motion, the sand could not move and stayed put. As shown in Figure 9 and Figure 11, deposition occurred in the section where the velocities were lower than the threshold velocity for sediments with a diameter of 1 mm (Ucr = 35 cm/s). Local scour holes and dramatic erosion occurred downstream from bed sills (Figure 9a), where the jet occurred and the velocity kept large because of little deceleration caused by solid bed sills. When it comes to the TFPW, erosion appeared locally around the TFPW due to the turbulence caused by tetrahedron frames (Figure 9b–d).
The bedforms under the protection of the TFPW in the piedmont river (Figure 5d–f) differed from those in a mountainous river [39]. The riverbed in the piedmont reach becomes wider, gentler and flatter and has more fine sediment. Thus, downstream from the TFPW, more fine sediment was deposited across the whole riverbed rather than in the main channel. Based on the original bed characteristics in the unstable gravel-bed river and influenced by different kinds of TFPW, some large bedforms such as middle bars, alternate bars and pools might form at high flow discharges. The bars and pools became smaller and smaller when protected by TFPW I, TFPW III and TFPW II, indicating that with the expansion of paving area or the increase in the structure grade, the bed would become more stable.
5.2. Effects of GCSs on Flow Regime and Bedforms Upstream from the Structures
Without any GCSs, an armor layer formed widely both in the natural streambeds of Jianjiang River (Figure 1 and Figure 2) and in the laboratory experiment (Figure 5b). Especially under clear water conditions, the removal of finer sediments from the bed surface exposed a great deal of individual large particles. However, when obstructed by impermeable bed sills or disturbed by permeable weirs, flow velocity upstream from the GCSs would decrease to below the threshold armoring condition. Therefore, armoring would be avoided.
The bedforms upstream from different GCSs were various, as shown in Figure 5. When protected by bed sills and TFPW, the geometric features of the upstream bed surface were plane beds and ripples or ripples on dunes, respectively. According to Simons and Richardson (1966), the Froude number Fr was used to classify the bedforms. As Fr increases, different bedforms develop from a plane bed as a sequence: plane bed, ripples, ripples on dunes, dunes, washed-out dunes, plane beds and so on [41,42]. Where Fr < 1, the flows upstream from the four different structures were all subcritical and plane beds, ripples, ripples on dunes and ripples grew in a relatively stable state.
The lower flow regimes upstream from the GCSs once again proved that strong interaction between structures and flow controls sediment transport and the bedforms. The flow upstream of the solid bed sills was almost a pool of stagnant water, where sediment transport hardly occurred. Therefore, a plane bed stayed almost unchanged. Some sediments washed from further upstream would also be deposited in the reservoir region. For TFPW with high permeability, the flow passed through the frames more smoothly. The relatively increased flow intensity carried more sand in the upper reach to the test reach. However, disturbed and retarded by TFPW, the flow velocity was reduced less than by bed sills, but still lower than the critical condition to initiate sediment motion. Therefore, upstream from the TFPW, a few finer sands were brought downstream, whereas the others were deposited in front of the permeable structures. As shown in Figure 5d,f, ripples could be observed in front of TFPW I and TFPW III, respectively. Differently, a larger bedform called ripples on dunes rather than ripples (Figure 5e) formed in front of TFPW II with an increase in Fr. In addition, with a lower height, TFPW III disturbed the flow more slightly, leading to a thinner accumulative layer upstream of TFPW III than upstream of TFPW I and TFPW II. The interaction between these GCSs and the flow, as well as the sediment transport and the bedforms, is extremely complex and needs further quantitative study.
5.3. Effects on Structural Stability and Environment
There is no doubt that the solid bed sills would be demolished by local scour, which was found in both the literature and in this study by field observation and experiments. Especially in unstable gravel-bed rivers, the foundation of solid structures would overturn because the toe would hang in the air due to local scouring, and the downstream protection was no help for mitigating the local scour (Figure 3d,e). However, the permeable GCSs had perfect structural stability. On the one hand, dramatic local scour hardly occurs. Therefore, the foundations of flexible GCSs were firm enough, and the structures were not overturned, resulting in no threat to the structural safety. On the other hand, the permeable structures bear less water pressure, and flexible structures self-adapt to riverbed deformation, as shown in Figure 5d–f and 10d–f. Each tetrahedron frame stood on the riverbed individually, and some restricted each other but would not integrally bear the water pressure. The tetrahedron frames in particular disturbed the flow and induced sediment deposition that buried the frames and stabilized the structures (Figure 10e). It should be noted that the tetrahedron frames in the area where the local armoring occurred (or in turn, the main flow passed) could be washed away by catastrophic floods (Figure 10f). However, a local break of the TFPW would not influence the regular service of the flexible weirs. Furthermore, the lost frames would stop a short distance downstream and stabilize the bed separately. The local damage to TFPW was also easy to repair by casting more frames to the same place. Some disadvantages caused by both fast abrasion or destruction of tetrahedron frames by coarse bed materials and sedimentation clogging of substrates after a long period of TFPW persistence should be taken into consideration [39]. The stability of TFPW could be enhanced by adding a grade TFPW a distance downstream from the first TFPW or by paving frames on a larger scale.
Both positive and negative environmental impacts of GCSs on the channel system would occur [43]. The solid bed sills undoubtedly intercept the river, not only resulting in bad water quality during the low flows (Figure 2f), but also producing some other potentially adverse impacts such as change of substrate character due to sediment deposition, alteration of energy and transport characteristics, and reduction in stream dynamics [43]. The same as other traditional GCSs, the most serious negative environmental impact of bed sills is the detrimental impact on fish abundance and migration, biodiversity, and longitudinal connectivity [8,43,44]. Thus, to address the fish movement problems, some structures must be incorporated into the design of the structure, including fish passages [8,43], openings, fish ladders [15], or gentle downstream slopes [44,45,46]. On the other hand, pools, riffles and backwater areas caused by GCSs could provide diverse habitats for fish [18]. Flexible GCSs such as rock or log dams [47], rock weirs [48], and low drop structures made of huge stones [49] can create or improve habitat. However, Salant et al found that rock weirs actually caused a loss of riffle and pools in favor of shallow flat water areas in turn decreasing habitat heterogeneity [50]. Differently, with high permeability, TFPW would not interdict the flow continuity, hardly resulting in any biological and environmental effects. The effect of TFPW on fish migration would not exist because the gaps between frames are large enough for the fish to swim through. The pearmeable frames were for ease of fish migration during either high flows or even low flows. In addition, it is worth noting that both pools and bars could be found downstream of TFPW (Figure 5d–f), which would improve habitat diversity for fish.
6. Conclusions
This paper presents the results of a field investigation and experimental study of bed morphology under different structural conditions in an unstable gravel-bed river. The laboratory experiments first simulated the riverbeds with no GCSs and with the protection of solid bed sills after erosion by floods in the Jianjiang River, China. The experimental results agreed well with the field data. The gravel-bed river was eroded and armored by clear water scouring when no stabilization countermeasures were taken. When protected by conventional concrete bed sills, the bed upstream from the structures was well protected, where sand was deposited and the reservoir would even silt up in nature. However, dramatic local scour holes occurred in the toe of the bed sills, in addition to general erosion and armoring in the downstream reach. Worse, the bed sills were destroyed because of the unstable foundation caused by local scour. Thus, the solid bed sills frequently lose efficacy in practical engineering. In addition, the impermeable bed sills also cause ecological and environmental problems by intercepting the river, resulting in bad water quality and fish migration blockage.
Experiments were conducted to study riverbed protection and the bed features around a new kind of flexible grade control structure named TFPW with three different layout types. The TFPW could remarkably decelerate the flow velocity. When the velocity around the TFPW was reduced to a threshold value for sediment motion, the sediments would deposit both upstream and downstream from the TFPW. The results indicated that the riverbeds around the TFPW were well protected; deposition occurred on a large scale both upstream and downstream; and the bed sediments became much finer than the original bed after scouring around the structures. Upstream from each TFPW, fine sediments washed from an upper reach would stop transportation and accumulate as relatively stable bedforms such as ripples and ripples on dunes. Downstream from TFPW, except some locally exposed gravel, neither local scour nor general erosion has occurred. Diverse bedforms including middle bars, alternate bars and pools might appear downstream of the TFPW (especially downstream of the random Single TFPW), which could be weakened by paving wider-scale frames (the paved Single TFPW) and even avoided by adding a grade TFPW downstream from the first TFPW (the random Double TFPW).
Due to the high permeability of TFPW, the structures hardly affect water continuity and bear little water pressure, and thus, the stability of every single frame is good. In addition, because the frames would be covered by sedimentation in addition to their good self-adaptability to TFPW riverbed deformation, the structural stability is improved. Two adverse effects on the TFPW structure are brought by sediment transport, nevertheless they are easy to solve by throwing more tetrahedron frames in the same dilapidated site. The effect of TFPW on fish migration would not exist because the gaps between frames are large enough for the fish to swim through. In addition, the pools and bars caused by the TFPW could create diverse habitats for fish. Due to the advantages of permeability, ecological friendliness, stability and construction, TFPW are proposed as a new alternative countermeasure to stabilize the riverbed and protect river crossing structures in unstable gravel-bed rivers.
Author Contributions
Conceptualization, X.-g.Y. and H.-w.Z.; Methodology, H.-w.Z. and J.-m.W.; Software, J.-m.W. and X.L.; Validation, J.-m.W., X.-g.Y. and H.-w.Z.; Formal Analysis, J.-m.W.; Investigation, J.-m.W., H.-w.Z., R.J. and E.-q.L.; Resources, X.-g.Y. and H.-w.Z.; Data Curation, J.-m.W. and X.L.; Writing—Original Draft Preparation, J.-m.W. and R.J.; Writing—Review and Editing, X.-g.Y., H.-w.Z. and J.-m.W.; Visualization, J.-m.W., X.L. and E.-q.L.; Supervision, X.-g.Y. and H.-w.Z.; Project Administration, X.-g.Y. and H.-w.Z.; Funding Acquisition, X.-g.Y. and H.-w.Z.
Funding
This research was funded by the Science and Technology Fund of Chengdu Water Authority (13H0819 and 14H1055) and National Investment Engineering Construction Project Fund in Administrative Region of Sichuan Province (17H0953 and 17H0855).
Acknowledgments
The author would like to acknowledge the support from the Science and Technology Fund of Chengdu Water Authority (13H0819 and 14H1055) and National Investment Engineering Construction Project Fund in Administrative Region of Sichuan Province (17H0953 and 17H0855).
Conflicts of Interest
The authors declare no conflict of interest.
References
- Huang, R.; Fan, X. The landslide story. Nat. Geosci. 2013, 6, 325–326. [Google Scholar] [CrossRef]
- Zhou, J.; Cui, P.; Fang, H. Dynamic process analysis for the formation of Yangjiagou landslide-dammed lake triggered by the Wenchuan earthquake, China. Landslides 2013, 10, 331–342. [Google Scholar] [CrossRef]
- Magilligan, F.J.; Nislow, K.H.; Renshaw, C.E. Flow regulation by dams. In Treatise on Geomorphology; Shroder, J.F., Ed.; Academic Press: San Diego, CA, USA, 2013; Volume 9, pp. 794–808. ISBN 9780080885223. [Google Scholar]
- Petts, G.; Gurnell, A. 13.7 Hydrogeomorphic effects of reservoirs, dams, and diversions. In Treatise on Geomorphology; Shroder, J.F., Ed.; Academic Press: San Diego, CA, USA, 2013; Volume 13, pp. 96–114. ISBN 9780080885223. [Google Scholar]
- Padmalal, D.; Maya, K. Impacts of river sand mining. In Sand Mining. Environmental Science and Engineering; Springer: Dordrecht, The Netherlands, 2014; pp. 31–56. ISBN 978-94-017-9143-4. [Google Scholar]
- Boix-Fayos, C.; Barberá, G.G.; López-Bermúdez, F.; Castillo, V.M. Effects of check dams, reforestation and land-use changes on river channel morphology: Case study of the Rogativa catchment (Murcia, Spain). Geomorphology 2007, 91, 103–123. [Google Scholar] [CrossRef]
- Wang, S.; Fu, B.; Piao, S.; Lü, Y.; Ciais, P.; Feng, X.; Wang, Y. Reduced sediment transport in the Yellow River due to anthropogenic changes. Nat. Geosci. 2016, 9, 38–41. [Google Scholar] [CrossRef]
- Thomas, J.T.; Culler, M.E.; Dermisis, D.C.; Pierce, C.L.; Papanicolaou, A.N.; Stewart, T.W.; Larson, C.J. Effects of grade control structures on fish passage, biological assemblages and hydraulic environments in western iowa streams: A multidisciplinary review. River Res. Appl. 2013, 29, 389–398. [Google Scholar] [CrossRef]
- Church, M.; Ferguson, R.I. Morphodynamics: Rivers beyond steady state. Water Resour. Res. 2015, 51, 1883–1897. [Google Scholar] [CrossRef] [Green Version]
- Fan, N.; Nie, R.; Wang, Q.; Liu, X. Dramatic undercutting of piedmont rivers after the 2008 Wenchuan Ms 8.0 Earthquake. Sci. Rep. 2016, 6, 37108. [Google Scholar] [CrossRef] [PubMed] [Green Version]
- Chang, H.H. River training. In Fluvial Processes in River Engineering; John Wiley & Sons, Inc.: New York, NY, USA, 1988; Volume 15, pp. 395–411. [Google Scholar]
- Bormann, N.E.; Julien, P.Y. Scour downstream of grade-control structures. J. Hydraul. Eng. 1991, 117, 579–594. [Google Scholar] [CrossRef]
- Lu, J.Y.; Hong, J.H.; Chang, K.P.; Lu, T.F. Evolution of scouring process downstream of grade-control structures under steady and unsteady flows. Hydrol. Process. 2013, 27, 2699–2709. [Google Scholar] [CrossRef]
- Guan, D.; Melville, B.W.; Friedrich, H. Live-bed scour at submerged weirs. J. Hydraul. Eng. 2015, 141, 04014071. [Google Scholar] [CrossRef]
- Sattar, A.M.A.; Plesiński, K.; Radecki-Pawlik, A.; Gharabaghi, B. Scour depth model for grade-control structures. J. Hydroinform. 2017, 20, 117–133. [Google Scholar] [CrossRef]
- Goel, A.; Pal, M. Application of support vector machines in scour prediction on grade-control structures. Eng. Appl. Artif. Intell. 2009, 22, 216–223. [Google Scholar] [CrossRef]
- Mojtaba, R.N.S.; Mahmood, S.B. Effects of upward seepage on depth of scour hole downstream of free falling jets under constant tail water depth. J. Water Sci. Res. 2013, 5, 31–39. [Google Scholar]
- Raborn, S.W.; Schramm, H.L. Fish assemblage response to recent mitigation of a channelized warmwater stream. River Res. Appl. 2003, 19, 289–301. [Google Scholar] [CrossRef]
- Castro, J.M.; Beavers, A. Providing aquatic organism passage in vertically unstable streams. Water 2016, 8, 133. [Google Scholar] [CrossRef]
- Lenzi, M.A.; Marion, A.; Comiti, F. Local scouring at grade-control structures in alluvial mountain rivers. Water Resour. Res. 2003, 39, 1176. [Google Scholar] [CrossRef]
- Galia, T.; Skarpich, V. Response of bed sediments on the grade-control structure management of a small piedmont stream. River Res. Appl. 2017, 33, 483–494. [Google Scholar] [CrossRef]
- Gaudio, R.; Marion, A.; Bovolin, V. Morphological effects of bed sills in degrading rivers. J. Hydraul. Res. 2000, 38, 89–96. [Google Scholar] [CrossRef]
- Lenzi, M.A.; Marion, A.; Comiti, F.; Gaudio, R. Local scouring in low and high gradient streams at bed sills. J. Hydraul. Res. 2002, 40, 731–739. [Google Scholar] [CrossRef]
- Marion, A.; Lenzi, M.A.; Comiti, F. Effect of sill spacing and sediment size grading on scouring at grade-control structures. Earth Surf. Proc. Landf. 2004, 29, 983–993. [Google Scholar] [CrossRef]
- Marion, A.; Tregnaghi, M.; Tait, S. Sediment supply and local scouring at bed sills in high-gradient streams. Water Resour. Res. 2006, 42, W06416. [Google Scholar] [CrossRef]
- Tregnaghi, M.; Marion, A.; Gaudio, R. Affinity and similarity of local scour holes at bed sills. Water Resour. Res. 2007, 43, W11417. [Google Scholar] [CrossRef]
- Meftah, M.B.; Mossa, M. Scour holes downstream of bed sills in low-gradient channels. J. Hydraul. Res. 2006, 44, 497–509. [Google Scholar] [CrossRef]
- Tregnaghi, M.; Marion, A.; Coleman, S. Scouring at bed sills as a response to flash floods. J. Hydraul. Eng. 2009, 135, 466–475. [Google Scholar] [CrossRef]
- Gaudio, R.; Marion, A. Time evolution of scouring downstream of bed sills. J. Hydraul. Res. IAHR 2003, 41, 271–284. [Google Scholar] [CrossRef]
- Zahiri, A.; Azamathulla, H.M.; Ghorbani, K. Prediction of local scour depth downstream of bed sills using soft computing models. In Computational Intelligence Techniques in Earth and Environmental Sciences; Islam, T., Srivastava, P., Gupta, M., Zhu, X., Mukherjee, S., Eds.; Springer: Dordrecht, The Netherlands, 2014; pp. 197–208. ISBN 978-94-017-8641-6. [Google Scholar]
- Escarameia, M.; Roca, M.; Chellew, E. Towards better design of riprap bed sills—An experimental study. Water Manag. 2015, 170, 1–12. [Google Scholar] [CrossRef]
- Roca, M.; Escarameia, M. Probabilistic design of riprap bed sills. Water Manag. 2017, 170, 1–9. [Google Scholar] [CrossRef]
- Pagliara, S.; Kurdistani, S.M.; Palermo, M.; Simoni, D. Scour due to rock sills in straight and curved horizontal channels. J. Hydro-Environ. Res. 2016, 10, 12–20. [Google Scholar] [CrossRef]
- Tang, H.W.; Ding, B.; Chiew, Y.M.; Fang, S.L. Protection of bridge piers against scouring with tetrahedral frames. Int. J. Sediment Res. 2009, 24, 385–399. [Google Scholar] [CrossRef]
- Wang, P.; Zhang, X.; Wang, W.; Yu, T. Effects of central bar protection with tetrahedron-like penetrating frames. Procedia Eng. 2012, 28, 389–393. [Google Scholar] [CrossRef]
- Gao, Z.; Li, X.; Tang, H.; Gu, Z. Three-dimensional hydrodynamic model of concrete tetrahedral frame revetments. J. Mar. Sci. Appl. 2009, 8, 338–342. [Google Scholar] [CrossRef]
- Lu, J.Y.; Hong, J.H.; Ho, S.C. Scour protection downstream of a grade-control structure using tetrahedron frames. In Proceedings of the 33rd IAHR Congress, Vancouver, BC, Canada, 10–14 August 2009; pp. 3596–3603. [Google Scholar]
- Lu, J.Y.; Chang, T.F.; Chiew, Y.M.; Hung, S.P.; Hong, J.H. Turbulence characteristics of flows passing through a tetrahedron frame in a smooth open-channel. Adv. Water Resour. 2011, 34, 718–730. [Google Scholar] [CrossRef]
- Wang, J.; Yang, X.; Zhou, H.; Wang, Z.; Zhou, J.; Liang, Y. The effect of tetrahedron framed permeable weirs on river bed stability in a mountainous area under clear water conditions. Sci. Rep. 2017, 7, 4841. [Google Scholar] [CrossRef] [PubMed]
- Garde, R.J. Initiation of motion on a hydrodynamically rough surface-critical velocity approach. J. Irrig. Power 1970, 27, 271–282. [Google Scholar]
- Simons, D.B.; Richardson, E.V. Resistance to Flow in Alluvial Channels; US Government Printing Office: Washington, DC, USA, 1966; pp. 1–61.
- Engelund, F.; Fredsoe, J. Sediment ripples and dunes. Annu. Rev. Fluid Mech. 1982, 14, 13–37. [Google Scholar] [CrossRef]
- Biedenharn, D.S.; Hubbard, L.C. Design Considerations for Siting Grade Control Structures; Coastal and Hydraulics Engineering Technical Note CHETN- VII-3; U.S. Army Engineer Research and Development Center: Vicksburg, MS, USA, 2001; Available online: http://chl.wes.army.mil/library/publications/chetn/ (accessed on 20 June 2018).
- Thomas, J.T.; Papanicolaou, A.N.; Pierce, C.L.; Dermisis, D.C.; Litvan, M.E.; Larson, C.J. Fish passage and abundance around grade control structures on incised streams. In Proceedings of the World Environmental and Water Resources Congress, Kansas City, MI, USA, 17–21 May 2009; pp. 1–10. [Google Scholar] [CrossRef]
- Ovidio, M.; Philippart, J.C. The impact of small physical obstacles on upstream movements of six species of fish. Hydrobiologia 2002, 483, 55–69. [Google Scholar] [CrossRef]
- Litvan, M.E.; Pierce, C.L.; Stewart, T.W.; Larson, C.J. Fish passage in a western Iowa stream modified by grade control structures. N. Am. J. Fish. Manag. 2008, 28, 1398–1413. [Google Scholar] [CrossRef]
- Thompson, D.M.; Stull, G.N. The development and historic use of habitat structures in channel restoration in the United States: The grand experiment in fisheries management. Géogr. Phys. Quat. 2002, 56, 45–60. [Google Scholar] [CrossRef]
- Scurlock, S.M.; Thornton, C.I.; Abt, S.R. One-dimensional modeling techniques for energy dissipation in U-weir grade-control structures. In Proceedings of the World Environmental and Water Resources Congress, Palm Springs, CA, USA, 22–26 May 2011; pp. 2496–2507. [Google Scholar] [CrossRef]
- Kang, J.; Kim, C.; Jung, S.; Yeo, H. Habitat evaluation on scour hole downflow low drop structure types using large-scale experiment. Engineering 2012, 557–567. [Google Scholar] [CrossRef]
- Salant, N.L.; Schmidt, J.C.; Budy, P.; Wilcock, P.R. Unintended consequences of restoration: Loss of riffles and gravel substrates following weir installation. J. Environ. Manag. 2012, 109, 154–163. [Google Scholar] [CrossRef] [PubMed]
Figure 1.
Situations of the field study area: (a) Sketch drainage map of the studied rivers; (b) pictures of Jianjiang Dam, where the reservoir is silted up by finer sediments upstream, whereas clear water sluices over the dam and dramatic erosion occur downstream leading to an armored layer on the riverbed; (c) a picture of embankment failure because of scouring; (d) a picture of underwater pipeline exposure due to streambed undercutting; and (e) a picture of bridge destruction as a result of pier scour.

Figure 2.
Pictures of the riverbed changes in the Zhima Bridge reach of the Jianjiang River: (a) riverbed and bank scour after the “9 July” flood in 2013; (b) harmonious scenes around Zhima Bridge several years after the completion of the river restoration project for the “9 July” flood in 2013, but before the flood season in 2017; and (c) bad conditions around Zhima Bridge after the flood disaster in the summer of 2017, where the bridge was destroyed because of a pier sinking due to scour, and the embankments were destroyed locally by the rush of the flood. In addition, the riverbeds and the flood plains were severely eroded.

Figure 3.
Pictures of the damage of bed sills: (a) entire failure of the bed sill downstream from an overfall dam; (b) local damage of the bed sill downstream from a bridge; (c) terrible scour downstream from Jianjiang Dam, where the broad bed sill and the embankments were demolished; (d) scour downstream of a newly built bed sill downstream from Guankou Bridge, where the left bank was destroyed, and the undercutting depth of the bed was more than 1.0 m; (e) local exposure and erosion of the toe board downstream of the bed sill, downstream of which the precast concrete blocks for local scour protection were washed away to a lower reach; and (f) bad water quality upstream of the bed sills.

Figure 4.
Experimental design: (a) diagrammatic sketch of the experimental installation; (b) sketches of the structures including a bed sill and a tetrahedron frame; and (c) particle-size distribution curves for the sediments in the natural river and used in the experiments.
Figure 4.
Experimental design: (a) diagrammatic sketch of the experimental installation; (b) sketches of the structures including a bed sill and a tetrahedron frame; and (c) particle-size distribution curves for the sediments in the natural river and used in the experiments.

Figure 5.
Pictures of the bedforms: (a) bedforms of the original bed before scouring; (b) armor layer after clear scour without any GCSs; (c) bedforms of the riverbed with bed sills after scouring; and (d–f) bedforms of the riverbed with TFPW I, TFPW II and TFPW III after scouring, respectively.
Figure 5.
Pictures of the bedforms: (a) bedforms of the original bed before scouring; (b) armor layer after clear scour without any GCSs; (c) bedforms of the riverbed with bed sills after scouring; and (d–f) bedforms of the riverbed with TFPW I, TFPW II and TFPW III after scouring, respectively.

Figure 6.
Particle size distribution curves in the upstream and downstream reaches under different structural conditions, respectively: (a) without any GCSs; (b) under the protection of bed sills; and (c) under the protection of TFPW 1.
Figure 6.
Particle size distribution curves in the upstream and downstream reaches under different structural conditions, respectively: (a) without any GCSs; (b) under the protection of bed sills; and (c) under the protection of TFPW 1.

Figure 7.
The counter lines for the riverbed without any GCSs: (a) topography variations of riverbed before and after scouring; and (b) relative bed elevation changes, where the positive values mean deposition and the negative values represent degradation.
Figure 7.
The counter lines for the riverbed without any GCSs: (a) topography variations of riverbed before and after scouring; and (b) relative bed elevation changes, where the positive values mean deposition and the negative values represent degradation.

Figure 8.
Topography variations of riverbed before and after scouring under different structural conditions: (a) without bed sills; and (b–d) under the protection of TFPW I–III, respectively.
Figure 8.
Topography variations of riverbed before and after scouring under different structural conditions: (a) without bed sills; and (b–d) under the protection of TFPW I–III, respectively.

Figure 9.
Relative bed elevation changes: (a) with bed sills; and (b–d) with TFPW I–III, respectively, where the positive values mean deposition and the negative values represent degradation.
Figure 9.
Relative bed elevation changes: (a) with bed sills; and (b–d) with TFPW I–III, respectively, where the positive values mean deposition and the negative values represent degradation.

Figure 10.
Flow and bedforms around solid and flexible GCSs: (a,b) pictures and the corresponding schematics of flow patterns during scouring when the riverbed was protected by bed sills and TFPW, respectively; (c–e) pictures of the structures and riverbeds after scouring when the riverbed was protected by bed sills, the random TFPW (TFPW II) and the paved TFPW (TFPW III), respectively; and (f) pictures of the structures and riverbeds after scouring when the riverbed was protected by another random Single TFPW, where some tetrahedron frames were washed away by a simulated catastrophic flood.

Figure 11.
The diagram of velocity variation along the central axis of the flume: (a) with bed sills; (b) with random Single TFPW; (c) with random Double TFPW; and (d) with paved Single TFPW.
Figure 11.
The diagram of velocity variation along the central axis of the flume: (a) with bed sills; (b) with random Single TFPW; (c) with random Double TFPW; and (d) with paved Single TFPW.


Table 1.
Structural characteristics.
| Structure Type | Layout Type | Grade | Width (cm) | Height (cm) | Distance (cm) |
|---|---|---|---|---|---|
| No GCSs | - | - | - | - | - |
| Bed sills | - | Single | 11.5 | 5.3 | - |
| TFPW I | random | Single | 25 | 7.5 | - |
| TFPW II | paved | Double | 25 | 7.5 | 75 |
| TFPW III | random | Single | 75 | 5 | - |
Table 2.
Results of volumes for erosion or deposition in the test reach under different structural conditions.
Table 2.
Results of volumes for erosion or deposition in the test reach under different structural conditions.
| Structures | Volumes of Erosion or Deposition (m3) | ||
|---|---|---|---|
| Upstream | Downstream | In Total | |
| No GCSs | −0.003610 | −0.027177 | −0.030787 |
| Bed sills | +0.003980 | −0.031265 | −0.027285 |
| TFPW I | +0.016852 | +0.010932 | +0.027884 |
| TFPW II | −0.028209 (+0.007842) 1 | +0.016801 | −0.011408 |
| TFPW III | +0.002571 | +0.024306 | +0.026877 |
Note: 1 The positive value in the bracket is the deposition volume upstream of TFPW II, but the total volume in the upper reach was negative (the positive values mean deposition whereas the negative values mean degradation).
© 2018 by the authors. Licensee MDPI, Basel, Switzerland. This article is an open access article distributed under the terms and conditions of the Creative Commons Attribution (CC BY) license (http://creativecommons.org/licenses/by/4.0/).
Share and Cite
MDPI and ACS Style
Wang, J.-m.; Yang, X.-g.; Zhou, H.-w.; Lin, X.; Jiang, R.; Lv, E.-q. Bed Morphology around Various Solid and Flexible Grade Control Structures in an Unstable Gravel-Bed River. Water 2018, 10, 822. https://doi.org/10.3390/w10070822
AMA Style
Wang J-m, Yang X-g, Zhou H-w, Lin X, Jiang R, Lv E-q. Bed Morphology around Various Solid and Flexible Grade Control Structures in an Unstable Gravel-Bed River. Water. 2018; 10(7):822. https://doi.org/10.3390/w10070822
Chicago/Turabian StyleWang, Jia-mei, Xing-guo Yang, Hong-wei Zhou, Xing Lin, Rui Jiang, and En-quan Lv. 2018. "Bed Morphology around Various Solid and Flexible Grade Control Structures in an Unstable Gravel-Bed River" Water 10, no. 7: 822. https://doi.org/10.3390/w10070822
Note that from the first issue of 2016, this journal uses article numbers instead of page numbers. See further details here.