Article

Efficiency Assessment of Existing Pumping/Hydraulic Network Systems to Mitigate Flooding in Low-Lying Coastal Regions under Different Scenarios of Sea Level Rise: The Mazzocchio Area Study Case

by
Francesco Cioffi
*,
Alessandro De Bonis Trapella
and
Federico Rosario Conticello
DICEA—Dipartimento di Ingegneria Civile, Edile ed Ambientale—Università di Roma ‘La Sapienza’, 00184 Rome, Italy
*
Author to whom correspondence should be addressed.
Water 2018, 10(7), 820; https://doi.org/10.3390/w10070820
Submission received: 11 May 2018 / Revised: 16 June 2018 / Accepted: 18 June 2018 / Published: 21 June 2018

Abstract

:
Rising of the sea level and/or heavy rainfall intensification significantly enhance the risk of flooding in low-lying coastal reclamation areas. Therefore, there is a necessity to assess whether channel hydraulic networks and pumping systems are still efficient and reliable in managing risks of flooding in such areas in the future. This study addresses these issues for the pumping system of the Mazzocchio area, which is the most depressed area within the Pontina plain, a large reclamation region in the south of Lazio (Italy). For this area, in order to assess climate change impact, a novel methodological approach is proposed, based on the development of a simulation–optimization model, which combines a multiobjective evolutionary algorithm and a hydraulic model. For assigned extreme rainfall events and sea levels, the model calculates sets of Pareto optimal solutions which are obtained by defining two optimality criteria: (a) to minimize the flooding surface in the considered area; (b) to minimize the pumping power necessary to mitigate the flooding. The application shows that the carrying capacity of the hydraulic network downstream of the pumping system is insufficient to cope with future sea level rise and intensification of rainfall.

1. Introduction

Recent studies have shown that in Central Italy, the occurrence of torrential rainfall, exceeding 100 mm/d, has increased in the last decades [1]. Furthermore, future projections by global and regional climate models indicate an intensification of extreme precipitation events in Italy [2,3,4]. As a consequence of global warming, sea level rise is also expected in the next years in the Mediterranean region [5,6]. Lambeck et al. [7] have argued that in the central Tyrrhenian Sea, sea level rise will mainly impact the coasts near Rome. Some of these coasts include the southern Latium, with its mainly coastal lakes, the Voltuno littoral, and the Sele River area, with sea level rise ranging from 315 to 1400 mm, depending on the climate scenario considered. Rising sea levels and intensification of extreme precipitation significantly increases the flood risk in such low-lying coastal areas. This has some substantial consequences, as the coastal areas around Rome are densely populated, with extensive and highly developed agriculture along with a large presence of industrial activity.
Within this region, an area particularly vulnerable to flooding is in the Mazzocchio zone, the lowest lying area of the Pontina plain (see Figure 1a). The majority of this zone has a soil surface elevation equal to or lower than the mean sea level. Historically a swamp, this zone was recovered in the years 1926–1937 by a large reclamation work covering an area of 20,000 ha.
As seen in Figure 1a, the Mazzocchio zone is enclosed by two rivers: Ufente in the north and Linea Pio in the south. To ensure dry soil, water runoff is intercepted within and outside the zone. To intercept the runoff outside the zone, the two rivers act as barriers, and within the zone, water runoff—caused by rainfall over the zone—is collected by a dense channel network in the Selcella River. Downstream of the Selcella River, there is a pumping station which lifts the water from the Mazzocchio area into the Ufente River, with a maximum capacity of 36 m3/s. Figure 1a shows the water coming from the upstream basins of the Ufente, Linea Pio, and Amaseno Rivers, together with the pumping water from the Mazzocchio area, flowing through the Portatore Channel towards the sea.
On 7 November 2014, a heavy rainfall event (approximately 100 mm/d) caused a serious crisis to the entire channel network, with flooding in the Mazzocchio area and overflowing and subsequent collapse of a large portion of the levees along the Ufente River. Most of the damage occurred along the Ufente River stretch closer to the Mazzocchio pumping station (downstream from the confluence with the Selcella collector). High rainfall amount and sea level rise due to storm surge at the outlet of the Portatore channel were the two main factors which caused the crisis of hydraulic system.
As mentioned before, the expected intensification and increment in frequency of such extreme rainfall events, as well as the sea level rise, causes serious concerns with regard to the capability of the hydraulic infrastructures to cope with similar or more intense events in the future. Therefore, methodological approaches need to be developed to assess the efficiency and reliability of existing hydraulic infrastructures. As a number of authors suggest, such methodologies must evolve to address “change” from climate variability at the global scale to local human impacts [8,9]. Recently, rainfall downscaling models have been constructed to perform projections of rainfall occurrence and amount at the basin level, under different global warming scenarios simulated by global or regional circulation models (GCMs and RCMs) [10,11]. Therefore, such models can be used to provide the hydrological inputs necessary to run hydraulic models to assess the reliability of existing hydraulic infrastructures, and eventually the design of new ones, to manage future flooding risk at the local scale. Preliminary to such assessment, it is, however, necessary to perform an analysis on the capability of the existing infrastructure to manage the risk of flooding due to extreme rainfall and high tidal sea level events. This is very useful to identify the elements of the hydraulic network which are more vulnerable.
In this context, we propose a methodology and related models to assess the reliability of hydraulic infrastructures in control flooding events and apply it for the case of the reclamation region of Mazzocchio. The first question that arises in developing such a methodology is how to assess the reliability and efficiency of existing pumping–hydraulic network systems to mitigate flooding in the Mazzocchio basin under different hydrological inputs. This question arises because different pumping schedules can be hypothesized to manage extreme stream flows. In other words, as a consequence of adopting alternative pumping schedules, for the same set of hydrological inputs, a number of different configurations of hydraulic systems may potentially exist. In order to compare the effects of the different hydrologic inputs on the hydraulic system, we should identify a particular set of pumping schedules. This restricts the analysis to a few arbitrarily chosen cases of pumping schedules. To perform a more general and less restrictive analysis, in order to compare the possible different configurations of a hydraulic system under different hydrological inputs, this paper proposes to use sets of Pareto optimal solutions as calculated by a multiobjective optimization approach, in which the switching on/off levels of the pump system are assumed as decision variables. Given two or more optimality criteria, the Pareto set identifies not a unique optimal solution, but an ensemble of nondominant configurations of the system that belong to the Pareto front. Such a set of non-dominant solutions is chosen as optimal, if no objective can be improved without sacrificing at least one other objective. Therefore, for given hydrological inputs, the set of Pareto optimal solutions is unique. This solution can then be used to compare the possible states of the hydraulic system (as identified by the free surface levels and flow rates along the rivers and channel networks) forced by different hydrological inputs—rainfall amount and sea level rise—and depending on the optimal pumping schedules associated to the solutions lying in the Pareto front. In this paper, the sets of Pareto optimal solutions are calculated by a simulation–optimization model, which combines a multiobjective evolutionary algorithm (the non-dominating sorting genetic algorithm, NSGA2) and a hydraulic model. While a number of optimization methods exist [12], we use a genetic algorithm due to their reliability in solving nonlinear, nonconvex, multimodal, and discrete problems, unlike classical optimization methods [8]. Since genetic algorithms are independent of derivative information, they also allow a less restricted formalization of the objective functions and constraints. Even though a number of genetic algorithms have been proposed in the past, we adhered to NSGA2, since a number of studies have proved the reliability and robustness of such an algorithm [13]. The use of a simulation–optimization model, in which a multiobjective optimization model and hydraulic model are combined, is not novel in the literature. For instance, Cioffi and Gallerano [13], proposed a multiobjective programming model including output from 2D hydraulic simulation for habitat assessment to optimize power production and fish habitat suitability as a Pareto set. In the past, a number of simulation–optimization models specifically aimed to find the optimal schedule of pumping systems have been proposed for urban drainage systems [14,15,16], irrigation pumping stations [17], water supply systems [18], and water resource management [19]. However, the above-cited studies were mainly focused on the optimal control and operation of such systems. Some researchers have proposed criteria and methodologies that use simulation–optimization models to assess how climate change and global warming affect the hydrologic cycle and its effects on the performance of water resource systems. Most of these studies are addressed to assessing the climate change impacts on hydropower production by reservoirs [20,21,22]. Direct application of multiobjective optimization to flood risk management under climate change is very rare in the literature [23]. Most of the papers focus on cost–benefit analysis [24]. For instance, Woodward et al. [25] identify a set of Pareto optimal solutions using NSGA2, in which costs and benefits of flood risk intervention strategies are compared, taking into account the uncertainty in the future projected sea level rise. In such studies, flooding simulations by hydraulic models are carried out separately from the optimization process; the output from hydraulic simulations are used to assess the costs and benefits related to the specific flood risk intervention strategy hypothesized. Such approaches, however, seem difficult to apply in the cases in which pumping systems are part of flooding control hydraulic infrastructures. In this paper, the hydraulic simulations are integrated in the multiobjective optimization algorithm and the objective functions are not defined on the basis of economic variables, but directly in terms of flooding surface and pumping power. The main reason of such a choice is due to the uncertainty of the estimation of damage from flooding, since agriculture is the main activity over the basin, and productivity and damage depend on the period of the year, as well as the type and state of growth of crops. To calculate the sets of Pareto optimal solutions, two optimality criteria are defined: (a) to minimize the maximum flooding surface over the Mazzocchio basin; (b) to minimize the pumping power necessary to limit the flooding over the Mazzocchio basin. In formalizing the multiobjective problem, the state variables are the free surface levels and flow rates along the hydraulic network as well as the surface of the flooding areas, and the decisional variables are the levels switching on and off the pumps in the Mazzocchio station. Temporal and spatial distribution of the rainfall amount and the sea level are the input variables. State and decisional variables range within the constraints imposed by the flow carrying capacity of the channel network downstream from the pumping station. The hydraulic state variables are simulated by a hydraulic model. In order to limit the calculation time, due to the large number of simulations necessary to solve the multiobjective problem by the genetic algorithm, a simplified version of the hydraulic model has been constructed to represent the flow river network and the rainfall–runoff and flooding processes over the river basins. The calculation along the river network is performed numerically solving the 1D de Saint-Venant equations, while the basins are represented by storage areas connected to the river network by linear channels. The paper is organized as follows: In Section 2, a description of the study areas and hydrological data is provided; in Section 2 also, the hydraulic and multiobjective optimization models are described. In Section 3, the procedure of calibration and validation for the hydraulic model, the construction of the design hydrograph, and finally the set of Pareto optimal solutions for the Mazzocchio zone obtained by solving the multiobjective problem are discussed. Comparing the different Pareto sets, the reliability of the existing pumping systems and of the hydraulic channel network is inferred.

2. Materials and Methods

2.1. Materials

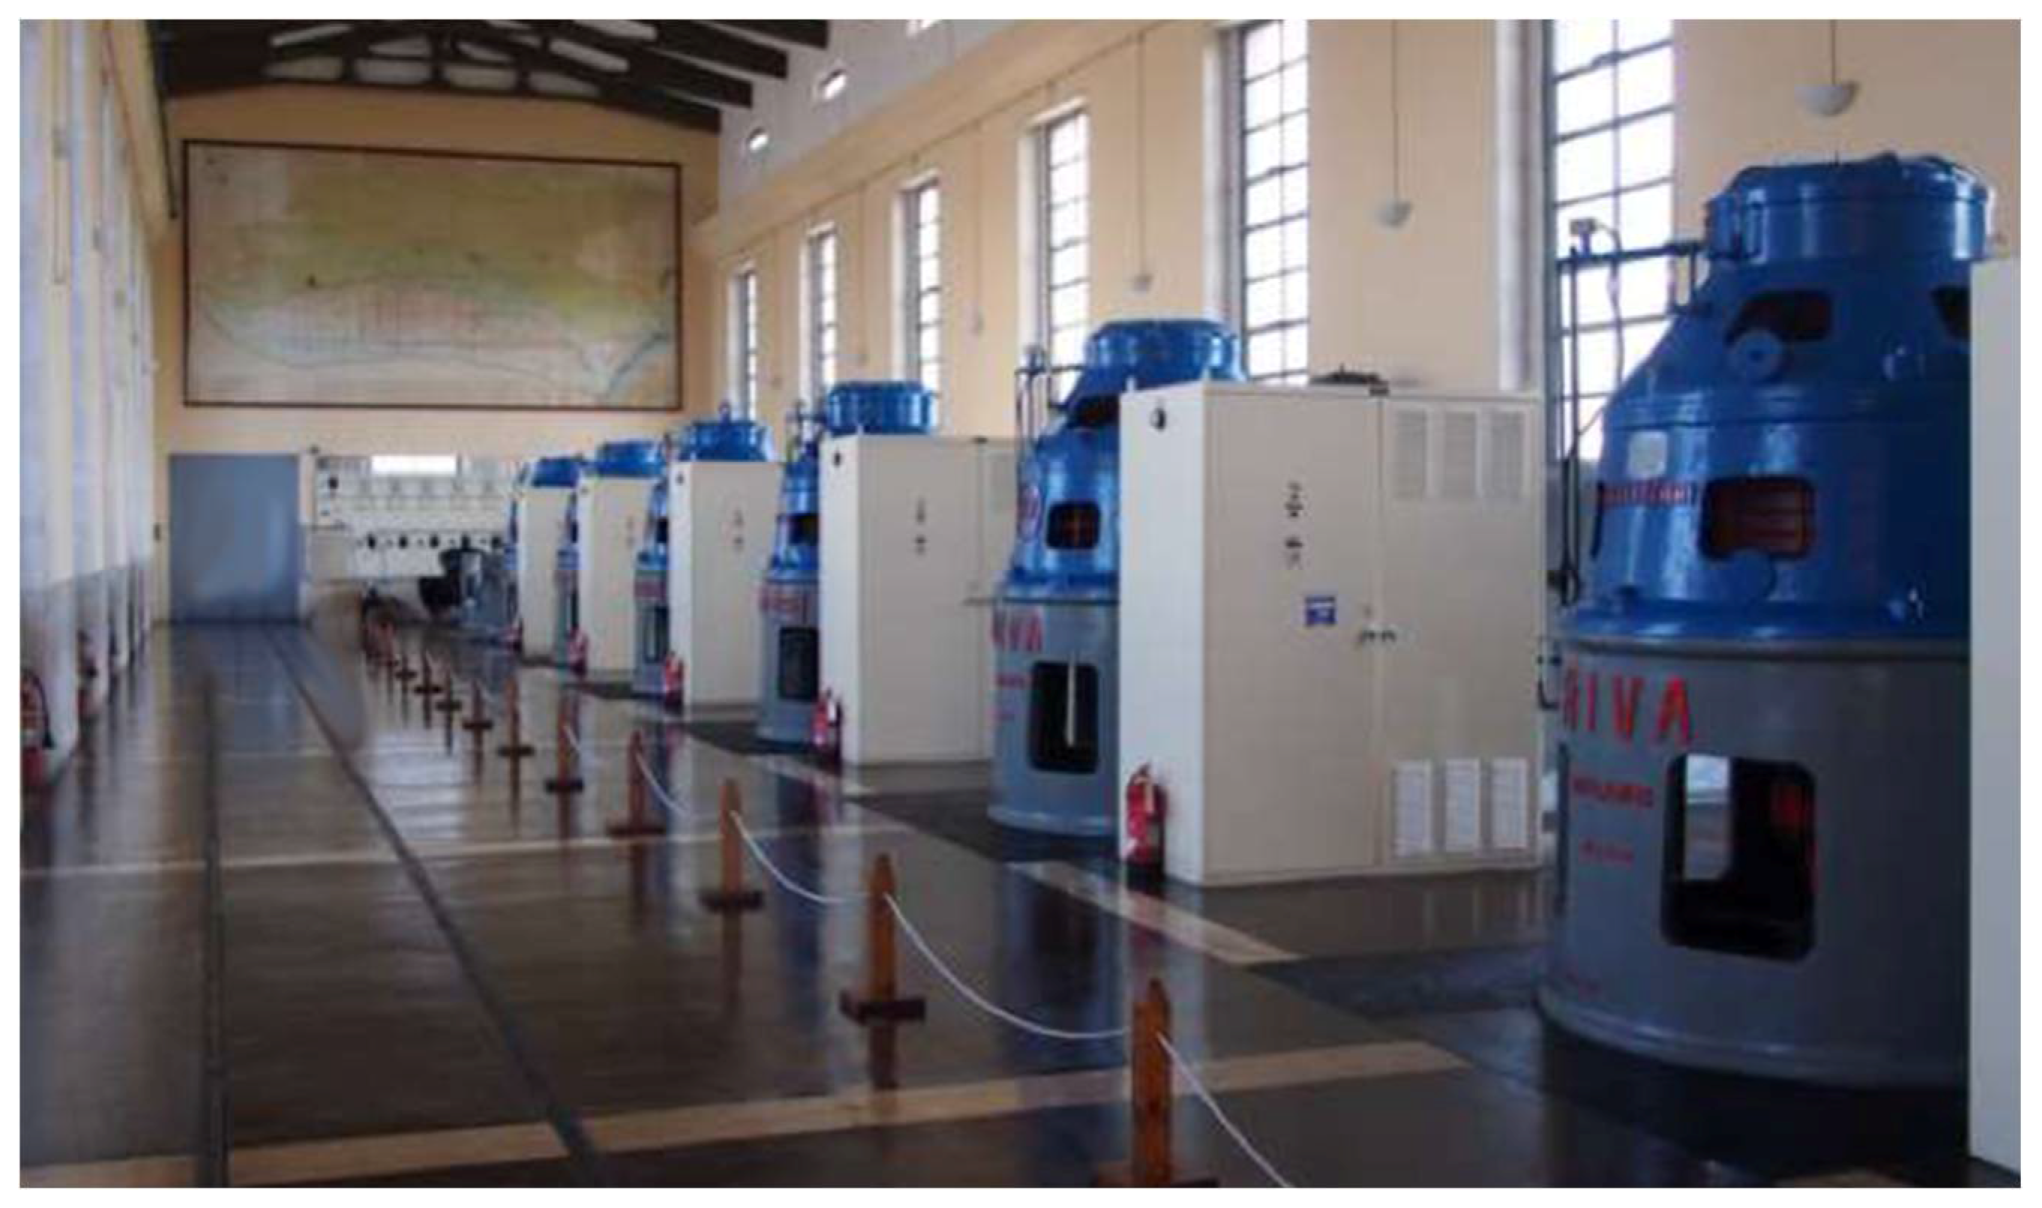
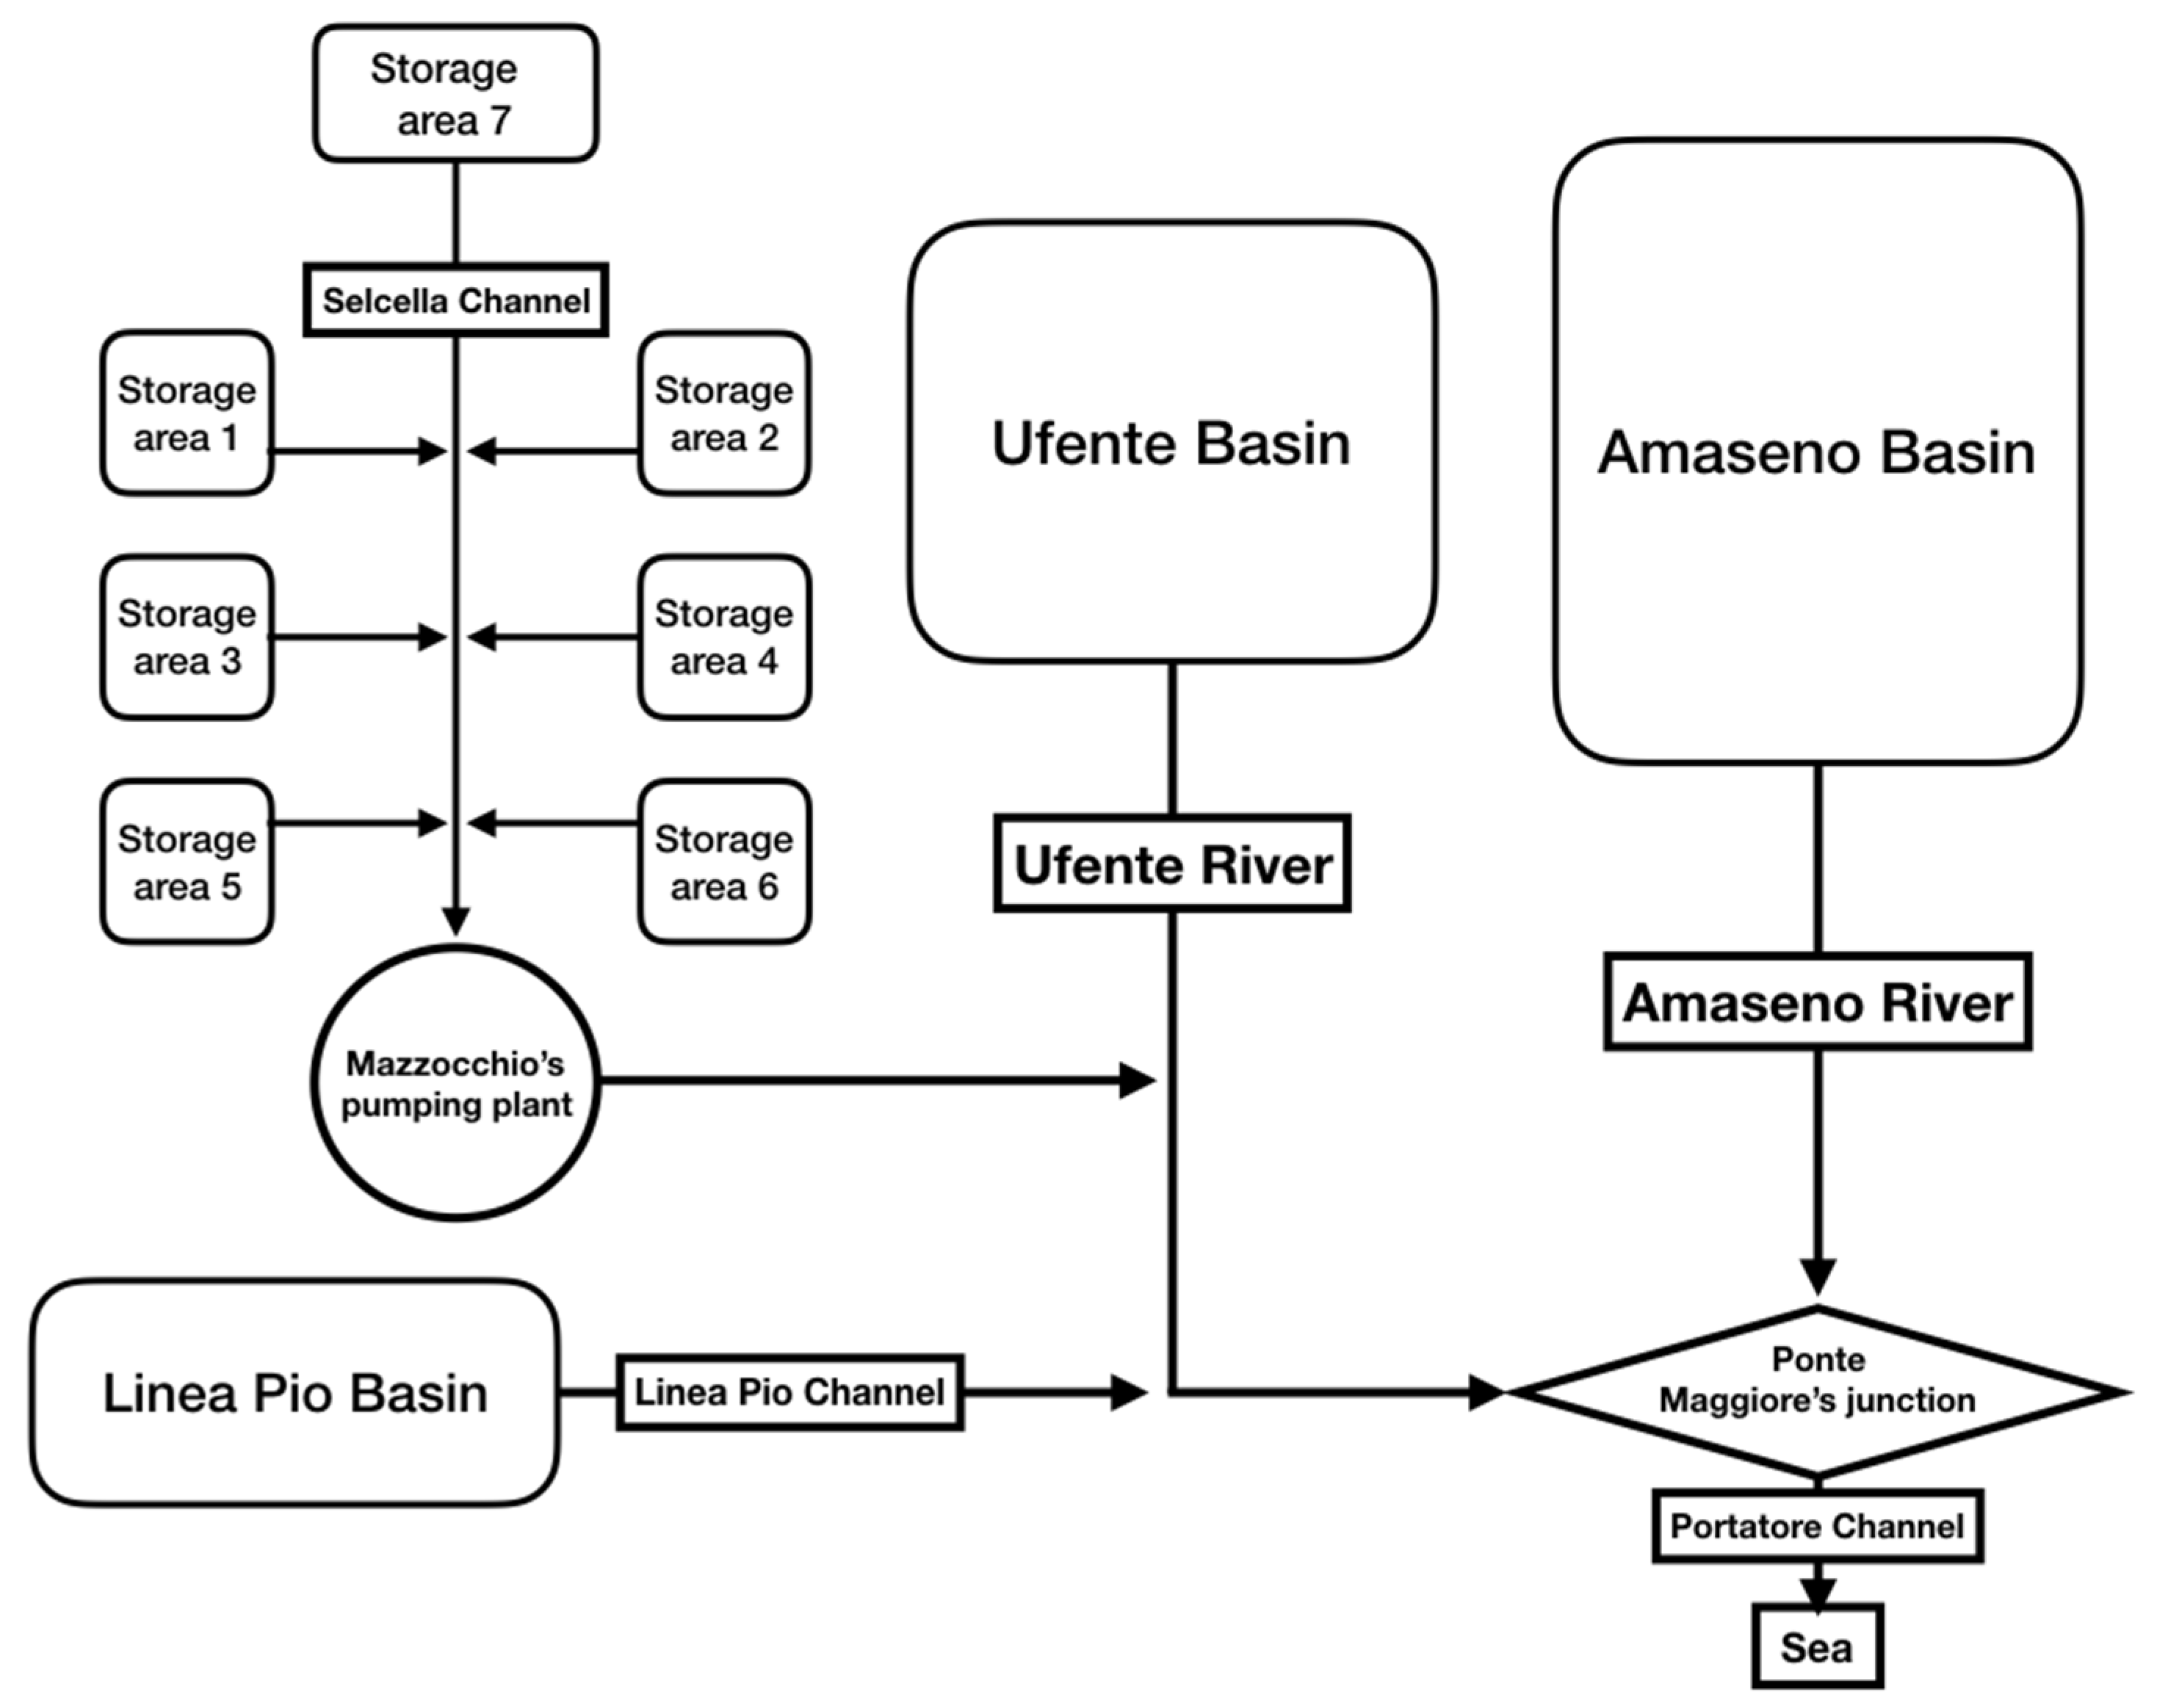
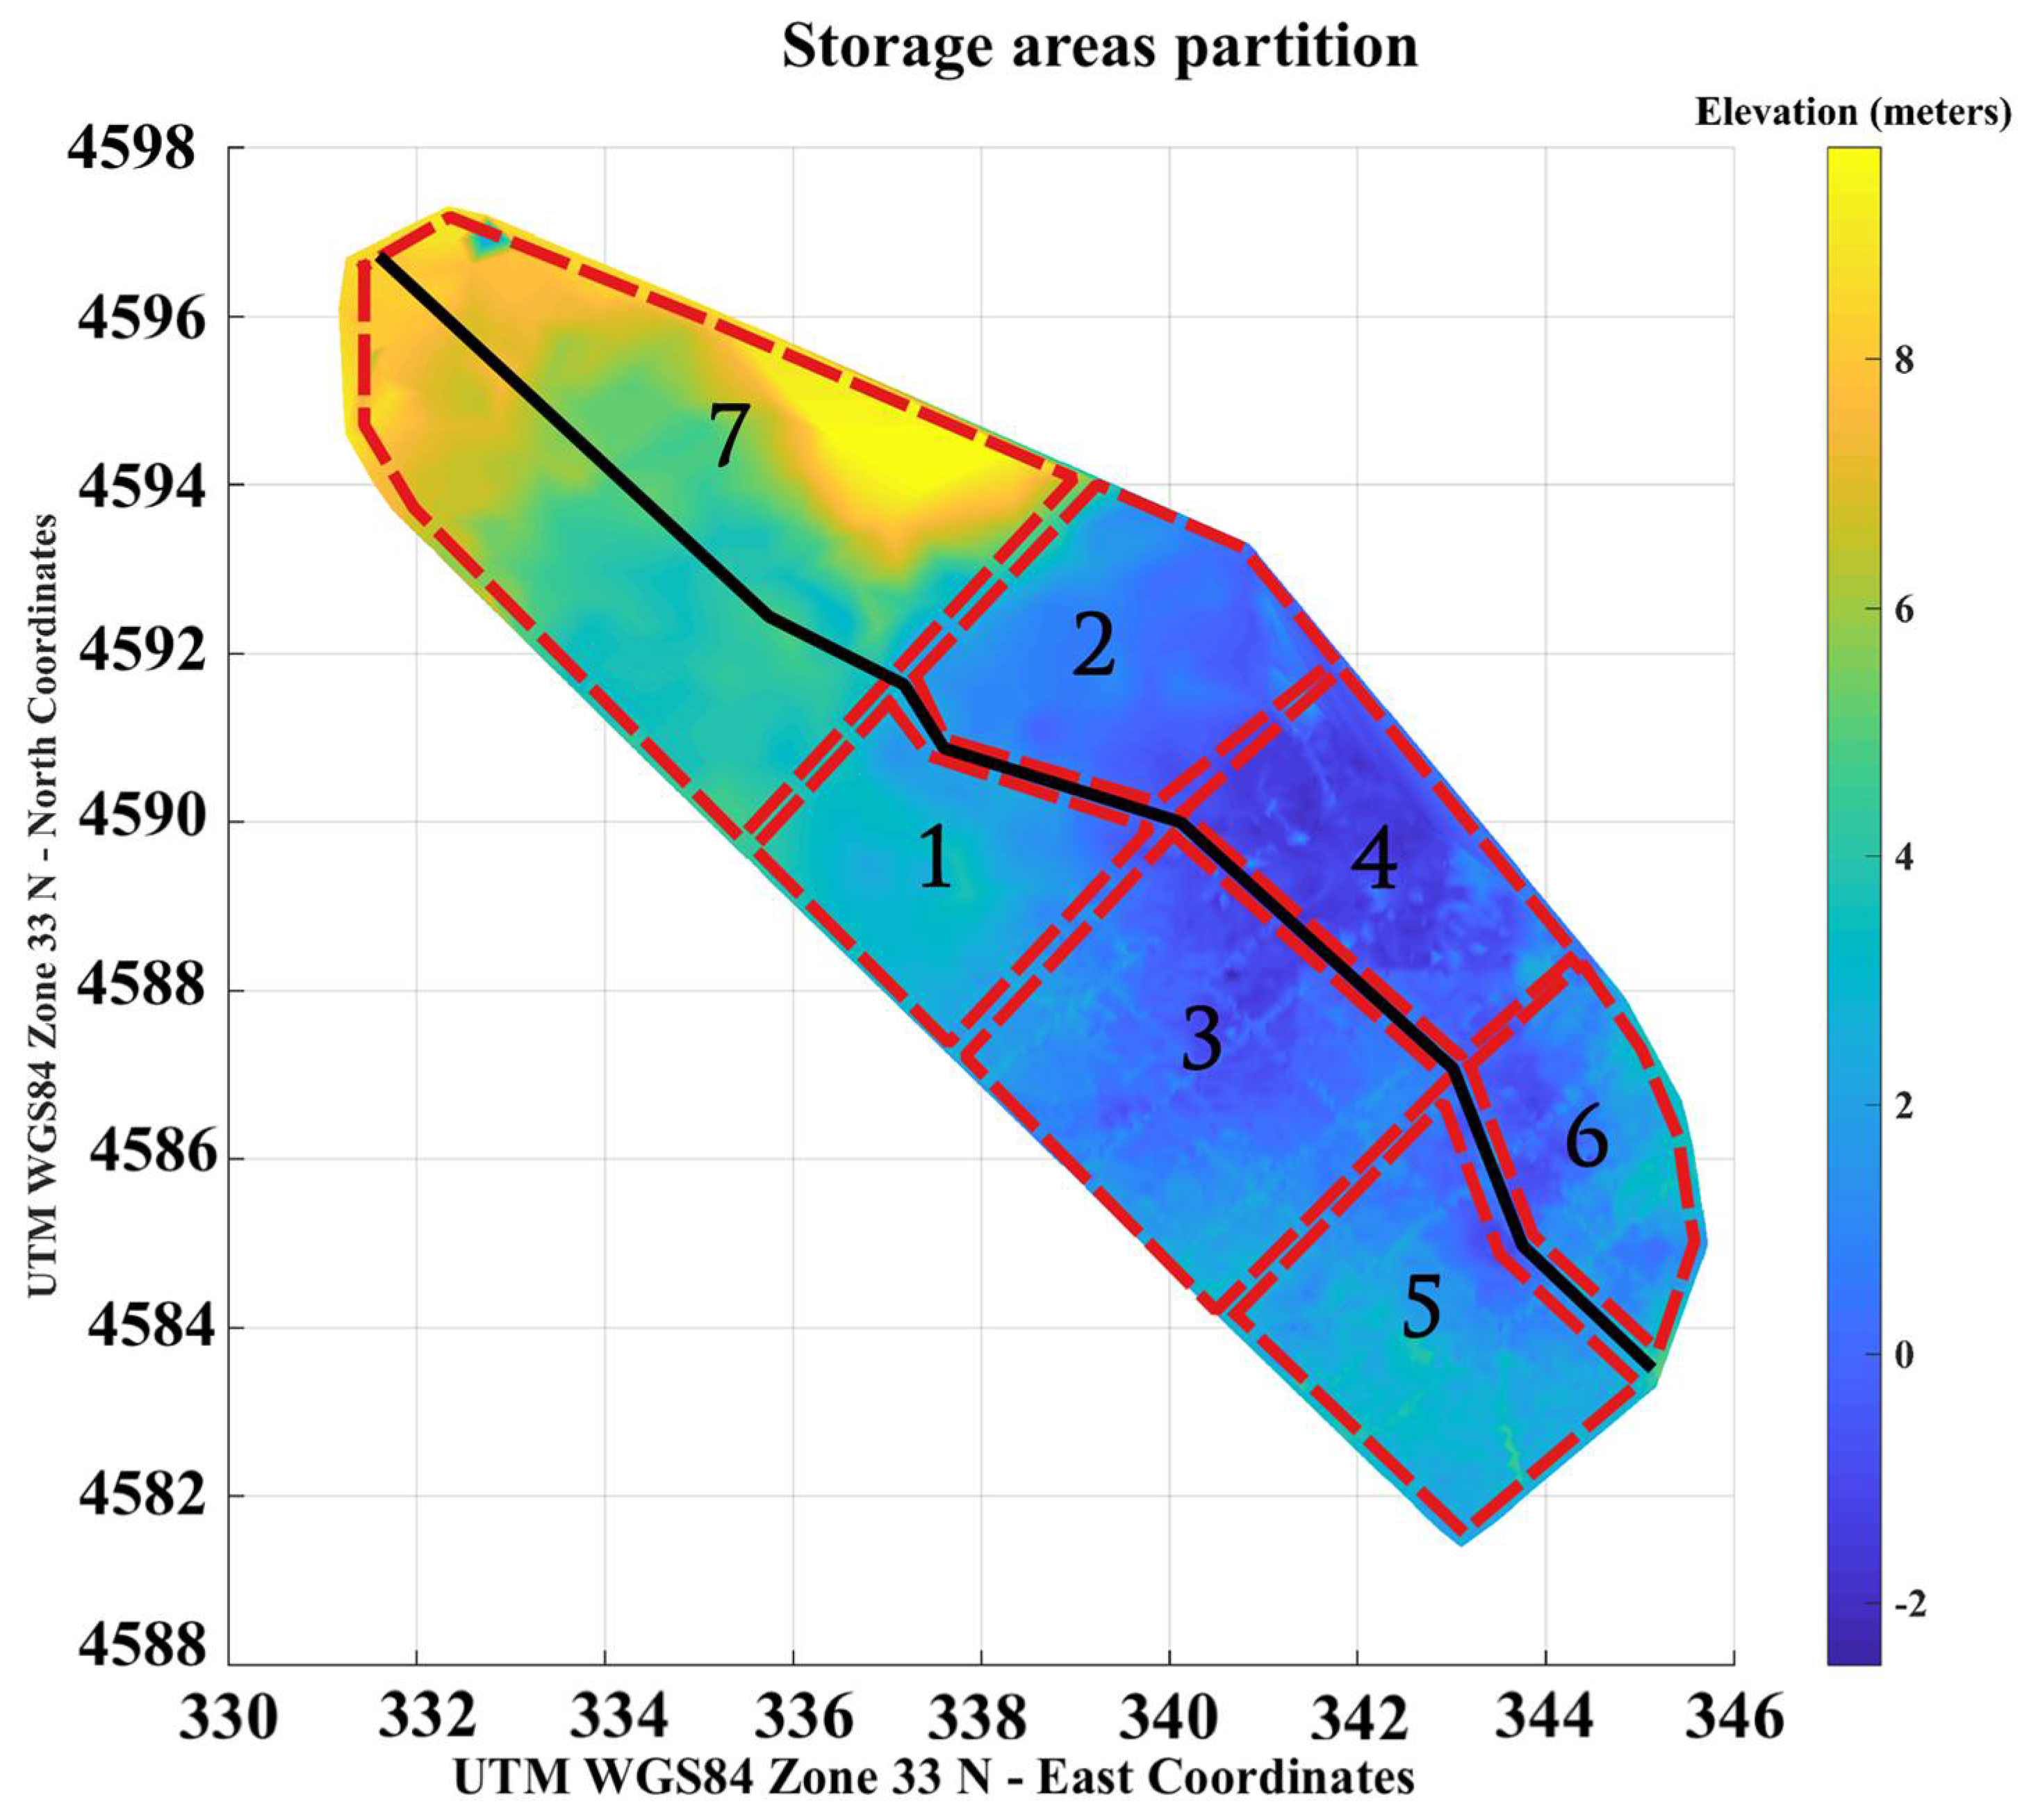
2.1.1. The Mazzocchio Reclamation Area and the Drainage Hydraulic Network

The Mazzocchio basin, with a surface about equal to 103 km2, occupies the largest depression of the Pontina Plain, which lies between the Appia and the Ufente River. The drainage of the basin is provided by the pumping plant of Mazzocchio (see Figure 1a) located at the downstream end of the Selcella river. The Selcella river is 18.9 km long with an average slope (h/L) of 0.00035. The terrain of the Mazzocchio basin is shown in Figure 1b; the ground height above mean sea level ranges from −2 m in the central stretch of the Selcella river to +8 m in the upstream region. From Figure 1b, we can observe the presence of a large area with about the same or lower height than the mean sea level. Furthermore, a dense channel network hierarchically structured, can be observed in Figure 1a collecting water to the Selcella River. All the water that flows to the Mazzocchio plant is lifted and through a short channel, conveyed into the Ufente river. The Mazzocchio pumping system (Figure 2) at the downstream end of the river Selcella consists of six pump groups of 6 m3/s each with a total capacity of about 36 m3/s. The pumping system was built on 20 July 1934 and inaugurated on 19 December of the same year; it is equipped with six engines and six water-immersion pumps with a modern conception for the era, each with a capacity of 6000 L per second and powered by an electric motor of about 600 hp. During the Second World War, German troops sabotaged the plant, taking away the engines. Flooding of the surrounding land meant hindering the entry by the allies. In 1948, near the Brenner railway station, located in Northern Italy, the engines were found and immediately reinstalled.
The starting and stopping of each pump is ruled by floating switches, which depend on the prefixed free surface levels in the collection pond immediately upstream from the pumping station. The depth of the pond close to the floating switches is −4 m.a.s.l. The pump starting and stopping levels are reported in Table 1.
Downstream of the pumping system of Mazzocchio, the waters flow into the Ufente River, which flows into the hydraulic node of Ponte Maggiore. Ponte Maggiore also receives water from the Amaseno River and the Pio Line Channel flow. From the Ponte Maggiore node, through the Portatore Channel, all the water flows into the sea (see Figure 1a). The main characteristics of the hydraulic network downstream from the pumping station are reported in Table 2.
The geometric and morphological characteristic of the entire hydraulic network (river slope, size and shape of cross-sections, etc.) as well as maintenance and operation of the pumping systems described above were provided by the Agro Pontino Reclamation Consortium (APRC).

2.1.2. Precipitation and Pumping Rate Data

The closest station to the study area is the Borgo San Michele station (Lat. 41°25′12′′ N Lon. 12°58′12′′ E), from which 56 years (1950–2005) of hourly rainfall data has been collected. From this record, intensity and duration curves, with return periods equal to 10 and 100 years are shown in Figure 3. Hourly data of pump operation for the period 1950–2016, recorded in the archive of the Mazzocchio pumping station and provided by APRC, are also collected. From the time series of hourly rainfall amount, a number of heavy rainfall events that occurred in the past are identified, and the corresponding temporal trends of pumping discharge during such events are reconstructed. The latter data are used to calibrate the hydraulic model. The data related to the ground surface level, the bed profiles of rivers, and the geometry of river cross sections were also provided by the APRC.

2.2. Methods

The simulation–optimization model combines a hydraulic model and a multiobjective optimization model. The hydraulic model calculates the free surface level and the flowrate along rivers and channels upstream and downstream of the Mazzocchio pumping station, the flooding areas over the basins, and the pumped flowrate at the pumping station. The multiobjective optimization genetic algorithm, using the outputs from the hydraulic model, calculates the objective functions, verifies the constraints violations, and by an iterative procedure based on tournament selection of nondominant solutions and generation of new populations by crossover and mutation, identifies the set of Pareto optimal solutions. A sketch of the flowchart of the combined simulation–optimization model is shown in Figure 4.

2.2.1. Hydraulic Model

For given input variables—rainfall amount over the basins and sea levels—as well as for given pumping switching levels in the collection pond upstream of the Mazzocchio pumping station, the hydraulic model calculates the outputs related to free surface levels and flowrates along the entire hydraulic network, flooding surface, water volumes, and depths over the basins. To simulate the temporal and spatial distribution of these quantities, 2D and 3D hydraulic models are generally used, as proposed by Cioffi and Gallerano [26] and Orton et al. [27]. Such models require a computation time which conflicts with the very high number of simulations necessary for the multiobjective optimization algorithm to calculate the Pareto front. Therefore, in this paper, a simplified hydraulic model has been constructed. This model is able to calculate the above listed hydraulic quantities after calibration. The scheme of such models, for the hydraulic networks upstream and downstream from the Mazzocchio pumping station, is shown in Figure 5.
Three different hydraulic elements may be recognized in the figure: the main river hydraulic networks upstream and downstream from the pumping station, the storage areas representing the basins, and the ideal channels connecting the storage areas to points of the rivers belonging to the hydraulic networks. As seen in the figure, the basin of Mazzocchio, upstream from the pumping station, is represented by seven storage areas connected to the river Selcella by ideal channels. Figure 6 shows how the storage areas refer to parts of the basin with homogeneous morphology and altimetry, in order to provide a sufficiently accurate representation of the spatial distribution of ground surface elevation.
The ideal channels mimic the secondary drainage network collecting the rainfall water to the Selcella river. For the hydraulic network downstream from the pumping station, storage areas and related ideal channels are located upstream of the Amaseno, Ufente, and Linea Pio rivers. The combination of storage areas and ideal channels allows for a representation of both the rainfall–runoff processes on the basins and the flooding over the riverbanks due to levee overflowing.
The 1D de Saint-Venant equations are used to simulate the flow along the river which belongs to the hydraulic networks:
Q x + S t = q l
Q t + x ( β Q 2 S ) + g S ( H x + J ) = γ l
where Q is the flow rate, S the cross-section area, H the free surface elevation from a reference plane, and ql represents the lateral inflow, γ l represents the sum of the forces applied, and J is a dimensionless number, representing the average rate of energy dissipation:
J = Q 2 K m 2 S 2 R 4 / 3
where Km is the Strickler’s roughness coefficient and R the hydraulic radius.
A number of river junctions (nodes) are present in the hydraulic network downstream from the pumping station (Figure 5). The equations of the junctions are derived from the equality of the elevations and the conservation of the discharges at the junction following the approach of 1D–2D coupling proposed by Goutal et al. [28]. The temporal trend of water level over the storage areas is calculated by the continuity equation, which is a function of the flows entering or going out from the ideal channels and of the rainfall amount directly falling over the area. It is assumed that the water free surface of the storage areas remains horizontal while moving vertically. The link between the storage area and the river is seen in Figure 7.
The flow rate through the ideal channels is calculated by the Manning–Stricker uniform free surface flow formula and depends on the difference of the free surface levels in the storage areas and in the river according to the following equations:
Q = K l h 5 / 3 Δ H L
where, as shown in Figure 7, Δ H is the difference between the free surface elevation h2 in the storage cell and h1 in the river, L is the length of the channel, l is the channel width, and h is the water depth in the channel, which is equal to the average between h2 and h1 (see Figure 7). Both h2 and h1 depend on the bottom elevation Hc of the ideal channel.

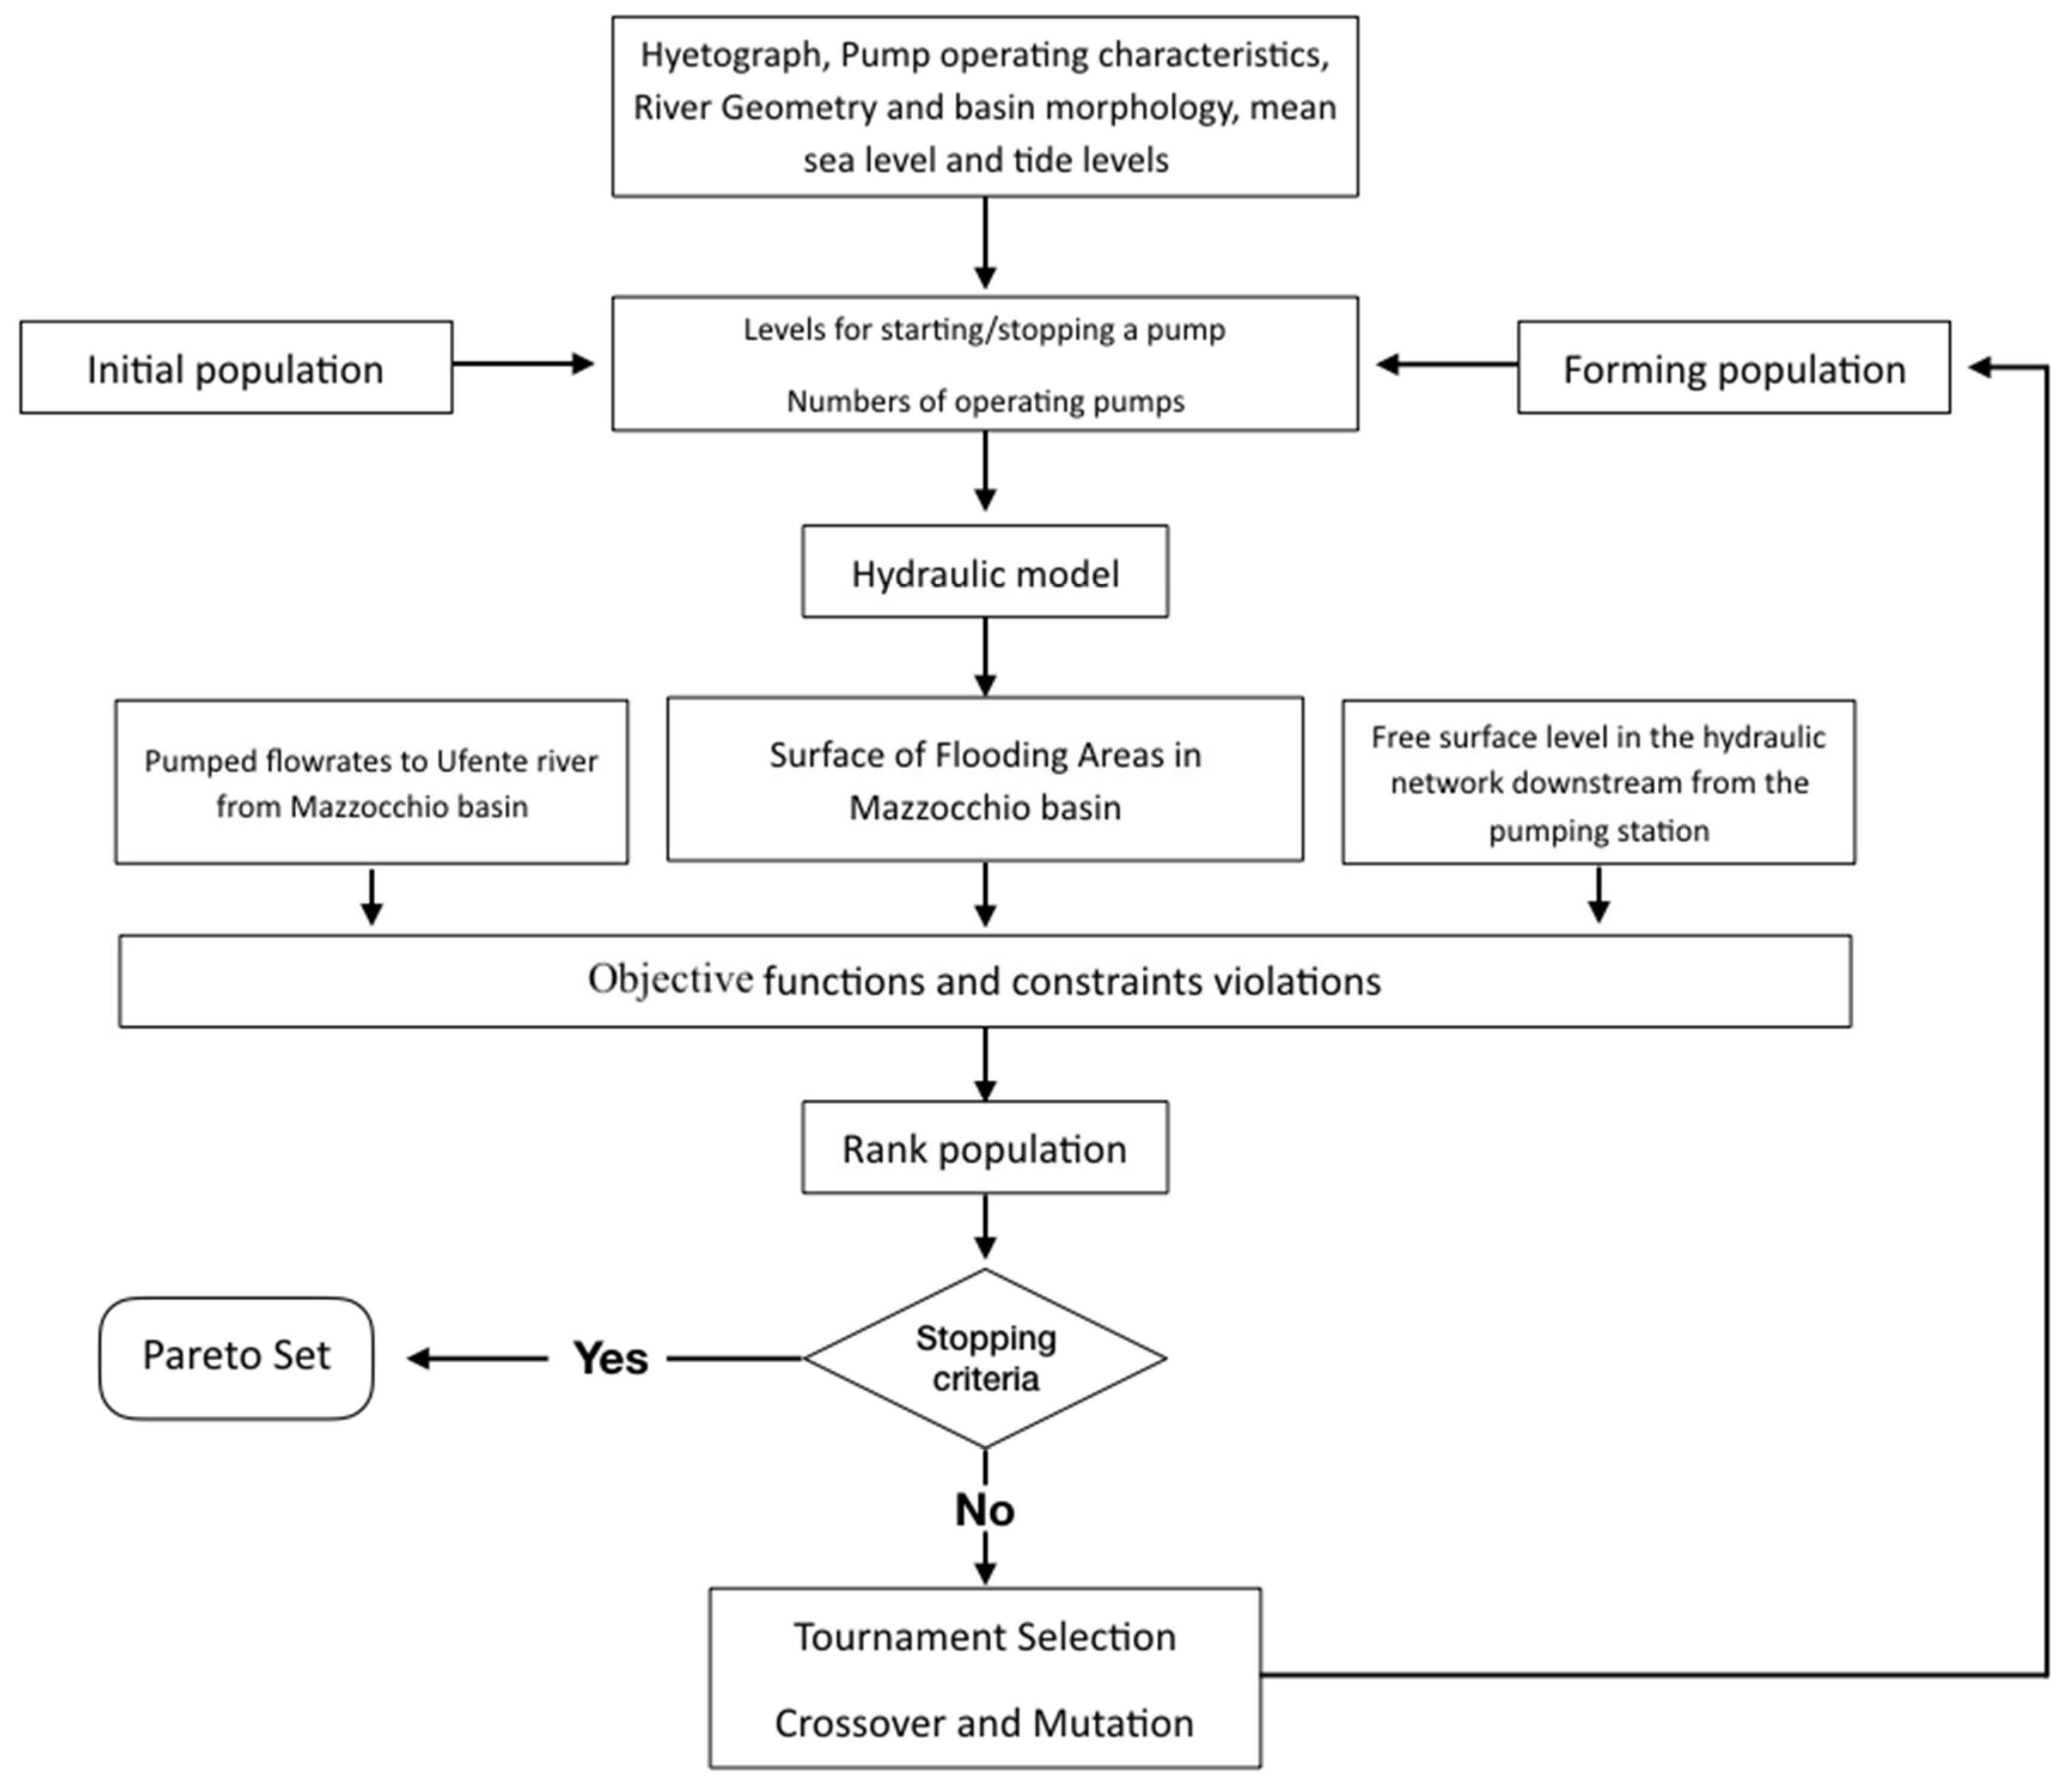
2.2.2. Multiobjective Optimization Problem Formalization

In formalizing the multiobjective problem, we assume the levels switching on and off the pumps in the Mazzocchio station (Hs) as decisional variables. Temporal and spatial distribution of the rainfall amount ( I ) and the sea levels (Sl) are the input variables. The state variables are the free surface levels ( H d ) , the flow rates (Qd) along the hydraulic networks, and the surface of the flooding areas ( A i m ). State and decisional variables range within imposed constraints. Specifically, we impose that the free surface level in the hydraulic network downstream from the pumping station cannot be more than the height of the river levees ( H m a x d ) . The multiobjective optimization problem is formalized defining two optimality criteria: (a) to minimize the maximum surface of flooding areas (Am) over the Mazzocchio basin during a flood event caused by heavy precipitation; (b) to minimize the pumping power necessary for flooding control over the Mazzocchio basin. The pumping power here is defined as the energy consumed to lift water from the beginning of the event to the moment in which the maximum flooding surface over the Mazzocchio basin is reached. The second criterion is aimed to identify pumping schedules that limit, as much as possible, the power used to reduce the flooding surface. Such a criterion also responds to the need to limit the number of pumps working simultaneously in order to allow a more efficient and robust maintenance and operation of the plant.
The multiobjective algorithm is aimed to identify the levels of switching on and off the pumps in the Mazzocchio station which satisfy the optimality criteria described above. The mathematical formulation of the multiobjective optimization problem and the Pareto set calculation algorithms are as follows. The objective functions may be expressed as:
O f 1 = ( m a x ( A 1 m ,   A 2 m ,   , A n m ) )
O f 2 = ( i = 1 T A m a x γ Q i p ( H i m H i p ) Δ t )     ( i = 1 , n )
where A i m , Q i p , H i m , and H i p at each time step i (i = 1, n) are the surface of the flooding area over the Mazzocchio basin, the pumping flowrate at the Mazzocchio pumping station, the free surface levels (from the reference level) in the pond of the Mazzocchio pumping station, and the free surface levels in the basin downstream from the pumping station, respectively; TAmax is the temporal step at which the flooding surface in Mazzocchio reaches the maximum value; n is the number of time steps in which the period of hydraulic simulation Ts is divided; and Δt the temporal step.
The objective functions Of1 and Of2 are constrained by:
Q i p =   n k p Δ Q    i f    H i m H k s    k = 1 , n p    i = 1 , n
H i , j d H m a x , j d    j = 1 , n c    i = 1 , n
where n k p is the number of pumps working simultaneously, ΔQ is the flowrate of each single pump, H k s is the level in the collecting pond upstream of the pumping station switching on the kth pump, and H i , j d and H m a x , j d are the free surface level and the levee top level, respectively, in the jth point along the river stretches of the hydraulic network downstream from the Mazzocchio pumping station.
Equation (7) imposes a constraint on the maximum number of pumps that may work simultaneously and the pumping switching on/off levels. Equation (8) constraints mean that the free surface levels along the hydraulic network downstream from the pumping station must be lower or equal to the top level of the levees of the Ufente, Amaseno, and Linea Pio Rivers and in the Portatore Channel.
The variables A i m , Q i p , H i m , H i p and H i , j d are calculated by the hydraulic model as a function of the decision variable H k s and of the input variables I i and S l i , that is, the temporal trend of the rainfall over the storage areas and the sea level; the latter varies in time with the tidal cycle.
All the hydrodynamic variables of the river flows, that is, free surface levels and flow rates along the two hydraulic networks, are subject to the constraints imposed by the continuity and momentum equations previously described (see Equation (1)).
For given inputs I i and S l i , the resolution of the multiobjective problem requires the minimization of the two objectives Of1 and Of2 in Equations (5) and (6), within the constraints imposed by Equations (7) and (8), as a function of the decision vector H k s with k = 1, np.
Given two decision vectors H k , 1 s and H k , 2 s with k = 1, np, solutions of the multiobjective problem, the identification of the Pareto front is obtained applying Pareto dominance criteria.
In accordance with such criteria, an objective vector y 1 { O f 1 2 , O f 2 2 } is said to dominate another objective vector y 2 { O f 1 2 , O f 2 2 } (i.e., y 1 < y 2 ), if no component of y 1 is greater than the corresponding components of y 2 and at least one component of y 2 is greater; consequently, the solution H k , 1 s dominates H k , 2 s . The nondominant solutions are optimal solutions of the problem whose ensemble identifies the set of Pareto optimal solutions.
A genetic algorithm is applied to solve the multiobjective optimization problem formalized above. Genetic algorithms are based on Darwin’s theory of natural selection, which involves the language of microbiology, and in developing new potential solutions, mimics genetic operations. A population represents a group of solution points, and a generation represents the algorithm iteration, while a chromosome is equivalent to a component of the design vector. In accordance with these definitions, a genetic algorithm deals with a population of points, and hence multiple Pareto optimal solutions can be obtained from a population in a single run. Random numbers and information from previous iterations are combined to evaluate and improve a population of points, and then to select nondominant solutions. In this paper, the nondominant-sorting genetic algorithm II described by Deb et al. [29], NSGA2, is used, which has been applied successfully to many optimization problems. This algorithm uses tournament selection [30], simulated binary crossover (SBX) [31], a mutation operator, and crowding distance for diversity preservation.

3. Results

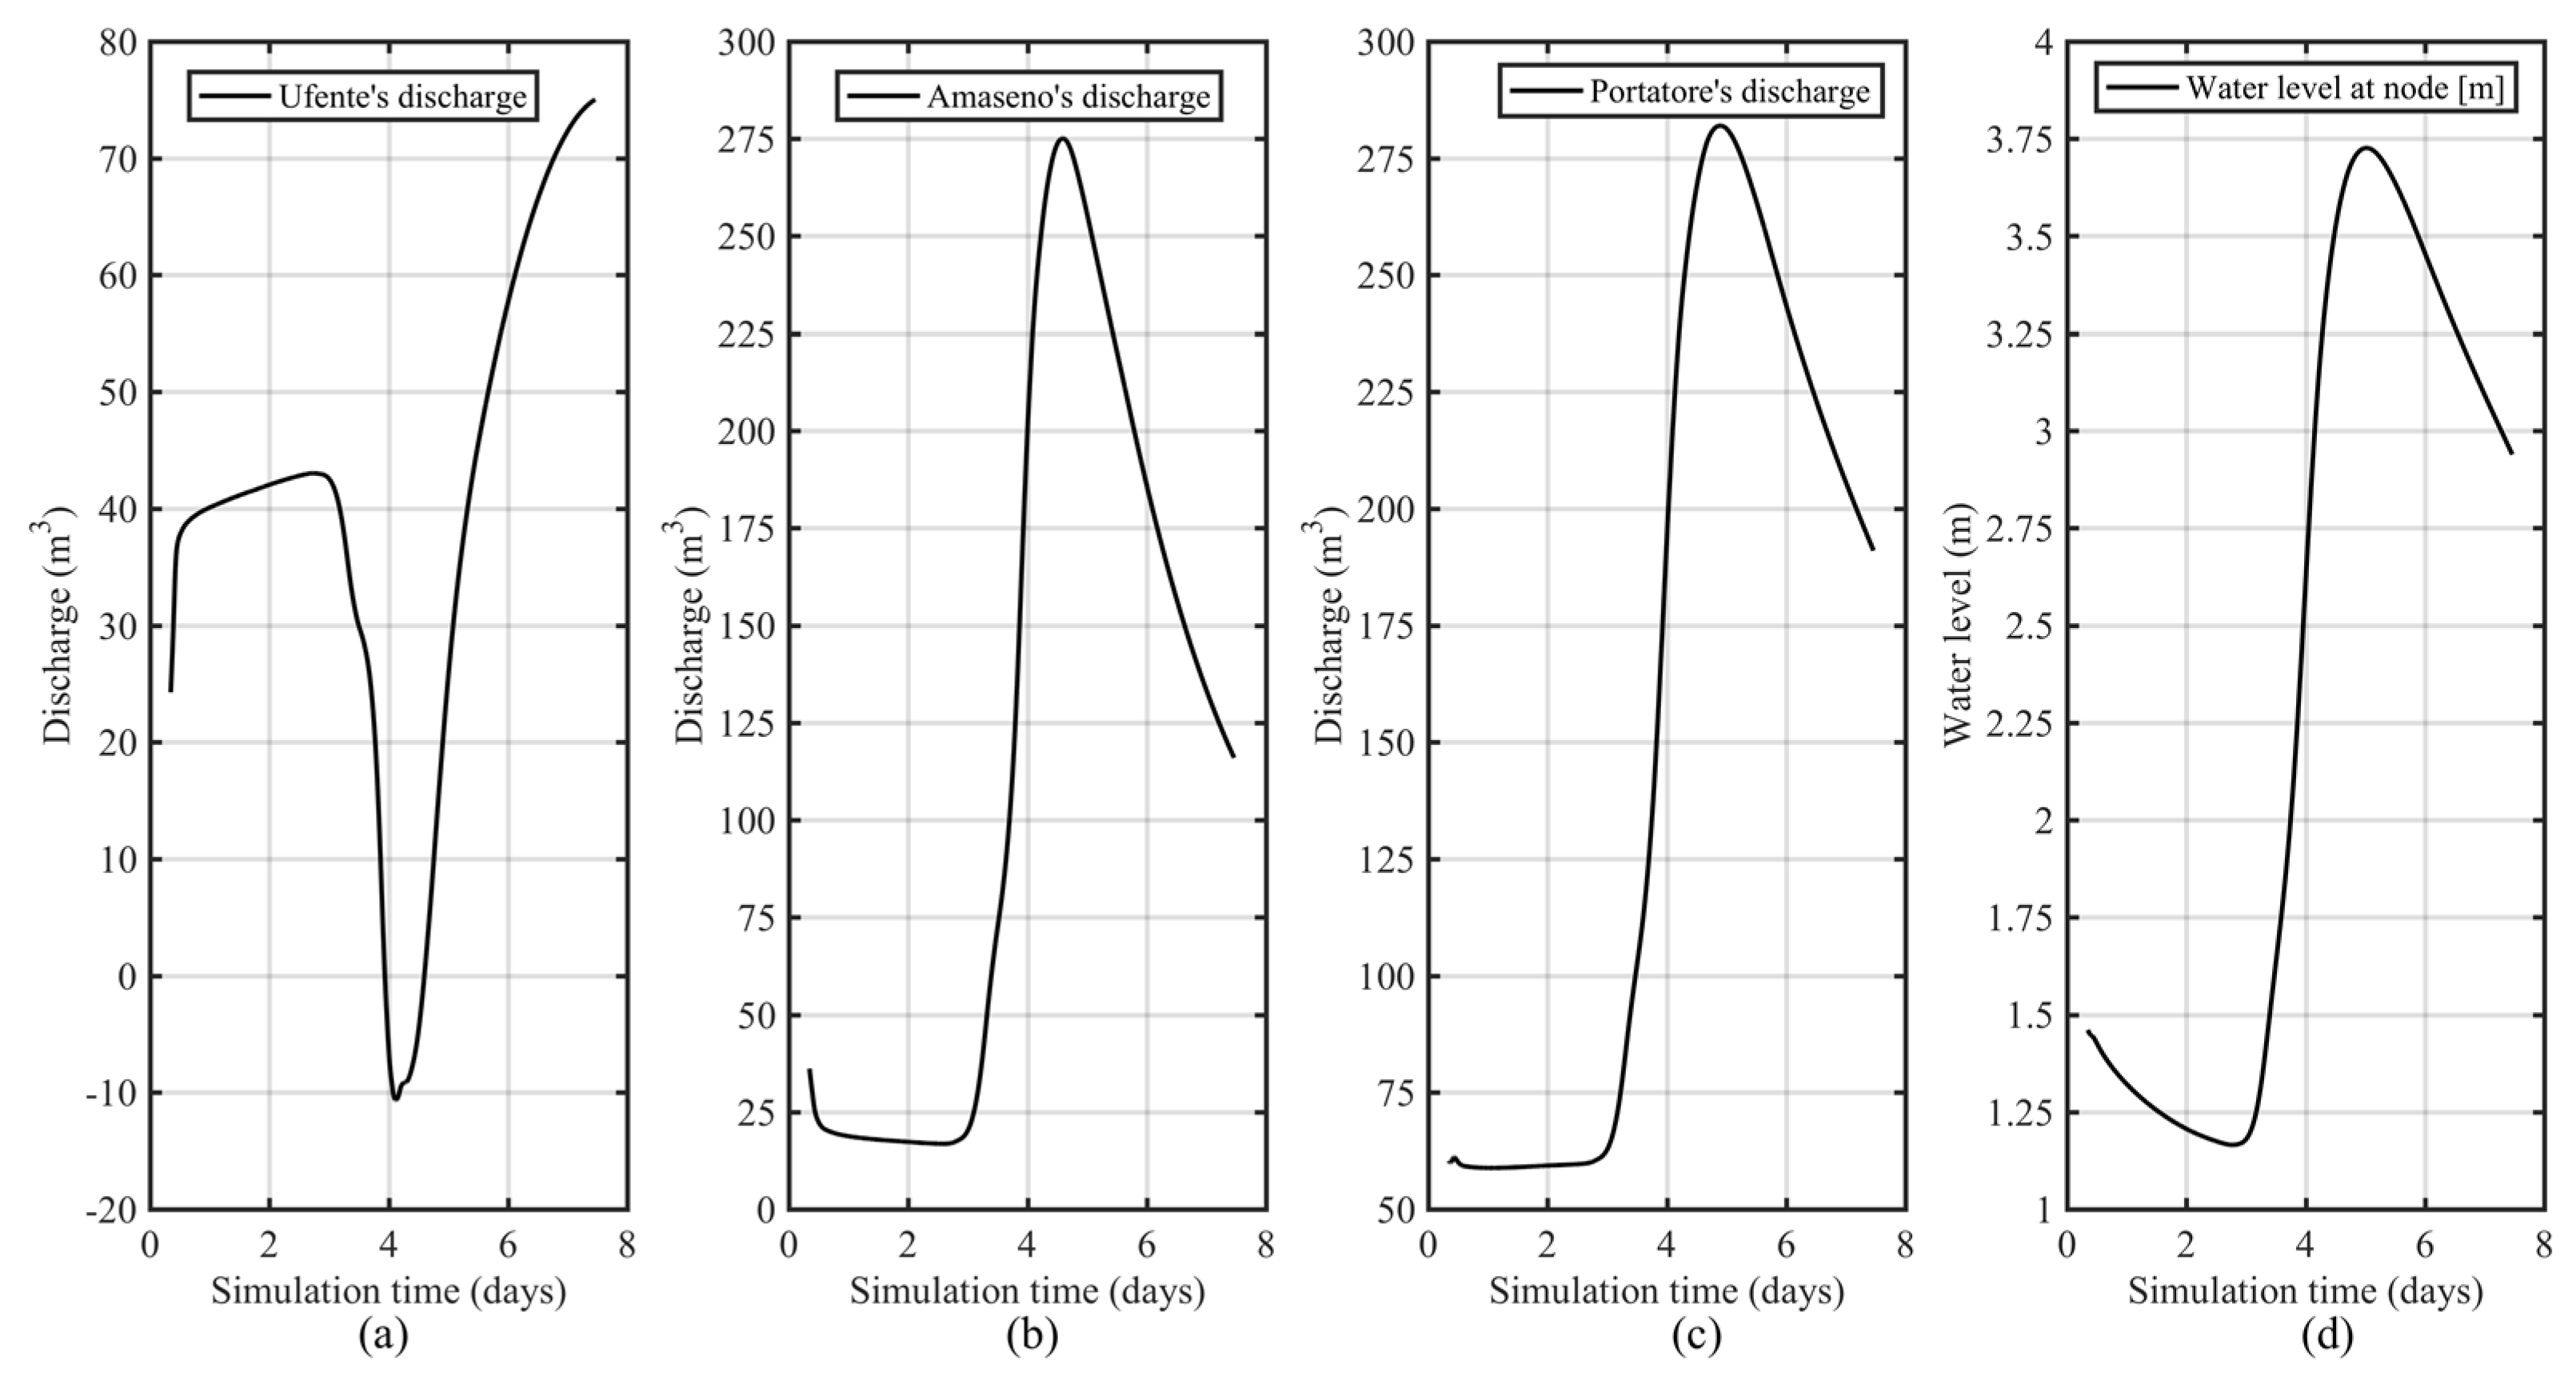
3.1. Hydraulic Model Calibration

As mentioned in Section 2.2.1, in order to limit the computation time needed to run the combined optimization–hydraulic models, the simplified hydraulic model previously described has been constructed. Such a model has a number of parameters that have to be identified: in particular, the length L, average heights h1 and h2, and width l of the ideal channels linking the rivers to the storage areas, in which the different basins have been divided, as well as the runoff coefficient φ of the storage areas and the Strickler’s roughness coefficient Km in the de Saint-Venant equations.
To identify such parameters, a calibration procedure was applied. Such a procedure consists of carrying out a single-objective optimization, through which the parameter values that minimize the sum of squares of the difference between the simulated and observed hydraulic data are identified.
Since the hydraulic network upstream of the Mazzocchio pumping station is hydraulically disconnected by the pumping from the downstream network, calibration of the upstream hydraulic network can be performed separately. For this network, two datasets were selected: the first is the precipitation trend recorded at the Borgo San Michele station, and the second is the pumping discharge trend at the Mazzocchio pumping station. Collected data from five different extreme events that occurred in the past were used to calibrate the hydraulic model. Then, the set of hydraulic parameters in the Mazzocchio area were identified, which minimizes the sum of squares of the difference between the simulated and the recorded pumping discharges during that period. The values of the identified parameters are shown in Table 3. For an extreme event, during the time period 16–20 March 2011, recorded pumping discharge and simulated pumping discharge was compared to validate the model. Figure 8a,b shows the precipitation trend used as input as well as the comparison between the simulated and recorded pumping discharges. Model accuracy was tested using the root mean square error (RMSE) between observed and simulated data, giving ~70% of accuracy.
For the hydraulic network downstream from the pumping station, we used a different heavy rainfall event (from 12–17 December 2008), since this was the only event where there were simultaneous measurements of both free surface level at Ponte Maggiore’s hydrometric station and rainfall amount trend in the Pontinia rain gauge. In this case, the optimization was performed by running the simulation model of both the hydraulic networks forced by the same rainfall amount trend. In this last case, the objective function was formalized using the measured free surface levels at the hydrometric gauge of Ponte Maggiore. The values of the parameters that minimized the objective functions and referred to the ideal channels connecting the storage areas of Linea Pio, Ufente, and Amaseno Rivers are reported in Table 4.

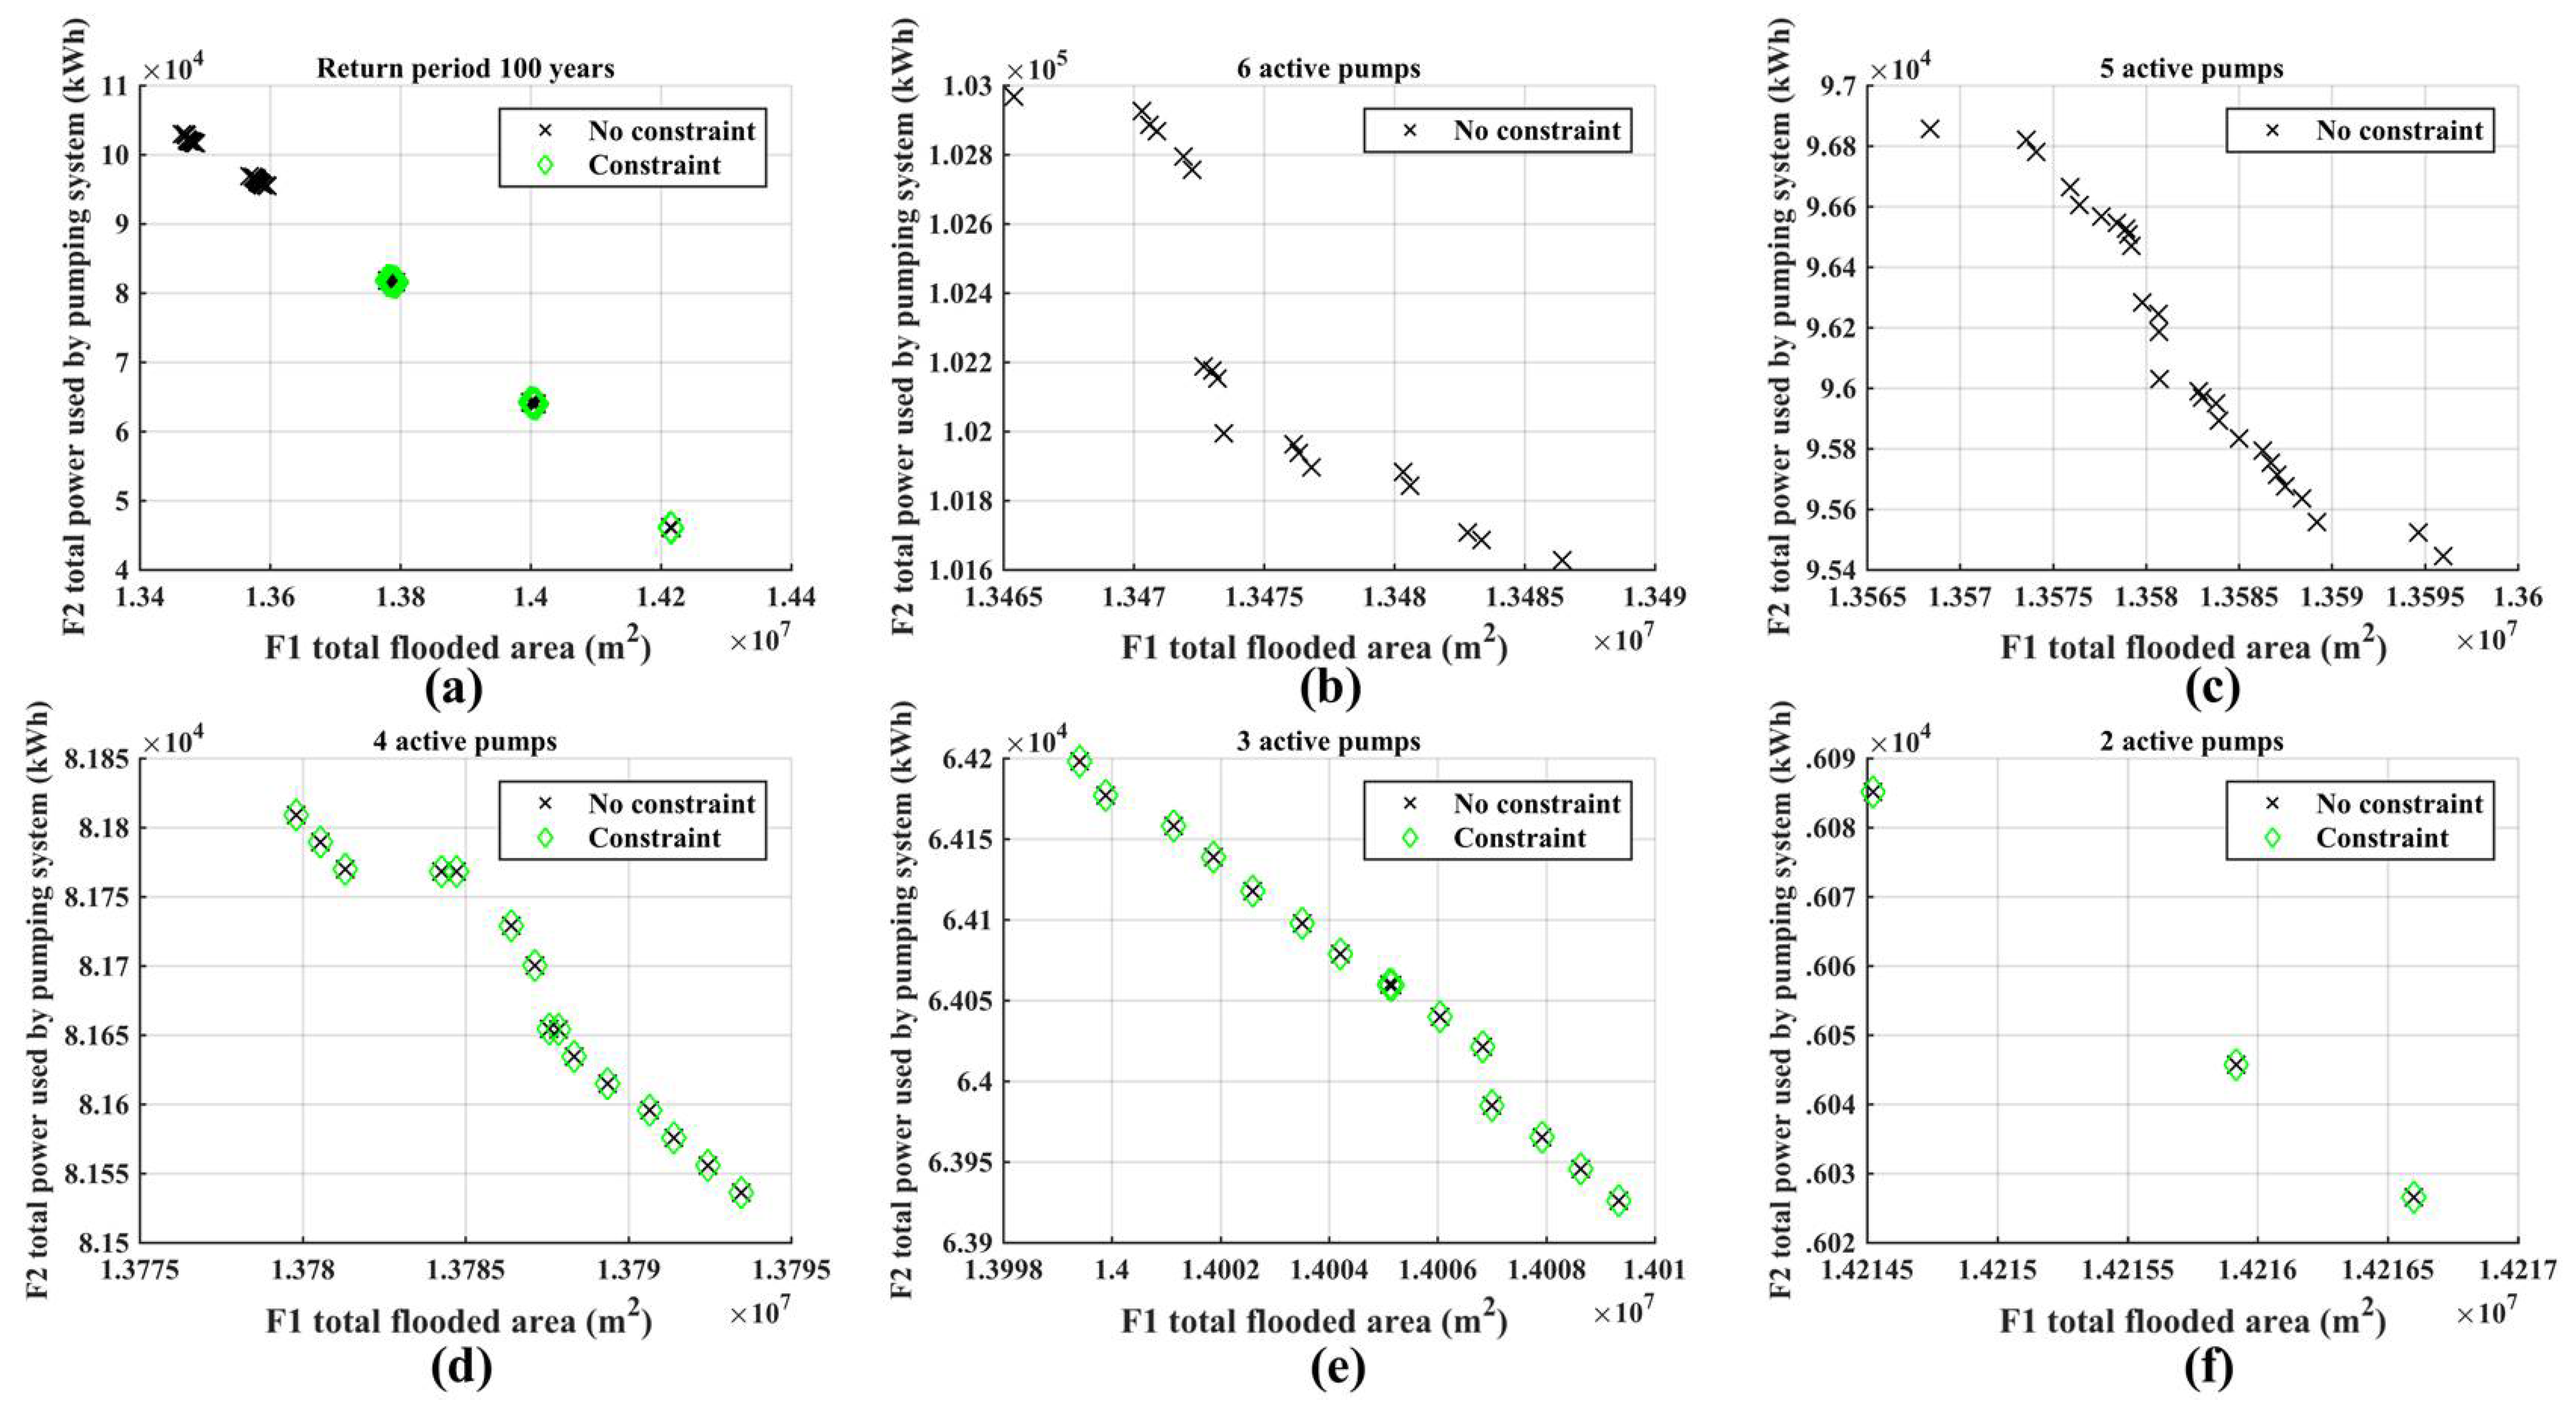
3.2. Optimal Pareto Set for the Event in March 2011

An optimal Pareto curve was calculated by using the rainfall temporal distribution of the event on 16–20 March 2011 as an input (see Figure 8). The main aim is to verify whether and how much the pumping schedule applied during such an event was far from the Pareto front. Furthermore, we also test the process of convergence to the Pareto front of the multiobjective optimization algorithm, finally selecting 100 populations and 20 generations. In the analysis, the discrete levels of free surface H s , regulating the switching on or off of the pumps, was varied within the prefixed range reported in Table 5.
In Figure 9, in the space of the objective functions, the points belonging to the optimal Pareto set as well as the points obtained from the different generations show that 20 generations were sufficient to allow for the convergence of the algorithm at the Pareto front. From Figure 9, it is evident how the two objectives are conflicting, since one objective cannot be improved without sacrificing the other one; i.e., if less pumping power is consumed during the event, a greater surface of the Mazzocchio basin is flooded.
In the figure, the green-filled square refers to the values of the two objective functions obtained assuming the real operative pumping schedule applied during the rainfall event by the pumping station operators. From Figure 9, it is evident that such a point is far from the set of optimal Pareto solutions. This suggests that a more efficient pump schedule could have been identified to manage the extreme event of March 2011 between the solutions belonging to the Pareto front. As suggested by Kurek and Ostfeld [32], we used a procedure based on an utopian solution [33] to identify the optimal solution, circled in blue on Figure 9. Therefore, other comparison methods could be employed, such as game theory techniques [34]. The utopian solution has been identified as minimizing the objective functions:
m =   { m i n { O f 1 } , m i n { O f 2 } }
Then, the span of the front Δ O f i for each of the considered objectives is computed:
Δ O f i = m a x { O f i } m i n { O f i }     i = 1 , 2
Subsequently, the fronts are normalized using their span in the objective space; finally, a solution having the minimum distance to the utopian solution is selected for comparison:
min p Ω { [ ( O f 1 m 1 Δ O f 1 ) 2 + ( O f 2 m 2 Δ O f 2 ) 2 ] 1 2 }
where Ω is the Pareto set resulting from solving the problem (5) or (6) and p is the selected “balanced” solution.

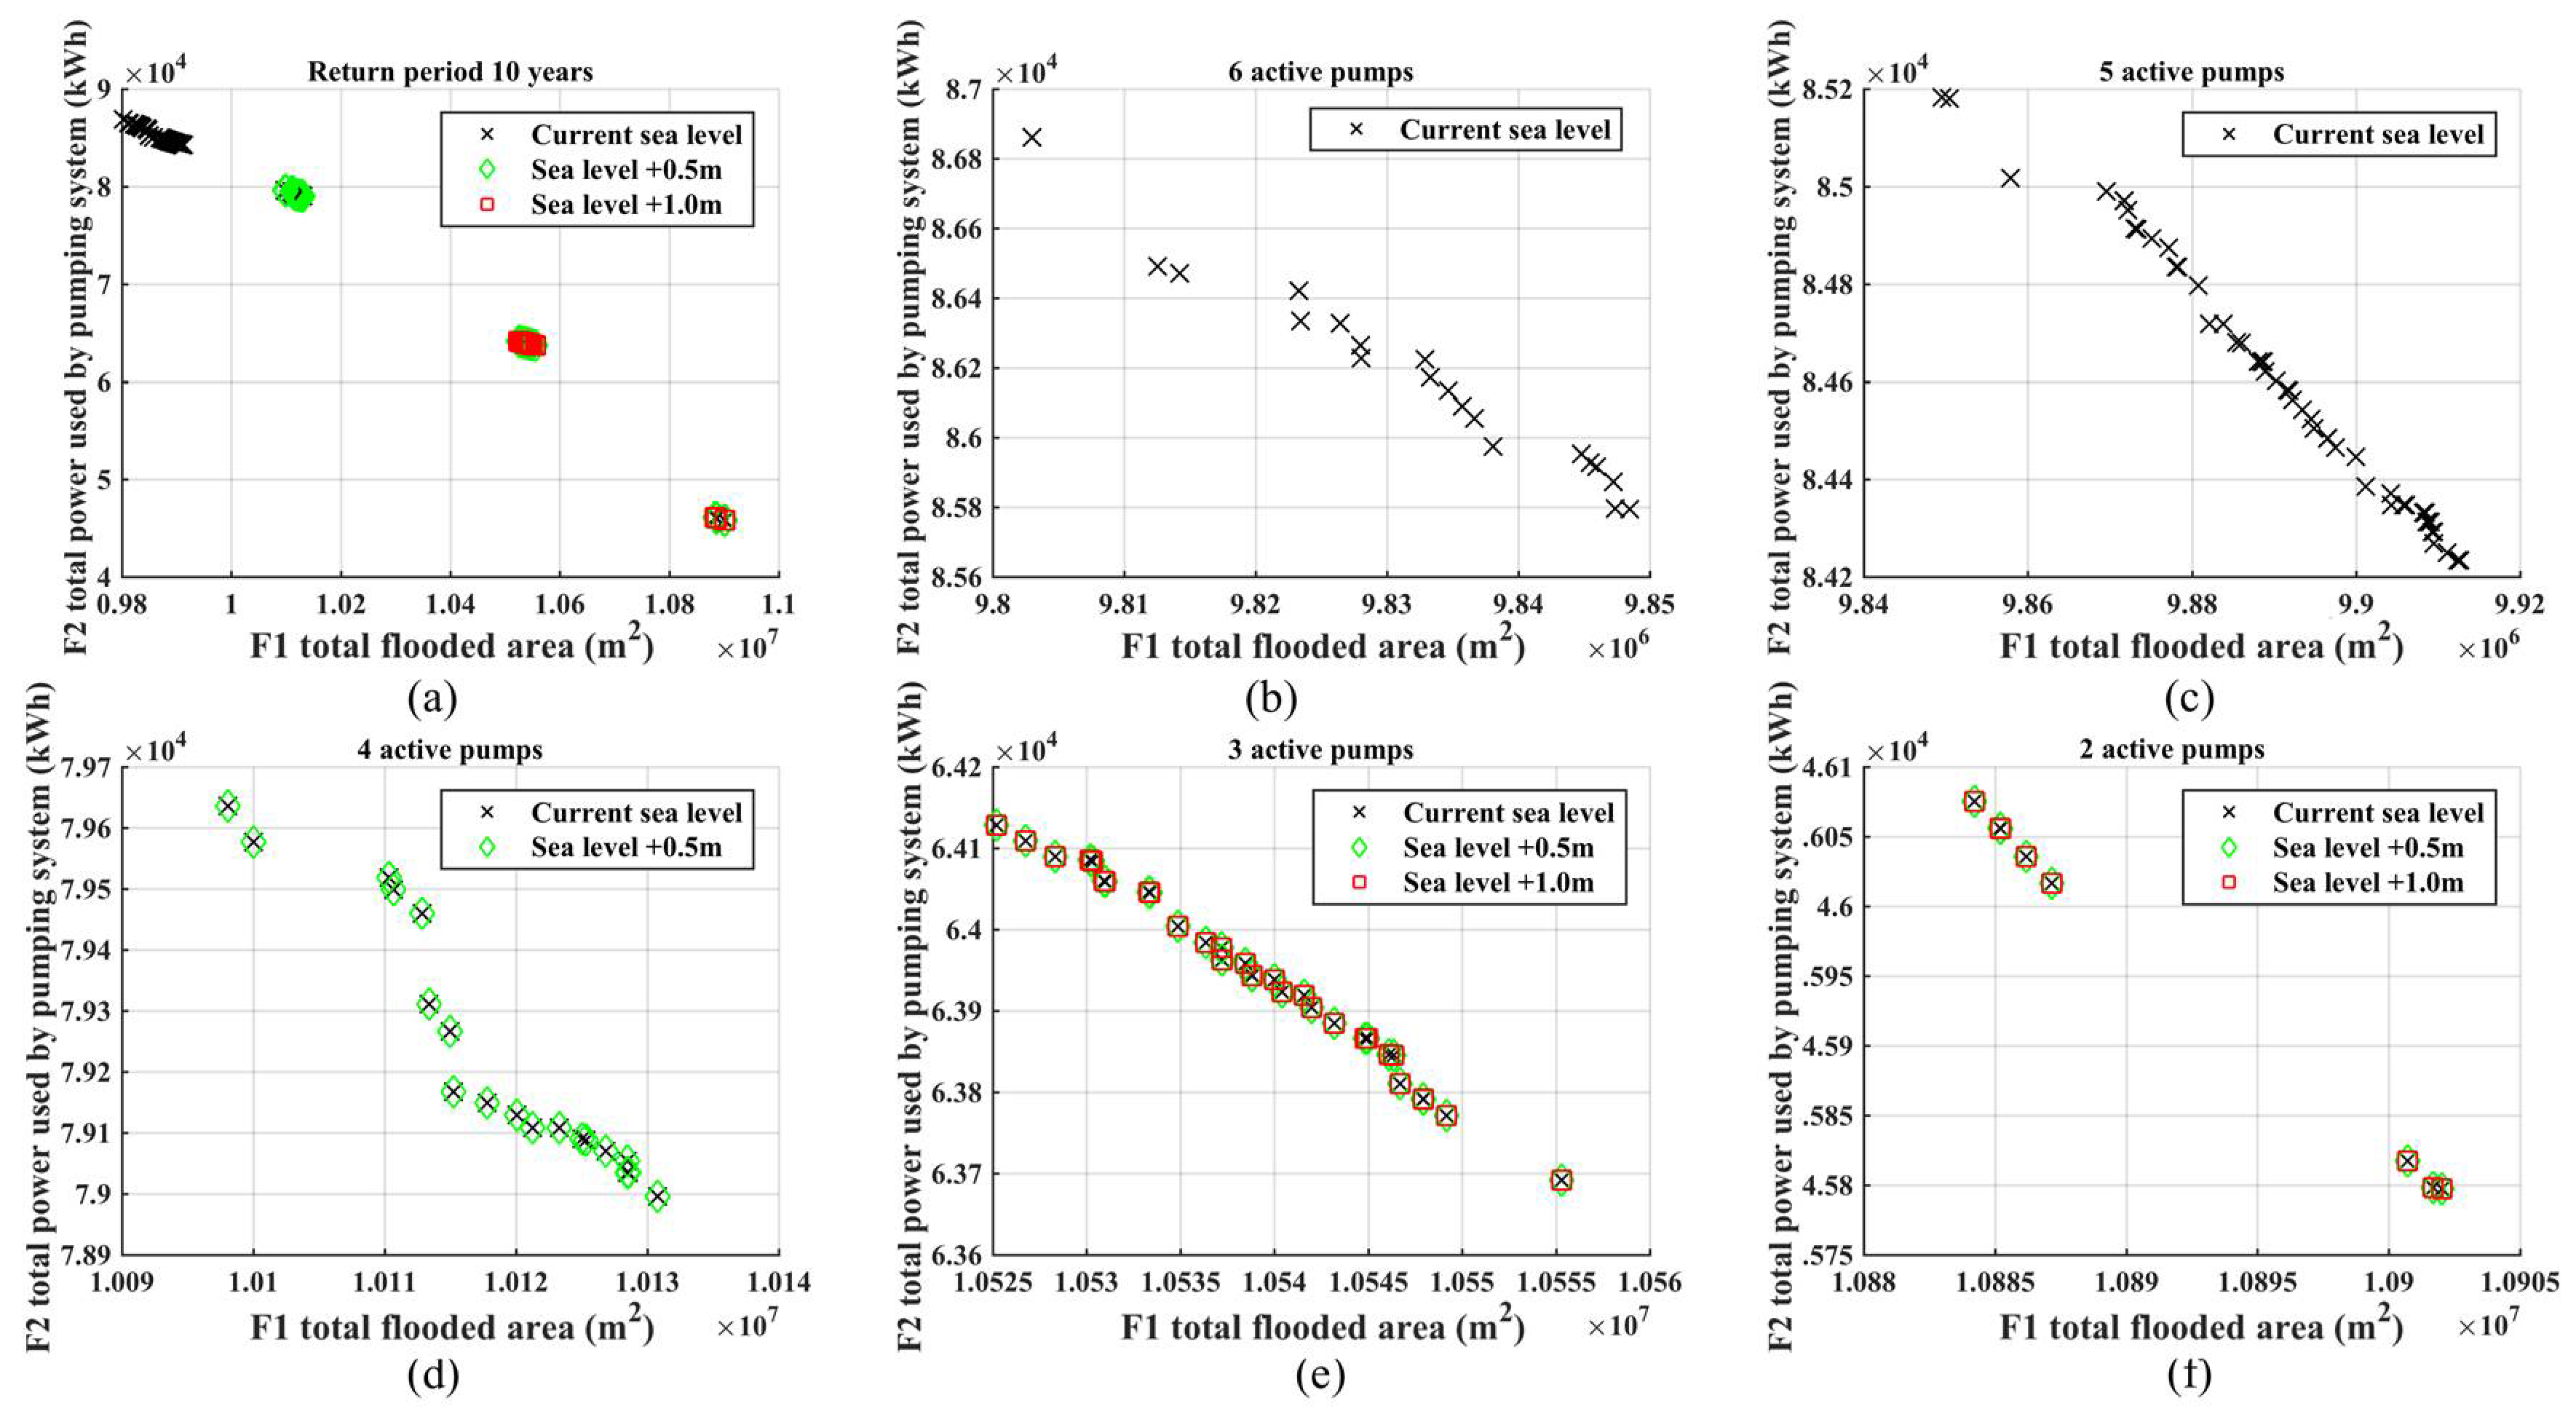
3.3. Sets of Pareto Optimal Solutions for Heavy Rainfall Events and Different Sea Level Rises

Running the combined simulation–optimization model, sets of Pareto optimal solutions were obtained for different design hyetographs associated to prefixed return periods of daily rainfall amount and different mean sea level. In this study, we used daily rainfall amount because previous studies [11,35] have shown that 24-h-long heavy rainfall (with a daily rainfall amount greater than 100 mm) has in the past induced serious flash flooding in the examined site. It should also be underlined that downscaling models aimed to project future changes in the precipitation regime [10] generally refer to the daily rainfall amount, and therefore it is reasonable to use the return period associated to such a quantity. In order to construct the design hyetograph, that is, the artificial rainfall temporal distribution, having a given 24-h rainfall amount return period, the dimensionless approach suggested by Kimura et al. [35], also called the modified ranking method, was used.
Such an approach can be summarized in the following steps:
  • The top ten 24-h independent rainfall events are selected, and the 24-h rainfall amounts arranged in descending order.
  • For each event, the percentage of hourly rainfalls in respect to the 24-h rainfall amount is calculated.
  • For each event, the hourly percentages are arranged in descending order.
  • The peak value among the ratios is placed at the center of the distribution, the second highest value is places in the right side of the center, and then the next highest ratio is placed at the opposite side of the edge, repeating the procedure until the rest of the ratios are all placed in the order.
  • Finally, the ratios are multiplied with the coefficient of the modified ranking method for each extreme rainfall; that coefficient is calculated by dividing the top ten 24-h rainfall amounts by the largest amount.
Using the rainfall data recorded in the Borgo San Michele rain gauge, the dimensionless hyetograph shown in Figure 10 was calculated.
Then, the hyetographs referring to the daily rainfall amount with return periods (TR ) equal to 10 and 100 years were assumed as inputs of the simulation–optimization model, and different sets of Pareto optimal solutions were calculated. While calculating the sets, we impose a further constraint on the maximum number of simultaneously working pumps. In Figure 11, two sets of Pareto optimal solutions are compared for a return period (TR) equal to 100 years.
The first sets refer to the configuration of the system with unlimited flow carrying capacity of the hydraulic network downstream from the pumping station; that is, the Equation (6) constraint was removed. The second sets refer to the case in which the constraint of Equation (6) remains. As expected, within the admissible region defined by the constraints of Equation (6), the Pareto optimal solutions of the two sets are coinciding. The comparison in Figure 11 shows that the constraints of Equation (6) (the free surface levels must be lower than the height of levees in the downstream channel network) significantly reduces the discharge from the Mazzocchio basin that can be pumped into the river Ufente. For the reconstructed hyetograph with a return period (TR) equal to 100 years, no more than four pumps can simultaneously work without violating the constraints. Therefore, due to the limited flow carrying capacity of the hydraulic network downstream from the pumping system, not all the potential of the pumping system to mitigate the flooding in the Mazzocchio basin can be achieved. It would be important to investigate in detail why this occurs.
Figure 12 shows the temporal trend of the flow rates in significant cross sections of the Ufente, Amaseno, and Portatore rivers, close to the Ponte Maggiore node and the free surface level at the junction. These trends refer to the configuration of pump switching on/off corresponding to the Pareto optimal solution in the middle of the range, with a maximum number of working pumps equal to five. From Figure 12, it can be observed that a large increase in discharge, up to 250 m3/s in the Amaseno river, causes a significant increase in the free surface level at the Ponte Maggiore node. Such an increase in the free surface level produces a backwater with a consequent inversion of the flow direction in the Ufente river (as seen by the negative values of the flow rate in the Figure 12), with a consequent blocking effect for the pumped flow rate from Mazzocchio. The consequences of this phenomenon can cause overflows and levee collapse along the Ufente River, which has already occurred in the recent past. From the results of hydraulic simulation, it is evident that the area included in a 3-km radius from Ponte Maggiore’s junction, as seen in Figure 13, is at high risk of embankment overtop.
In Figure 14, the sets of Pareto optimal solutions obtained for a hyetograph with the daily rainfall amount corresponding to a return period of TR = 10 years and referring to three different maximum sea levels (0, +0.5, +1.0 m) at the outlet of the Portatore river are shown. These levels are typical of the shore examined and are due to the combined effects of the astronomical tide, storm, and barometric surge.
As expected, the mean sea level rise modifies the boundary condition at the outlet of the network, causing an increase in free surface level in a larger part of the hydraulic network, making the violation of level constraints more likely. As a consequence of such a violation of level constraints, there is a limitation of the number of the pumps that can simultaneously work. As the figure shows, for a sea level rise equal to 0.5 m, the maximum number of pumps that may simultaneously work is equal to four, while in the case of a sea level rise equal to 1.0 m, no more than three pumps may be used simultaneously.

4. Discussion and Conclusions

This study assessed in the Mazzocchio area whether pumping systems and related channel hydraulic networks are reliable in managing the risks of flooding associated to extreme rainfall events and sea level rise. To conduct this research, we developed and proposed an approach that takes into account the different pumping schedules which are possible at parity of hydrological inputs. To compare the different states of the hydraulic system as a function of the different hydrological inputs, we referred to sets of Pareto optimal solutions calculated by a simulation–optimization model, which combined a multiobjective evolutionary algorithm (the nondominating sorting genetic algorithm, NSGA2) and a hydraulic model in order to satisfy two optimality criteria: minimize the consumption of pumping power and minimize the flooding surface over the Mazzocchio basin. The application to the study case shows how the increase of extreme rainfall amount, as well as sea level rise, affects the reliability and efficiency of the pumping system and hydraulic channel networks to mitigate the flooding in the study site. The use of the model allows identification of pumping system management solutions that are more efficient than those currently used, which are based on empirical assumptions. As seen in Figure 9, the current operating configuration of Mazzocchio’s pumping plant should be more efficient in terms of energy consumption, with significant economic benefit. The Pareto set includes the optimal solutions, then through decision-making techniques, the preferred solutions can be identified. Pareto sets provide decision makers with a fundamental tool for defining and choosing the actions to be taken to reduce the hydraulic risk. For example, improving safety also means increasing costs. At present, the model can be part of a flood management system, included in a model system in which a submodel makes rainfall and sea level forecasts, starting from large-scale meteorological configurations. In this context, the developed model can be part of an optimal control system to manage both the pumping plant and the hydraulic network. The Pareto sets obtained from the optimization model (Figure 11 and Figure 14) show that the hydraulic network will not be able to manage the increase in river flows due to increasingly intense rainfall and rising sea level, phenomena generated by climate changes. Therefore, the study suggests that in order to exploit the entire pumping capacity of the plant to mitigate the flooding in the Mazzocchio area, the flow carrying capacity of the downstream hydraulic channel network should be increased by designing new interventions; for instance, reshaping of the riverbeds and levees and designing structures for flow diversion or compensating–balancing reservoirs; all of those measures should be designed using a multiobjective optimization approach in order to minimize construction costs, but guaranteeing adequate protection from future extreme events. The identification of such technical solutions is beyond the goal of this paper, but the simulation–optimization model proposed here could still be used in order to explore such flood risk intervention strategies. This study could be further developed by taking into account the uncertainty in future projections of heavy rainfall and sea level rise, as suggested by Woodward et al. [25]. It is possible to take into account future uncertainties regarding sea level and rainfall amount and duration with the help of flexible sets of defense strategies linked to predefined situations. To assess such uncertainties, we are developing rainfall downscaling models which use General Circulation Models (GCM) ensemble simulations as inputs within a more general project aimed to assess and to identify possible strategies to preserve the coastal areas from the negative effect of climate change. Sea level rise will also be calculated using hydraulic models that will simulate storm surges caused by waves and wind, thus providing more accurate values.

Author Contributions

Conceptualization, F.C., A.D.B.T. and F.R.C.; Methodology, F.C., A.D.B.T. and F.R.C.; Software, F.C., A.D.B.T. and F.R.C.; Validation, F.C., A.D.B.T. and F.R.C.; Formal Analysis, F.C., A.D.B.T. and F.R.C.; Investigation, F.C., A.D.B.T. and F.R.C.; Resources, F.C., A.D.B.T. and F.R.C.; Data Curation, F.C., A.D.B.T. and F.R.C.; Writing-Original Draft Preparation, F.C., A.D.B.T. and F.R.C.; Writing-Review & Editing, F.C., A.D.B.T. and F.R.C.; Visualization, F.C., A.D.B.T. and F.R.C.; Supervision, F.C.; Project Administration, F.C.; Funding Acquisition, F.C.

Funding

This research was funded by Consorzio di Bonifica dell’Agro Pontino (APRC).

Conflicts of Interest

The authors declare no conflict of interest

References

  1. Alpert, S.; Ben-Gai, P.; Baharad, T.; Benjamini, A.; Yekutieli, Y.; Colacino, D.; Michaelides, M. The paradoxical increase of Mediterranean extreme daily rainfall in spite of decrease in total values. Geophys. Res. Lett. 2002, 29, 1536. [Google Scholar] [CrossRef]
  2. Zollo, A.L.; Rillo, V.; Bucchignani, E.; Montesarchio, M.; Mercogliano, P. Extreme temperature and precipitation events over Italy: Assessment of high-resolution simulations with COSMO-CLM and future scenarios. Int. J. Climatol. 2016, 36, 987–1004. [Google Scholar] [CrossRef]
  3. Rajczak, J.; Pall, P.; Schär, C. Projections of extreme precipitation events in regional climate simulations for Europe and the Alpine Region. J. Geophys. Res. 2013, 118, 3610–3626. [Google Scholar] [CrossRef] [Green Version]
  4. Gao, X.; Pal, J.S.; Giorgi, F. Projected changes in mean and extreme precipitation over the Mediterranean region from a high resolution double nested RCM simulation. Geophys. Res. Lett. 2006, 33, 2–5. [Google Scholar] [CrossRef]
  5. Antonioli, F.; Anzidei, M.; Amorosi, A.; Lo Presti, V.; Mastronuzzi, G.; Deiana, G.; De Falco, G.; Fontana, A.; Fontolan, G.; Lisco, S.; et al. Sea-level rise and potential drowning of the Italian coastal plains: Flooding risk scenarios for 2100. Quat. Sci. Rev. 2017, 158, 29–43. [Google Scholar] [CrossRef]
  6. Galassi, G.; Spada, G. Sea-level rise in the Mediterranean Sea by 2050: Roles of terrestrial ice melt, steric effects and glacial isostatic adjustment. Glob. Planet. Chang. 2014, 123, 55–66. [Google Scholar] [CrossRef]
  7. Lambeck, K.; Antonioli, F.; Anzidei, M.; Ferranti, L.; Leoni, G.; Scicchitano, G.; Silenzi, S. Sea level change along the Italian coast during the Holocene and projections for the future. Quat. Int. 2011, 232, 250–257. [Google Scholar] [CrossRef]
  8. Nicklow, J.; Reed, P.; Savic, D.; Dessalegne, T.; Harrell, L.; Chan-Hilton, A.; Karamouz, M.; Minsker, B.; Ostfeld, A.; Singh, A.; et al. State of the Art for Genetic Algorithms and Beyond in Water Resources Planning and Management. J. Water Resour. Plan. Manag. 2010, 136, 412–432. [Google Scholar] [CrossRef]
  9. Merz, B.; Aerts, J.; Arnbjerg-Nielsen, K.; Baldi, M.; Becker, A.; Bichet, A.; Bloschl, G.; Bouwer, L.M.; Brauer, A.; Cioffi, F.; et al. Floods and climate: Emerging perspectives for flood risk assessment and management. Nat. Hazards Earth Syst. Sci. 2014, 2, 1921–1942. [Google Scholar] [CrossRef] [Green Version]
  10. Cioffi, F.; Conticello, F.; Lall, U. Projecting changes in Tanzania rainfall for the 21st century. Int. J. Climatol. 2016, 36, 4297–4314. [Google Scholar] [CrossRef]
  11. Cioffi, F.; Conticello, F.; Lall, U.; Marotta, L.; Telesca, V. Large scale climate and rainfall seasonality in a Mediterranean Area: Insights from a non-homogeneous Markov model applied to the Agro-Pontino plain. Hydrol. Process. 2017, 31, 668–686. [Google Scholar] [CrossRef]
  12. Marler, R.T.; Arora, J.S. Survey of multi-objective optimization methods for engineering. Struct. Multidiscip. Optim. 2004, 26, 369–395. [Google Scholar] [CrossRef]
  13. Cioffi, F.; Gallerano, F. Multi-objective analysis of dam release flows in rivers downstream from hydropower reservoirs. Appl. Math. Model. 2012, 36, 2868–2889. [Google Scholar] [CrossRef]
  14. Yazdi, J.; Yoo, D.G.; Kim, J.H. Comparative study of multi-objective evolutionary algorithms for hydraulic rehabilitation of urban drainage networks. Urban Water J. 2017, 14, 483–492. [Google Scholar] [CrossRef]
  15. Lin, Y.H.; Chen, Y.P.; Der Yang, M.; Su, T.C. Multiobjective Optimal Design of Sewerage Rehabilitation by Using the Nondominated Sorting Genetic Algorithm-II. Water Resour. Manag. 2015, 30, 487–503. [Google Scholar] [CrossRef]
  16. Yazdi, J.; Choi, H.S.; Kim, J.H. A methodology for optimal operation of pumping stations in urban drainage systems. J. Hydro-Environ. Res. 2014, 11, 101–112. [Google Scholar] [CrossRef]
  17. Moradi-Jalal, M.; Karney, B.W. Optimal design and operation of irrigation pumping stations using mathematical programming and Genetic Algorithm (GA). J. Hydraul. Res. 2008, 46, 237–246. [Google Scholar] [CrossRef]
  18. Makaremi, Y.; Haghighi, A.; Ghafouri, H.R. Optimization of Pump Scheduling Program in Water Supply Systems Using a Self-Adaptive NSGA-II; a Review of Theory to Real Application. Water Resour. Manag. 2017, 31, 1283–1304. [Google Scholar] [CrossRef]
  19. Lewis, A.; Randall, M. Solving multi-objective water management problems using evolutionary computation. J. Environ. Manag. 2017, 204, 179–188. [Google Scholar] [CrossRef] [PubMed]
  20. Ahmadi, M.; Haddad, O.B.; Loáiciga, H.A. Adaptive Reservoir Operation Rules Under Climatic Change. Water Resour. Manag. 2014, 29, 1247–1266. [Google Scholar] [CrossRef]
  21. Jahandideh-Tehrani, M.; Bozorg Haddad, O.; Loáiciga, H.A. Hydropower Reservoir Management Under Climate Change: The Karoon Reservoir System. Water Resour. Manag. 2014, 29, 749–770. [Google Scholar] [CrossRef]
  22. François, B.; Hingray, B.; Creutin, J.D.; Hendrickx, F. Estimating Water System Performance Under Climate Change: Influence of the Management Strategy Modeling. Water Resour. Manag. 2015, 29, 4903–4918. [Google Scholar] [CrossRef]
  23. Schardong, A.; Simonovic, S.P. Multi-Objective Evolutionary Algorithms for Water Resource Management; The University of Western Ontario: Ontario, ON, Canada, 2011. [Google Scholar]
  24. Van der Pol, T.D.; van Ierland, E.C.; Gabbert, S.; Weikard, H.P.; Hendrix, E.M.T. Impacts of rainfall variability and expected rainfall changes on cost-effective adaptation of water systems to climate change. J. Environ. Manag. 2015, 154, 40–47. [Google Scholar] [CrossRef] [PubMed]
  25. Woodward, M.; Kapelan, Z.; Gouldby, B. Adaptive flood risk management under climate change uncertainty using real options and optimization. Risk Anal. 2014, 34, 75–92. [Google Scholar] [CrossRef] [PubMed] [Green Version]
  26. Cioffi, F.; Gallerano, F. A two-dimensional self-adaptive hydrodynamic scheme for the assessment of the effects of structures on flooding phenomena in river basins. River Res. Appl. 2003, 19, 1–26. [Google Scholar] [CrossRef]
  27. MacManus, K.; Orton, P.M.; Cioffi, F.; Conticello, F.; Hall, T.M.; Lall, U.; Bloomberg, A.F.; MacManus, K. Flood hazard assessment from storm tides, rain and sea level rise for a tidal river estuary. Nat. Hazards 2018, 1–29. [Google Scholar] [CrossRef]
  28. Goutal, N.; Lacombe, J.; Zaoui, F. MASCARET: A 1-D open-source software for flow hydrodynamic and water quality in open channel networks. In River Flow; Taylor & Francis Group: London, UK, 2012; pp. 1169–1174. [Google Scholar]
  29. Deb, K.; Agrawal, S.; Pratap, A.; Meyarivan, T. A fast elitist non-dominated sorting genetic algorithm for multi-objective optimization: NSGA-II. In Proceedings of the International Conference on Parallel Problem Solving From Nature 2000, Paris, France, 18–20 September 2000; pp. 849–858. [Google Scholar]
  30. Goldberg, D.E.; Deb, K. A Comparative Analysis of Selection Schemes Used in Genetic Algorithms. Found. Genet. Algorithms 1991, 1, 69–93. [Google Scholar] [Green Version]
  31. Deb, K.; Agrawal, R.B. Simulated Binary Crossover for Continuous Search Space. Complex Syst. 1994, 9, 1–34. [Google Scholar]
  32. Wojciech Kurek, A.O. Multi-objective optimization of water quality, pumps operation, and storage sizing of water distribution systems. J. Environ. Manag. 2013, 115, 189–197. [Google Scholar] [CrossRef] [PubMed]
  33. Miettinen, K. Nonlinear Multiobjective Optimization; Kluwer Academic Publishers: Boston, MA, USA, 1999. [Google Scholar]
  34. Raquel, S.; Ferenc, S.; Emery, C.; Abraham, R. Application of game theory for a groundwater conflict in Mexico. J. Environ. Manag. 2007, 84, 560–571. [Google Scholar] [CrossRef] [PubMed]
  35. Kimura, N.; Tai, A.; Chiang, S.; Wei, H.P.; Su, Y.F.; Cheng, C.T.; Kitoh, A. Hydrological flood simulation using a design hyetograph created from extreme weather data of a high-resolution atmospheric general circulation model. Water 2014, 6, 345–366. [Google Scholar] [CrossRef]
Figure 1. (a) Hydraulic network and basins of the study site. (b) Mazzocchio’s basin ground elevation.
Water 10 00820 g001
Figure 2. Hydraulic pumps in Mazzocchio’s pumping station.
Water 10 00820 g002
Figure 3. Intensity–duration curve from hourly rainfall records at the rain gauge located in Borgo San Michele station (Lat. 41°25′12′′ N Lon. 12°58′12′′ E).
Water 10 00820 g003
Figure 4. Optimization model’s flowchart.
Water 10 00820 g004
Figure 5. Sketch of hydraulic model.
Water 10 00820 g005
Figure 6. Storage areas partition of the Mazzocchio basin.
Water 10 00820 g006
Figure 7. Sketch of the link between a river and a storage cell by an ideal channel. Hc is the bottom elevation of the ideal channel, h1 and h2 are free surface elevation in the river and in the storage cell respectively.
Water 10 00820 g007
Figure 8. (a) Comparison between simulated and observed pumping discharges. (b) Rainfall intensity trend during the extreme event in March 2011.
Water 10 00820 g008
Figure 9. Pareto front obtained for the rainfall trend of the event that occurred in March 2011.
Water 10 00820 g009
Figure 10. Design hyetograph.
Water 10 00820 g010
Figure 11. Pareto sets for daily rainfall amount with return period of 100 years. (a) Pareto set with all the pumping configurations. (b) Optimal Pareto set with a maximum of six pumps simultaneously working; and with (c) maximum of five pumps; (d) maximum of four pumps; (e) maximum of three pumps; (f) maximum of two pumps.
Water 10 00820 g011
Figure 12. River discharges and free surface level trends at Ponte Maggiore’s junction: rivers (a) Ufente, (b) Amaseno, and (c) Portatore, and (d) water level at node.
Water 10 00820 g012
Figure 13. High risk of embankment overtop near Ponte Maggiore’s junction using a 100-year return period hyetograph as the boundary condition for the hydraulic simulation.
Water 10 00820 g013
Figure 14. Pareto sets for a likely return period of 10 years. (a) Pareto set with all the pumping configurations. (b) Optimal Pareto set with a maximum of six pumps simultaneously working; and with (c) maximum of five pumps; (d) maximum of four pumps; (e) maximum of three pumps; and (f) maximum of two pumps.
Water 10 00820 g014
Table 1. Starting and stopping levels for each pump (data provided by Agro Pontino Reclamation Consortium (APRC)).
Pump no. 1Pump no. 2Pump no. 3Pump no. 4Pump no. 5Pump no. 6
Starting level
(Meters above sea level)
−2.15−2.05−1.95−1.85−1.7−1.6
Stopping level
(Meters above sea level)
−2.5−2.4−2.3−2.2−2.0−1.95
Table 2. Hydraulic characteristics of channels, rivers, and basins (data provided by Agro Pontino Reclamation Consortium (APRC)).
RiversSlope ‰
(m for 1 km)
Size of Cross Section:
Max Width–Max Height (m)
Shape of Cross SectionLength (m)Basin Extension (Km2)
Selcella0.145–5Symmetrical Trapezoidal11,25097.659
Ufente0.1630–4Symmetrical Trapezoidal14,75075.1
Linea Pio0.1537.2–4.5Symmetrical Trapezoidal16,00099.561
Amaseno0.45109–11.75Symmetrical Trapezoidal80,940628.53
Portatore0.130–4.85Symmetrical Trapezoidal570034.864
Table 3. Hydraulic parameters after the calibration of the model upstream from the Mazzocchio pumping system (data provided by Agro Pontino Reclamation Consortium (APRC)).
Link no. 1Link no. 2Link no. 3Link no. 4Link no. 5Link no. 6Link no. 7
Channel mean bottom elevation (meters above sea level)−2.67−2.03−1.04−1.35−1.75−2.3−0.58
Channel width (m)66666620
Channel length1000100014001400140014007000
Roughness (Strickler)40404040404030
Table 4. Hydraulic parameters after the calibration of the model downstream from the Mazzocchio pumping system.
Amaseno RiverLinea Pio ChannelUfente River
Channel mean bottom elevation Hc (meters above sea level)4.50.03.28
Channel width l (m)602010
Channel length L (m)10,60018,0005500
Roughness (Strickler)304030
Table 5. Variation range for activation levels.
Pump no. 1Pump no. 2Pump no. 3Pump no. 4Pump no. 5Pump no. 6
Start level
(meters above sea level)
−2.15−2.05−1.95−1.85−1.7−1.6
Variation range
(meters above sea level)
Min −2.40
Max −2.10
Min −2.09
Max 2.00
Min −1.99
Max −1.90
Min −1.89
Max −1.75
Min −1.74
Max −1.50
Min −1.49
Max −1.00

